Embed Size (px)
Citation preview
Vlada StankūnienėAušra Maslauskaitė
Marė BaublytėDemographic Demographic RResearch Center, ISResearch Center, ISR
Lithuania Lithuania
International conference “Changing Family:International conference “Changing Family:Demographic Challenges for Social Policy”,Demographic Challenges for Social Policy”, 28-29 November 2007, Moscow 28-29 November 2007, Moscow
DIFFERENCES IN PARTNERSHIP DIFFERENCES IN PARTNERSHIP AND FAMILY FORMATION AND FAMILY FORMATION
IN LITHUANIAIN LITHUANIA
Research was funded by the Lithuanian Science and Studies Foundation
Data
Gender and Generations Survey_Lithuania, 2006
Population Census_Lithuania, 2001
Presentation outline
Marital/partnership status: changes, differencies Partnership/family formation: strategy, differences Turning point to new family formation pattern Conclusions
Decrease of marriage rates
Postponement and “ageing” of marriage
Spread of cohabitation
Increase of never married
Decrease of fertility, etc…
Family transformation
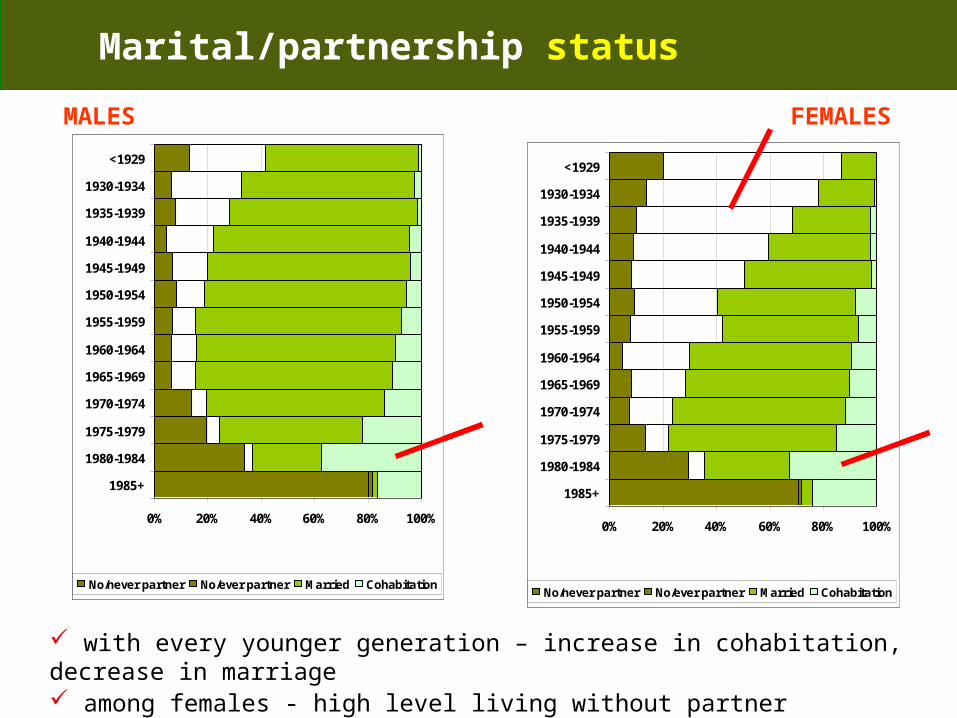
Marital/partnership status
MALES FEMALES
with every younger generation – increase in cohabitation, decrease in marriage among females - high level living without partner
0% 20% 40% 60% 80% 100%
1985+
1980-1984
1975-1979
1970-1974
1965-1969
1960-1964
1955-1959
1950-1954
1945-1949
1940-1944
1935-1939
1930-1934
<1929
No/never partner No/ever partner Married Cohabitation
0% 20% 40% 60% 80% 100%
1985+
1980-1984
1975-1979
1970-1974
1965-1969
1960-1964
1955-1959
1950-1954
1945-1949
1940-1944
1935-1939
1930-1934
<1929
No/never partner No/ever partner Married Cohabitation
0% 20% 40% 60% 80% 100%
1985+
1980-1984
1975-1979
1970-1974
1965-1969
1960-1964
1955-1959
1950-1954
1945-1949
1940-1944
1935-1939
1930-1934
<1929
No/never partner No/ever partner Married Cohabitation
0% 20% 40% 60% 80% 100%
1985+
1980-1984
1975-1979
1970-1974
1965-1969
1960-1964
1955-1959
1950-1954
1945-1949
1940-1944
1935-1939
1930-1934
<1929
No/never partner No/ever partner Married Cohabitation
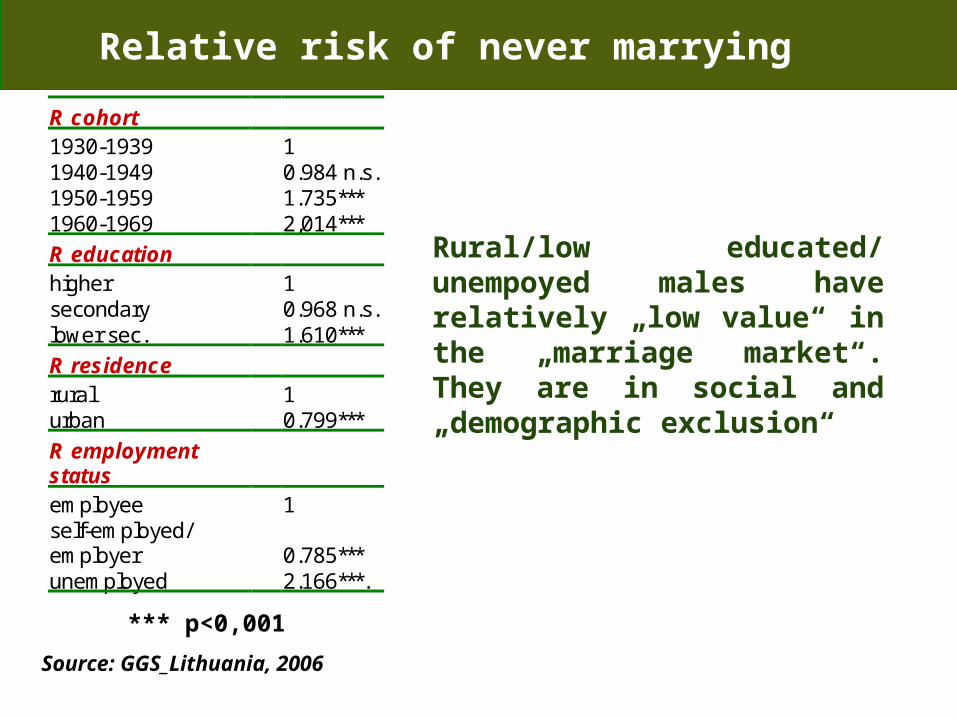
R cohort 1930-1939 1 1940-1949 0.984 n.s. 1950-1959 1.735*** 1960-1969 2,014***
R education higher 1 secondary 0.968 n.s. lower sec. 1.610***
R residence rural 1 urban 0.799***
R employment status employee 1 self-employed/ employer 0.785*** unemployed 2.166***.
Relative risk of never marrying MALES
*** p<0,001
Source: GGS_Lithuania, 2006
Rural/low educated/ unempoyed males have relatively „low value“ in the „marriage market“. They are in social and „demographic exclusion“
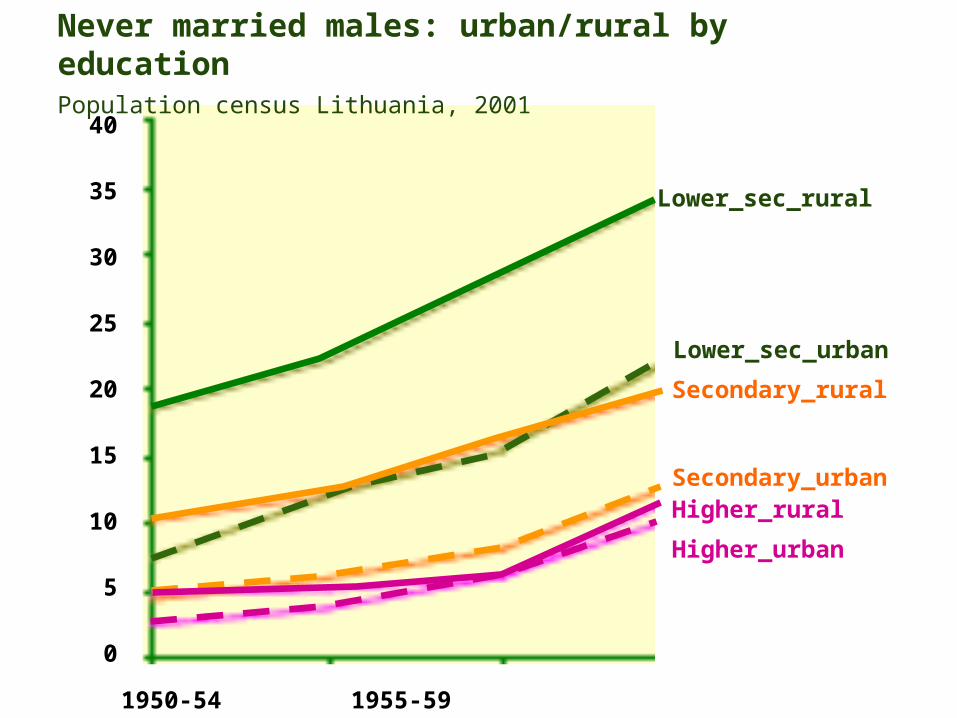
Lower_sec_rural
Lower_sec_urban
Secondary_rural
Secondary_urbanHigher_rural
Higher_urban
1950-54 1955-59 1960-64 1965-69
40
35 30
25 20
15 10
5
0
Never married males: urban/rural by educationPopulation census Lithuania, 2001
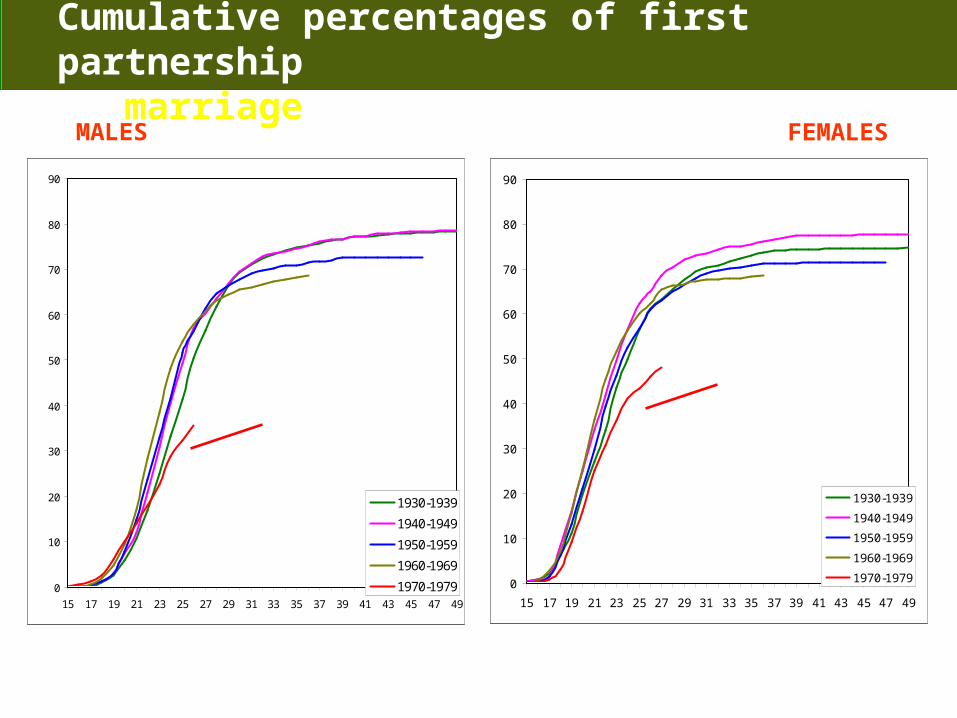
Cumulative percentages of first partnershipas marriageMALES FEMALES
0
10
20
30
40
50
60
70
80
90
15 17 19 21 23 25 27 29 31 33 35 37 39 41 43 45 47 49
1930-1939
1940-1949
1950-1959
1960-1969
1970-1979 0
10
20
30
40
50
60
70
80
90
15 17 19 21 23 25 27 29 31 33 35 37 39 41 43 45 47 49
1930-1939
1940-1949
1950-1959
1960-1969
1970-19790
10
20
30
40
50
60
70
80
90
15 17 19 21 23 25 27 29 31 33 35 37 39 41 43 45 47 49
1930-1939
1940-1949
1950-1959
1960-1969
1970-1979 0
10
20
30
40
50
60
70
80
90
15 17 19 21 23 25 27 29 31 33 35 37 39 41 43 45 47 49
1930-1939
1940-1949
1950-1959
1960-1969
1970-1979
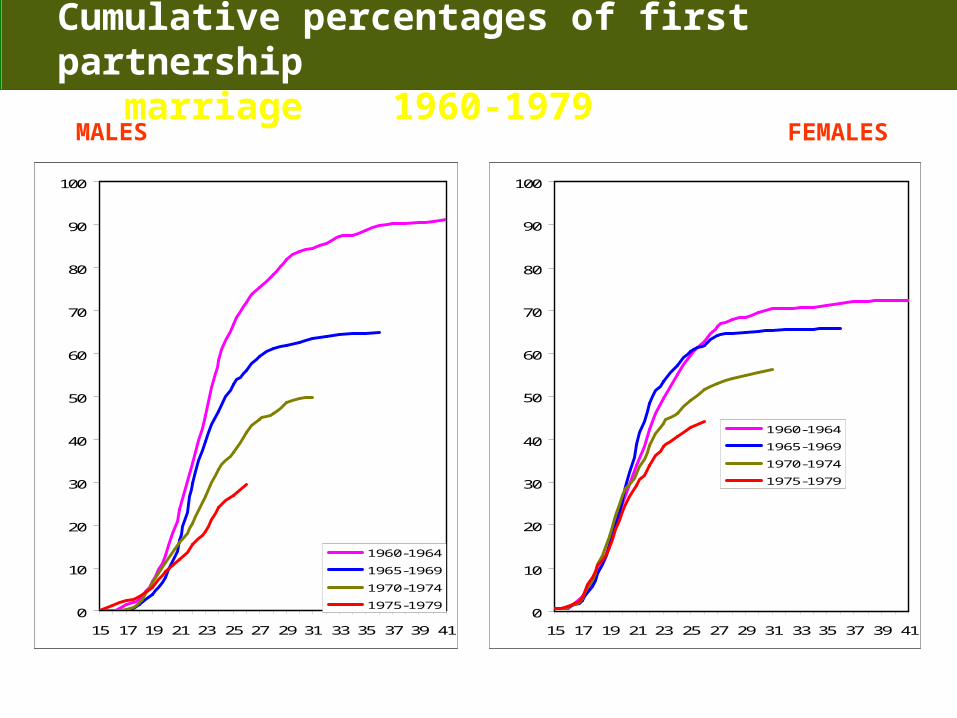
Cumulative percentages of first partnershipas marriage 1960-1979MALES FEMALES
0
10
20
30
40
50
60
70
80
90
100
15 17 19 21 23 25 27 29 31 33 35 37 39 41
1960-1964
1965-1969
1970-1974
1975-19790
10
20
30
40
50
60
70
80
90
100
15 17 19 21 23 25 27 29 31 33 35 37 39 41
1960-1964
1965-1969
1970-1974
1975-1979
0
10
20
30
40
50
60
70
80
90
100
15 17 19 21 23 25 27 29 31 33 35 37 39 41
1960-1964
1965-1969
1970-1974
1975-19790
10
20
30
40
50
60
70
80
90
100
15 17 19 21 23 25 27 29 31 33 35 37 39 41
1960-1964
1965-1969
1970-1974
1975-1979
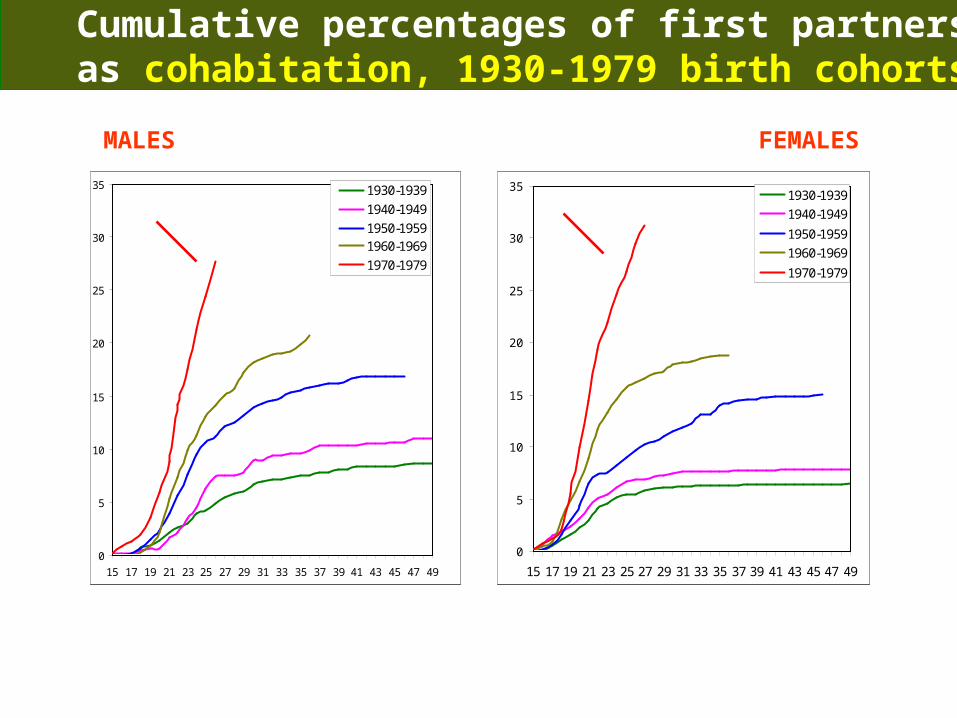
Cumulative percentages of first partnership as cohabitation, 1930-1979 birth cohorts
MALES FEMALES
0
5
10
15
20
25
30
35
15 17 19 21 23 25 27 29 31 33 35 37 39 41 43 45 47 49
1930-1939
1940-1949
1950-1959
1960-1969
1970-1979
0
5
10
15
20
25
30
35
15 17 19 21 23 25 27 29 31 33 35 37 39 41 43 45 47 49
1930-1939
1940-1949
1950-19591960-1969
1970-1979
0
5
10
15
20
25
30
35
15 17 19 21 23 25 27 29 31 33 35 37 39 41 43 45 47 49
1930-1939
1940-1949
1950-1959
1960-1969
1970-1979
0
5
10
15
20
25
30
35
15 17 19 21 23 25 27 29 31 33 35 37 39 41 43 45 47 49
1930-1939
1940-1949
1950-19591960-1969
1970-1979
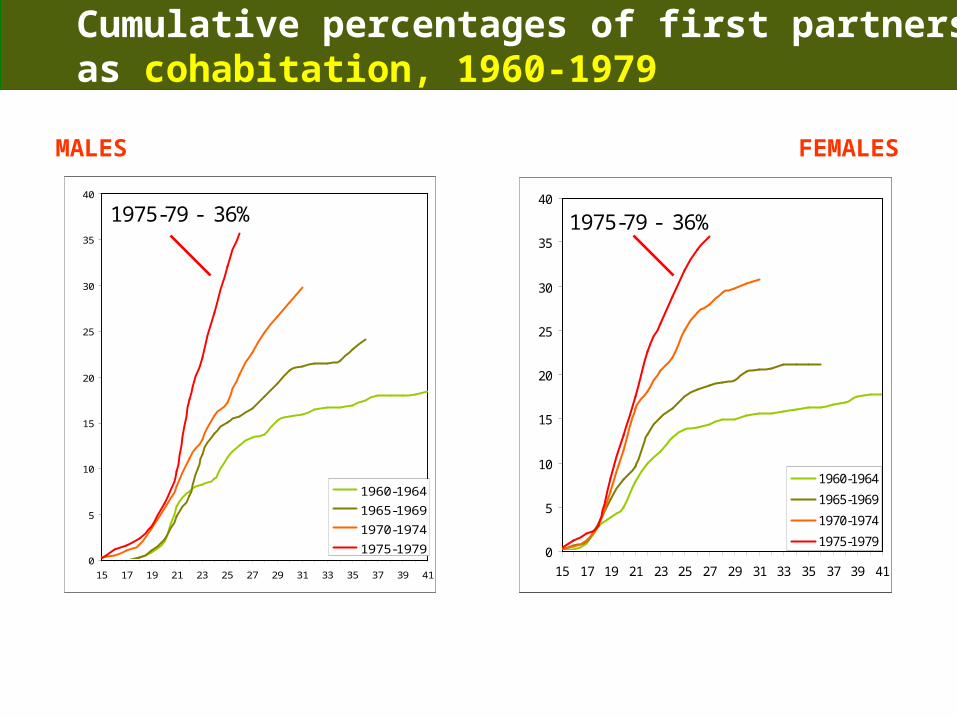
MALES FEMALES
Cumulative percentages of first partnership as cohabitation, 1960-1979
0
5
10
15
20
25
30
35
40
15 17 19 21 23 25 27 29 31 33 35 37 39 41
1960-1964
1965-1969
1970-1974
1975-1979 0
5
10
15
20
25
30
35
40
15 17 19 21 23 25 27 29 31 33 35 37 39 41
1960-1964
1965-1969
1970-1974
1975-1979
1975-79 - 36% 1975-79 - 36%
0
5
10
15
20
25
30
35
40
15 17 19 21 23 25 27 29 31 33 35 37 39 41
1960-1964
1965-1969
1970-1974
1975-1979 0
5
10
15
20
25
30
35
40
15 17 19 21 23 25 27 29 31 33 35 37 39 41
1960-1964
1965-1969
1970-1974
1975-1979
1975-79 - 36% 1975-79 - 36%
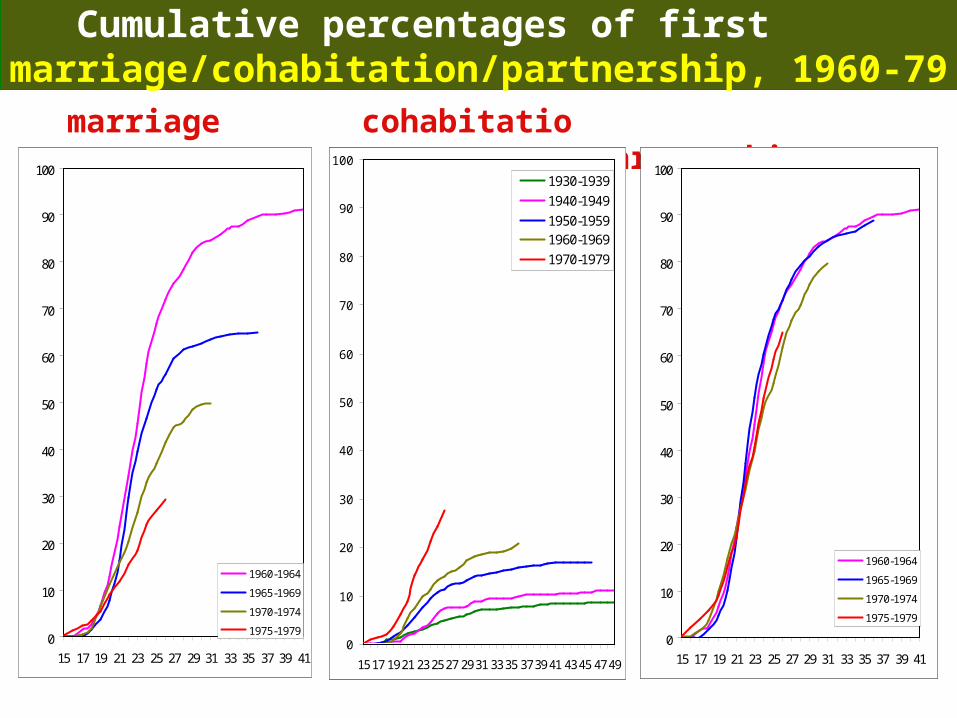
Cumulative percentages of first marriage/cohabitation/partnership, 1960-79 MALES
partnershipcohabitationmarriage
0
10
20
30
40
50
60
70
80
90
100
15 17 19 21 23 25 27 29 31 33 35 37 39 41
1960-1964
1965-1969
1970-1974
1975-19790
10
20
30
40
50
60
70
80
90
100
15 17 19 21 23 25 27 29 31 33 35 37 39 41
1960-1964
1965-1969
1970-1974
1975-1979
0
10
20
30
40
50
60
70
80
90
100
15 17 19 21 23 25 27 29 31 33 35 37 39 41 43 45 47 49
1930-1939
1940-1949
1950-19591960-1969
1970-1979
0
10
20
30
40
50
60
70
80
90
100
15 17 19 21 23 25 27 29 31 33 35 37 39 41
1960-1964
1965-1969
1970-1974
1975-19790
10
20
30
40
50
60
70
80
90
100
15 17 19 21 23 25 27 29 31 33 35 37 39 41
1960-1964
1965-1969
1970-1974
1975-1979
0
10
20
30
40
50
60
70
80
90
100
15 17 19 21 23 25 27 29 31 33 35 37 39 41 43 45 47 49
1930-1939
1940-1949
1950-19591960-1969
1970-1979
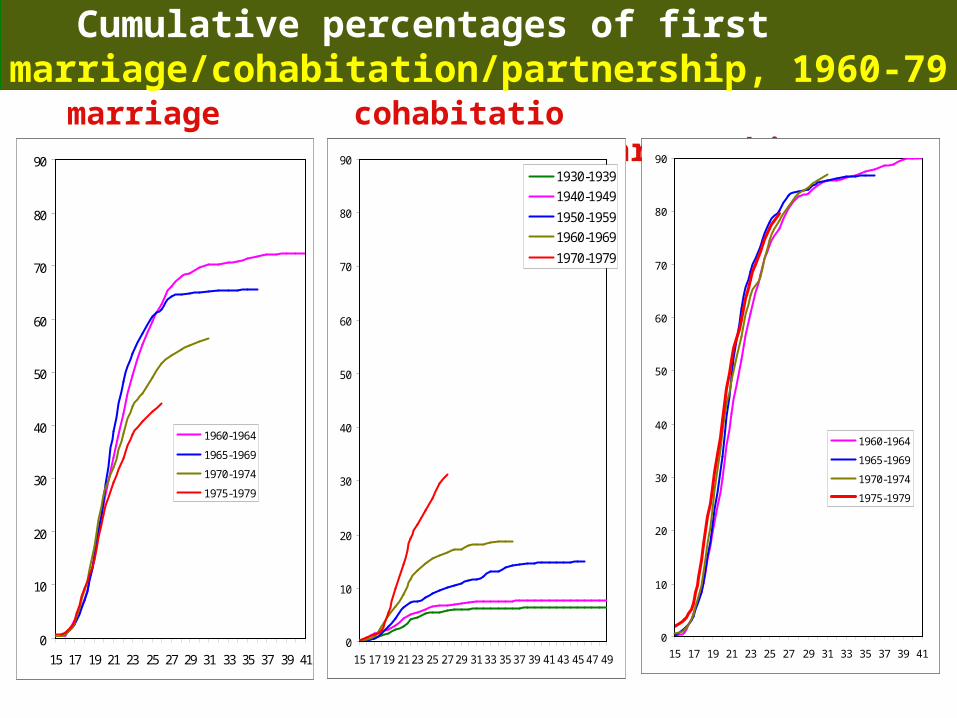
Cumulative percentages of first marriage/cohabitation/partnership, 1960-79 FEMALES
marriage cohabitation partnership
0
10
20
30
40
50
60
70
80
90
15 17 19 21 23 25 27 29 31 33 35 37 39 41
1960-1964
1965-1969
1970-1974
1975-1979
0
10
20
30
40
50
60
70
80
90
15 17 19 21 23 25 27 29 31 33 35 37 39 41
1960-1964
1965-1969
1970-1974
1975-1979
0
10
20
30
40
50
60
70
80
90
15 17 19 21 23 25 27 29 31 33 35 37 39 41 43 45 47 49
1930-1939
1940-1949
1950-1959
1960-1969
1970-1979
0
10
20
30
40
50
60
70
80
90
15 17 19 21 23 25 27 29 31 33 35 37 39 41
1960-1964
1965-1969
1970-1974
1975-1979
0
10
20
30
40
50
60
70
80
90
15 17 19 21 23 25 27 29 31 33 35 37 39 41
1960-1964
1965-1969
1970-1974
1975-1979
0
10
20
30
40
50
60
70
80
90
15 17 19 21 23 25 27 29 31 33 35 37 39 41 43 45 47 49
1930-1939
1940-1949
1950-1959
1960-1969
1970-1979
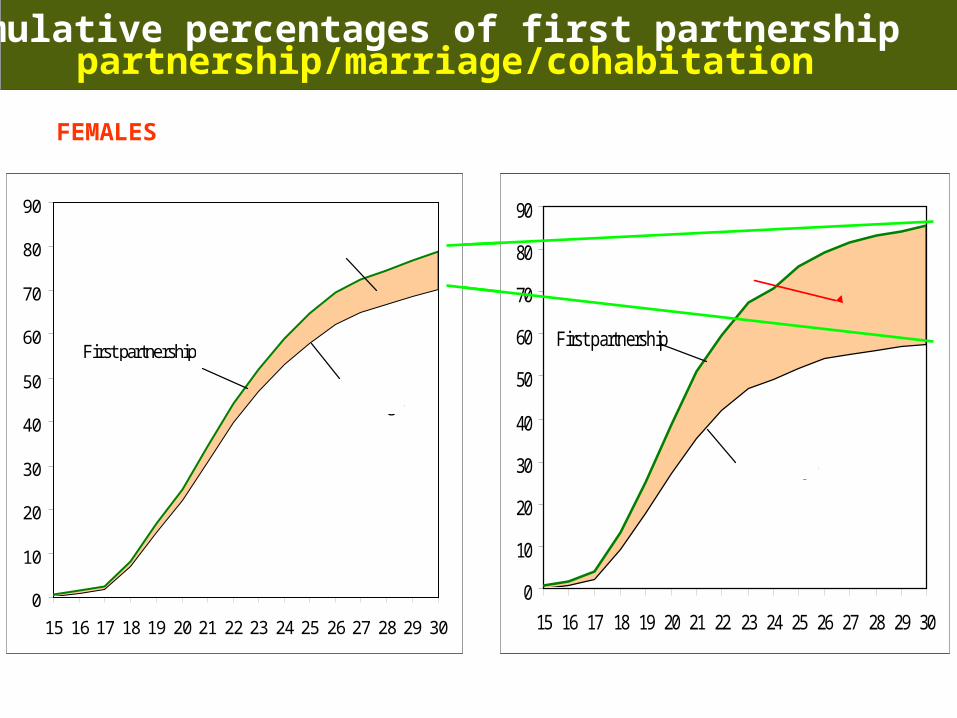
partnership/marriage/cohabitation
FEMALES
Cumulative percentages of first partnership
1948-1955 1968-1975
78,9 85,5
70,3
57,5
0
10
20
30
40
50
60
70
80
90
15 16 17 18 19 20 21 22 23 24 25 26 27 28 29 30
First partnership
FP marriage
FP cohabitation
0
10
20
30
40
50
60
70
80
90
15 16 17 18 19 20 21 22 23 24 25 26 27 28 29 30
First partnership
FP marriage
FP cohabitation
0
10
20
30
40
50
60
70
80
90
15 16 17 18 19 20 21 22 23 24 25 26 27 28 29 30
First partnership
FP marriage
FP cohabitation
0
10
20
30
40
50
60
70
80
90
15 16 17 18 19 20 21 22 23 24 25 26 27 28 29 30
First partnership
FP marriage
FP cohabitation
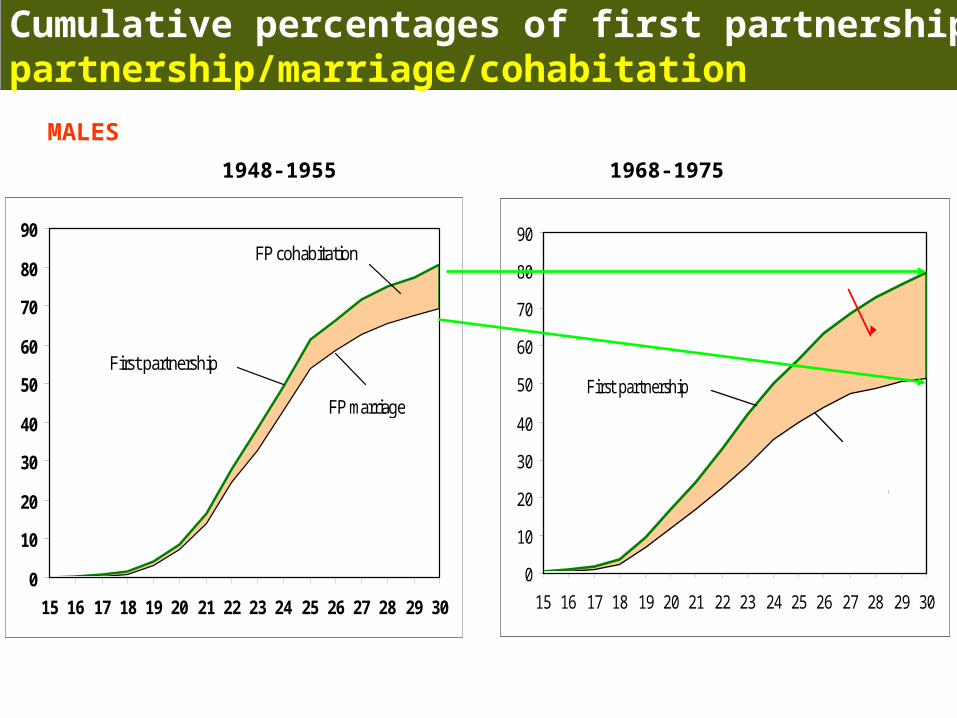
Cumulative percentages of first partnership:partnership/marriage/cohabitation
MALES
1948-1955 1968-1975
0
10
20
30
40
50
60
70
80
90
15 16 17 18 19 20 21 22 23 24 25 26 27 28 29 30
First partnership
FP marriage
FP cohabitation
0
10
20
30
40
50
60
70
80
90
15 16 17 18 19 20 21 22 23 24 25 26 27 28 29 30
First partnership
FP marriage
FP cohabitation
0
10
20
30
40
50
60
70
80
90
15 16 17 18 19 20 21 22 23 24 25 26 27 28 29 30
First partnership
FP marriage
FP cohabitation
0
10
20
30
40
50
60
70
80
90
15 16 17 18 19 20 21 22 23 24 25 26 27 28 29 30
First partnership
FP marriage
FP cohabitation
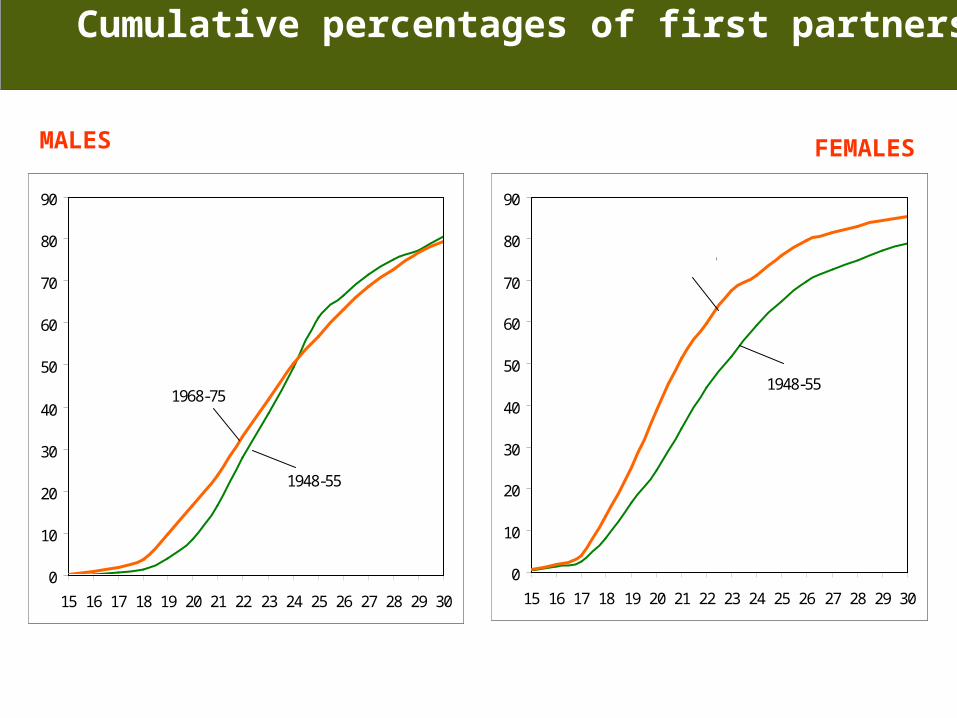
Cumulative percentages of first partnership
MALES FEMALES
0
10
20
30
40
50
60
70
80
90
15 16 17 18 19 20 21 22 23 24 25 26 27 28 29 30
1948-55
1968-75
0
10
20
30
40
50
60
70
80
90
15 16 17 18 19 20 21 22 23 24 25 26 27 28 29 30
1948-55
1968-75
0
10
20
30
40
50
60
70
80
90
15 16 17 18 19 20 21 22 23 24 25 26 27 28 29 30
1948-55
1968-75
0
10
20
30
40
50
60
70
80
90
15 16 17 18 19 20 21 22 23 24 25 26 27 28 29 30
1948-55
1968-75
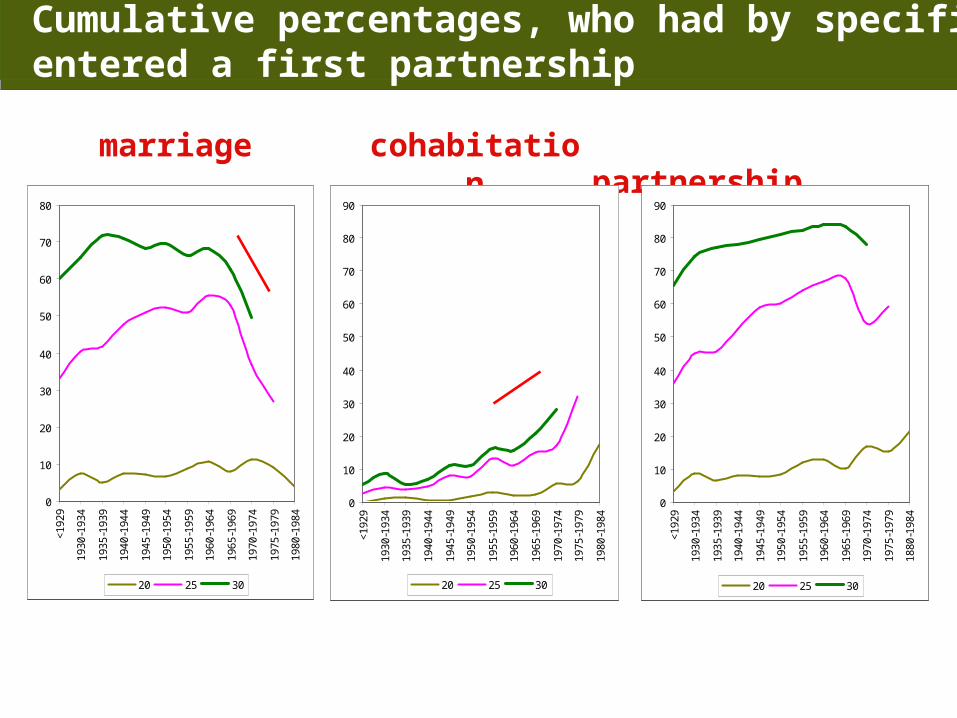
Cumulative percentages, who had by specified age entered a first partnership MALES
marriage cohabitation partnership
0
10
20
30
40
50
60
70
80
<19
29
1930
-193
4
1935
-193
9
1940
-194
4
1945
-194
9
1950
-195
4
1955
-195
9
1960
-196
4
1965
-196
9
1970
-197
4
1975
-197
9
1980
-198
4
20 25 30
0
10
20
30
40
50
60
70
80
90
<19
29
1930
-193
4
1935
-193
9
1940
-194
4
1945
-194
9
1950
-195
4
1955
-195
9
1960
-196
4
1965
-196
9
1970
-197
4
1975
-197
9
1980
-198
4
20 25 30
0
10
20
30
40
50
60
70
80
90
<19
29
1930
-193
4
1935
-193
9
1940
-194
4
1945
-194
9
1950
-195
4
1955
-195
9
1960
-196
4
1965
-196
9
1970
-197
4
1975
-197
9
1880
-198
4
20 25 30
0
10
20
30
40
50
60
70
80
<19
29
1930
-193
4
1935
-193
9
1940
-194
4
1945
-194
9
1950
-195
4
1955
-195
9
1960
-196
4
1965
-196
9
1970
-197
4
1975
-197
9
1980
-198
4
20 25 30
0
10
20
30
40
50
60
70
80
90
<19
29
1930
-193
4
1935
-193
9
1940
-194
4
1945
-194
9
1950
-195
4
1955
-195
9
1960
-196
4
1965
-196
9
1970
-197
4
1975
-197
9
1980
-198
4
20 25 30
0
10
20
30
40
50
60
70
80
90
<19
29
1930
-193
4
1935
-193
9
1940
-194
4
1945
-194
9
1950
-195
4
1955
-195
9
1960
-196
4
1965
-196
9
1970
-197
4
1975
-197
9
1880
-198
4
20 25 30
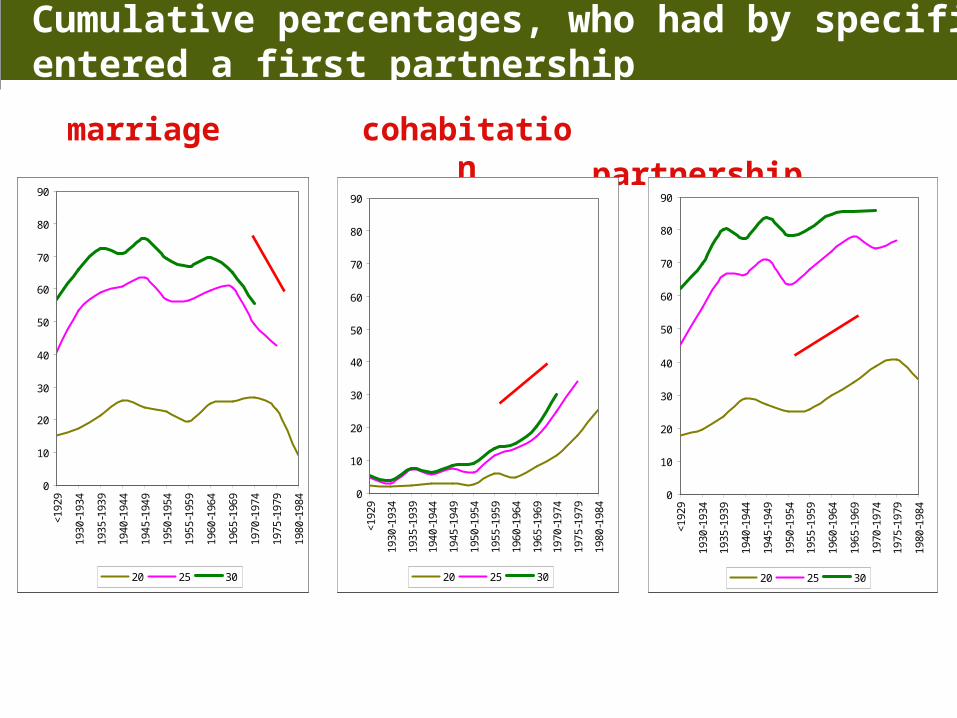
Cumulative percentages, who had by specified age entered a first partnership FEMALES
marriage cohabitation partnership
0
10
20
30
40
50
60
70
80
90
<19
29
1930
-193
4
1935
-193
9
1940
-194
4
1945
-194
9
1950
-195
4
1955
-195
9
1960
-196
4
1965
-196
9
1970
-197
4
1975
-197
9
1980
-198
4
20 25 30
0
10
20
30
40
50
60
70
80
90
<19
29
1930
-193
4
1935
-193
9
1940
-194
4
1945
-194
9
1950
-195
4
1955
-195
9
1960
-196
4
1965
-196
9
1970
-197
4
1975
-197
9
1980
-198
4
20 25 30
0
10
20
30
40
50
60
70
80
90
<19
29
1930
-193
4
1935
-193
9
1940
-194
4
1945
-194
9
1950
-195
4
1955
-195
9
1960
-196
4
1965
-196
9
1970
-197
4
1975
-197
9
1980
-198
4
20 25 30
0
10
20
30
40
50
60
70
80
90
<19
29
1930
-193
4
1935
-193
9
1940
-194
4
1945
-194
9
1950
-195
4
1955
-195
9
1960
-196
4
1965
-196
9
1970
-197
4
1975
-197
9
1980
-198
4
20 25 30
0
10
20
30
40
50
60
70
80
90
<19
29
1930
-193
4
1935
-193
9
1940
-194
4
1945
-194
9
1950
-195
4
1955
-195
9
1960
-196
4
1965
-196
9
1970
-197
4
1975
-197
9
1980
-198
4
20 25 30
0
10
20
30
40
50
60
70
80
90
<19
29
1930
-193
4
1935
-193
9
1940
-194
4
1945
-194
9
1950
-195
4
1955
-195
9
1960
-196
4
1965
-196
9
1970
-197
4
1975
-197
9
1980
-198
4
20 25 30
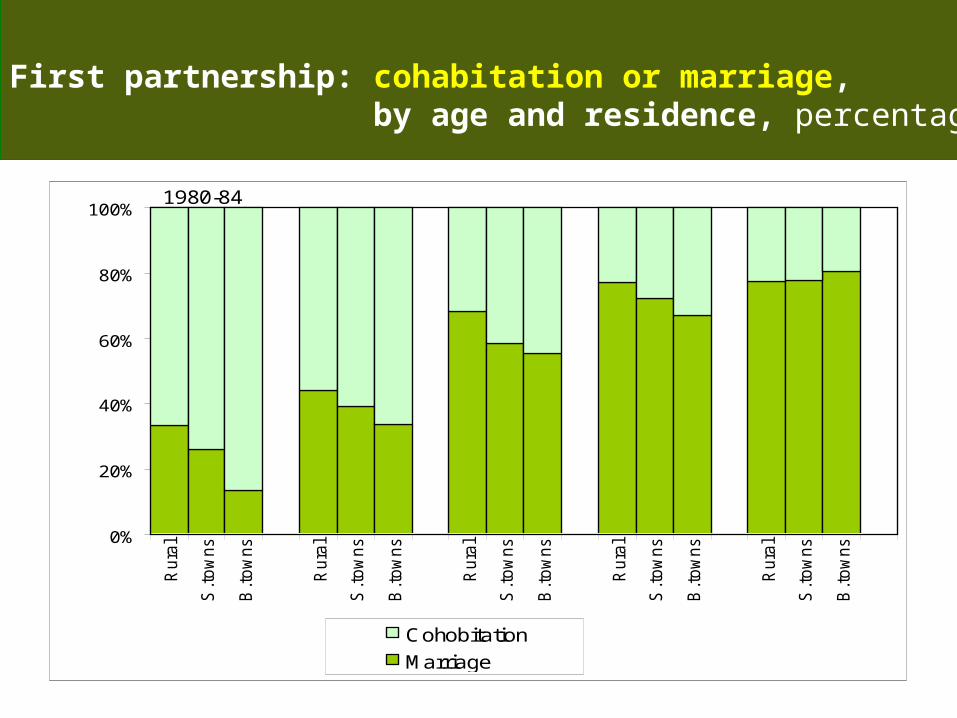
First partnership: cohabitation or marriage, by age and residence, percentage
0%
20%
40%
60%
80%
100%
Rura
l
S.t
ow
ns
B.t
ow
ns
Rura
l
S.t
ow
ns
B.t
ow
ns
Rura
l
S.t
ow
ns
B.t
ow
ns
Rura
l
S.t
ow
ns
B.t
ow
ns
Rura
l
S.t
ow
ns
B.t
ow
ns
Cohobitation
Marriage
1980-84 1975-79 1970-74 1965-69 1960-64
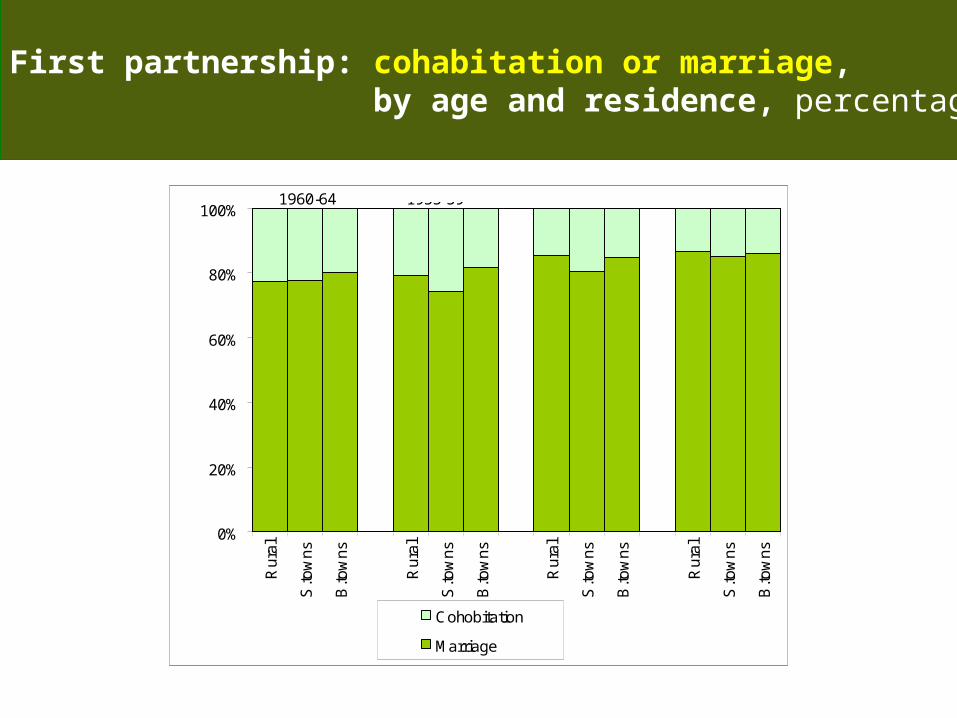
First partnership: cohabitation or marriage, by age and residence, percentage
0%
20%
40%
60%
80%
100%
Ru
ral
S.to
wn
s
B.to
wn
s
Ru
ral
S.to
wn
s
B.to
wn
s
Ru
ral
S.to
wn
s
B.to
wn
s
Ru
ral
S.to
wn
s
B.to
wn
s
Cohobitation
Marriage
1960-64 1955-59 1950-54 1945-49
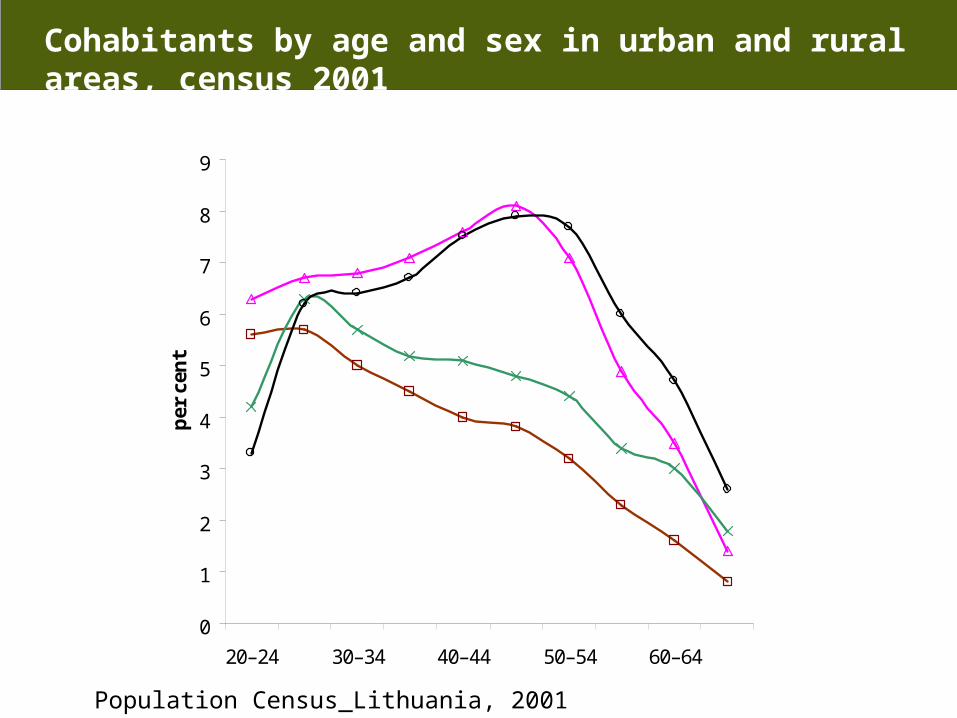
Cohabitants by age and sex in urban and rural areas, census 2001
urban women
urban men
rural women rural men
Population Census_Lithuania, 2001
0
1
2
3
4
5
6
7
8
9
20–24 30–34 40–44 50–54 60–64
per
cen
t
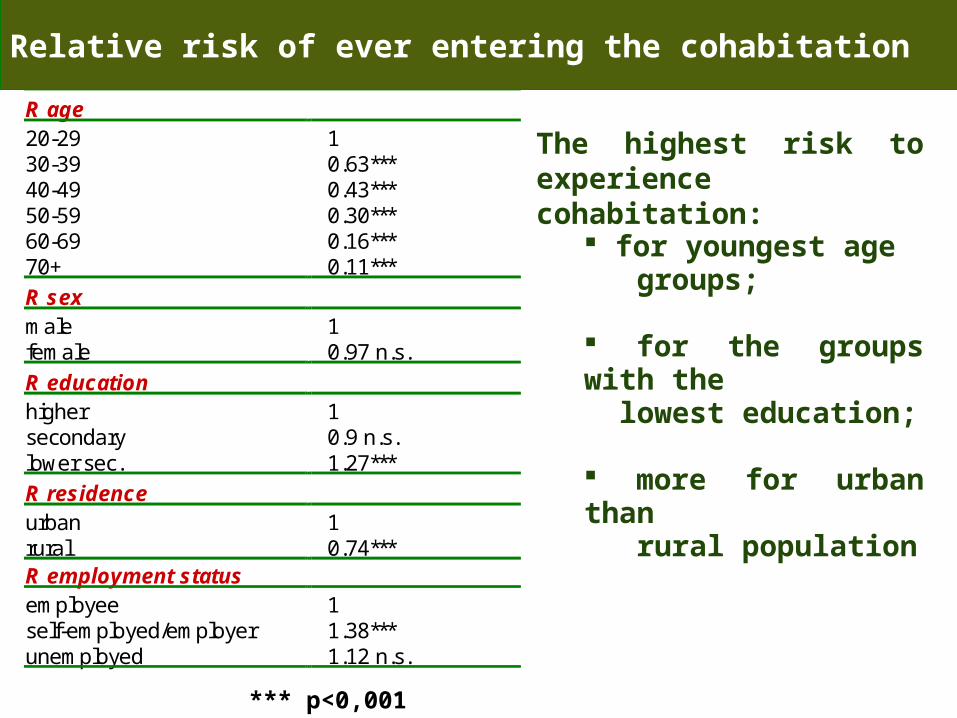
R age 20-29 1 30-39 0.63*** 40-49 0.43*** 50-59 0.30*** 60-69 0.16*** 70+ 0.11***
R sex male 1 female 0.97 n.s.
R education higher 1 secondary 0.9 n.s. lower sec. 1.27***
R residence urban 1 rural 0.74*** R employment status employee 1 self-employed/employer 1.38*** unemployed 1.12 n.s.
*** p<0,001
Relative risk of ever entering the cohabitation
The highest risk to experience cohabitation:
for youngest age groups;
for the groups with the lowest education;
more for urban than rural population
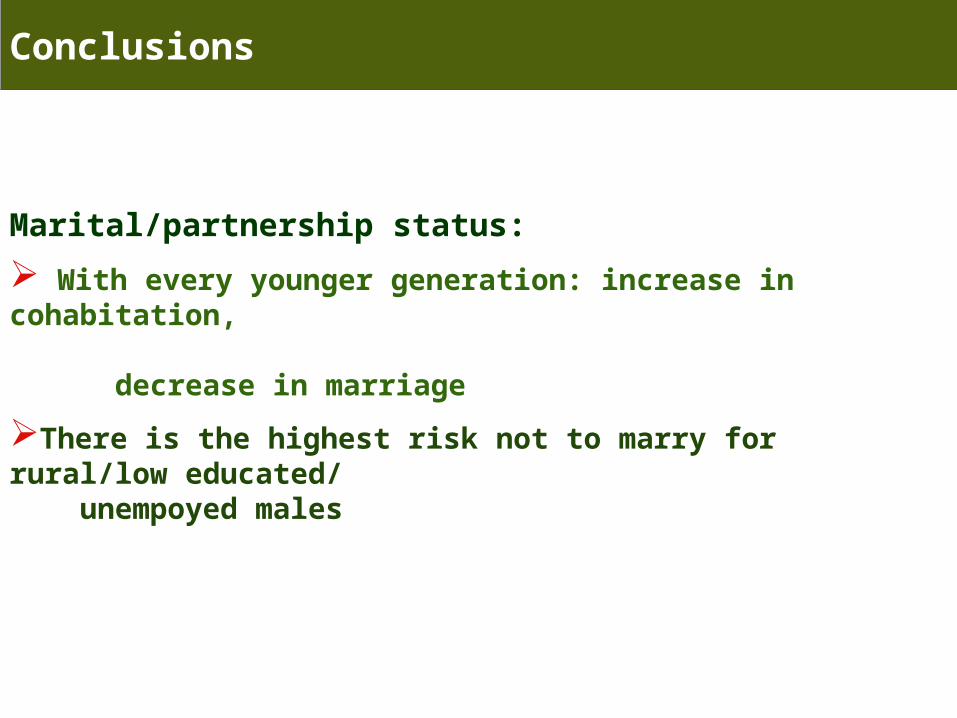
Conclusions
Marital/partnership status:
With every younger generation: increase in cohabitation, decrease in marriage
There is the highest risk not to marry for rural/low educated/ unempoyed males
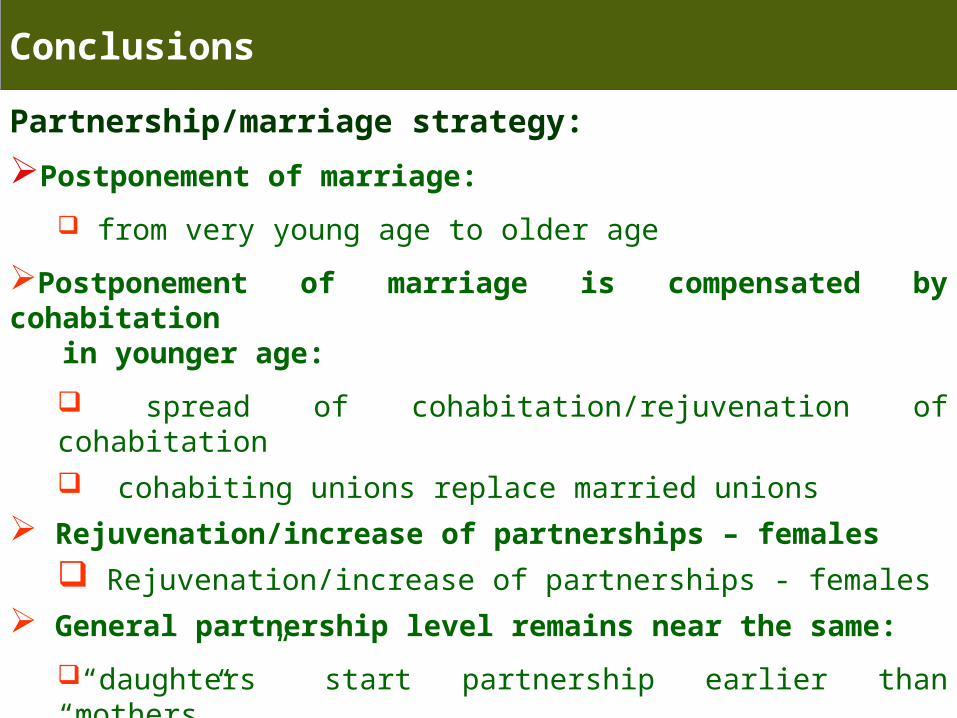
Conclusions
Partnership/marriage strategy:
Postponement of marriage:
from very young age to older age
Postponement of marriage is compensated by cohabitation in younger age:
spread of cohabitation/rejuvenation of cohabitation
cohabiting unions replace married unions
Rejuvenation/increase of partnerships – females
Rejuvenation/increase of partnerships - females
General partnership level remains near the same:
“daughters” start partnership earlier than “mothers”
Conclusions
Cohabitation:
The highest risk to experience cohabitation:
for youngest age groups;
for the groups with thelowest education;
more for urban than rural population