Embed Size (px)
Citation preview

Rusting Away?The Ukrainian Iron and
Steel Industry in Transition
VLAD MYKHNENKO
C P S I N T E R N A T I O N A L P O L I C Y F E L L O W S H I P P R O G R A M
20
03
/2
00
4
CENTRAL EUROPEAN UNIVERSITYCENTER FOR POLICY STUDIES OPEN SOCIETY INSTITUTE

VLAD MYKHNENKO
Rusting Away? The Ukrainian Iron and
Steel Industry in Transition
The views in this report are the author's own and do not necessarily reflect those of theCenter for Policy Studies, Central European University or the Open Society Institute. Wehave included the reports in the form they were submitted by the authors. No additionalcopyediting or typesetting has been done to them.

Rusting Away?
The Ukrainian Iron & Steel Industry in Transition
RESEARCH PAPER
APRIL 2004
Vlad Mykhnenko
OSI International Policy Fellow*
2003-2004 IPF Project: The Post-Communist State and Politics of Steel
E-mail: [email protected]
* This publication was sponsored by the International Policy Fellowship Programme affiliated with the Central European University Centre for Policy Studies and the Open Society Institute – Budapest. I wish to express my gratitude to the IPF Staff as well as to the Open Society Institute-Budapest on the whole for their generous support. I also would like to thank Dr. David Lane (Cambridge) for his critical comments on the earlier version of this paper.
© Vladlen Mykhnenko, all rights reserved

2
INTRODUCTION
The main objectives of this paper are (a) to overview the Ukrainian ferrous metals sector,
(b) to examine the performance of Ukraine’s iron and steel industry during the post-
communist transformation, (c) to discover major challenges the industry has been faced
with since the beginning of the 1990s, and (d) to evaluate corporate and public policy
responses vis-à-vis the challenging environment of transformation and globalisation. This
paper proceeds in four sections. The first part sets the stage by introducing the Ukrainian
ferrous metals industry and its major enterprises. The second section examines the
economic outcomes generated by the Ukrainian iron and steel industry under post-
communism. The third section establishes and identifies a number of basic short-term
problems and fundamental long-term challenges of the Ukrainian steel industry with
regard to technological advancement, market access and development, resource base, and
ownership transformation. Finally, this paper analyses the industry’s current corporate
and public policy environment in Ukraine.
The project’s overall methodological framework is developed along the lines of the study
of comparative economic systems with its appropriate adaptation and simplification for
the study of separate industries or sectors. The methodology is based on the works of
John Elliot (1973), Andrew Zimbalist (1984), Morris Bornstein (1985), Stephen Gardner
(1998), Paul Gregory and Robert Stuart (1999). It identifies the economic outcomes of the
iron and steel industry as the dependent variable to be analysed though three basic criteria
such as output and sales growth, efficiency, and stability. The independent variables are
the resource base of the industry (=natural resources and raw materials, labour, and
capital) and the economic system (=ownership arrangements and co-ordination
mechanisms). Exogenous influences that affect the industry’s performance – the
environment – are regarded as an intervening variable. In addition, possible reform
attempts and policies that the decision-makers choose to implement are considered to be
the second intervening variable. Figure 1 provides an illustration of the present
methodological framework.

3
Figure 1. Forces influencing economic outcomes Environment Reform Policy Source: Compiled on the basis of Ruud Knaack, ‘Dynamic Comparative Economics: Lessons from Socialist Planning’, in Andrew Zimbalist, ed., Comparative Economic Systems: Present Views (Boston: Kluwer-Nijhoff Publishing, 1984), pp. 109-132; H. Stephen Gardner, Comparative Economic Systems, 2nd edn (Fort Worth, TX: The Dryden Press, 1998); and Paul R. Gregory and Robert C. Stuart, Comparative Economic Systems, 6th edn (Boston: Houghton Mifflin, 1999).
INDUSTRY OVERVIEW
Prior to discussing the performance and challenges of the Ukrainian iron and steel
industry under post-communism, one should overview the central characteristics of the
ferrous metals sector. What was the magnitude of Ukraine’s ferrous metals production
within the Soviet Union and on the world scale? Where are the industrial capacities
situated within the country? What are the industry’s core products and major producers?
How is the technological cycle organised? This section responds to the questions above.
During its 130 year-long history, the Ukrainian iron and steel industry has developed into
a fully-grown manufacturing sector. It involves the entire technological cycle of
economic activities designed for the production of iron, steel, and a large number of semi-
and fully-finished metal products. The Ukrainian ferrous metals capacities include: (1) the
extraction, processing and agglomeration of iron, manganese and chromic iron ores; (2)
the extraction and processing of fire-clay, refractory and complementary materials; (3) the
production of coal coke; (4) the production of cast iron, blast furnace ferroalloys, crude
steel, rolled metals, steel tubes, electric ferroalloys, and special metal materials for
mechanical engineering; (5) the recycling of scrap metal. The Ukrainian iron and steel
industry also incorporates a large number of non-metallic raw material deposits, mining,
Resources
Economic System
Performance (Economic) Growth Efficiency Stability
4
quarrying, and processing capacities, which produce flux, fire-clays, kaolin, dolomite, and
metallurgical limestone.
The industry’s historical development has been spatially located around huge iron ore and
coal deposits, water resources, and electric power facilities of the Donbas-Dnieper Bend
in the east of Ukraine. Beginning in the 1870s, the Ukrainian iron and steel industry
provided the basis for the industrial expansion of the Imperial Russia. Subsequently,
Ukraine’s iron and steel works became a vital element in the Soviet Union’s
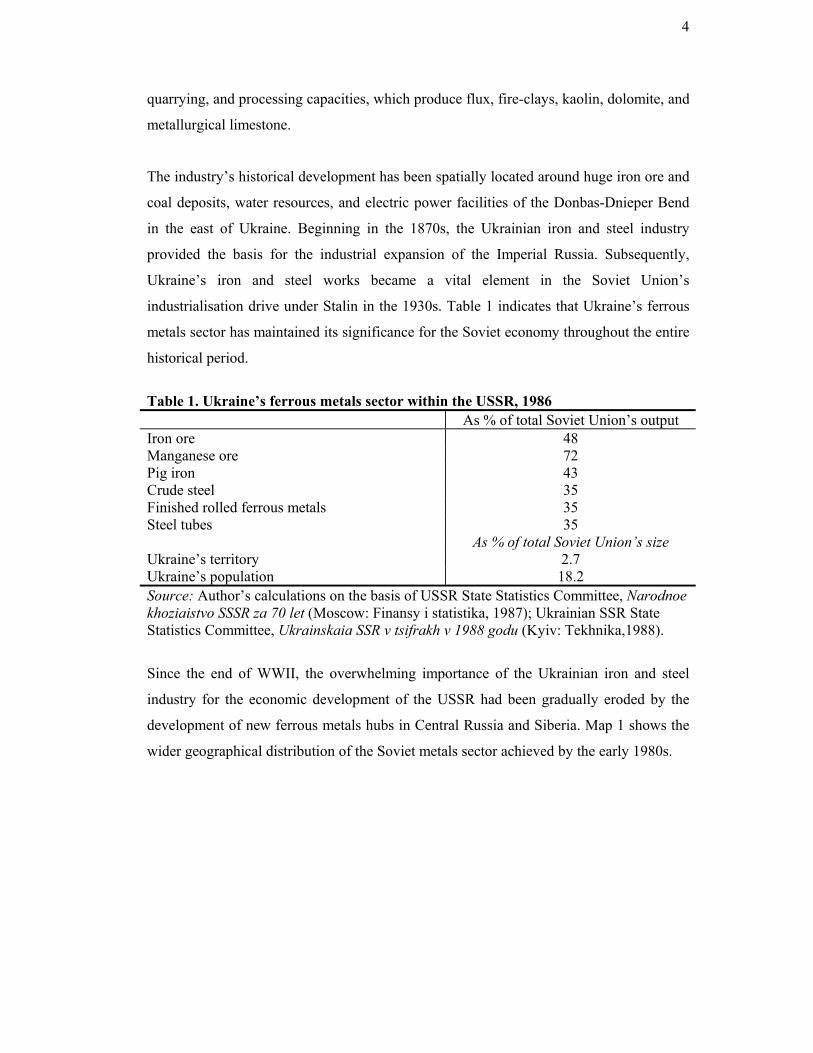
industrialisation drive under Stalin in the 1930s. Table 1 indicates that Ukraine’s ferrous
metals sector has maintained its significance for the Soviet economy throughout the entire
historical period.
Table 1. Ukraine’s ferrous metals sector within the USSR, 1986 As % of total Soviet Union’s output Iron ore 48 Manganese ore 72 Pig iron 43 Crude steel 35 Finished rolled ferrous metals 35 Steel tubes 35 As % of total Soviet Union’s size Ukraine’s territory 2.7 Ukraine’s population 18.2 Source: Author’s calculations on the basis of USSR State Statistics Committee, Narodnoe khoziaistvo SSSR za 70 let (Moscow: Finansy i statistika, 1987); Ukrainian SSR State Statistics Committee, Ukrainskaia SSR v tsifrakh v 1988 godu (Kyiv: Tekhnika,1988).
Since the end of WWII, the overwhelming importance of the Ukrainian iron and steel
industry for the economic development of the USSR had been gradually eroded by the
development of new ferrous metals hubs in Central Russia and Siberia. Map 1 shows the
wider geographical distribution of the Soviet metals sector achieved by the early 1980s.

5
Map 1. The geography of ferrous and non-ferrous metals centres in the USSR, 1982. Source: http://www.1uptravel.com/worldmaps/russia54.html

Nonetheless, by the end of state socialism, Ukraine had managed to remain one of the
world’s major metallurgical complexes. Table 2 demonstrates that in the mid-1980s,
Ukraine’s production of iron ore and crude steel was amongst the top 3 to 4 largest in the
world.
Table 2. Ukraine’s ferrous metals industry within the world, 1985-1986 Rank Country Crude steel
million tonnes (% of world output)
Rank Country Iron ore
million tonnes
1. USSR of which, Ukraine
161 (22) 56.6 (8)
1. USSR of which, Ukraine
250 120
2. Japan 98 (14) 2. China 151 3. United States 75 (10) 3. Australia 91 4. China 52.5 (7) 4. Brazil 70 5. West Germany 38 (5) 5. United States 49 6. Italy 23 (3) 6. India 42 7. Brazil 20.5 (3) 7. Canada 40 8. Poland 17.1 (2) 8. South Africa 24.5 9. Czechoslovakia 15.1 (2) 9. Sweden 20.6 10. United Kingdom 14.7 (2) 10. Liberia 15 Source: Author’s calculations on the basis of USSR State Statistics Committee, Narodnoe khoziaistvo SSSR za 70 let (Moscow: Finansy i statistika, 1987); Ukrainian SSR State Statistics Committee, Ukrainskaia SSR v tsifrakh v 1988 godu (Kyiv: Tekhnika,1988); International Iron and Steel Institute, World Steel in Figures: 2003 Edition (Brussels: IISI, 2003).
In 1990, there were thirty two iron and steel works functioning in Ukraine. The Ukrainian
iron and steel industry has long been characterised by one of the world’s highest levels of
industrial establishment concentration: 98 per cent of pig iron and 97 per cent of crude
steel are produced by steel works with an annual crude steel output of over one million
tonne per year.† One of the most common forms of the organisation of production in the
Ukrainian ferrous metals industry has been kombinat – a combine of integrated
complementary industrial factories processing iron ore materials, coking coal, casting
iron, smelting and rolling steel, and manufacturing finished metal products. In addition to
the complete production cycle enterprises, there has been a large number of iron and steel
works with an exclusive specialisation in producing pig iron and crude steel.
Reprocessing metallurgy has been concentrated on the electric furnace production of
† However, establishment (or plant-) concentration in a given market is usually much lower than firm-concentration. For instance, in 2002, the average annual crude steel output of the world’s largest 80 steel producing companies was 7.7 million tonnes. The biggest Ukrainian steel company – Kryvorizhstal – produced 6.9 million tonnes that year.

7
finished rolled metals, special steels and ferroalloys. Apart from the large iron and steel
works, ‘small metallurgy’ has also been present in the country. Small steel mills typically
function within large heavy engineering companies and produce metal products for
machine-building purposes. However, under post-communism, different foundries,
rolling shops, and mills within several large steel combines have been divided into
independent mini-mills or finished metals firms.
Geographically, the Ukrainian iron and steel works are concentrated in the Donbas-
Dnieper Bend within three ferrous metals areas. A half of Ukraine’s steel works are
located in the Donbas (Donets Coal Basin) – around the coal fuel resources – and at the
coastal plain around the Sea of Azov – a natural commercial gate-way and transportation
route. Another half of the iron and steel works are situated in the lower Dnieper River
region – around the deposits of iron and manganese ores and vast water reservoirs. Thus,
according to Ukraine’s current administrative division, almost the entire iron and steel
industry is located in four neighbouring south-eastern provinces - Dnipropetrovsk,
Zaporizhzhia, Donetsk, and Luhansk oblasti (see Map 2).
Fourteen iron and steel works are grouped around the lower Dnieper River region. The
Dnipropetrovsk industrial hub includes ferrous metals enterprises located in the cities of
Dnipropetrovsk (four), Dniprodzerzhynsk, and Novomoskovsk, which produce pig-iron,
crude steel, rolled ferrous metals, steel tubes, railway wheels, bridge construction
elements, and metal alloys. The Zaporizhzhia industrial hub includes three ferrous metals
companies which produce pig-iron, thin hot- and cold-rolled slab steel, moulded steel,
transformer steel, white plates, bent rolled metal profiles, cold rolled sheet steel for the
motor-car industry, and special steels for the heavy engineering industry. The Kryvyi Rih
industrial hub covers one of the world largest iron and manganese ore deposits, open-cast
mines, Ukraine’s currently largest iron and steel complex of Kryvyi Rih, a number of ore
mining and processing combines and agglomeration plants (Southern, Central, Northern,
Kryvyi Rih, Sukha Balka, and Inhulets factories), as well as a tube-rolling plant and a
ferroalloys factory, both at the town of Nikopol. Two manganese ore mining and
processing combines – at Marhanets and Ordzhenikidze – also operate in the surrounding
area of Dnipropetrovsk oblast. In addition, the lower Dnieper River ferrous metals region
includes the Kremenchuk iron ore deposits with its Poltava Ore Mining and Processing
Combine.
8
The Donbas ferrous metals area includes thirteen iron and steel works, and the thirteen of
Ukraine’s eighteen coal coking plants. The Donetsk-Makiivka industrial hub consists of
four ferrous metals works (two in each city respectively), a number of coal coking plants,
tube-rolling mills, and fire-clay factories. A modernised iron and steel works and a new
mini-mill are situated at the Yenakieve industrial hub. The Alchevsk industrial hub
includes one of the largest iron and steel combines and a ferroalloys factory. The
Khartsyzsk industrial hub includes three ferrous metals producing enterprises (one steel
works, one tube mill, and one steel wire factory). There are also several independent iron
and steel works in the Donbas cities of Kramatorsk and Kostiantynivka. Small steel mills
function at almost each of Ukraine’s largest heavy engineering factories. The ferrous
metals area around the Sea of Azov includes the country’s second and third largest steel-
producing combines in Mariupol as well as a small iron and steel factory at Kerch and
the iron ore deposits around the city of Kerch on the Crimean peninsula. The two iron and
steel works in Mariupol produce iron, steel, and a wide range of rolled metals, consuming
the raw materials from the Kerch and, partially, Kryvyi Rih iron ore deposits. The ferrous
metals industry of this area is closely related to local heavy engineering factories, coal
coking plants, as well as the companies that produce chemicals, fertilizers, and
construction materials (for an historical overview of the Ukrainian metals sector see
Chumachenko 1977: 90-117; Zastavnyi 1990: 113-116; Petryha 1999).
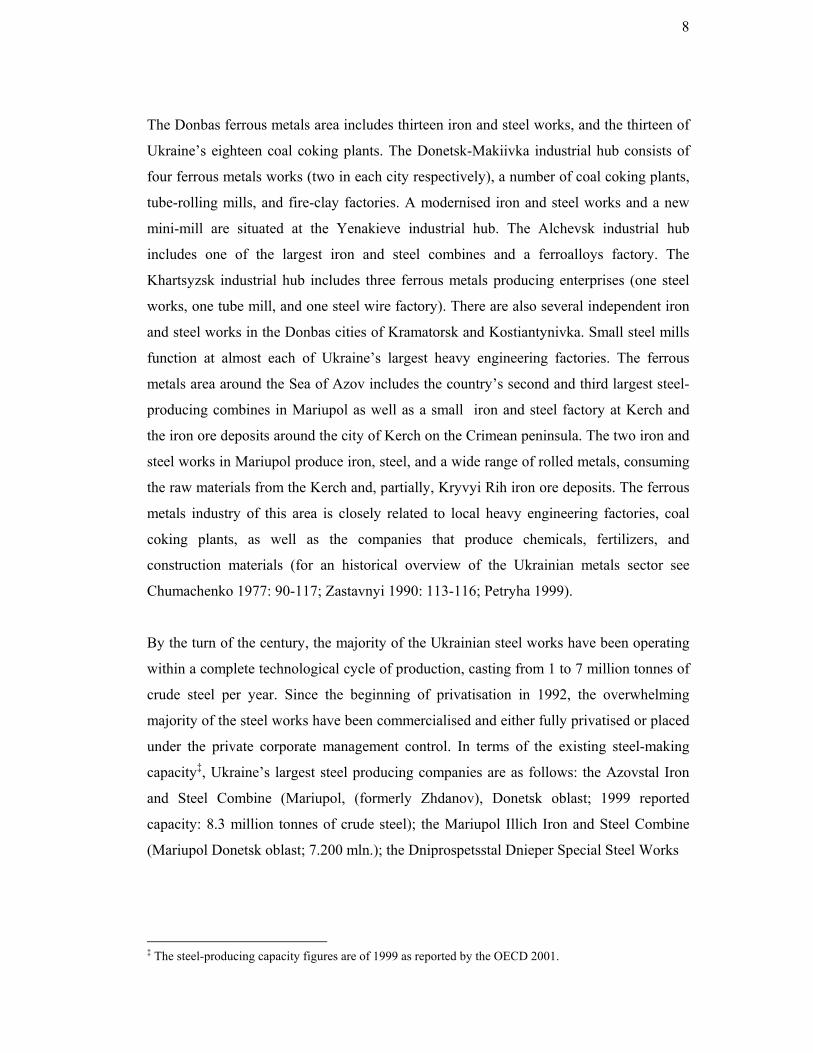
By the turn of the century, the majority of the Ukrainian steel works have been operating
within a complete technological cycle of production, casting from 1 to 7 million tonnes of
crude steel per year. Since the beginning of privatisation in 1992, the overwhelming
majority of the steel works have been commercialised and either fully privatised or placed
under the private corporate management control. In terms of the existing steel-making
capacity‡, Ukraine’s largest steel producing companies are as follows: the Azovstal Iron
and Steel Combine (Mariupol, (formerly Zhdanov), Donetsk oblast; 1999 reported
capacity: 8.3 million tonnes of crude steel); the Mariupol Illich Iron and Steel Combine
(Mariupol Donetsk oblast; 7.200 mln.); the Dniprospetsstal Dnieper Special Steel Works
‡ The steel-producing capacity figures are of 1999 as reported by the OECD 2001.

Map 2. Ukraine’s current administrative divisions
Source: The UK Foreign and Commonwealth Office Map Service (http://files.fco.gov.uk/info/research)

10
(Zaporizhzhia; 5.800 mln.); the Kryvorizhstal State Iron and Steel Combine (Kryvyi Rih,
Dnipropetrovsk oblast; 5.050 mln.)§; the Makiivka Kirov Iron and Steel Works
(Makiivka, Donetsk oblast; 4.050 mln.); the Dniprovsky Dzerzhinsky Iron and Steel
Combine (Dniprodzerzhynsk; 3.850 mln.); the Zaporizhstal Iron and Steel Combine
(Zaporizhzhia; 3.600 mln); the Alchevsk Iron and Steel Combine (Alchevsk (formerly
Komunarsk), Luhansk oblast; 3.290 mln.); the Yenakieve Iron and Steel Works
(Yenakieve, Donetsk oblast; 3.000 mln.); the Dnipropetrovsk Petrovsky Iron and Steel
Works (Dnipropetrovsk; 1.000 mln.); the Kostiantynivka Iron and Steel Works
(Kostiantynivka, Donetsk oblast; 1.000 mln.); the Donetsk Iron and Steel Works
(Donetsk; 0.840 mln.); the ISTIL-Donetsk Iron and Steel Mini-Mill (Donetsk; 0.840
mln.); the Dnieper Special Steel Electrometallurgical Mill (Zaporizhzhia; 0.750 mln.); the
Kramatorsk Iron and Steel Works (Kramatorsk, Donetsk oblast; 0.700 mln.); the
Energomashspetsstal Energy Machine-Building Special Steel Mill (Kramatorsk, Donetsk
oblast; 0.600 mln.). In terms of sales turnover, the current ranking order of the Ukrainian
steel producers is different to some extent. Figure 2 assesses the size of Ukraine’s ferrous
metals companies by their latest annual sales figures reported. Between 1999 and 2002,
the biggest five steel producers – Kryvorizhstal, Mariupol Illich, Azovstal, Zaporizhstal,
and Alchevsk – had been making on average the two-thirds of industry sales, while over
fifteen other companies accounted for another one-third of industry revenue turnover.
Figure 2. Ukraine’s steel companies by average annual revenue share, 1999-2002
Kryvorizhstal17.8%
Mariupol Illich
17.3%
Azovstal12.8%
Alchevsk6.8%
Dnipropetrovsk Petrovsky
3.0% Donetsk Iron and Steel Works3.3%
Dnieper Special Steels
2.9%
Others*13.6%
Dniprodzerzhynsk6.6%
Nikopol Ferroalloys
5.0%
Zaporizhstal11.0%
§ Since 1999, Kryvorizhstal has been substantially increasing its production capacity to become the largest steel producer in Ukraine. It is the only fully state-owned Ukrainian steel producer.
11
Note: Others include the following ferrous metals-producing companies (by total sales revenues): Donetskstal Iron and Steel Works**, Zaporizhzhia Ferroalloys, Metalen Yenakieve**, Makiivka Iron and Steel Works, Donetsk Metal-Rolling Works**, ISTIL-DMZ**, Yenakieve Iron and Steel Works, Silur Khartsyzsk**, Stakhanov Ferroalloys, Kremenchuk Steel Works, Zaporizhzhia Abrasive Plant, Energomashspetsstal Kramatorsk. **Business start-ups. Source: Author’s calculations on the basis of Ukrainian Investment Gazette, Top 100: Reiting luchshykh kompanii Ukrainy 2001 (Kyiv: Ukrainskaia Investitsionnaia Gazeta, May 2001); Ukrainian Investment Gazette, Top 100: Reiting luchshykh kompanii Ukrainy 2002 (Kyiv: Ukrainskaia Investitsionnaia Gazeta, June 2002); Ukrainian Investment Gazette, Top 100: Reiting luchshykh kompanii Ukrainy (Kyiv: Ukrainskaia Investitsionnaia Gazeta, June 2003).
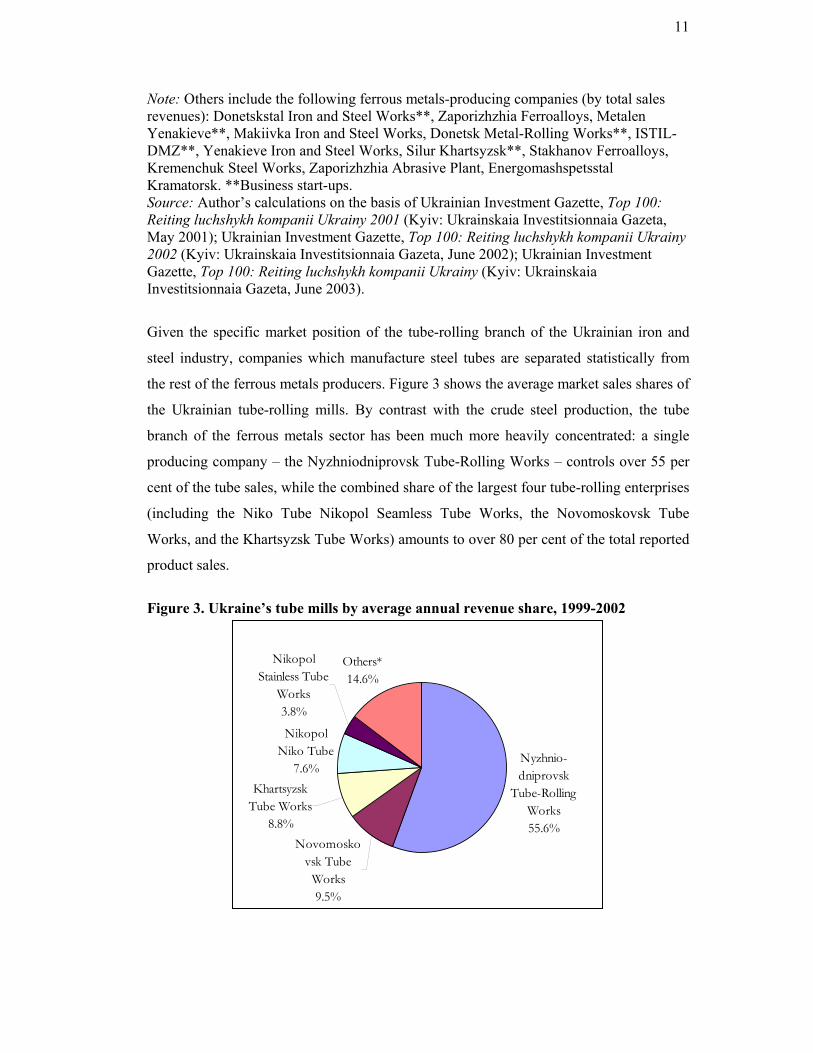
Given the specific market position of the tube-rolling branch of the Ukrainian iron and
steel industry, companies which manufacture steel tubes are separated statistically from
the rest of the ferrous metals producers. Figure 3 shows the average market sales shares of
the Ukrainian tube-rolling mills. By contrast with the crude steel production, the tube
branch of the ferrous metals sector has been much more heavily concentrated: a single
producing company – the Nyzhniodniprovsk Tube-Rolling Works – controls over 55 per
cent of the tube sales, while the combined share of the largest four tube-rolling enterprises
(including the Niko Tube Nikopol Seamless Tube Works, the Novomoskovsk Tube
Works, and the Khartsyzsk Tube Works) amounts to over 80 per cent of the total reported
product sales.
Figure 3. Ukraine’s tube mills by average annual revenue share, 1999-2002
Nyzhnio-dniprovsk
Tube-Rolling Works55.6%
Nikopol Niko Tube
7.6%
Others*14.6%
Novomoskovsk Tube
Works9.5%
Khartsyzsk Tube Works
8.8%
Nikopol Stainless Tube
Works3.8%

12
*Note: Others include Nikopol Pivdennyi Tube Mill, Dnipropetrovsk Comintern Iron and Steel Works, Nikopol UTIST Steel Tube Mill, Dnipropetrovsk Tube Mill, Sumy Frunze Weighted Boring Tube Works, Luhansk Tube Works. Source: Author’s calculations on the basis of Ukrainian Investment Gazette, Top 100: Reiting luchshykh kompanii Ukrainy 2001 (Kyiv: Ukrainskaia Investitsionnaia Gazeta, May 2001); Ukrainian Investment Gazette, Top 100: Reiting luchshykh kompanii Ukrainy 2002 (Kyiv: Ukrainskaia Investitsionnaia Gazeta, June 2002); Ukrainian Investment Gazette, Top 100: Reiting luchshykh kompanii Ukrainy (Kyiv: Ukrainskaia Investitsionnaia Gazeta, June 2003).
This overview of the Ukrainian iron and steel industry is concluded with an assessment of
the key element of the industry’s market structure - its concentration. I have aggregated
the annual gross revenue data of the Ukrainian ferrous metal-producing companies to
examine whether the industry is dominated by a small number of large firms or made up
of many small firms and what is the present degree of industrial concentration? Figure 4
covers Ukraine’s iron and steel- producing companies and excludes iron and manganese
ore mines, coal coking plants, and other raw materials firms. It shows that the Ukrainian
ferrous metals sector has been characterised by a low level of industrial enterprise
concentration. In 2002, the largest five steel companies accounted for 59 per cent of the
total steel sales, while the gross revenue share of the top ten firms was 80 per cent of
Ukraine’s crude steel production.
Figure 4. The industrial concentration of the Ukrainian ferrous metals production, 2002
Top five companies
59.2%
Top ten companies
80.1%
The remainder
19.9%
0%
25%
50%
75%
100%
dom
estic
pro
duct
ion
shar
e
The second five:Alchevsk,Donetskstal, NikopolFerroalloys,NyzhniodniprovskTube Works,Donetsk Iron and
The first five:Kryvorizhstal,Mariupol Illich,Azovstal,Zaporizhstal,Dniprodzerzhynsk
Source: Author’s calculations on the basis of Ukrainian Investment Gazette, Top 100: Reiting luchshykh kompanii Ukrainy (Kyiv: Ukrainskaia Investitsionnaia Gazeta, June 2003).

13
The overall number of functioning iron and steel works, tube mills, ferroalloys factories,
and other ferrous metal-producing enterprises – big enough to have an impact on the
market – currently exceeds thirty. Moreover, during the post-communist transformation,
Ukraine’s ferrous metals sector on the whole has experienced some fragmentation, which
was accompanied by a massive wave of newly-established iron and steel businesses,
primarily in the field of steel products marketing and export facilitation. By the end of
2002, there were 2538 small firms** and 600 large companies registered in Ukraine as
commercial entities under the institutional classification section of ‘manufacture of basic
metals and metal products’ (author’s calculations on the basis of Ukrainian State Statistics
Committee 2003: Tables 7.4 and 14.37).
PERFORMANCE
Having overviewed the general characteristics of the Ukrainian ferrous metals industry,
this paper turns now towards examining the economic performance of the sector during
the post-communist transformation. There are three core issues that this section is focused
on. Firstly, it examines the growth trajectory of the Ukrainian ferrous metals output and
market sales. Secondly, the corporate and export performance of the Ukrainian iron and
steel producers is explored. Consequently, the section turns to the efficiency,
productivity, and profitability patterns of the Ukrainian iron and steel industry. Finally,
the issue of the industry’s stability is discussed.
INDUSTRIAL GROWTH
The post-communist transformation has made an enormous impact on the Ukrainian iron
and steel industry. Figure 5 shows that within the first five years of Ukraine’s newly-
gained independence, the production of ferrous metals plummeted by almost 60 per cent.
This sharp output decline affected the entire range of the ferrous metals produced in the
country, extending from pig iron, crude steel and rolled metals, to steel strips and tubes.
The output collapse was the most dramatic in the tube-rolling branch of the industry,
where the steel tube production suffered an almost 80 per cent decline (see Figure 6). ** According to the Ukrainian legislation, small firms are those which employ less than 50 employees and have the total annual turnover of less than 0.5 million euro.

14
Figure 5. Ukraine’s ferrous metals production, absolute volume, 1985-2003
0
5
10
15
20
25
30
35
40
45
50
55
60
1985 90 91 92 93 94 95 96 97 98 99
2000 01 02 03
mil
lion
ton
nes
Pig iron Crude steel Finished rolled ferrous metals
Source: Ukrainian State Statistics Committee, Statystychnyi shchorichnyk Ukrainy za 1995 rik (Kyiv: Technical, 1996); Ukrainian State Statistics Committee, Statystychnyi shchorichnyk Ukrainy za 2000 rik (Kyiv: Technical, 2001); Ukrainian State Statistics Committee, Statystychnyi shchorichnyk Ukrainy za 2002 rik (Kyiv: Technical, 2003); and author’s calculations on the basis of Ukrainian State Statistics Committee, Vyrobnytstvo osnovnykh vydiv promyslovoi produktsii po misiatsiakh 2003 roku; available at http://www.ukrstat.gov.ua/operativ/operativ2003/pr/ovp/ovp_u/arh_ovp.html.
In the second half of the 1990s, the Ukrainian iron and steel industry began to show some
visible signs of recovery. Since 1996, all major ferrous metal products manufactured in
Ukraine, especially finished steel products, have been indicating strong output growth
trends in absolute volume terms. Moreover, Figure 5 shows that the revival of Ukraine’s
ferrous metals output has only been mildly affected by the subsequent Asian and Russian
economic crises of 1997-1998. Since Russia’s gas and oil giants remain the key
consumers of Ukrainian steel tubes, Ukraine’s tube-rolling mills have appeared to be the
main victim of the Russian financial turmoil of 1998. However, as Figure 6 shows, the
problematic environment of the world markets notwithstanding, the Ukrainian production
of steel tubes has recently recovered to one-third of its pre-transition output level.

15
Figure 6. Ukraine’s steel tube production, 1985-2003
00.5
11.5
22.5
33.5
44.5
55.5
66.5
77.5
1985 90 91 92 93 94 95 96 97 98 992000 01 02 03
mill
ion
tonn
es
Steel tubes Source: Ukrainian State Statistics Committee, Statystychnyi shchorichnyk Ukrainy za 1995 rik (Kyiv: Technical, 1996); Ukrainian State Statistics Committee, Statystychnyi shchorichnyk Ukrainy za 2000 rik (Kyiv: Technical, 2001); Ukrainian State Statistics Committee, Statystychnyi shchorichnyk Ukrainy za 2002 rik (Kyiv: Technical, 2003); and author’s calculations on the basis of Ukrainian State Statistics Committee, Vyrobnytstvo osnovnykh vydiv promyslovoi produktsii po misiatsiakh 2003 roku; available at http://www.ukrstat.gov.ua/operativ/operativ2003/pr/ovp/ovp_u/arh_ovp.html.
The recovery of the Ukrainian iron and steel industry has preceded the overall revival of
Ukraine’s economy by at least three years. Already in 1996, the Ukrainian steel industry
recorded a 12 per cent annual sales increase. An 8 per cent growth followed in 1997. In
1998, however, the Russian financial crisis, the ensuing loss of export contracts, and,
most importantly, the extensive depreciation of the Ukrainian currency resulted in a 7
percent decline of the Ukrainian steel industry’s sales. The ferrous metals output in
absolute volume terms did not decline to such an extent. Figure 7 illustrates another
feature of the Ukrainian iron and steel industry’s economic performance during the post-
communist transformation, namely its deeper output slump, even if compared with the
overall industrial sector’s trajectory. By the end of 1995, Ukraine’s ferrous metals
industry had lost 59 per cent of its pre-transition production, whereas the corresponding
figure for the entire industrial sector was 48 per cent. On the whole, in contrast to the
experience of other heavily industrialised Central and Eastern European countries, the
post-communist transformation has led to a distinct V-shaped response of the Ukrainian
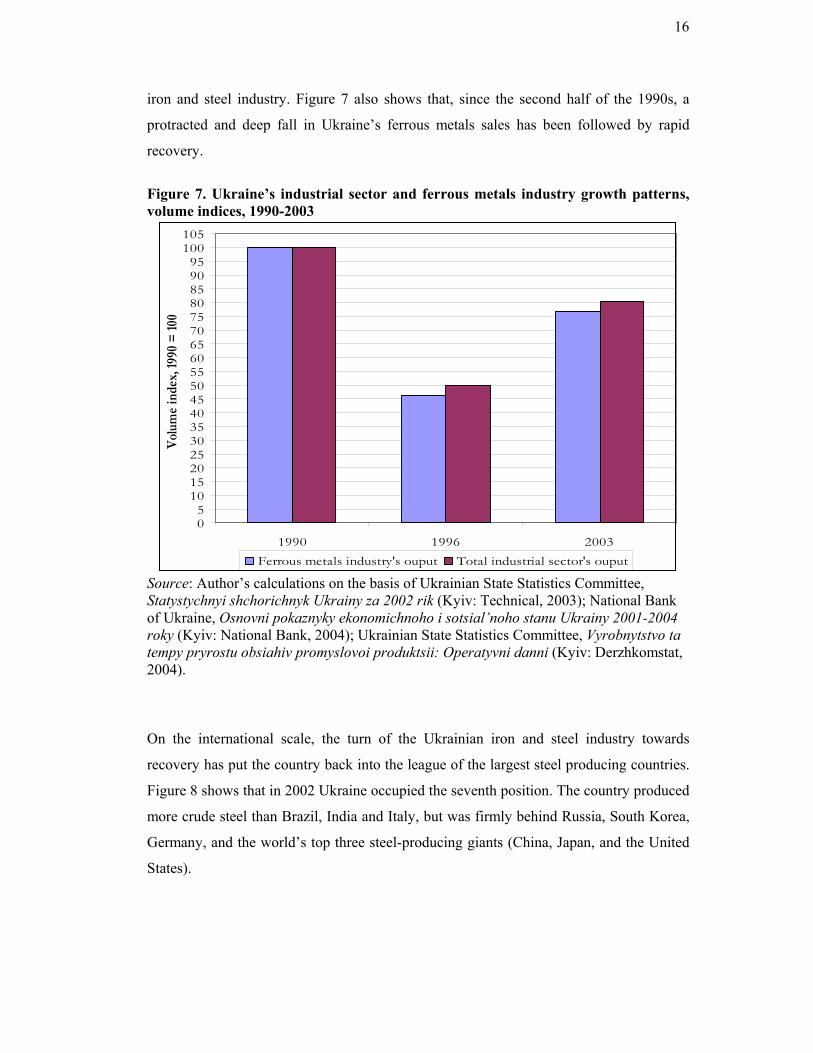
16
iron and steel industry. Figure 7 also shows that, since the second half of the 1990s, a
protracted and deep fall in Ukraine’s ferrous metals sales has been followed by rapid
recovery.
Figure 7. Ukraine’s industrial sector and ferrous metals industry growth patterns, volume indices, 1990-2003
05
101520253035404550556065707580859095
100105
1990 1996 2003
Vol
ume
inde
x, 19
90 =
100
Ferrous metals industry's ouput Total industrial sector's ouput Source: Author’s calculations on the basis of Ukrainian State Statistics Committee, Statystychnyi shchorichnyk Ukrainy za 2002 rik (Kyiv: Technical, 2003); National Bank of Ukraine, Osnovni pokaznyky ekonomichnoho i sotsial’noho stanu Ukrainy 2001-2004 roky (Kyiv: National Bank, 2004); Ukrainian State Statistics Committee, Vyrobnytstvo ta tempy pryrostu obsiahiv promyslovoi produktsii: Operatyvni danni (Kyiv: Derzhkomstat, 2004).
On the international scale, the turn of the Ukrainian iron and steel industry towards
recovery has put the country back into the league of the largest steel producing countries.
Figure 8 shows that in 2002 Ukraine occupied the seventh position. The country produced
more crude steel than Brazil, India and Italy, but was firmly behind Russia, South Korea,
Germany, and the world’s top three steel-producing giants (China, Japan, and the United
States).

17
Figure 8. The major steel-producing countries, 2002
Crude steel production
0102030405060708090
100110120130140150160170180190200
ChinaJap
an
United S
tates
Russia
South
Korea
Germany
Ukraine
Brazil
India
ItalyFran
ce
TaiwanTurk
eySp
ain
Canada
Mexico
United K
ingdo
mBelg
ium
South
AfricaPola
nd
mil
lion
ton
nes
Source: International Iron and Steel Institute, Steel Statistical Yearbook 2003 (Brussels: IISI, 2004); International Iron and Steel Institute, World Steel in Figures: 2003 Edition (Brussels: IISI, 2003).
EXPORTS GROWTH
The apparent recovery of Ukraine’s ferrous metals sector has been propelled by a
remarkable export expansion. Between 1990 and 2002, Ukraine’s share in the world steel
production halved to 4 per cent. Notwithstanding, by the late 1990s, Ukraine became one
of the world’s top three major steel-exporting countries. Table 3 indicates that
considering net export figures, Ukraine has almost become the world’s second largest
steel exporter. Moreover, according to the national statistical account, in 2002, Ukraine
exported 32 million tonnes of ferrous metals – the second largest amount of steel exports
in the world after Japan. On the whole, the Ukrainian iron and steel companies have been
exporting between 75 and 80 per cent of the domestically produced steel. Several
Ukrainian iron and steel works have recently appeared in the league of the world’s largest
steel exporting companies.

18
Table 3. The major exporters and importers of steel, million tonnes, 2002 Rank Total exports Rank Total imports1 Japan 35.2 1 United States 30.2 2 Russia 27.7 2 China 29.2 3 Ukraine 25.9 3 Germany 17.8 4 Germany 24.7 4 Italy 16.6 5 Belgium-Luxembourg 20.3 5 France 15.8 6 France 17.6 6 South Korea 14.1 7 South Korea 12.9 7 Belgium-Luxembourg 10.9 8 Brazil 11.8 8 Taiwan 10.9 9 Italy 11.4 9 Spain 10.4 10 Turkey 11.0 10 Thailand 9.8 11 Taiwan 8.8 11 United Kingdom 8.9 12 Netherlands 7.2 12 Hong Kong 7.9 13 China 6.8 13 Canada 7.7 14 United Kingdom 6.6 14 Turkey 6.6 15 Spain 6.3 15 Mexico 5.8 World Total 317.4 World Total 310.1 Rank Net exports (exports-imports) Rank Net imports (imports-exports)1 Japan 31.9 1 United States 24.6 2 Russia 25.54 2 China 22.4 3 Ukraine 25.52 3 Hong Kong 5.4 4 Brazil 11.0 4 Thailand 8.2 5 Belgium-Luxembourg 9.4 5 Italy 5.2 6 Germany 6.9 6 Iran 4.5 7 Turkey 4.3 7 Spain 4.1 8 Kazakhstan 3.7 8 Vietnam 4.6 9 South Africa 3.0 9 United Arab Emirates 2.9 10 Austria 2.4 10 Malaysia 2.8 11 Romania 2.4 11 Portugal 2.5 12 Argentina 2.2 12 Indonesia 2.4 13 Venezuela 2.0 13 Singapore 2.38 14 India 1.8 14 United Kingdom 2.2 15 Netherlands 1.7 15 Philippines 1.7 Note: Some of the IISI data in this table are based on exporters’ figures and understate the actual volume of imports. Source: Author’s calculations on the basis of International Iron and Steel Institute, Steel Statistical Yearbook 2003 (Brussels: IISI, 2004); International Iron and Steel Institute, World Steel in Figures: 2003 Edition (Brussels: IISI, 2003).
The role of steel exports for the Ukrainian economy has been steadily increasing (see
Figure 9). Between 1994 and 2002, the share of base metals and metal products – the key
component of the statistical category of ‘manufactured goods, classified chiefly by
material’ – in Ukraine’s total merchandise exports expanded from 39.5 to 44.6 per cent
(or from US$ 3,721 million to US$ 7,126 million). In the course of the post-communist
transformation, steel products have become the single largest Ukrainian export

19
commodity, accounting in 2002 for 30 per cent of the country’s total merchandise exports
and worth US$ 5,300 million.
Figure 9. The break-down of the Ukrainian merchandise exports, 1994-2002
Ukraine: exports structure
10.1 11.8 11.4
10.9 10 12.50.6 0.9 1.913.7 13.2 9.3
39.543.9 44.6
21.9 13.9 13.6
3.3 4 5.60 2.3 1.1
0
25
50
75
100
1994 1997 2002
per
cen
tag
e sh
are
of e
xpor
ts
Articles nonclassifiedelsewhereMiscellaneousmanuf. articles
Machinery andtransportequipmentManufacturedgoods, classif. bymaterialChemical products
Oils, fats andwaxes
Crude materials,minerals andenergyFood and liveanimals, drink andtobacco
Source: Author’s calculations on the basis of Ukrainian State Statistics Committee, Statystychnyi shchorichnyk Ukrainy za 1994 rik (Kyiv: Technical, 1995); Ukrainian State Statistics Committee, Statystychnyi shchorichnyk Ukrainy za 1999 rik (Kyiv: Technical, 2000); Ukrainian State Statistics Committee, Statystychnyi shchorichnyk Ukrainy za 2002 rik (Kyiv: Technical, 2003).
Figure 10 shows the major geographical destinations of Ukraine’s merchandise exports.
The primary targets for the Ukrainian steel export are China, the countries of South-East
Asia, Russia and the former Soviet Union, Eastern Europe, and some EU member states.
The rest of the world appears to be of secondary importance, as the great bulk of the
Ukrainian steel export has been barred from the U.S. market. Although the data on the
geographical distribution of ferrous metals exported from Ukraine are not widely
available, it is contended that the illustration provided in Figure 10 is rather accurate in
this regard.

20
Figure 10. The major destinations of Ukrainian merchandise exports, 1994-2002
57.7
35.127.3
19.0
29.833.3
18.0
23.7 28.2
0.74.4 5.9
3.9 4.5 3.40.7 2.4 1.80.0 0.1 0.1
0
20
40
60
80
100
1994 1998 2002
Merchandise exports
perc
enta
ge o
f tot
al e
xpor
ts
Australia andOceania
South America andthe Caribbean
North America
Africa
Asia
Europe
Former USSR
Source: Author’s calculations on the basis of Ukrainian State Statistics Committee, Statystychnyi shchorichnyk Ukrainy za 1994 rik (Kyiv: Technical, 1995); Ukrainian State Statistics Committee, Statystychnyi shchorichnyk Ukrainy za 1999 rik (Kyiv: Technical, 2000); Ukrainian State Statistics Committee, Statystychnyi shchorichnyk Ukrainy za 2002 rik (Kyiv: Technical, 2003).
CORPORATE PERFORMANCE
The overall examination of the Ukrainian iron and steel industry’s growth and export
patterns under post-communism would be incomplete without an analysis of its corporate
performance. Therefore, in this subsection the industrial output trends are disaggregated
according to sales and export revenues of different iron and steel-producing companies.
By separating the Ukrainian producers of ferrous metals by size, one can see more clearly
the difference in scale between them as well as what type of companies has been behind
the recent industrial recovery. Figure 11 shows the gross revenue growth figures reported
by Ukraine’s largest iron and steel works, while the market sales performance of the
small producers of ferrous metals is provided in Figure 12.

21
Figure 11. Ukraine’s large ferrous metals companies, gross revenue growth, 1999-2002
Kryvorizhstal
Mariupol Illich
AzovstalZaporizhstal
DniprodzerzhynskAlchevsk
Nikopol FerroalloysNyzhniodniprovsk
DonetskDnipropetrovk PetrovkaDniprospetsstalZaporizhzhia
Ferroalloys Metalen YenakieveMakiivka KirovYenakieve ISTIL-DMZ
0
1,000,000
2,000,000
3,000,000
4,000,000
5,000,000
6,000,000
1999 2000 2001 2002
Uk
rain
ian
hry
vnia
Kryvorizhstal Mariupol Illich AzovstalZaporizhstal Dniprodzerzhynsk AlchevskNikopol Ferroalloys Nyzhniodniprovsk DonetskDnipropetrovk Petrovka Dniprospetsstal Zaporizhzhia FerroalloysMetalen Yenakieve Makiivka Kirov ISTIL-DMZYenakieve Donetskstal Average sales revenue
Source: Author’s calculations on the basis of Ukrainian Investment Gazette, Top 100: Reiting luchshykh kompanii Ukrainy 2001 (Kyiv: Ukrainskaia Investitsionnaia Gazeta, May 2001); Ukrainian Investment Gazette, Top 100: Reiting luchshykh kompanii Ukrainy 2002 (Kyiv: Ukrainskaia Investitsionnaia Gazeta, June 2002); Ukrainian Investment Gazette, Top 100: Reiting luchshykh kompanii Ukrainy (Kyiv: Ukrainskaia Investitsionnaia Gazeta, June 2003). The first remarkable corporate feature of the post-communist transformation of the
Ukrainian iron and steel industry has been the massive difference in sales revenues.
Figure 11 shows that in 2002, the annual gross revenue of an average large Ukrainian
steel company approached 2 billion hryvnia (over US$ 370 million), while each of the
two steel giants – Kryvorizhstal and Mariupol Illich – sold steel products worth well over
US$ 1 billion. Figure 12 indicates that the corresponding figure for Ukraine’s small steel
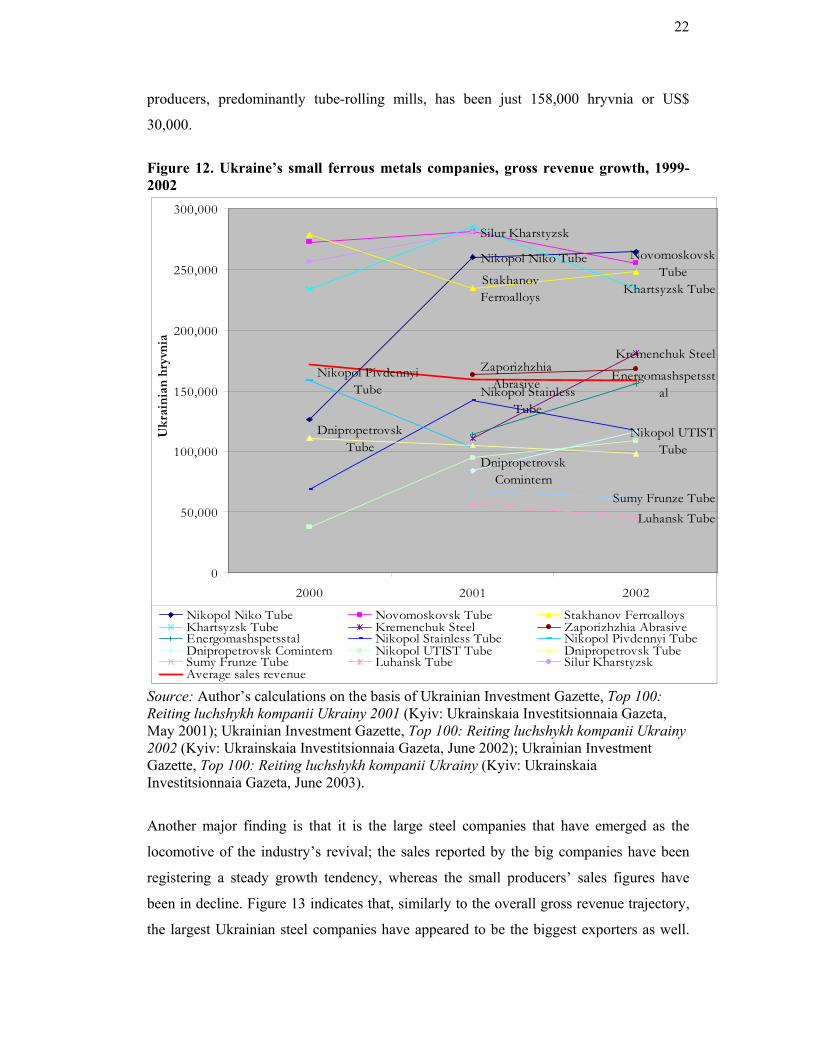
22
producers, predominantly tube-rolling mills, has been just 158,000 hryvnia or US$
30,000.
Figure 12. Ukraine’s small ferrous metals companies, gross revenue growth, 1999-2002
Nikopol Niko Tube Novomoskovsk TubeStakhanov
Ferroalloys Khartsyzsk Tube
Kremenchuk SteelZaporizhzhia
Abrasive EnergomashspetsstalNikopol Stainless
Tube
Nikopol Pivdennyi Tube
Dnipropetrovsk Comintern
Nikopol UTIST Tube
Dnipropetrovsk Tube
Sumy Frunze TubeLuhansk Tube
Silur Kharstyzsk
0
50,000
100,000
150,000
200,000
250,000
300,000
2000 2001 2002
Ukr
aini
an h
ryvn
ia
Nikopol Niko Tube Novomoskovsk Tube Stakhanov FerroalloysKhartsyzsk Tube Kremenchuk Steel Zaporizhzhia AbrasiveEnergomashspetsstal Nikopol Stainless Tube Nikopol Pivdennyi TubeDnipropetrovsk Comintern Nikopol UTIST Tube Dnipropetrovsk TubeSumy Frunze Tube Luhansk Tube Silur KharstyzskAverage sales revenue
Source: Author’s calculations on the basis of Ukrainian Investment Gazette, Top 100: Reiting luchshykh kompanii Ukrainy 2001 (Kyiv: Ukrainskaia Investitsionnaia Gazeta, May 2001); Ukrainian Investment Gazette, Top 100: Reiting luchshykh kompanii Ukrainy 2002 (Kyiv: Ukrainskaia Investitsionnaia Gazeta, June 2002); Ukrainian Investment Gazette, Top 100: Reiting luchshykh kompanii Ukrainy (Kyiv: Ukrainskaia Investitsionnaia Gazeta, June 2003).
Another major finding is that it is the large steel companies that have emerged as the
locomotive of the industry’s revival; the sales reported by the big companies have been
registering a steady growth tendency, whereas the small producers’ sales figures have
been in decline. Figure 13 indicates that, similarly to the overall gross revenue trajectory,
the largest Ukrainian steel companies have appeared to be the biggest exporters as well.

23
However, most recently, the export sales have not been growing as fast as the overall
market sales. Moreover, except for the constantly expanding Kryvorizhstal Iron and Steel
Combine and the other four largest companies, the sales performance of the majority of
Ukraine’s steel firms has been rather erratic. This tendency can be observed most vividly
in the field of exports as illustrated in Figure 13.
Figure 13. Ukraine’s iron and steel companies export growth, 1999-2002
Kryvorizhstal
Mariupol Illich
Azovstal
Zaporizhstal
Dniprodzerzhynsk
Donetsk
Makiivka
AlchevskNikopol
NyzhniodPetrovka
Dn.spetsstalZaporizh
MetalISTIL-DMZ
Yenak
NovomoskStakhanovKhartsyz
$0
$100,000,000
$200,000,000
$300,000,000
$400,000,000
$500,000,000
$600,000,000
$700,000,000
$800,000,000
$900,000,000
$1,000,000,000
1999 2000 2001 2002Kryvorizhstal Mariupol Illich AzovstalZaporizhstal Dniprodzerzhynsk AlchevskNikopol Ferroalloys Nyzhniodniprovsk Tube DonetskDnipropetrovsk Petrovka Dniprospetsstal Zaporizhzhia FerroalloysMetalenYenakieve Makiivka ISTIL-DMZYenakieve Novomoskovsk Tube Stakhanov FerroalloysKhartsyzsk Tube Average exports trend line
Source: Author’s calculations on the basis of Ukrainian Investment Gazette, Top 100: Reiting luchshykh kompanii Ukrainy 2001 (Kyiv: Ukrainskaia Investitsionnaia Gazeta, May 2001); Ukrainian Investment Gazette, Top 100: Reiting luchshykh kompanii Ukrainy 2002 (Kyiv: Ukrainskaia Investitsionnaia Gazeta, June 2002); Ukrainian Investment Gazette, Top 100: Reiting luchshykh kompanii Ukrainy (Kyiv: Ukrainskaia Investitsionnaia Gazeta, June 2003).
24
Thus, the disaggregated data analysed in this subsection allow for the following
conclusions. First of all, the overall sales performance of the Ukrainian iron and steel
companies has generally corresponded with the overall industry’s recovery and economic
growth in Ukraine. However, while the production of major ferrous metals has been
steadily increasing in absolute volume as well as in terms of sales since 1996, the annual
revenues and export performance of the majority of the Ukrainian steel companies have
been rather erratic. A small number of ferrous metals companies have recently taken the
leading market positions, whereas the majority of Ukraine’s steel companies have been
lagging far behind, and some are in an apparent decline.
EFFICIENCY
Industrial growth understood as an increase in the volume of output or sales is the first
criterion of a sector’s economic performance. Another essential criterion for the
assessment of industrial performance is efficiency. Economics is primarily focused on an
abstract Pareto-optimal efficiency of perfect competition, where ‘no one could be made
better off without making someone else worse off’. Three are three types of economic
efficiency discussed in the literature. Roughly defined, the first type is productive
efficiency, in which the output of the industry is produced at the lowest cost. The second
is allocative efficiency, in which resources are allocated to the production of the goods
and services the society requires. The third is distributional efficiency, in which output is
distributed in such a way that consumers would not wish – within their disposable income
and market price constraints – to spend these incomes in a different way (Bannock,
Baxter, and Davis 1992: 127).
As economists emphasise, maximum economic efficiency can exist only in an ideal-type
economy, in which perfect competition characterise every sector. By focusing on the
efficiency of the real-world economic system, one aims at measuring the effectiveness
with which a system uses its resources at a given time (static efficiency) or through time
(dynamic efficiency). It is also important to understand different growth experiences,
while studying economic systems. As Gregory and Stuart have emphasised:
Economic growth and dynamic efficiency are not the same. The output of a system may grow by increasing efficiency (finding better ways of doing things with the same resources) or by expanding the amount of, say, labour

25
but using that labour at a constant rate of effectiveness. The former is often termed intensive growth, the latter extensive growth (1999: 44).
It is very difficult to measure economic efficiency, given the technological complexity of
the modern manufacturing as well as the lack of data needed to analyse all the types of
efficiency both in static and dynamic terms. Furthermore, the allocative and distributional
aspects of economic efficiency are typically attributed to a country’s economy as whole
rather than to a specific sector or an industry. This research paper’s approach is to focus
on the productive efficiency of the Ukrainian iron and steel industry, which is evaluated
comparatively on the ‘output per employee’ basis as well as in terms of enterprise
profitability. As in the previous part of the paper, this section uses the statistical data set
which has been specifically assembled to reveal the performance patterns of Ukraine’s
ferrous metals industry during the post-communist transformation.
Figure 14 provides the data on labour productivity in a number of the world’s largest
steel-producing countries. Various differences in coverage and definition of ‘employment
in the steel industry’ exist: in some countries the entire ferrous metals industry’s
workforce is included, while in other countries the steel industry’s employment covers
only the shop floor. Furthermore, some national statistical agencies provide the
employment data for the ferrous metals sector, whilst other agencies cover the
employment in the ‘manufacturing of base metals and metal products’, which include
non-ferrous metals as well. Given the International Iron and Steel Institute’s own
conclusion that ‘inter-country comparisons are of dubious value’ (2003: 19), one has to be
cautious in this regard. The labour productivity data on Ukraine and Poland presented in
Figure 14 are directly comparable as they have been gathered specially for this paper
following the analogous techniques. The productivity figures for other major steel-
producing countries were calculated on the basis of the steel employment data provided
by the IISI. Figure 14 shows that labour productivity in the two East European steel
industries has been significantly lower throughout the entire period than in any other
major steel industry, for which the data are available. Even after a considerable recovery
in labour productivity terms which has been achieved in Ukraine since 1995, the average
Ukrainian steel worker produces currently only 70 per cent of his 1990 output level.
Comparing to the ferrous metals sector in the other countries, the average Ukrainian steel
worker produces only 76 per cent of the average Polish steel worker’s output, 18 per cent
of the average Brazilian steel worker’s output, 14 per cent of the average EU steel

26
worker’s output, 11 per cent of the U.S. output per worker level, and 10 per cent of the
average South Korean steel worker’s output.
Figure 14. Crude steel production per employee, 1990, 1995, 2002
Labour productivity
050
100150200250300350400450500550600650700750800
1990
1995
2002
1990
1995
2002
1995
2002
1995
2002
1995
2002
1995
2002
1995
2002
1995
2002
1995
2002
1995
2002
Ukraine Poland CanadaAustralia Brazil SouthAfrica
EU Japan USA SouthKorea
crud
e st
eel o
utpu
t per
1 e
mpl
oyee
, ton
nes
Source: Author’s calculations on the basis of Ukrainian State Statistics Committee, Statystychnyi shchorichnyk Ukrainy za 1999 rik (Kyiv: Technical, 2000); Ukrainian State Statistics Committee, Statystychnyi shchorichnyk Ukrainy za 2002 rik (Kyiv: Technical, 2003); Polish Central Statistical Office, Statistical Yearbook of the Republic of Poland 2000 (Warsaw: GUS, 2001); Polish Central Statistical Office, Statistical Yearbook of the Republic of Poland 2002 (Warsaw: GUS, 2003); International Iron and Steel Institute, Steel Statistical Yearbook 2003 (Brussels: IISI, 2004); International Iron and Steel Institute, World Steel in Figures: 2003 Edition (Brussels: IISI, 2003).
Whether a firm makes a profit or a loss is regarded as the second signal of its productive
efficiency. The evolution of profitability rates (understood here formally as total sales
revenue minus total production costs) of the Ukrainian iron and steel industry is given in
Figure 15. Here the steel industry characteristics are contrasted with the profitability
trends of Ukraine’s overall industrial sector. On the whole, the Ukrainian iron and steel
industry during the post-communist transformation has been characterised by mediocre
and falling profitability rates. It is believed that very high industrial profitability rates of
the early 1990s should be regarded with some caution. Following the price liberalisation,
the producer prices rose in 1992 by a staggering 4,229 per cent, while the consumer price

27
index inflation that year was 2,100 per cent. In 1993, the producer price index was up by
9,768 per cent, whereas the CPI inflation rose to 10,256 per cent. In such an unstable
environment, Ukraine’s industrial enterprises were able to acquire bank credits under
what appeared to be effectively negative interest rates. For example, between 1992 and
1993, the amount of commercial credit debts had grown by 28 times. Figure 15
demonstrates that the profitability patterns of the industrial sector and its steel branch
have been roughly similar. Notwithstanding the generally dubious profitability data due to
profit underreporting practices, which are wide-spread in most of the post-communist
economies, Figure 15 also shows until very recently that the profitability of the Ukrainian
ferrous metals industry has fallen considerably and that the production of ferrous metals
has been less profitable than the production of other industrial goods. Moreover, the steel
manufacturers made no profits in 1997 and even registered a loss the following year. At
the very end of the 1999, the Ukrainian ferrous metals companies returned to profit-
making.
Figure 15. Ukraine’s annual industrial profitability trends, 1992-2002
-5%
0%
5%
10%
15%
20%
25%
30%
35%
40%
1992 95 96 97 98 99 2000 01 02
annu
al re
port
ed g
ross
pro
fit (=
sale
s-co
sts)
Iron & steel industry Total industrial sector
Source: Ukrainian State Statistics Committee, Statystychnyi shchorichnyk Ukrainy za 1999 rik (Kyiv: Technical, 2000); Ukrainian State Statistics Committee, Statystychnyi shchorichnyk Ukrainy za 2002 rik (Kyiv: Technical, 2003).
Figure 16 provides the latest available disaggregate statistics concerning the profit figures
reported by the largest Ukrainian iron and steel companies. It shows that all but two large

28
steel companies have registered a massive rise in profits in 2000, with an average gross
profit figure approaching 250,000 hryvnia (or US$ 46,000). Nevertheless, from 2001
onward the reported profits of all the companies have been falling yet again.
Figure 16. Ukraine’s large steel companies, reported gross profits, 1999-2002
-400,000
-300,000
-200,000
-100,000
0
100,000
200,000
300,000
400,000
500,000
600,000
700,000
800,000
900,000
1,000,000
1,100,000
1999 2000 2001 2002
Ukr
aini
an h
ryvn
ia
Kryvorizhstal Mariupol IllichAzovstal ZaporizhstalDzerzhynsky AlchevskNikopol Ferroalloys NyzhniodniprovskDonetsk PetrovskyDniprospetsstal Zaporizhzhia FerroalloysMetalen Enakieve MakiivkaISTIL-DMZ EnakieveDonetskstal Average profitsAverage profits trend line
Source: Author’s calculations on the basis of Ukrainian Investment Gazette, Top 100: Reiting luchshykh kompanii Ukrainy 2001 (Kyiv: Ukrainskaia Investitsionnaia Gazeta, May 2001); Ukrainian Investment Gazette, Top 100: Reiting luchshykh kompanii Ukrainy 2002 (Kyiv: Ukrainskaia Investitsionnaia Gazeta, June 2002); Ukrainian Investment Gazette, Top 100: Reiting luchshykh kompanii Ukrainy (Kyiv: Ukrainskaia Investitsionnaia Gazeta, June 2003).
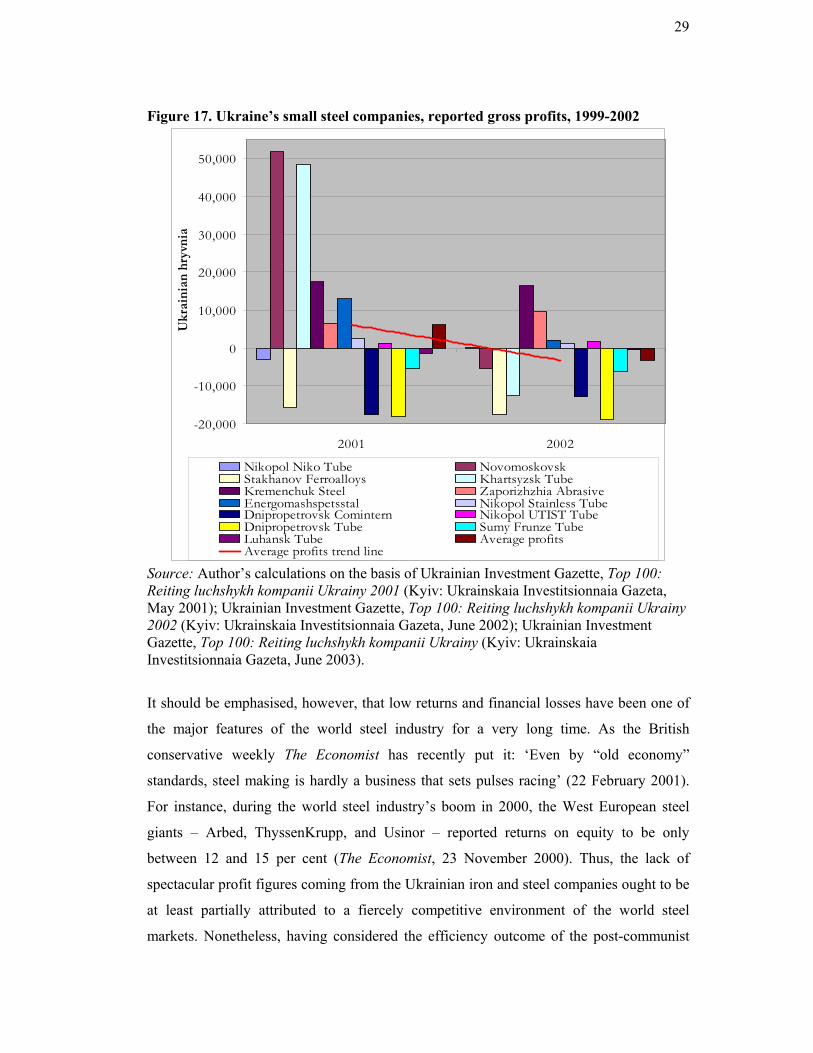
The profit patterns of Ukraine’s smaller ferrous metals companies within the reported
period have been even more dismal. Figure 17 indicates that the profits of Ukraine’s tube-
rolling and ferroalloy-producing mills have not only rapidly declined, but by 2003 the
majority of the smaller companies have been making losses.
29
Figure 17. Ukraine’s small steel companies, reported gross profits, 1999-2002
-20,000
-10,000
0
10,000
20,000
30,000
40,000
50,000
2001 2002
Ukr
aini
an h
ryvn
ia
Nikopol Niko Tube NovomoskovskStakhanov Ferroalloys Khartsyzsk TubeKremenchuk Steel Zaporizhzhia AbrasiveEnergomashspetsstal Nikopol Stainless TubeDnipropetrovsk Comintern Nikopol UTIST TubeDnipropetrovsk Tube Sumy Frunze TubeLuhansk Tube Average profitsAverage profits trend line
Source: Author’s calculations on the basis of Ukrainian Investment Gazette, Top 100: Reiting luchshykh kompanii Ukrainy 2001 (Kyiv: Ukrainskaia Investitsionnaia Gazeta, May 2001); Ukrainian Investment Gazette, Top 100: Reiting luchshykh kompanii Ukrainy 2002 (Kyiv: Ukrainskaia Investitsionnaia Gazeta, June 2002); Ukrainian Investment Gazette, Top 100: Reiting luchshykh kompanii Ukrainy (Kyiv: Ukrainskaia Investitsionnaia Gazeta, June 2003).
It should be emphasised, however, that low returns and financial losses have been one of
the major features of the world steel industry for a very long time. As the British
conservative weekly The Economist has recently put it: ‘Even by “old economy”
standards, steel making is hardly a business that sets pulses racing’ (22 February 2001).
For instance, during the world steel industry’s boom in 2000, the West European steel
giants – Arbed, ThyssenKrupp, and Usinor – reported returns on equity to be only
between 12 and 15 per cent (The Economist, 23 November 2000). Thus, the lack of
spectacular profit figures coming from the Ukrainian iron and steel companies ought to be
at least partially attributed to a fiercely competitive environment of the world steel
markets. Nonetheless, having considered the efficiency outcome of the post-communist
30
transformation, one has to conclude that the overall productive efficiency of the
Ukrainian iron and steel industry has been very low. The reported profit margins of the
overwhelming majority of the steel companies, albeit recovering, are still considerably
narrow; and the average Ukrainian steel worker has not only become one of the least
productive in the world, but he has been producing less output under post-communism
than he used to produce under late state socialism.
STABILITY
In addition to increases in the volume of output that an industry generates over time, and
to effectiveness with which an industrial enterprise utilises its available resources,
stability is considered to be another essential criterion used in assessing economic
performance. This sub-section examines the economic stability of Ukraine’s ferrous
metals sector during the post-communist transformation. The focus here is on the
industry’s trade (or business) cycles, i.e. fluctuations in growth. The trade cycle,
understood as regular fluctuations in the level of income, is a very common economic
phenomenon. Although there exists no general agreement in the economic theory about
the exact cause of cycles, this problem has been well-studied by a large number of
prominent economists, including Kondratieff, Kuznets, Samuelson, Hicks, Goodwin,
Phillips and Kalecki. Since the times of the Great Depression in the early 1930s, most
governments of industrially advanced countries have been trying to develop an economic
policy to reduce the amplitude of the cycle and to stabilise the output on a generally
upward growth trend path. The great output contractions experienced during the initial
stages of the post-communist transformation have heated the theoretical debate and
produced a number of competing approaches. This paper considers possible causes of the
post-communist ‘Great Contraction’ of Ukraine’s ferrous metals sector in the next
section.
With regard to the economic outcomes of the Ukrainian iron and steel industry, there
appears to be two similarly ‘stable’ periods in the industry’s post-communist
development. The production of ferrous metals had been steadily declining during the
first transformation phase, which lasted until 1996. From then onwards the output as well
as the sales of most steel products have been steadily on the rise. Moreover, since the late
1990s, the industry’s most troubled tube-rolling branch has not experienced any major
31
negative growth trajectory. However, if one examines the two distinct output growth
periods jointly, it becomes evident that the performance of the Ukrainian iron and steel
industry during the post-communist 1990s has been particularly uneven: a sharp 59 per
cent decline in production between 1990 and 1995 has been followed by a fast 36
percentage point recovery by 2004, when the Ukrainian ferrous metals sector approached
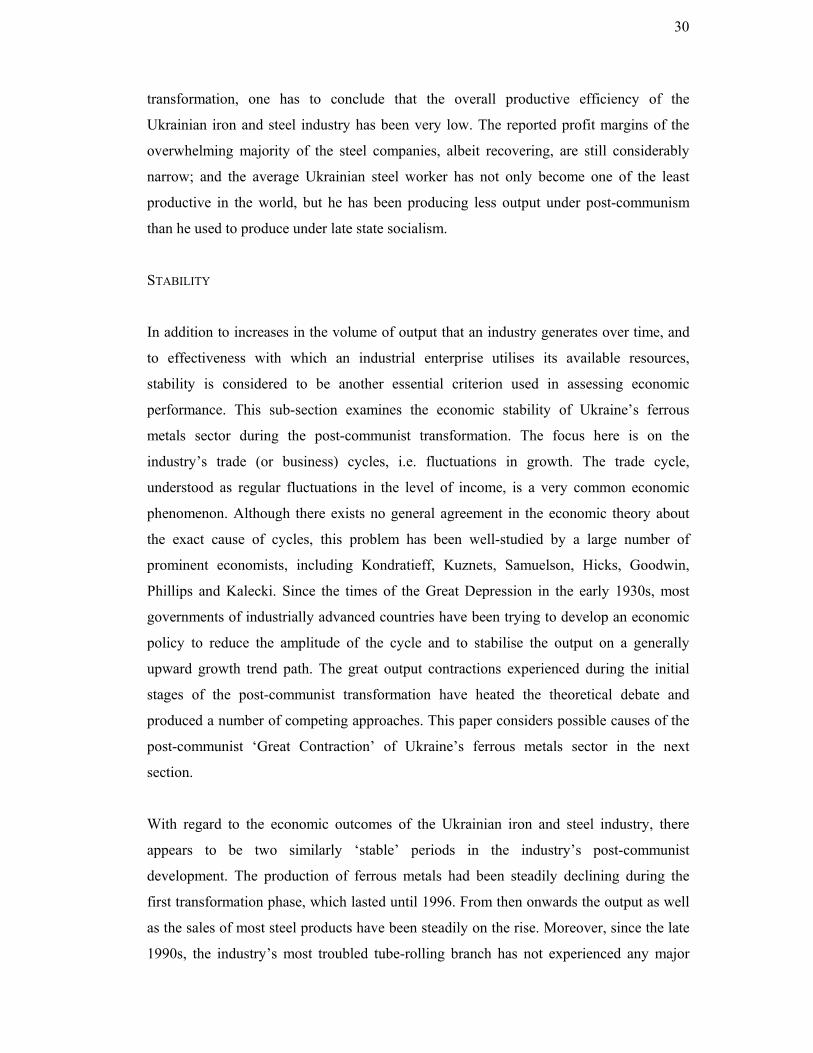
77 per cent of its 1990 production level in monetary terms. Furthermore, Figure 18 clearly
indicates that the recovery of the Ukrainian ferrous metals sector has been rather
unbalanced as well. The annual growth rates have been fluctuating from 8.1 per cent in
1997 to -6.8 per cent in 1998; from 21.3 per cent in 2000 to 3.9 per cent in 2002 and to
19.5 per cent in 2003. Figure 18 also shows that the recovery trajectory of Ukraine’s total
industrial sector has been much steadier. Nonetheless, one should accentuate that since
the second half of the 1990s, the Ukrainian iron and steel industry has followed a
generally upward growth path.
Figure 18. The Ukrainian iron and steel industry’s growth trends, 1996-2003
-10%-8%-6%-4%-2%0%2%4%6%8%
10%12%14%16%18%20%22%24%
1996 1997 1998 1999 2000 2001 2002 2003
annu
al g
row
th
Iron and steel industry Total industrial sectorTotal industry growth trend line Iron and steel industry trend line
Source: Author’s calculations on the basis of Ukrainian State Statistics Committee, Statystychnyi shchorichnyk Ukrainy za 2002 rik (Kyiv: Technical, 2003); National Bank of Ukraine, Osnovni pokaznyky ekonomichnoho i sotsial’noho stanu Ukrainy 2001-2004 roky (Kyiv: National Bank, 2004); Ukrainian State Statistics Committee, Vyrobnytstvo ta tempy pryrostu obsiahiv promyslovoi produktsii: Operatyvni danni (Kyiv: Derzhkomstat, 2004).

32
Another highly unstable feature of the Ukrainian iron and steel industry during the post-
communist transformation has been the corporate profit growth rates. Figure 19 shows
that between 2000 and 2002 Ukraine’s ferrous metals companies reported annual profit
figures ranging from an average growth of 1540 per cent in 2000 to an average 50 per
cent loss in 2001 and 2002. Thus, the era of the post-communist transformation has been
an extremely unstable period for the Ukrainian steel companies’ profits. The sales and
output growth rates, price levels and profit figures have all registered massive declines to
be followed by rather rapid increases both of cyclical and non-cyclical nature.
Figure 19. Annual profit growth reported by Ukraine’s iron and steel companies, 2000-2002
-700%-600%-500%-400%-300%-200%-100%
0%100%200%300%400%500%600%700%800%900%
1000%1100%1200%1300%1400%1500%1600%1700%1800%1900%2000%2100%2200%2300%2400%2500%2600%2700%2800%
2000 2001 2002
year
on
year
gro
wth
of r
epor
ted
prof
its
Kryvorizhstal Mariupol Ilych AzovstalZaporizhstal Dniprodzerzhynsk AlchevskNikopol Ferroalloys Nyzhniodniprovsk Tube DonetskDnipropetrovsk Petrovka Dniprospetsstal Zaporizhzhia FerroalloysMetalen Yenakieve Makiivka Kirov ISTIL-DMZYenakieve Donetskstal Donetsk Metal Rolling
Nikopol Niko Tube Novomoskovsk TubeStakhanov Ferroalloys Khartsyzsk Tube Kremenchuk SteelZaporizhzhia Abrasive Energomashspetsstal Kramatorsk Nikopol Stainless TubeNikopol Pivdenny Tube Dnipropetrovsk Comintern Nikopol UTIST TubeDnipropetrovsk Tube Sumy Frunze Tube Luhansk TubeAverage profits Average profits trend line
33
Source: Author’s calculations on the basis of Ukrainian Investment Gazette, Top 100: Reiting luchshykh kompanii Ukrainy 2001 (Kyiv: Ukrainskaia Investitsionnaia Gazeta, May 2001); Ukrainian Investment Gazette, Top 100: Reiting luchshykh kompanii Ukrainy 2002 (Kyiv: Ukrainskaia Investitsionnaia Gazeta, June 2002); Ukrainian Investment Gazette, Top 100: Reiting luchshykh kompanii Ukrainy (Kyiv: Ukrainskaia Investitsionnaia Gazeta, June 2003).
THE INDUSTRY’S POST-COMMUNIST CHALLENGES
To understand whether and how the Ukrainian iron and steel industry can be made
sustainable in the long run, one has to question the factors behind the sector’s ‘Great Post-
Communist Contraction’ and the industry’s overall unbalanced economic and commercial
performance. Firstly, this third part of the research paper considers the applicability of the
traditional ‘declining industry’ hypothesis, which is related to the phenomenon of ‘de-
industrialisation’ experienced by the industrially advanced countries of the West.
Consequently, this section identifies five fundamental problems that the Ukrainian ferrous
metals sector has been faced with under post-communism in the spheres of technology,
market access and development, resources, and ownership transformation. It is contended
that the relatively poor growth, efficiency, and stability outcomes generated by the
Ukrainian steel industry after the collapse of state socialism ought to be attributed to these
five central transformation-related variables.
A DECLINING INDUSTRY?
In the 1970s, the major industrially advanced countries began to experience the
phenomenon of ‘de-industrialisation’, which was identified with the contraction of output
or employment in the industrial sector as a whole, and with a steadily falling share of
manufacturing in the total workforce and production. As Ajit Singh and other scholars
have argued, in some cases, de-industrialization should be regarded simply as a normal
response to changing technology and tastes and does not signify any structural
disequilibrium in the economy as whole with malignant consequences (see Singh 1987).
According to the conventional economic theory, an industry’s decline and, ultimately, its
disappearance are usually related to the following factors:

34
Industries can decline because their products have been replaced by new and better products, or industries can decline because what used to be most cheaply produced in country A is now most cheaply produced in country B and exported to country A. In the first case, the word processor replaces the typewriter. In the second case, steel production moves from the United States to Brazil and American needs are met with imports from Brazil (Thurow 1987).
Could one possibly claim that Ukraine’s ferrous metals sector has become an ailing
industry? From a theoretical perspective, the Ukrainian iron and steel industry can decline
if it faces a new replacement product. Alternatively, the iron and steel production in the
country can become too expensive to be sustained and, consequently, the industry would
shift to another country. Concerning the replacement products, the arrival and industrial-
scale expansion of advanced plastic and concrete materials, which, since the early 1960s,
have been widely used in manufacturing and construction all over the world, have
provided new competitive substitutes for steel. Nonetheless, as Figure 20 shows, the
world steel production has actually increased since 1970 in absolute volume terms by
over 50 per cent, from 595 million tonnes to 902 million tonnes respectively.
Figure 20. World crude steel production, 1970-2002
World crude steel production, million tonnes
0
100
200
300
400
500
600
700
800
900
1000
1970 1975 1980 1985 1990 1995 2000 2001 2002
Source: International Iron and Steel Institute, World Steel in Figures: 2003 Edition (Brussels: IISI, 2003).

35
If one applies the industry shifting hypothesis, it would appear that Ukraine’s ferrous
metals sector can hardly qualify for a typical declining industry status. As it has been
mentioned earlier, according to the commodity structure of Ukraine’s foreign trade,
ferrous metals comprise over 30 per cent of the country’s total exports, whereas the
imported steel products account for just over 2 per cent of Ukraine’s total imports. Figure
21 indicates that the Ukrainian import of base metals has been very modest under post-
communism, and that the country runs a huge foreign trade surplus with regard to ferrous
and non-ferrous metals and metal products.
Figure 21. Base metals in Ukraine’s foreign trade, 1994-2002
Ukraine's base metals foreign trade
$0$500
$1,000$1,500$2,000$2,500$3,000$3,500$4,000$4,500$5,000$5,500$6,000$6,500$7,000$7,500
1994 1995 1996 1997 1998 1999 2000 2001 2002
mill
ion
USD
Exports Imports Foreign trade balance Source: Author’s calculations on the basis of The International Bank for Reconstruction and Development, Ukraine: Restoring Growth with Equity (Washington, D.C: World Bank, 1999); Ukrainian State Statistics Committee, Statystychnyi shchorichnyk Ukrainy za 1999 rik (Kyiv: Technical, 2000); Ukrainian State Statistics Committee, Statystychnyi shchorichnyk Ukrainy za 2002 rik (Kyiv: Technical, 2003).
Moreover, while the Ukrainian steel companies export the overwhelming part of their
produce (about 80 per cent), the domestic demand for crude steel as well as finished metal
products seems to be sufficiently met by local producers. Thus, Ukraine’s ferrous metals
sector is not in the process of replacement by some competing steel producers from

36
overseas. What other factors can then account for growth, efficiency, and stability-related
problems of the Ukrainian steel industry under post-communism?
DOMESTIC MARKET’S COLLAPSE
The collapse of the domestic market for Ukraine’s ferrous metals is considered to be the
major cause of the industry’s crisis in the first half of the 1990s. Figure 22 compares the
level of steel consumption across the globe. It shows the magnitude of the collapse of
Ukraine’s domestic steel consumption under post-communism: while in the early 1990s
the Ukrainian domestic market for steel had been as large (on a per capita basis) as that of
any industrially advanced economy of the West, by 2002, it contracted by 80 per cent.
The current level of Ukraine’s crude steel consumption is twice as low as the world’s
average.
Figure 22. International crude steel consumption, 1993-2002
Apparent crude steel consumption per capita, kilograms
0
100
200
300
400
500
600
700
800
900
1,000
1,100
1,200
1,300
U.A
.E.
Sing
apor
eTa
iwan
Sout
h K
orea
Hon
g K
ong
Slov
enia
Japa
nA
ustri
aCa
nada
Italy
Slov
akia
Spain
Czec
hia
Swed
enG
erm
any
Cypr
usFi
nlan
dD
enm
ark
U.S
.A.
Aus
tralia
Polan
dRo
man
iaRu
ssia
Wor
ld a
vera
geU
krain
eK
azak
hsta
n
2002 1993
Source: Author’s calculations on the basis of Ukrainian State Statistics Committee, Statystychnyi shchorichnyk Ukrainy za 2002 rik (Kyiv: Technical, 2003); International Iron and Steel Institute, World Steel in Figures: 2003 Edition (Brussels: IISI, 2003);

37
International Iron and Steel Institute, Steel Statistical Yearbook 2003 (Brussels: IISI, 2004).
In the first half of the 1990s, the collapse of the Ukrainian steel industry was
accompanied by a similar scale of output decline in heavy engineering (i.e. machine-
building and military armaments) and construction – the two major domestic consumers
of steel. Figure 23 demonstrates that in the second half of the 1990s, the Ukrainian steel-
producing firms have found other (=overseas) market niches to compensate for the lack of
locally-placed orders. The overall sales of ferrous metals produced in Ukraine have been
growing since 1996, whilst the domestic industrial consumption remained stagnant until
2000. It is contended that, given the highly volatile nature of the world steel market, the
underdevelopment of the domestic market for steel products in Ukraine should be
regarded as one of the industry’s long-term challenges.
Figure 23. The post-communist growth trajectory of Ukraine’s steel, engineering, and construction sectors, 1990-2002
10
20
30
40
50
60
70
80
90
100
1990 95 96 97 98 99 2000 01 02
Vol
ume
inde
x, 1
990
= 1
00
Ferrous metalsMechanical engineering (machine-building)Construction and assembly work
Source: Author’s calculations on the basis of Ukrainian State Statistics Committee, Statystychnyi shchorichnyk Ukrainy za 1999 rik (Kyiv: Technical, 2000); Ukrainian State Statistics Committee, Statystychnyi shchorichnyk Ukrainy za 2002 rik (Kyiv: Technical, 2003); National Bank of Ukraine, Osnovni pokaznyky ekonomichnoho i sotsial’noho stanu Ukrainy 2001-2004 roky (Kyiv: National Bank, 2004); Ukrainian State Statistics Committee, Vyrobnytstvo ta tempy pryrostu obsiahiv promyslovoi produktsii: Operatyvni danni (Kyiv: Derzhkomstat, 2004).

38
OVERSEAS MARKETS’ RESTRICTIONS
The overseas steel market expansion notwithstanding, since 1992, the Ukrainian iron and
steel industry has been faced with what a recent International Monetary Fund report
describes as ‘a plethora’ of anti-dumping investigations and external market restrictions
(2003). Export opportunities of the Ukrainian iron and steel producers have been badly
damaged by a wave of anti-dumping sanctions, import tariffs, quantitative restrictions,
and other protectionist measures imposed by the European Union, the United States, and
a number of other steel-producing countries. Currently, 69 restrictive measures imposed
between 1999 and 2002 against Ukrainian steel exports are in place. Table 4 summarises
the most recent protectionist measures applied by a number of the World Trade
Organisation member states.
Table 4. Anti-dumping duties imposed by WTO trading partners against Ukraine’s ferrous metals in 2001-02 Product Country of
destination Year of
application Measure
Flat non-coiled rolled metal
USA 2001 Duty - 90.33%
Reinforced steel USA 2001 Duty - 41.69% Flat non-coiled rolled metal
Canada 2001 Duty - 96%
Reinforced steel Canada 2001 Duty - 15.7% Steel wires and certain steel alloys
USA 2002 Anti-dumping margin - 116.37%
Ferrosilicium India 2002 Difference between $740 per tonne and cost of commodity
Pipe products EU 2002 30.9% - 44.1% Source: International Monetary Fund, ‘Ukraine: Selected Issues’, IMF Country Report No. 03/173 (June 2003), p. 51.
According to the IMF and WTO data, Ukraine has been ten times more likely to have
anti-dumping measures imposed against it as the country’s share in the international trade
could suggest. Apart from the anti-dumping investigations, the IMF 2003 Ukraine report
has pointed out a large number of other market access restraints have been imposed on
the Ukrainian steel exporters:
For instance, over the January 1995 – June 2002 period, out of a total 1,161 anti-dumping measures, WTO member countries imposed 37 measures on Ukraine. The 3 percent share of measures imposed on Ukraine is disproportionate to the 0.3 percent Ukrainian share of world exports, but it is

39
partly explained by WTO members propensity to impose measures on metal trade (one-third of all measures) and the dominating role of metal products in Ukrainian exports (about 40 percent of total exports) … Only 80 countries have had any anti-dumping measure imposed and relative to its importance in the world trading system, only Moldova has had more anti-dumping measures imposed than Ukraine. WTO trading partners that have imposed anti-dumping measures against Ukrainian exports include Canada (3 measures), Chile (2), Colombia (2), EU (8), India (4), Mexico (4), Turkey (2), U.S. (5), and Venezuela (2). […] Apart from the imposition of antidumping duties, Ukrainian exports are also subject to quotas and licensing based on intergovernmental agreements. Agreements currently in place govern exports of various metal products to the EU, the U.S., Indonesia, and Russia. […] The EU and the U.S. have both designated Russia and Kazakhstan as market economies, but Ukrainian efforts at receiving a similar designation has not met with success […] In general, Ukraine has trouble penetrating world markets, because protection is relatively high in exactly the product lines where Ukraine has a comparative advantage (e.g., metals, grains, and other agricultural products). For instance, in addition to the … new quota on grain imports, the EU … has lowered the quota on ready-made rolled metals to 180,000 tons for 2003, from 355,000 tons in 2002. Furthermore, Ukraine is at a competitive disadvantage vis-à-vis Central and Eastern European countries that have received trade concessions from the EU not also granted to Ukraine. With the upcoming EU enlargement in 2004 this competitive disadvantage vis-à-vis prospective EU members in the current EU market will increase; at the same time, exports to prospective EU member countries may be negatively affected as these countries adopt the common EU tariff and other protection policies (IMF Country Report: Ukraine. Selected Issues No. 03/173, June 2003: 50-53).
TECHNOLOGICAL BACKWARDNESS
The third long-term challenge to the Ukrainian iron and steel industry under post-
communism has been its obsolete production capacities and out-dated technology. The
low levels of efficiency, productivity and profitability, which have characterised the
Ukrainian iron and steel industry under post-communism, are due to the industry’s
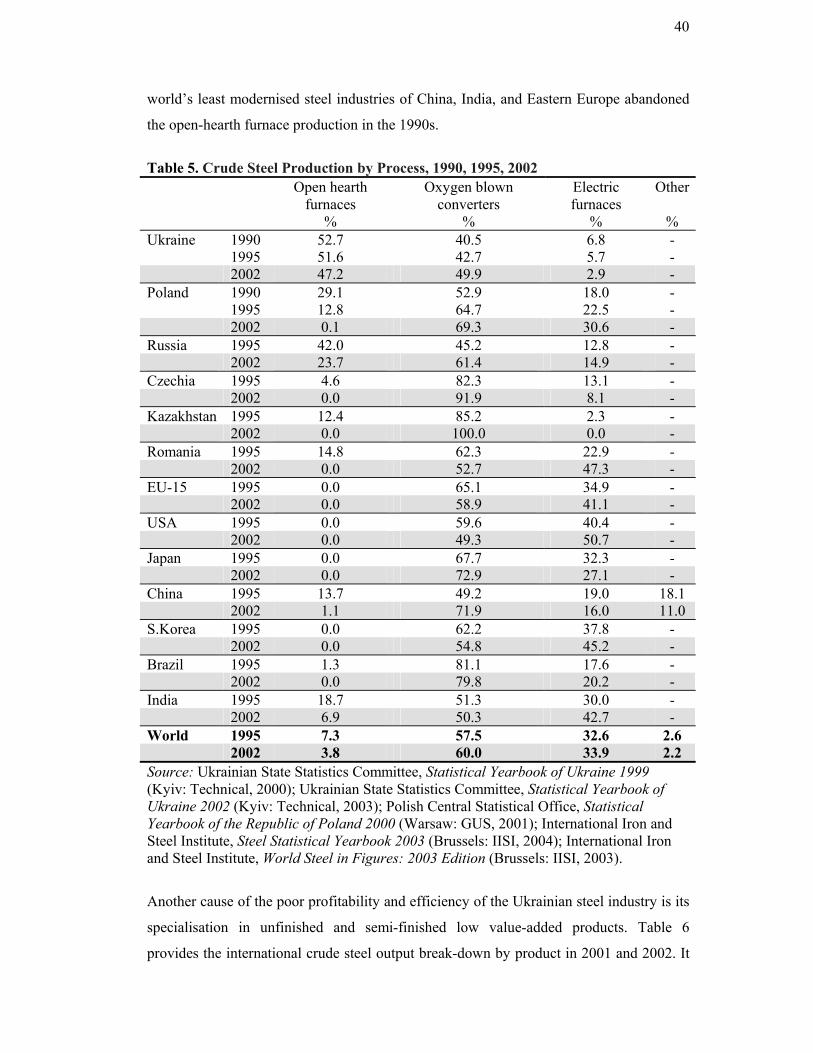
technological backwardness and low value-added product assortment. Table 5
summarises technological characteristics of the major European, Asian, and American
steel industries. It shows that the Ukrainian ferrous metals sector is currently the only
industry in the world that still heavily relies on the open-hearth furnace production
technology. Furthermore, Table 5 shows that the Ukrainian steel industry has been the
slowest in the world in up-grading its production capacities towards more modern and
efficient technological styles. By contrast, the world crude steel production has decisively
moved towards oxygen-converter and electric furnace production technologies. Even the
40
world’s least modernised steel industries of China, India, and Eastern Europe abandoned
the open-hearth furnace production in the 1990s.
Table 5. Crude Steel Production by Process, 1990, 1995, 2002 Open hearth
furnaces %
Oxygen blown converters
%
Electric furnaces
%
Other
% Ukraine 1990 52.7 40.5 6.8 - 1995 51.6 42.7 5.7 - 2002 47.2 49.9 2.9 - Poland 1990 29.1 52.9 18.0 - 1995 12.8 64.7 22.5 - 2002 0.1 69.3 30.6 - Russia 1995 42.0 45.2 12.8 - 2002 23.7 61.4 14.9 - Czechia 1995 4.6 82.3 13.1 - 2002 0.0 91.9 8.1 - Kazakhstan 1995 12.4 85.2 2.3 - 2002 0.0 100.0 0.0 - Romania 1995 14.8 62.3 22.9 - 2002 0.0 52.7 47.3 - EU-15 1995 0.0 65.1 34.9 - 2002 0.0 58.9 41.1 - USA 1995 0.0 59.6 40.4 - 2002 0.0 49.3 50.7 - Japan 1995 0.0 67.7 32.3 - 2002 0.0 72.9 27.1 - China 1995 13.7 49.2 19.0 18.1 2002 1.1 71.9 16.0 11.0 S.Korea 1995 0.0 62.2 37.8 - 2002 0.0 54.8 45.2 - Brazil 1995 1.3 81.1 17.6 - 2002 0.0 79.8 20.2 - India 1995 18.7 51.3 30.0 - 2002 6.9 50.3 42.7 - World 1995 7.3 57.5 32.6 2.6 2002 3.8 60.0 33.9 2.2 Source: Ukrainian State Statistics Committee, Statistical Yearbook of Ukraine 1999 (Kyiv: Technical, 2000); Ukrainian State Statistics Committee, Statistical Yearbook of Ukraine 2002 (Kyiv: Technical, 2003); Polish Central Statistical Office, Statistical Yearbook of the Republic of Poland 2000 (Warsaw: GUS, 2001); International Iron and Steel Institute, Steel Statistical Yearbook 2003 (Brussels: IISI, 2004); International Iron and Steel Institute, World Steel in Figures: 2003 Edition (Brussels: IISI, 2003).
Another cause of the poor profitability and efficiency of the Ukrainian steel industry is its
specialisation in unfinished and semi-finished low value-added products. Table 6
provides the international crude steel output break-down by product in 2001 and 2002. It

41
shows that, besides Kazakhstan’s ferrous metals sector, the Ukrainian steel industry is the
only steel industry in the world, which has been overwhelmingly dominated by the
production of ingots – the most elementary crude steel product. Furthermore, the
Ukrainian steel producers have appeared to be the slowest in moving towards the
production of other crude steel materials.
Table 6. Crude Steel Production by Product, 2001-02 Crude steel production by product, % of total production Ingots
Continuously cast slabs and billets
Liquid steel for castings
Total
2001 2002 2001 2002 2001 2002 Ukraine 78.6 78.5 19.8 19.9 1.6 1.6 100.0 Russia 45.8 42.6 50.9 54.3 3.3 3.1 100.0 Poland 39.7 21.7 59.0 71.7 1.2 1.2 100.0 Czechia 10.6 8.5 87.1 89.0 2.3 2.5 100.0 Kazakhstan 100.0 99.8 0.0 0.0 0.0 0.2 100.0 Romania 22.6 16.4 77.4 83.6 0.0 0.0 100.0 EU (15) 3.2 2.9 96.2 96.6 0.7 0.5 100.0 USA 3.1 2.8 96.9 97.2 0.0 0.0 100.0 Japan 2.1 1.9 97.5 97.8 0.4 0.3 100.0 China 9.3 7.0 89.9 92.5 0.8 0.6 100.0 S.Korea 1.2 1.1 98.5 98.6 0.3 0.3 100.0 Brazil 8.3 7.3 91.6 92.6 0.1 0.1 100.0 India 36.6 34.7 63.3 65.2 0.1 0.1 100.0 World 12.1 10.8 87.2 88.6 0.7 0.6 100.0 Source: International Iron and Steel Institute, Steel Statistical Yearbook 2003 (Brussels: IISI, 2004); International Iron and Steel Institute, World Steel in Figures: 2003 Edition (Brussels: IISI, 2003).
FRAGMENTARY OWNERSHIP TRANSFORMATION
This paper recognises the collapse of Ukraine’s local market for ferrous metals, which has
forced the domestic steel producers to become fully dependent on volatile overseas
markets, as well as the industry’s technological backwardness, as the three fundamental
long-term challenges that the Ukrainian steel sector has been faced with. It is contended,
however, that the particularly unstable performance of the industry during the post-
communist transformation has also originated from two other problems of a more short-
term nature. The first more immediate problem of the Ukrainian ferrous metals sector is
privatisation and the overall transformation of property and control arrangements across
the entire national economy. By 2004, except for Kryvorizhstal – the largest steel

42
manufacturing and exporting enterprise – Ukraine’s all major ferrous metals companies
have been privatised. However, the state has retained a certain degree of share-holding or
management presence in the privatised steel companies. Furthermore, the Ukrainian steel
producers have also had to cope with a fragmented property composition of their major
suppliers and consumers. According to Figure 24, by the end of 2002, 84 per cent of
Ukraine’s metals output was produced by the privatised steel companies. However, the
bulk of Ukraine’s iron ore mines and the majority of coal mines have remained in the
state ownership. On the other hand, the coal coking branch of the industry – the primary
consumer of coal and the vital fuel supplier of the steel-producing enterprises – has been
almost totally privatised.
Figure 24. The ownership structure of Ukraine’s metals sector and its major domestic customers, 31st December 2002
43.8
61.4
7.515.9 14.2 19.6
0.0
0.0
0.00.1 0.1
1.4
56.2
38.6
92.583.8 85.2 78.7
0.0 0.0 0.0 0.2 0.5 0.3
0
25
50
75
100
Mining andquarrying
Of which, coal-
mining
Manufacture ofcoke, refinedpetroleumproducts
Manufacture ofbasic metalsand metalproducts
Manufacture ofmachinery,
vehicles,equipment and
apparatus
Construction
perc
enta
ge s
hare
of
outp
ut
central state local government private domestic foreign
Source: Author’s calculations on the basis of Ukrainian State Statistics Committee, Statystychnyi shchorichnyk Ukrainy za 2002 rik (Kyiv: Technical, 2003).
The loss of management and co-ordination during the process of privatisation has had a
detrimental effect on the economic performance of most of the Ukrainian steel works. A
number of large iron and steel combines, iron ore mines and coal-coking pants have been
partially privatised by or put under the private management control of simultaneously
several competing Ukrainian industrial holding companies. The subsequent establishment
of divergent property arrangements have created a number of major difficulties with

43
regard to the reliability of input and output provisions. Moreover, the fragmented
ownership structure has propelled the huge principal-agent problem of resource
allocation, which inevitably arises when property ownership and control are separated.
The principal-agent problem has been exacerbated under post-communism through non-
transparent commercial dealings between state-owned enterprises and private firms.
The constant process of consolidation has been one of the major characteristics of the
world steel industry in the 1990s. As a result, a large number of steel companies in
Western Europe, East Asia, and North America have either merged nationally (e.g.
ThyssenKrupp) or turned into multinational enterprises through acquisitions and mergers
accomplished abroad (e.g. the LNM Group, Arcelor, Corus). The fragmentary ownership
transformation of the Ukrainian ferrous metals sector has become the main impediment to
the industry’s domestic consolidation. Table 7 shows that none of Ukraine’s largest steel
producers have been large enough to enter the league of the world’s top 20 steel
companies.
Table 7. The world’s major steel-producing countries and companies, crude steel output, million tonnes, 2002 Rank Tonnage Country Rank Tonnage Company 1 181.6 China 1 44.0 Arcelor 2 107.7 Japan 2 34.8 LNM Group 3 92.2 United States 3 29.8 Nippon Steel 4 59.8 Russia 4 28.1 POSCO 5 45.4 South Korea 5 19.5 Shanghai Baosteel 6 45.0 Germany 6 16.8 Corus 7 33.4 Ukraine 7 16.4 Thyssen Krupp 8 29.6 Brazil 8 15.2 NKK 9 28.8 India 9 15.0 Riva 10 26.1 Italy 10 14.4 U.S. Steel 11 20.3 France 11 13.7 Kawasaki 12 18.2 Taiwan 12 12.4 Nucor 13 16.5 Turkey 13 11.8 Sumitomo 14 16.4 Spain 14 11.5 Gerdau 15 16.0 Canada …26 6.9 Kryvorizhstal 16 14.1 Mexico …30 6.1 Mariupol Illich 17 11.7 United Kingdom …45 4.7 Azovstal 18 11.3 Belgium …55 3.9 Zaporizhstal 19 9.1 South Africa …69 3.2 Alchevsk 20 8.4 Poland …80 2.8 DniproPetrovsky Source: International Iron and Steel Institute, World Steel in Figures: 2003 Edition (Brussels: IISI, 2003).

44
RESOURCE SHORTAGES
The shortage of raw materials and resource inputs has recently become the second short-
term problem of the Ukrainian iron and steel industry. Figure 25 shows that since 1998,
when the Ukrainian steel industry returned to the stable growth path, the output of iron
and manganese ores and coal – the major raw materials used for the production of ferrous
metals in Ukraine – has not been adequately recovering. The resource shortage problem,
reportedly suffered by a large number of Ukraine’s steel works, is exacerbated by the fact
that an increasingly large share of domestically-produced iron ore and coke has been
exported abroad, destabilising the local price levels.
Figure 25. Raw materials and crude steel production, 1990-2003
253035404550556065707580859095
100105
1990 95 96 97 98 99 2000 01 02 03
Vol
ume
inde
x, 1
990
= 1
00, t
onne
s
Iron ore output Manganese ore outputCoal output Crude steel output
Source: Author’s calculations on the basis of Ukrainian State Statistics Committee, Statystychnyi shchorichnyk Ukrainy za 1999 rik (Kyiv: Technical, 2000); Ukrainian State Statistics Committee, Statystychnyi shchorichnyk Ukrainy za 2002 rik (Kyiv: Technical, 2003); Ukrainian State Statistics Committee, Vyrobnytstvo osnovnykh vydiv promyslovoi produktsii po misiatsiakh 2003 roku; available at http://www.ukrstat.gov.ua/operativ/operativ2003/pr/ovp/ovp_u/arh_ovp.html.
Moreover, a large number of raw material-supplying enterprises (e.g. iron ore processing
and concentrating factories, coal mines, coking plants) were privatised by very few
owners, who have gained an almost monopoly market position in the resource base of the
Ukrainian ferrous metals sector. For example, currently, the A.R.S. – a Donetsk-based
company – reportedly controls about 90 per cent of Ukraine’s coking coal-mining and
45
coke-producing enterprises and, thus, is able to exercise undue bargaining powers on the
domestic market. The protracted privatisation of Ukraine’s iron ore- and coal-mining
industrial branches has only added to the generally uncertain and unstable supply of local
raw materials.
CURRENT POLICY ENVIRONMENT
The election of Leonid Kuchma, a representative of Eastern Ukrainian industrialist
circles, as Ukraine’s President in July 1994 is considered to be the starting point for the
creation of the current national industrial policy environment. From the very beginning,
the transformation of Ukrainian heavy industries has appeared on the list of major
priorities of the Kuchma administration. The central public policy document with regard
to the Ukrainian iron and steel industry is ‘The Conception of the Development of
Ukraine’s Mining and Metallurgical Complex until 2010’ approved by the Verkhovna
Rada††, Ukraine’s parliament, on 17 October 1995 (Vidomosti Verkhovnoï Rady No. 39,
1995). The Conception has emphasised the leading regulatory role of the state to be
played in the process of essential industrial restructuring, privatisation, and adjustment of
Ukraine’s metals sector to the realities of post-communism and globalisation. This public
policy document has also recognised the Ukrainian steel industry’s problems in the
spheres of production technology, product diversification, and international marketing,
and provided for a number of activities aimed at the transformation of the Ukrainian
metals sector into a more balanced, competitive, efficient, and environmentally conscious
industry.
Nonetheless, the probability of the economic forecasting provided in the document and
the level of understanding by the Conception’s authors of the political economy of
international trade have all proven to be inadequate. Table 8 confronts the real finished
rolled steel output figures with the Concept’s forecast. It shows that the Ukrainian steel
industry has reached the 25 million tonne a year output level nine years earlier than
previously forecasted. One should emphasise that the Conception’s threshold of 25
million tonnes per year was calculated on the basis of existing raw material capacities.
Thus, the current steel output expansion and the resultant shortages of raw materials have
not been anticipated. The Conception has also underestimated the significance of the †† Supreme Assembly

46
overseas market for the Ukrainian ferrous metals and, subsequently, totally neglected the
potential threat of protectionist measures to be applied against the Ukrainian steel
companies by a number of foreign governments.
Table 8. The production of finished rolled ferrous metals in Ukraine, forecast and real output figures, 1995-2010, million tonnes 1995 2000 2001 2002 2005 2010 Forecast 18 20 n.d. n.d. 22 25 Real output 16.6 22.6 25.4 26.4 n.a. n.a. Source: The forecast figures are taken from ‘The Conception of the Development of Ukraine’s Mining and Smelting Complex until 2010’, Vidomosti Verkhovnoï Rady No. 39, 1995. The real output data are from the Ukrainian State Statistics Committee, Statystychnyi shchorichnyk Ukraïny za 2002 rik (Kyiv: Technical, 2003).
The ‘Conception of the Development of Ukraine’s Mining and Metallurgical Complex’
has been followed by a number of legislative initiatives and executive orders concerning
the operation and restructuring of the Ukrainian iron and steel industry. The Laws of
Ukraine ‘On Economic Experiment at Enterprises of Ukraine’s Mining and Metallurgical
Complex’ (valid from 14 August 1999 until 1 January 2002), and ‘On the Further
Development of Ukraine’s Mining and Metallurgical Complex’ (valid from 1 January
2002 until 1 January 2003), provided the majority of domestic steel producers with a
number of state assistance measures: (a) penalties and fines charged for untimely paid
taxes, duties, and other mandatory payments were written off; (b) ferrous and non-ferrous
metals enterprises were provided with tax allowances for fixed assets depreciation; (c)
some share of the mandatory payment by metals companies of the ‘state innovation fund’
tax, the ‘enterprise profit’ tax, the ‘value-added’ tax, and the ‘environmental pollution’
duty were to remain at the respective companies and used directly for technology
improvements and environmental safety measures; and (d) ferrous and non-ferrous metals
companies covered by the two laws concerned were released from paying the ‘general
usage motor-way maintenance’ duty (see Vidomosti Verkhovnoï Rady No. 38, 1999 and
Vidomosti Verkhovnoï Rady No. 17, 2002).
Ukraine’s ferrous metals enterprises situated in the Donbas have also been affected by the
Law of Ukraine ‘On Special Economic Zones and a Special Regime of Investment
Activities in Donetsk oblast’, valid from 14 January 1999. This Law has established a
special regime of investment activities within Donetsk oblast’s territories of priority
development, which currently cover almost the entire provincial area. Subject to the

47
proposed investment of at least US$ 1 million (US$ 250,000 for small firms), a
commercial entity which operates within the priority development territory is provided
with a large number of tax breaks and allowances, customs duty and other incentives for
the period of 30 years (see Table 9). The Donbas ferrous metals companies, as a result,
have been able to make additional fixed capital investments within this special regulatory
regime.
Table 9. Tax incentives provided in priority development territories, Donetsk oblast, 1999 Type of exemption Priority Development Territory Duration 30 years Corporate income tax 0% rate for the first 3 years; 50% of the current
tax rate afterwards* Value-added tax 0% rate for the first 5 years Non-resident personal income tax 2/3 of the current tax rate Investor dividend tax 10% rate Custom duties 0% rate for the first 5 years Social insurance contributions 50% of the current rate Minimum investment project US$ 1 million; US$ 250,000 for small firms Note: Provided profit is gained during the next 4 to 6 years Source: Verkhovna Rada of Ukraine, ‘The Law of Ukraine: On Special Economic Zones and a Special Regime of Investment Activities in Donetsk Oblast’, available at http://zakon.rada.gov.ua/cgi-bin/laws/main.cgi.
Besides the legislative regulation of Ukraine’s ferrous metals sector, another sphere of the
state industrial policy has been focused on privatisation and the establishment of large
domestic conglomerates, commonly referred to as ‘financial and industrial groups’. By
April 2004, except for the fully state-owned Kryvorizhstal Iron and Steel Combine, the
Mariupol Illich Iron and Steel Combine (management-employee buy-out), and the
UkrRudProm State Iron Ore Holding Company, all other ferrous metals enterprises in the
country were either privatised or designated for privatisation by Ukraine’s largest
conglomerates such as: the Industrial Union of the Donbas (ISD; Donetsk-based); System
Capital Management (SCM; Donetsk-based) and its affiliates (D.A.N.K.O. and A.R.S;
both Donetsk-based); the Interpipe Group (Interpipe; Dnipropetrovsk-based); the Private
Group (PryvatBank; Dnipropetrovsk-based); the Ukrainian-Siberian Bank Group
(UkrSybBank; Kharkiv-based); the Finance & Credit Group (Finansy i Kredyt; Kyiv-
based). Figure 26 shows the extent of involvement of Ukraine’s largest conglomerates in
the ferrous metals sector, ranging from coal mines and iron ore deposits to special steel
alloys and international marketing.

48
Ferrous Metals and Coal Coke
I.S.D.Shares
Alchevsk Iron &Steel Combine
MarkokhimMariupol Coke
Works
Alchevsk Coke &Chemicals
Dniprovsk TubeWorks
KramatorskKuibyshev Iron &Steel Combine
EnergomashspetsstalEngineering Special
Steels
Iron Ore and Coal Mining
I.S.D.Shares
DONETSKINDUSTRIAL
UNION,Subsidiary
Northern Iron OreConcentrating
Combine
Krasnyi LymanCoal Mine
I.S.D.StrategicAlliances
DunaFerr Iron &Steel Combine
(Hungary)
KrasnoarmiiskCoal Mine
Bazhan CoalMine, MakiivCoalState Holding Co.
RodynskeCoal Mine,
KrasnoarmiiskCoalMining Association
Kholodna BalkaCoal Mine,
MakiivCoal StateHolding Co.
Northern CoalMine, MakiivCoalState Holding Co.
Communist CoalMine, OctoberCoalState Holding Co.
PanteleimonivkaFire Clay Factory
Fedorov MiningMechanics R&D
Institute
DnipropetrovskPetrovskySteelworks
DniproDzerzhynskyIron & Steel
Combine
I.S.D.StrategicAlliances
DufercoInternationalSteel Trading(US-Brasilian
TNC)
S.C.MShares
AzovstalTrading House
Kerch Iron &Steel Combine
YenakieveIron & Steel
WorksD.A.N.K.O.
KhartsyzskTube Works
SilurKhartsyzsk
Wire Mill
ZaporizhzhiaCoke Works
MarkokhimMariupol
Coke Works
KramatorskKuybyshev Iron& Steel Works
Kharkiv CokeWorks
S.C.M.StrategicAlliances
EmbrolUkraine Ltd.
LemanCommodities S.A.
(Switzerland)
Azovstal Iron &Steel Combine
A.R.S.
Avdiivka CokeWorks
S.C.MShares
Druzhkivka OreBoard
Dobropillia OresConcentration
Factory
October OresConcentration
Factory
Central Iron OreConcentrating
Combine
Finance&CreditShares
Poltava Iron OreConcentrating
Combine
InterpipeShares
NovomoskovskTube Mill
Niko TubeNikopol Seamless
Tube Mill
NyzhniodniprovskTube-Rolling Mill
NikopolStainless Steel
Tube Works
Nikopol Tube Co.
DniprovskComintern Steel
Works
NikopolFerroAlloys
VtorMetRecycled Metals
Plant
PromArmaturaIndustrialArmature
Bipe Co. Ltd.(Ukraine-US
Joint-Venture)
UkrSybBankShares
Ukrainian Metals Co.DniproDzerzhynsky
Iron and SteelCombine
KremenchukPowder
Metallurgy Plant
Northern Iron OreConcentrating
Combine
UkrSybBankShares
PryvatBankShares
DniprodzerzhynskCoke Works
NikopolFerroalloys
ZaporizhzhiaFerroalloys
DnipropetrovskPetrovskySteelworks
Dnipro Coke
StakhanovFerroalloys
Bahliy Coke
PryvatBankOff-Shore-controlled
Shares
Sukha BalkaIron Ore
ConcentratingCombine
Southern Iron OreConcentrating
Combine
MarhanetsManganese OreConcentrating
CombineOrdzhenikidze
Manganese OreConcentrating
Combine
Figure 26. The Ukrainian financial & industrial groups’ interests in the ferrous metals sector Note: Data in italics indicate that the firm belongs to the list of top 100 largest companies of Ukraine or to the respective sectoral list of largest companies. Source: Author’s construction of the basis of The Korrespondent Kyiv Post Weekly, 10 January 2003; Dannye o korporatsii (Donetsk: ISD, 2004); Ukrainian Investment Gazette, Top 100: Reiting luchshykh kompanii Ukrainy (Kyiv: Ukrainskaia Investitsionnaia Gazeta, June 2003), and various periodical publications.
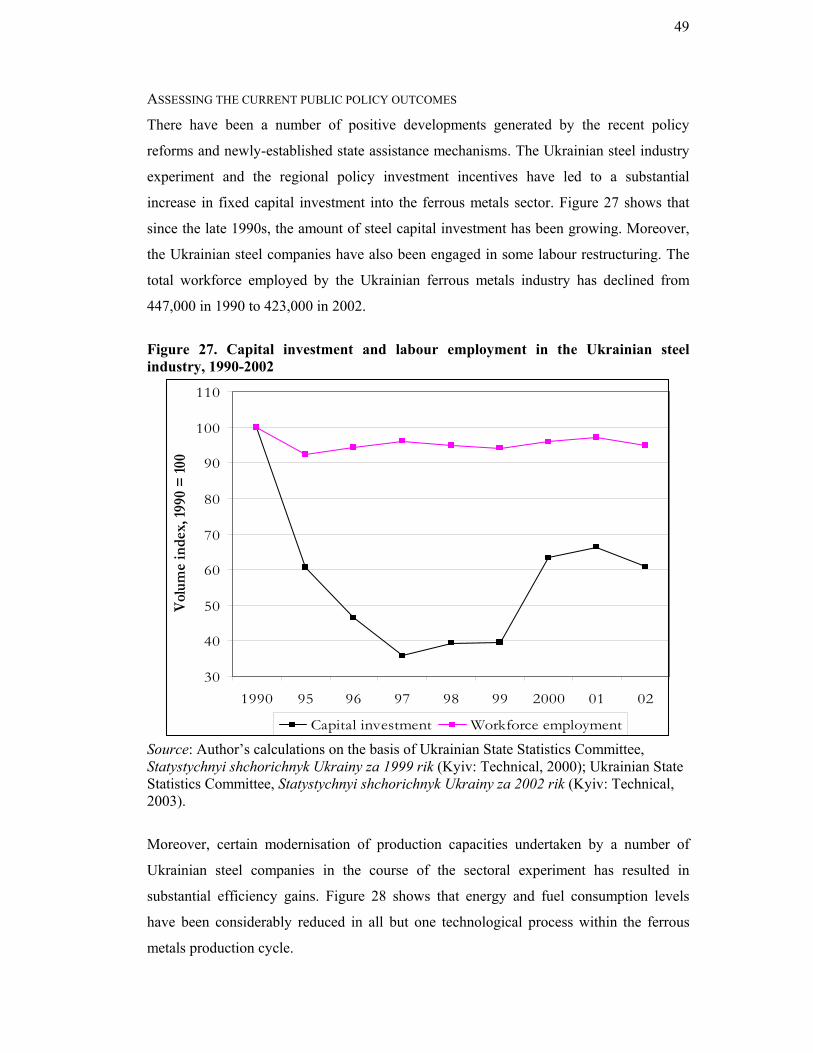
49
ASSESSING THE CURRENT PUBLIC POLICY OUTCOMES
There have been a number of positive developments generated by the recent policy
reforms and newly-established state assistance mechanisms. The Ukrainian steel industry
experiment and the regional policy investment incentives have led to a substantial
increase in fixed capital investment into the ferrous metals sector. Figure 27 shows that
since the late 1990s, the amount of steel capital investment has been growing. Moreover,
the Ukrainian steel companies have also been engaged in some labour restructuring. The
total workforce employed by the Ukrainian ferrous metals industry has declined from
447,000 in 1990 to 423,000 in 2002.
Figure 27. Capital investment and labour employment in the Ukrainian steel industry, 1990-2002
30
40
50
60
70
80
90
100
110
1990 95 96 97 98 99 2000 01 02
Vol
ume
inde
x, 1
990
= 1
00
Capital investment Workforce employment
Source: Author’s calculations on the basis of Ukrainian State Statistics Committee, Statystychnyi shchorichnyk Ukrainy za 1999 rik (Kyiv: Technical, 2000); Ukrainian State Statistics Committee, Statystychnyi shchorichnyk Ukrainy za 2002 rik (Kyiv: Technical, 2003).
Moreover, certain modernisation of production capacities undertaken by a number of
Ukrainian steel companies in the course of the sectoral experiment has resulted in
substantial efficiency gains. Figure 28 shows that energy and fuel consumption levels
have been considerably reduced in all but one technological process within the ferrous
metals production cycle.

50
Figure 28. Energy efficiency developments in Ukraine’s ferrous metals sector, 1996-2002
45
50
55
60
65
70
75
80
85
90
95
100
105
110
115
1996 2000 2001 2002
Inde
x, 19
96 =
100
Steel tubes production, energy consumption(kg of oil equivalent) per 1 tonne of output
Coke oven heating, energy consumption (kgof oil equivalent)
Electric ferro-alloys production, electricityconsumption per 1 tonne of output
Cast-iron production, energy consumption(kg of oil equivalent) per 1 tonne of output
Coal coke production, electricityconsumption per 1 tonne of output
Iron ore mining, electricity consumption per1 tonne of output
Crude steel production, energy consumption(kg of oil equivalent) per 1 tonne of outputproduced in open-hearth furnacesFoundry iron production, energyconsumption (kg of oil equivalent) per 1tonne of outputRolled ferrous metal production, energyconsumption (kg of oil equivalent) per 1tonne of outputCoal mining, electricity consumption per 1tonne of output
Crude steel production, energy consumption(kg of oil equivalent) per 1 tonne of outputproduced in oxygen blown converters
Source: Author’s calculations on the basis of Ukrainian State Statistics Committee, Statystychnyi shchorichnyk Ukrainy za 1999 rik (Kyiv: Tekhnika, 2000); Ukrainian State Statistics Committee, Statystychnyi shchorichnyk Ukrainy za 2002 rik (Kyiv: Tekhnika, 2003).
Nonetheless, the current public policy instruments have not provided an effective
response to the drastic collapse of the domestic market for Ukrainian ferrous metals. As
Figure 23 (page 37) has shown, the recovery of Ukraine’s heavy engineering and
construction has been lagging far behind the domestic steel output growth. Furthermore,
the Ukrainian government has not been able to adequately address the detrimental effects
emanating from the disproportionate discrimination of the country’s steel producers
overseas. The Ukrainian government has failed so far to secure its membership in the
World Trade Organisation or, at least, to negotiate successfully granting of the market
economy status for the country. The Ukrainian authorities have been addressing the
problem of the fragmentary ownership transformation of the industrial sector by

51
facilitating the establishment of large national conglomerates based on ferrous metals.
While this strategy has provided a certain incentive for the industry’s consolidation and
overall management improvement, it has also led to a number of privatisation conflicts
between different conglomerates around particular steel works and other ferrous metals
enterprises. Figure 26 above shows that a large number of steel works, mines, and
factories are owned and/or controlled by at least two difference holding companies.
Reportedly, such situations have not been beneficial for the output stability and
production efficiency of the Ukrainian ferrous metals industry per se. Ukraine’s current
public policies vis-à-vis the domestic steel industry have also failed to adequately address
the problem of raw material shortages suffered by a number of largest steel companies.
The acuteness of the resource shortage problem has not been anticipated, while the
monopolisation of the industry’s resource base has not been properly tackled.
CONCLUSION
This paper has overviewed the Ukrainian ferrous metals sector – the industrial branch of
an overwhelming importance for the national economy. It has shown that the Ukrainian
iron and steel industry entered the period of the post-communist transformation as a fully-
grown and densely-located manufacturing sector. This paper has also examined the
economic outcomes generated by the Ukrainian iron and steel industry in the course of
the post-communist transformation. It has argued that one of the main outcomes of
Ukraine’s post-communist transition has been a massive, sharp, deep, and long decline in
the ferrous metals output. The Ukrainian iron and steel industry in transition has also been
characterised by deteriorating efficiency, falling labour productivity, low returns on
investment, and mediocre profits. On the whole, in the 1990s, the Ukrainian ferrous
metals sector has gone through an extremely unstable economic period. The remarkable
export expansion has been undertaken by the Ukrainian steel companies under highly
volatile conditions of the international steel markets.
The recovery of the ferrous metals industry has preceded the overall revival of Ukraine’s
industrial sector by at least two years. Since the end of 1998, the Ukrainian iron and steel
industry has followed a generally upward growth path. Nonetheless, whilst the delayed
revival of the Ukrainian manufacturing sector has been almost linear, by contrast, the

52
steel industry has been growing in a rather haphazard way. The export sales revenues and
profit earnings reported by the Ukrainian ferrous metals companies have also been erratic.
Moreover, while a small number of Ukraine’s steel works have recently taken the leading
market positions, the majority of the ferrous metals companies are clearly lagging far
behind, while some enterprises have apparently been reduced to rubble.
This paper has analysed a number of causes of the unusually poor performance of
Ukraine’s ferrous metals sector. It has discovered five major challenges the industry has
been faced with since the beginning of the 1990s. It has been contended that the collapse
of Ukraine’s domestic steel market and the industry’s resultant dependence upon the
volatile markets overseas constitute the first two fundamental long-term challenges to the
sustainability of the Ukrainian ferrous metals industry. The industry’s obsolete production
technology and its undeveloped steel product assortment have been identified as the third
long-term developmental challenge. This paper has also recognised Ukraine’s protracted
privatisation process, which has produced a fragmentary ownership structure, as well as
the growing shortage of raw materials within the ferrous metals sector, as the industry’s
two core short-term problems. It has been argued further that, apart from the
technological gap challenge, the current public policy environment has not provided an
adequate response to the industry’s transformation challenges.

53
REFERENCE LIST
Bannock, Graham, Baxter, R.E., and Evan, Davis. (1992). The Penguin Dictionary of Economics, 5th edn. London: Penguin Books Bornstein, Morris, ed. (1985). Comparative Economic Systems: Models and Cases, 5th edn. Homewood, Illinois: Richard D. Irwin Chumachenko, N.G. (1977). Ekonomika promyshlennosti Donbassa, 1945-1975. Kyiv: Naukova dumka Elliott, John E. (1973). Comparative Economic System. Englewood Cliffs, New Jersey: Prentice-Hall Gardner, H. Stephen. (1998). Comparative Economic Systems, 2nd edn. Fort Worth, Texas: Dryden Press Gregory, Paul R., and Stuart, Robert C. (1999). Comparative Economic Systems, 6th edn. Boston: Houghton Mifflin International Iron and Steel Institute. (2003). World Steel in Figures: 2003 Edition. Brussels: IISI International Monetary Fund. (2003). ‘Ukraine: Selected Issues’, IMF Country Report No. 03/173 (June) Petryha, M.O. (1998). ‘Rozmishchennia haluzei metalurgiinoho kompleksu’, in Ye.P. Kachan, ed., Rozmishchennia produktyvnykh syl Ukrainy. Kyiv: Vyshcha shkola, pp. 126-39 Singh, Ajit. (1987). ‘Manufacturing and de-industrialization’, in John Eatwell, Murray Milgate, and Peter Newman, eds., The New Palgrave: A Dictionary of Economics, in 4 vols. Vol. 3. London: Macmillan Press, pp. 301-08 The Organisation for Economic Co-operation and Development. (2001). Developments in Steel-making Capacity of Non-OECD Countries. Paris: OECD Thurow, Lester C. (1987). ‘Declining industries’, in John Eatwell, Murray Milgate, and Peter Newman, eds., The New Palgrave: A Dictionary of Economics, in 4 vols. Vol. 1. London: Macmillan Press, pp. 756-58 Ukrainian State Statistics Committee. (2003) Statystychnyi shchorichnyk Ukrainy za 2002 rik. Kyiv: Technika Zastavnyi, F.D. (1990). Heohrafiia Ukraïny. L’viv: Svit. Zimbalist, Andrew, ed. (1984). Comparative Economic Systems: An Assessment of Knowledge, Theory and Method. Boston: Kluwer-Nijhoff Publishing