Embed Size (px)
Citation preview
Contents
The Reports Page
Highlights 1 Chairman’s Letter to Shareholders 2 CEO’s Letter to Shareholders 4 Strategic Report 6 Directors’ Report 13 Statement of Directors’ Responsibilities 19 Corporate Governance Statement 20 Directors’ Remuneration Report 23 Independent Auditor’s Report to the Members of VivoPower International PLC 42
Group Financial Statements and Notes
Consolidated Statement of Comprehensive Income 44 Consolidated Statement of Financial Position 45 Consolidated Statement of Cash Flow 46 Consolidated Statement of Changes in Equity 47 Notes to the Financial Statements 48
Parent Company Financial Statements and Notes
Company Statement of Financial Position 77 Company Statement of Changes in Equity 78 Notes to the Company Financial Statements 79
Other Information
Company Information 82
Highlights
Page | 1
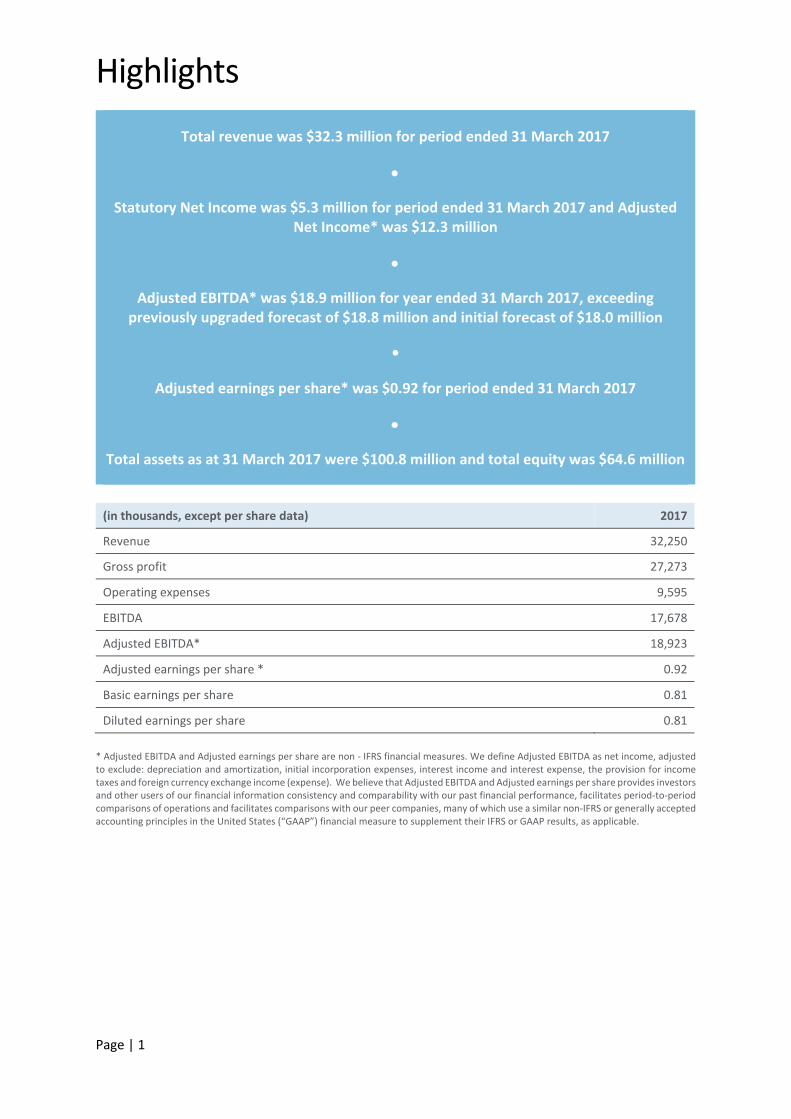
Total revenue was $32.3 million for period ended 31 March 2017
Statutory Net Income was $5.3 million for period ended 31 March 2017 and Adjusted Net Income* was $12.3 million
Adjusted EBITDA* was $18.9 million for year ended 31 March 2017, exceeding previously upgraded forecast of $18.8 million and initial forecast of $18.0 million
•
Adjusted earnings per share* was $0.92 for period ended 31 March 2017
Total assets as at 31 March 2017 were $100.8 million and total equity was $64.6 million
(in thousands, except per share data) 2017
Revenue 32,250
Gross profit 27,273
Operating expenses 9,595
EBITDA 17,678
Adjusted EBITDA* 18,923
Adjusted earnings per share * 0.92
Basic earnings per share 0.81
Diluted earnings per share 0.81
* Adjusted EBITDA and Adjusted earnings per share are non ‐ IFRS financial measures. We define Adjusted EBITDA as net income, adjusted to exclude: depreciation and amortization, initial incorporation expenses, interest income and interest expense, the provision for income taxes and foreign currency exchange income (expense). We believe that Adjusted EBITDA and Adjusted earnings per share provides investors and other users of our financial information consistency and comparability with our past financial performance, facilitates period‐to‐period comparisons of operations and facilitates comparisons with our peer companies, many of which use a similar non‐IFRS or generally accepted accounting principles in the United States (“GAAP”) financial measure to supplement their IFRS or GAAP results, as applicable.
Chairman’s Letter to Shareholders
Page | 2
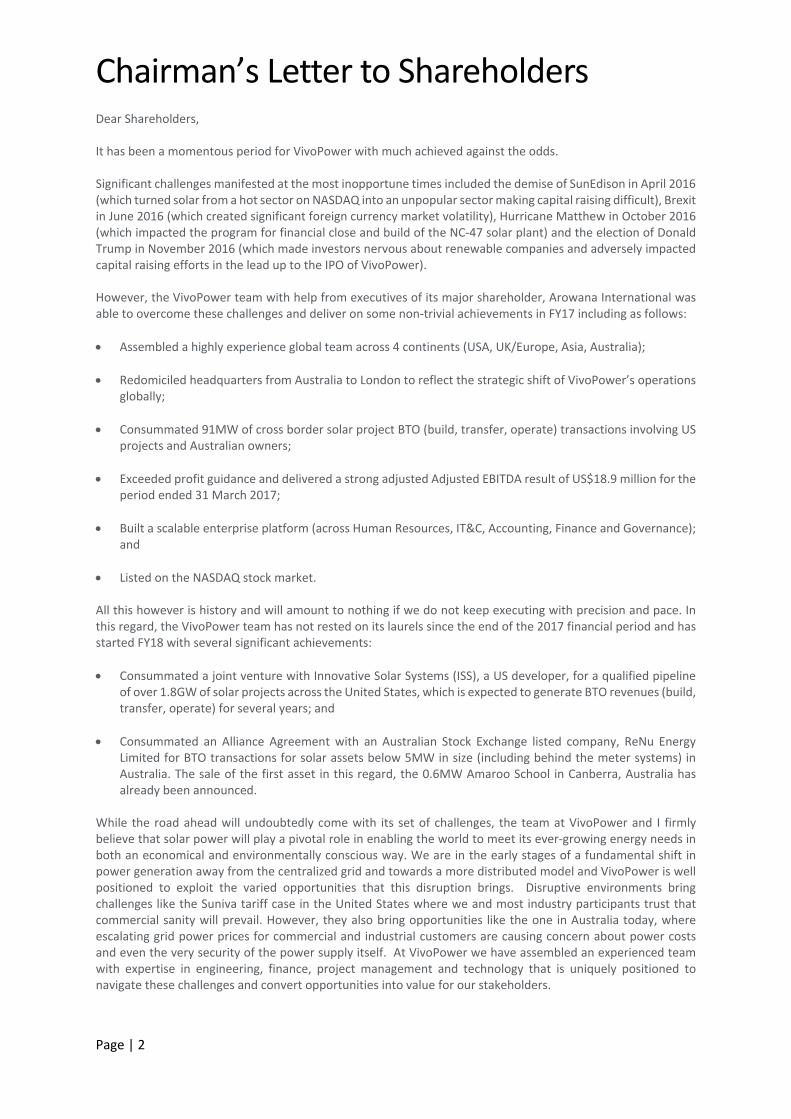
Dear Shareholders, It has been a momentous period for VivoPower with much achieved against the odds. Significant challenges manifested at the most inopportune times included the demise of SunEdison in April 2016 (which turned solar from a hot sector on NASDAQ into an unpopular sector making capital raising difficult), Brexit in June 2016 (which created significant foreign currency market volatility), Hurricane Matthew in October 2016 (which impacted the program for financial close and build of the NC‐47 solar plant) and the election of Donald Trump in November 2016 (which made investors nervous about renewable companies and adversely impacted capital raising efforts in the lead up to the IPO of VivoPower). However, the VivoPower team with help from executives of its major shareholder, Arowana International was able to overcome these challenges and deliver on some non‐trivial achievements in FY17 including as follows:
Assembled a highly experience global team across 4 continents (USA, UK/Europe, Asia, Australia);
Redomiciled headquarters from Australia to London to reflect the strategic shift of VivoPower’s operations globally;
Consummated 91MW of cross border solar project BTO (build, transfer, operate) transactions involving US projects and Australian owners;
Exceeded profit guidance and delivered a strong adjusted Adjusted EBITDA result of US$18.9 million for the period ended 31 March 2017;
Built a scalable enterprise platform (across Human Resources, IT&C, Accounting, Finance and Governance); and
Listed on the NASDAQ stock market. All this however is history and will amount to nothing if we do not keep executing with precision and pace. In this regard, the VivoPower team has not rested on its laurels since the end of the 2017 financial period and has started FY18 with several significant achievements:
Consummated a joint venture with Innovative Solar Systems (ISS), a US developer, for a qualified pipeline of over 1.8GW of solar projects across the United States, which is expected to generate BTO revenues (build, transfer, operate) for several years; and
Consummated an Alliance Agreement with an Australian Stock Exchange listed company, ReNu Energy Limited for BTO transactions for solar assets below 5MW in size (including behind the meter systems) in Australia. The sale of the first asset in this regard, the 0.6MW Amaroo School in Canberra, Australia has already been announced.
While the road ahead will undoubtedly come with its set of challenges, the team at VivoPower and I firmly believe that solar power will play a pivotal role in enabling the world to meet its ever‐growing energy needs in both an economical and environmentally conscious way. We are in the early stages of a fundamental shift in power generation away from the centralized grid and towards a more distributed model and VivoPower is well positioned to exploit the varied opportunities that this disruption brings. Disruptive environments bring challenges like the Suniva tariff case in the United States where we and most industry participants trust that commercial sanity will prevail. However, they also bring opportunities like the one in Australia today, where escalating grid power prices for commercial and industrial customers are causing concern about power costs and even the very security of the power supply itself. At VivoPower we have assembled an experienced team with expertise in engineering, finance, project management and technology that is uniquely positioned to navigate these challenges and convert opportunities into value for our stakeholders.

Chairman’s Letter to Shareholders
Page | 3
With the achievements over the last 14 months, VivoPower has laid the foundation for future multi‐year revenue and profit growth. It will however be important to stay resilient, agile and focused on execution. On behalf of the rest of the board, I would like to take this opportunity to thank all of the VivoPower team, our partners, financiers, customers, suppliers and shareholders for their support and engagement during the period. Sincerely,
Kevin Chin Chairman 28 July 2017
CEO’s Letter to Shareholders
Page | 4
Dear Shareholders,
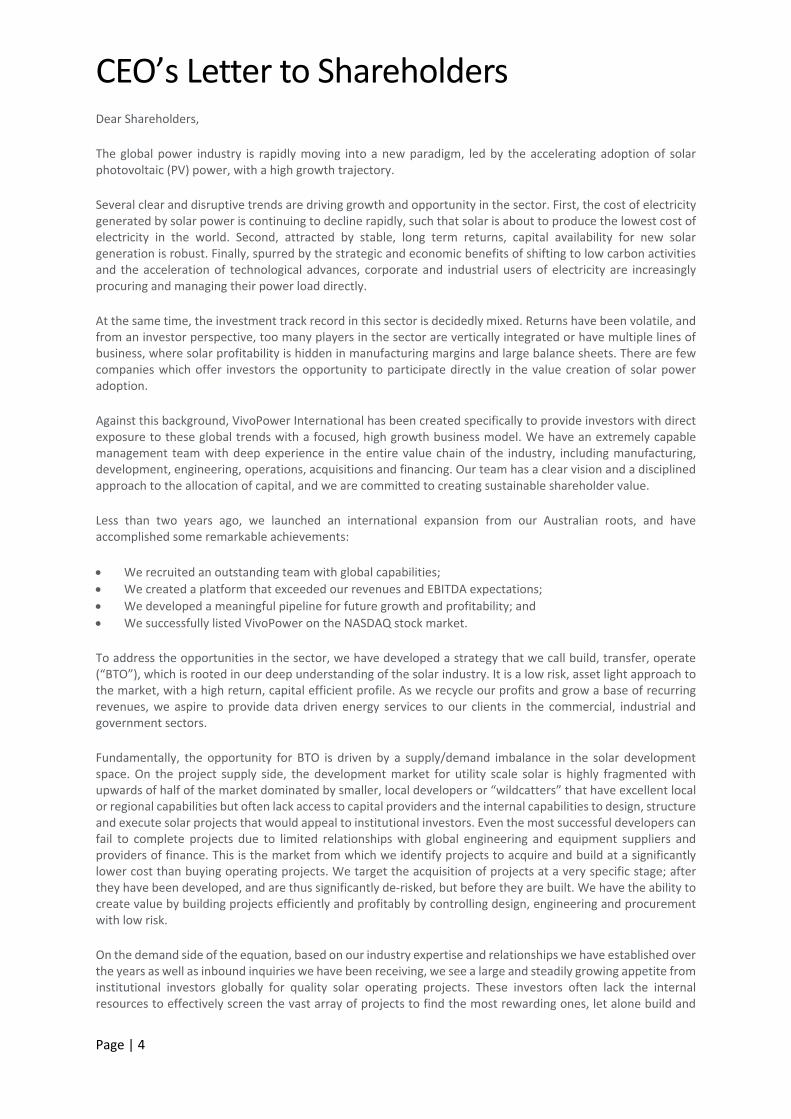
The global power industry is rapidly moving into a new paradigm, led by the accelerating adoption of solar photovoltaic (PV) power, with a high growth trajectory.
Several clear and disruptive trends are driving growth and opportunity in the sector. First, the cost of electricity generated by solar power is continuing to decline rapidly, such that solar is about to produce the lowest cost of electricity in the world. Second, attracted by stable, long term returns, capital availability for new solar generation is robust. Finally, spurred by the strategic and economic benefits of shifting to low carbon activities and the acceleration of technological advances, corporate and industrial users of electricity are increasingly procuring and managing their power load directly.
At the same time, the investment track record in this sector is decidedly mixed. Returns have been volatile, and from an investor perspective, too many players in the sector are vertically integrated or have multiple lines of business, where solar profitability is hidden in manufacturing margins and large balance sheets. There are few companies which offer investors the opportunity to participate directly in the value creation of solar power adoption.
Against this background, VivoPower International has been created specifically to provide investors with direct exposure to these global trends with a focused, high growth business model. We have an extremely capable management team with deep experience in the entire value chain of the industry, including manufacturing, development, engineering, operations, acquisitions and financing. Our team has a clear vision and a disciplined approach to the allocation of capital, and we are committed to creating sustainable shareholder value.
Less than two years ago, we launched an international expansion from our Australian roots, and have accomplished some remarkable achievements:
We recruited an outstanding team with global capabilities;
We created a platform that exceeded our revenues and EBITDA expectations;
We developed a meaningful pipeline for future growth and profitability; and
We successfully listed VivoPower on the NASDAQ stock market.
To address the opportunities in the sector, we have developed a strategy that we call build, transfer, operate (“BTO”), which is rooted in our deep understanding of the solar industry. It is a low risk, asset light approach to the market, with a high return, capital efficient profile. As we recycle our profits and grow a base of recurring revenues, we aspire to provide data driven energy services to our clients in the commercial, industrial and government sectors.
Fundamentally, the opportunity for BTO is driven by a supply/demand imbalance in the solar development space. On the project supply side, the development market for utility scale solar is highly fragmented with upwards of half of the market dominated by smaller, local developers or “wildcatters” that have excellent local or regional capabilities but often lack access to capital providers and the internal capabilities to design, structure and execute solar projects that would appeal to institutional investors. Even the most successful developers can fail to complete projects due to limited relationships with global engineering and equipment suppliers and providers of finance. This is the market from which we identify projects to acquire and build at a significantly lower cost than buying operating projects. We target the acquisition of projects at a very specific stage; after they have been developed, and are thus significantly de‐risked, but before they are built. We have the ability to create value by building projects efficiently and profitably by controlling design, engineering and procurement with low risk.
On the demand side of the equation, based on our industry expertise and relationships we have established over the years as well as inbound inquiries we have been receiving, we see a large and steadily growing appetite from institutional investors globally for quality solar operating projects. These investors often lack the internal resources to effectively screen the vast array of projects to find the most rewarding ones, let alone build and
CEO’s Letter to Shareholders
Page | 5
operate the projects themselves. Based on our relationships and expertise, we have the credibility to secure capital commitments prior to building and then to transfer projects to these investors once built. This approach allows us to lock in our BTO profit before we risk capital, as well as to generate stable recurring revenues from long term asset management agreements and residual equity interests in the projects.
Another revenue opportunity comes from the consumers of the electric power produced from the projects that we operate. We intend to capture valuable data related to power generation and consumption from our growing base of solar projects in order to provide energy management services and to optimize our energy clients’ needs. We will use operational information to improve the profitability of our projects and to take advantage of technological improvements to create additional revenues.
We clearly demonstrated the viability of our model last year, by competing BTO transactions for 91 megawatts of solar projects and delivering Adjusted EBITDA of US$18.9 million for the period ended 31 March 2017, significantly above our initial goals. We are pleased with our strong forward growth outlook, and are providing guidance for next year of 20‐25% growth in our EBITDA results. This outlook is supported by two strategic initiatives that we believe have laid the foundation for revenues and profits for several years; a joint venture for over 1.8 gigawatts in the United States and an alliance agreement with ReNu Energy in Australia.
The joint venture in the US is at the core of our business model, as it represents a long term partnership with an excellent development company, where we have secured exclusive rights to acquire and build over 1.8 gigawatts of solar projects in a diversified portfolio of 37 projects in 12 states. We have a demonstrated track record with the developer, who was the original developer for our 91 megawatts completed last year. We have complementary skill sets and both believe that we are mutually aligned to ensure the successful execution of the joint venture.
The alliance agreement with ReNu Energy significantly strengthens our strategic acquisition of Aevitas which was completed in December 2016. The historical revenue profile of Aevitas has been extremely steady, representing energy services for over 300 commercial and industrial customers in Australia. Our goal with Aevitas is to maintain and grow their core business, and also leverage their customer base to generate new solar projects. The agreement with ReNu Energy provides a commitment from an investor to whom we can transfer projects that we build. This relationship should provide a highly efficient means to create BTO revenues for smaller projects originated in Australia with the Aevitas client base.
We see a bright future for our activities and we are focused on execution. Overall, we are committed to capturing the exciting trends in our industry and to delivering value for our shareholders. The entire industry is evolving rapidly, and we have conviction that VivoPower and our shareholders will benefit from these trends.
Thank you for your support and confidence in our team.
Sincerely,
Dr. Philip Comberg CEO 28 July 2017
Strategic Report
Page | 6
Principal Activities
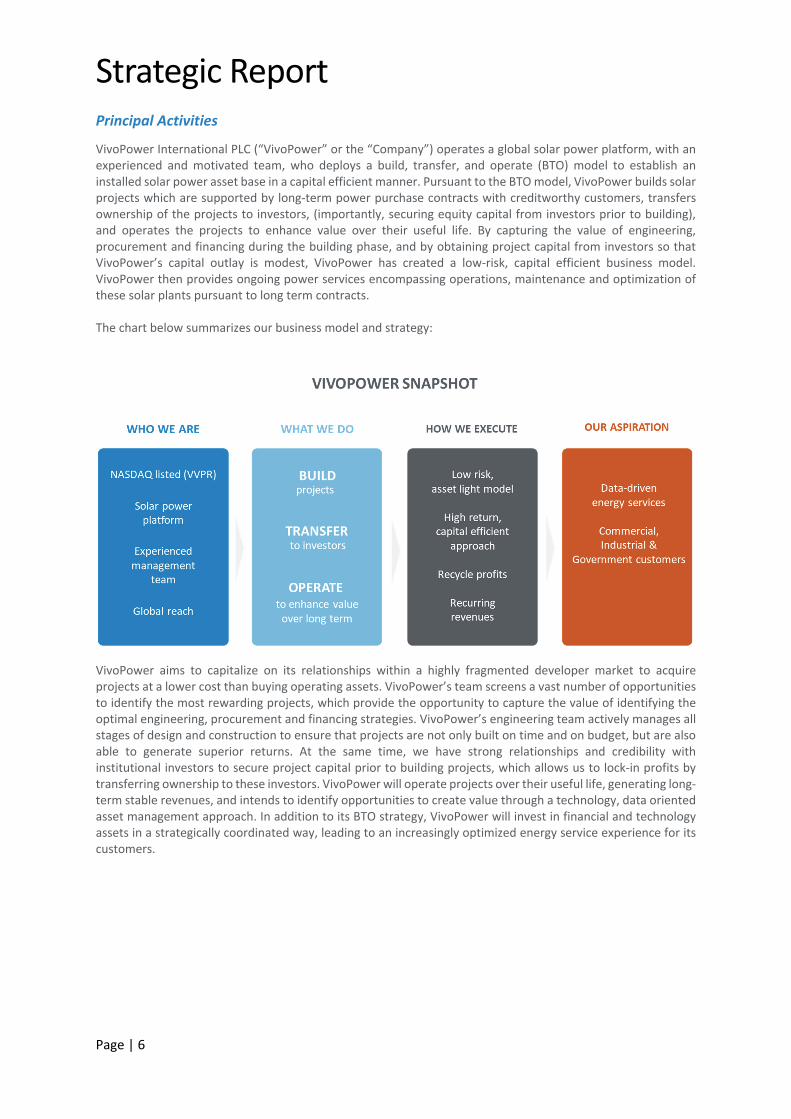
VivoPower International PLC (“VivoPower” or the “Company”) operates a global solar power platform, with an experienced and motivated team, who deploys a build, transfer, and operate (BTO) model to establish an installed solar power asset base in a capital efficient manner. Pursuant to the BTO model, VivoPower builds solar projects which are supported by long‐term power purchase contracts with creditworthy customers, transfers ownership of the projects to investors, (importantly, securing equity capital from investors prior to building), and operates the projects to enhance value over their useful life. By capturing the value of engineering, procurement and financing during the building phase, and by obtaining project capital from investors so that VivoPower’s capital outlay is modest, VivoPower has created a low‐risk, capital efficient business model. VivoPower then provides ongoing power services encompassing operations, maintenance and optimization of these solar plants pursuant to long term contracts. The chart below summarizes our business model and strategy:
VivoPower aims to capitalize on its relationships within a highly fragmented developer market to acquire projects at a lower cost than buying operating assets. VivoPower’s team screens a vast number of opportunities to identify the most rewarding projects, which provide the opportunity to capture the value of identifying the optimal engineering, procurement and financing strategies. VivoPower’s engineering team actively manages all stages of design and construction to ensure that projects are not only built on time and on budget, but are also able to generate superior returns. At the same time, we have strong relationships and credibility with institutional investors to secure project capital prior to building projects, which allows us to lock‐in profits by transferring ownership to these investors. VivoPower will operate projects over their useful life, generating long‐term stable revenues, and intends to identify opportunities to create value through a technology, data oriented asset management approach. In addition to its BTO strategy, VivoPower will invest in financial and technology assets in a strategically coordinated way, leading to an increasingly optimized energy service experience for its customers.
Strategic Report (continued)
Page | 7
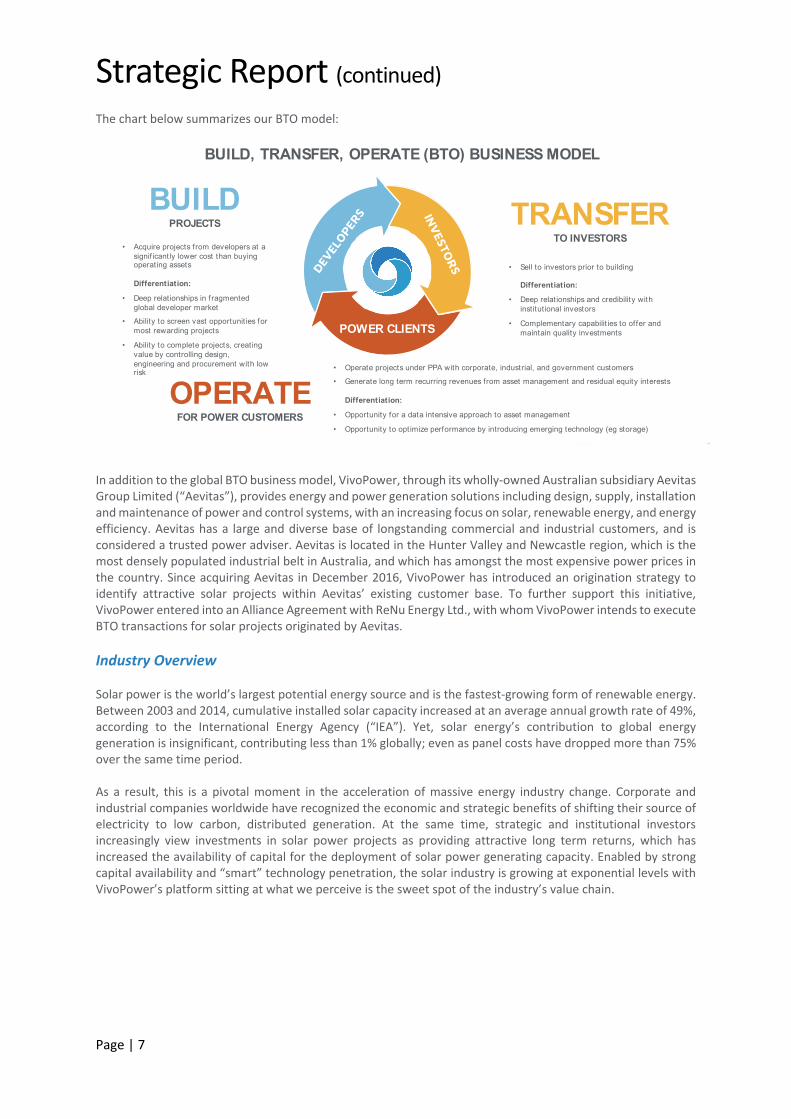
The chart below summarizes our BTO model:
In addition to the global BTO business model, VivoPower, through its wholly‐owned Australian subsidiary Aevitas Group Limited (“Aevitas”), provides energy and power generation solutions including design, supply, installation and maintenance of power and control systems, with an increasing focus on solar, renewable energy, and energy efficiency. Aevitas has a large and diverse base of longstanding commercial and industrial customers, and is considered a trusted power adviser. Aevitas is located in the Hunter Valley and Newcastle region, which is the most densely populated industrial belt in Australia, and which has amongst the most expensive power prices in the country. Since acquiring Aevitas in December 2016, VivoPower has introduced an origination strategy to identify attractive solar projects within Aevitas’ existing customer base. To further support this initiative, VivoPower entered into an Alliance Agreement with ReNu Energy Ltd., with whom VivoPower intends to execute BTO transactions for solar projects originated by Aevitas.
Industry Overview Solar power is the world’s largest potential energy source and is the fastest‐growing form of renewable energy. Between 2003 and 2014, cumulative installed solar capacity increased at an average annual growth rate of 49%, according to the International Energy Agency (“IEA”). Yet, solar energy’s contribution to global energy generation is insignificant, contributing less than 1% globally; even as panel costs have dropped more than 75% over the same time period. As a result, this is a pivotal moment in the acceleration of massive energy industry change. Corporate and industrial companies worldwide have recognized the economic and strategic benefits of shifting their source of electricity to low carbon, distributed generation. At the same time, strategic and institutional investors increasingly view investments in solar power projects as providing attractive long term returns, which has increased the availability of capital for the deployment of solar power generating capacity. Enabled by strong capital availability and “smart” technology penetration, the solar industry is growing at exponential levels with VivoPower’s platform sitting at what we perceive is the sweet spot of the industry’s value chain.
BUILD, TRANSFER, OPERATE (BTO) BUSINESS MODEL
POWER CLIENTS
• Acquire projects from developers at a signif icantly lower cost than buying operating assets
Differentiation:
• Deep relationships in fragmented global developer market
• Ability to screen vast opportunit ies for most rewarding projects
• Ability to complete projects, creating value by controlling design, engineering and procurement with low risk
• Sell to investors prior to building
Differentiation:
• Deep relationships and credibility with institut ional investors
• Complementary capabilit ies to offer and maintain quality investments
• Operate projects under PPA with corporate, industrial, and government customers
• Generate long term recurring revenues from asset management and residual equity interests
Differentiation:
• Opportunity for a data intensive approach to asset management
• Opportunity to opt imize performance by introducing emerging technology (eg storage)
BUILDPROJECTS TRANSFER
TO INVESTORS
OPERATEFOR POWER CUSTOMERS
Strategic Report (continued)
Page | 8
Long Term Outlook The global energy architecture is increasingly becoming decentralized and digitized as today’s internet connected devices are able to measure, monitor and analyze energy supply and demand in real time. In the future, VivoPower will build out its capabilities in data analytics and emerging technologies that will enable it to capitalize on these trends and become a leader in energy efficiency, storage, demand management, remote energy and distributed energy grid design.
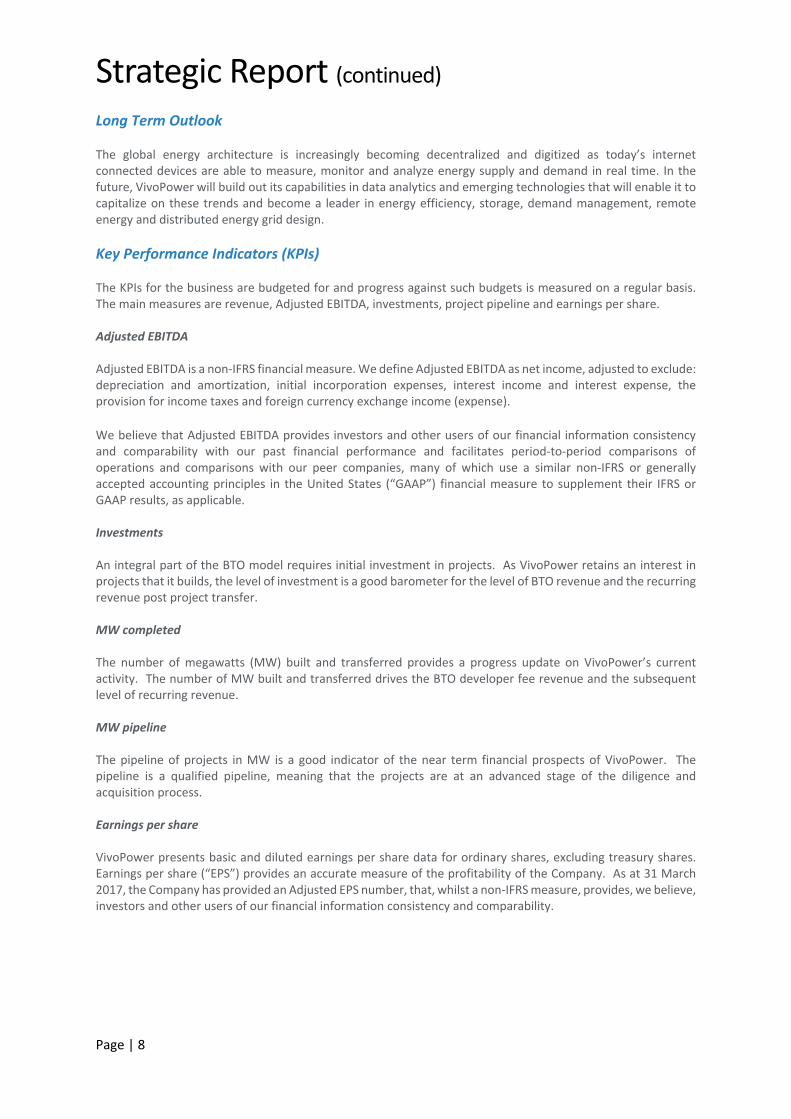
Key Performance Indicators (KPIs) The KPIs for the business are budgeted for and progress against such budgets is measured on a regular basis. The main measures are revenue, Adjusted EBITDA, investments, project pipeline and earnings per share. Adjusted EBITDA Adjusted EBITDA is a non‐IFRS financial measure. We define Adjusted EBITDA as net income, adjusted to exclude: depreciation and amortization, initial incorporation expenses, interest income and interest expense, the provision for income taxes and foreign currency exchange income (expense).
We believe that Adjusted EBITDA provides investors and other users of our financial information consistency and comparability with our past financial performance and facilitates period‐to‐period comparisons of operations and comparisons with our peer companies, many of which use a similar non‐IFRS or generally accepted accounting principles in the United States (“GAAP”) financial measure to supplement their IFRS or GAAP results, as applicable. Investments An integral part of the BTO model requires initial investment in projects. As VivoPower retains an interest in projects that it builds, the level of investment is a good barometer for the level of BTO revenue and the recurring revenue post project transfer. MW completed The number of megawatts (MW) built and transferred provides a progress update on VivoPower’s current activity. The number of MW built and transferred drives the BTO developer fee revenue and the subsequent level of recurring revenue. MW pipeline The pipeline of projects in MW is a good indicator of the near term financial prospects of VivoPower. The pipeline is a qualified pipeline, meaning that the projects are at an advanced stage of the diligence and acquisition process. Earnings per share VivoPower presents basic and diluted earnings per share data for ordinary shares, excluding treasury shares. Earnings per share (“EPS”) provides an accurate measure of the profitability of the Company. As at 31 March 2017, the Company has provided an Adjusted EPS number, that, whilst a non‐IFRS measure, provides, we believe, investors and other users of our financial information consistency and comparability.
Strategic Report (continued)
Page | 9
Operating Performance During Period ended 31 March 2017 During the period ended 31 March 2017, the group generated revenue of $32.3 million and Adjusted EBITDA of $18.9 million and Adjusted Net Income of $12.3 million. The Company at the end of the period had net assets of $64.6 million, with intangible assets, including goodwill, of $46.3 million and investments of $18.1 million. The group’s current assets were $30.8 million of which $11.0 million is cash and cash equivalents. Current liabilities were $12.2 million, giving a current ratio of 2.5:1. Revenue growth was supported by the completion of the group’s first solar project and the near completion of a second project, both in North Carolina, United States. Combined revenue for both projects was $24.6 million with further revenue of $0.4 million due to the power generation of the first project. Further BTO revenue in Australia from projects acquired in December 2016 generated $0.1 million. Aevitas generated revenue of $5.6 million for the 3 months to March 2017. The group generated strong cash flows from operating activities of $6.3 million. At the end of the period the group had cash reserves of $11.0 million and debt of $20.0 million, giving a net debt position of $9.0 million. The group financed activities until the Company became public through a related party loan from Arowana International Limited, (“Arowana”), a publicly traded company in Australia of which VivoPower was, prior to December 28, 2016, a wholly owned subsidiary. At the end of the financial period, the amounts owing to Arowana were $20.5 million, of which $19.0 million was a non‐current related party loan with an initial repayment date of 1 April 2018. The remaining balance of $1.5 million was a current liability which was repaid in June 2017. VivoPower’s ordinary shares commenced trading on The Nasdaq Capital Market on 29 December 2016 under the symbol VVPR. The transaction generated proceeds of $22.5 million with transaction costs of $11.5 million. Contemporaneously with the transaction, the group completed two acquisitions, VivoPower Pty Limited and Aevitas Group of Companies at a total cash consideration cost of $10.1 million. The group during the period invested $18.0 million in two solar energy projects in the US. The group, as part of its long‐term strategy, has retained a 14.5% and 10% equity interest in the projects which will generate recurring revenue in the future. In addition to the US solar assets, VivoPower has aggregated a 2.6MW portfolio of behind the meter Commercial, Industrial and Government (“CIG”) solar assets in Australia that are in the process of being structured for BTO transactions. During the period, VivoPower has assembled a high‐quality management team, with a wide breadth of experience within the solar industry, representing a complementary range of skills that will enable VivoPower to develop and expand its BTO model.
Directors During the period, the board of directors of the Company (the “Board”) had one female director. Following the resignation of Victoria Guy in August 2016, the Board is composed of one male executive director and four male non‐executive directors. Please see the Company’s policy on recruitment in the Corporate Responsibility section on page 19.
Share Buy‐Backs On 27 March 2017, the Company purchased 129,805 ordinary shares with a nominal value of $0.012 for a cost of $0.6 million. The Company has not purchased any additional shares since the period end. The shares are treated as treasury shares and are excluded from the calculation of EPS.
Strategic Report (continued)
Page | 10
Results and Transfers to Equity The audited financial statements and the related notes for the period ended 31 March 2017 are set out on pages 44 to 81. The profit for the period after taxation, was $5.3 million, with the directors proposing a nil dividend, the full amount of the profit was retained.
Principal Risks and Uncertainties
VivoPower operates a Build, Transfer and Operate (BTO) business model within the renewable energy sector and, in common with similar businesses, is exposed to a number of risks and uncertainties which could have a material impact on the group’s long‐term performance and could cause actual results to differ materially from historical and expected results. Market risk The group’s financial performance is tied very closely to the business activity within both the renewable energy and the investment management sectors. Capital and project availability are identified as being key market risks. Operational risk VivoPower operates within local, and national, laws and regulations which from time to time may change. Competitive risk Having the ability to pay developers down‐payments to secure pipeline is advantageous, but there is competition from parties pursuing similar transactions. VivoPower expects greater competition from other parties entering the sector with this capability. People risk Attraction and retention of key staff is essential to the continued success of the business. The Board recognises that the future success of the group will depend to a substantial extent not only on the ability and experience of its senior management, but also on individuals and teams that support the projects. Staff are remunerated appropriately and employees are encouraged to develop their skills. International risk As the group operates internationally, it is subject to the tax laws and regulations of several countries. In addition, conducting business on different continents presents logistical and management challenges whether related to local standards, business cultures or compliance. The group takes careful steps to comply with all applicable tax and other laws, rules and regulations. Financial risk It is the group’s policy to manage identifiable financial risks. The group operates globally and so has exposure to movements in exchange rates, in particular between the US Dollar, GB Pound and Australian Dollar. The group ensures that it holds sufficient cash amounts to meet all working capital requirements. For further discussion on financial risk refer to note 28 to the financial statements.
Employees
People are central to our business and the contribution of talented and motivated employees is vital to the continued success of the group.
Strategic Report (continued)
Page | 11
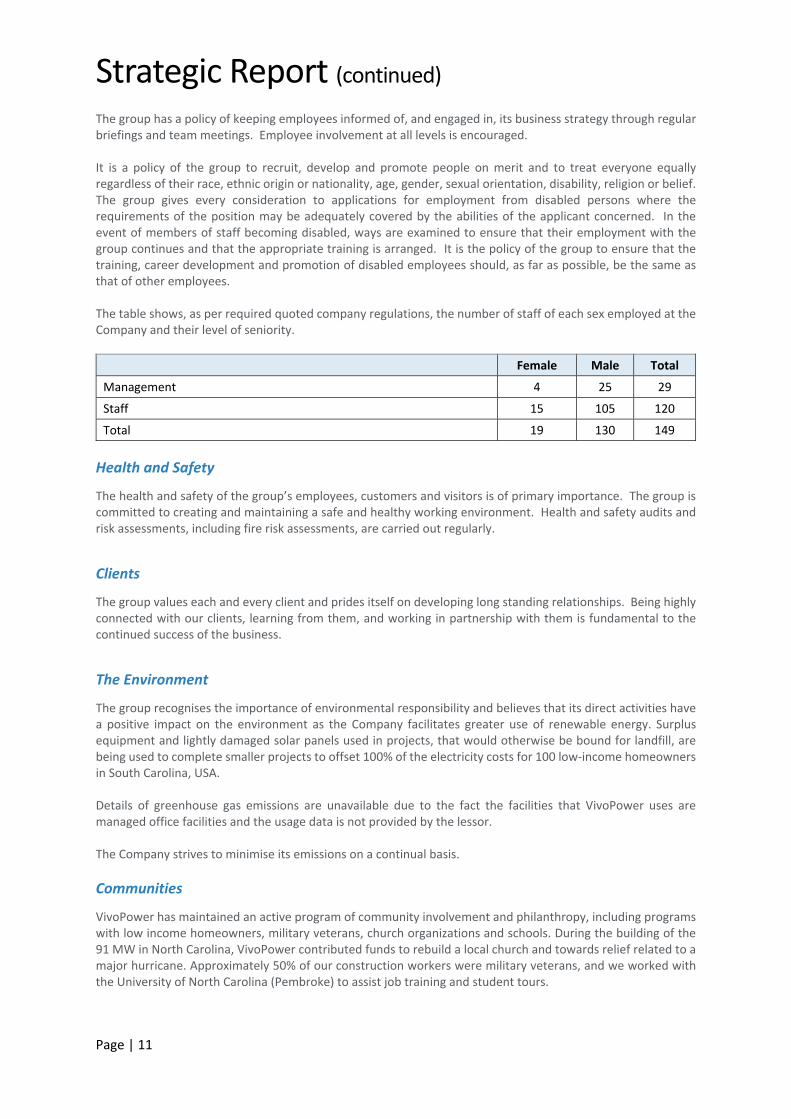
The group has a policy of keeping employees informed of, and engaged in, its business strategy through regular briefings and team meetings. Employee involvement at all levels is encouraged. It is a policy of the group to recruit, develop and promote people on merit and to treat everyone equally regardless of their race, ethnic origin or nationality, age, gender, sexual orientation, disability, religion or belief. The group gives every consideration to applications for employment from disabled persons where the requirements of the position may be adequately covered by the abilities of the applicant concerned. In the event of members of staff becoming disabled, ways are examined to ensure that their employment with the group continues and that the appropriate training is arranged. It is the policy of the group to ensure that the training, career development and promotion of disabled employees should, as far as possible, be the same as that of other employees. The table shows, as per required quoted company regulations, the number of staff of each sex employed at the Company and their level of seniority.
Female Male Total
Management 4 25 29
Staff 15 105 120
Total 19 130 149
Health and Safety
The health and safety of the group’s employees, customers and visitors is of primary importance. The group is committed to creating and maintaining a safe and healthy working environment. Health and safety audits and risk assessments, including fire risk assessments, are carried out regularly.
Clients
The group values each and every client and prides itself on developing long standing relationships. Being highly connected with our clients, learning from them, and working in partnership with them is fundamental to the continued success of the business.
The Environment
The group recognises the importance of environmental responsibility and believes that its direct activities have a positive impact on the environment as the Company facilitates greater use of renewable energy. Surplus equipment and lightly damaged solar panels used in projects, that would otherwise be bound for landfill, are being used to complete smaller projects to offset 100% of the electricity costs for 100 low‐income homeowners in South Carolina, USA. Details of greenhouse gas emissions are unavailable due to the fact the facilities that VivoPower uses are managed office facilities and the usage data is not provided by the lessor. The Company strives to minimise its emissions on a continual basis.
Communities
VivoPower has maintained an active program of community involvement and philanthropy, including programs with low income homeowners, military veterans, church organizations and schools. During the building of the 91 MW in North Carolina, VivoPower contributed funds to rebuild a local church and towards relief related to a major hurricane. Approximately 50% of our construction workers were military veterans, and we worked with the University of North Carolina (Pembroke) to assist job training and student tours.
Strategic Report (continued)
Page | 12
In addition, we created an initiative for a low income community solar farm, comprising 2 MW located on 10 acres of distressed urban brown field in Spartanburg, South Carolina. The project will use slightly damaged modules from our projects, along with donations from other solar projects in the region. These modules otherwise would have been sent to local landfills, but instead will produce solar power to feed into the utility grid. Electricity revenues will be used to make the project self‐sustaining on an ongoing basis, and to offset 100% of the electricity needs for 100 very low income homeowners through our partnership with Habitat for Humanity. This program was accepted into the 18‐month US Department of Energy Sunshot program for low income solar. By order of the Board.
Dr. Philip Comberg Director 28 July 2017
Directors’ Report
Page | 13
The members of the board of directors present their annual report on the affairs of the group and the audited financial statements for the period ended 31 March 2017.
Subsidiaries
The subsidiary and associated undertakings principally affecting the profits and net assets of the group in the 14 months ended 31 March 2017 are listed in note 13 to the financial statements.
Business Review
A review of the Group’s business during the financial period ended 31 March 2017, and the position of the group at the end of the financial period are contained in the Strategic Report. As of 31 March 2017, the group includes subsidiaries in Australia, Jersey, Singapore, United Kingdom and the United States. Future Developments
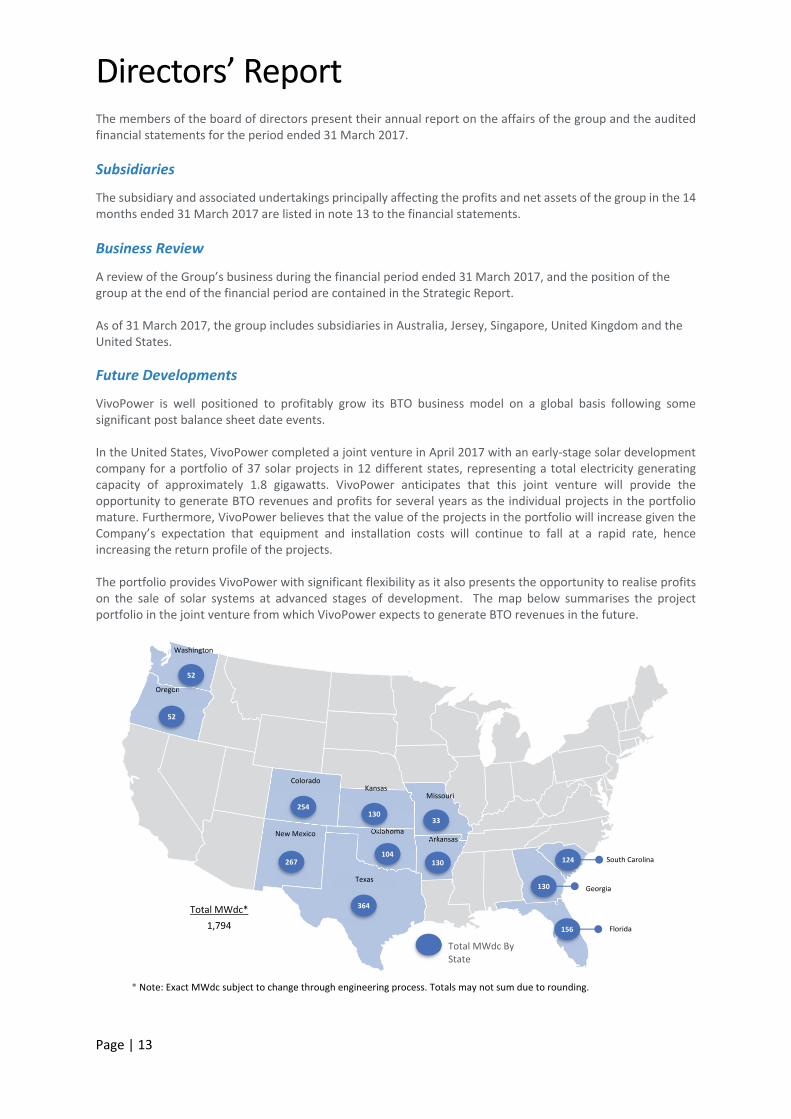
VivoPower is well positioned to profitably grow its BTO business model on a global basis following some significant post balance sheet date events. In the United States, VivoPower completed a joint venture in April 2017 with an early‐stage solar development company for a portfolio of 37 solar projects in 12 different states, representing a total electricity generating capacity of approximately 1.8 gigawatts. VivoPower anticipates that this joint venture will provide the opportunity to generate BTO revenues and profits for several years as the individual projects in the portfolio mature. Furthermore, VivoPower believes that the value of the projects in the portfolio will increase given the Company’s expectation that equipment and installation costs will continue to fall at a rapid rate, hence increasing the return profile of the projects. The portfolio provides VivoPower with significant flexibility as it also presents the opportunity to realise profits on the sale of solar systems at advanced stages of development. The map below summarises the project portfolio in the joint venture from which VivoPower expects to generate BTO revenues in the future.
Arkansas New Mexico
Texas
Total MWdc*
1,794
Total MWdc By State
Missouri Colorado
Kansas
Oklahoma
Oregon
Florida 156
Georgia 130
South Carolina 124 130
254 130
33
267 104
52
364
Washington
52
* Note: Exact MWdc subject to change through engineering process. Totals may not sum due to rounding.
Directors’ Report (continued)
Page | 14
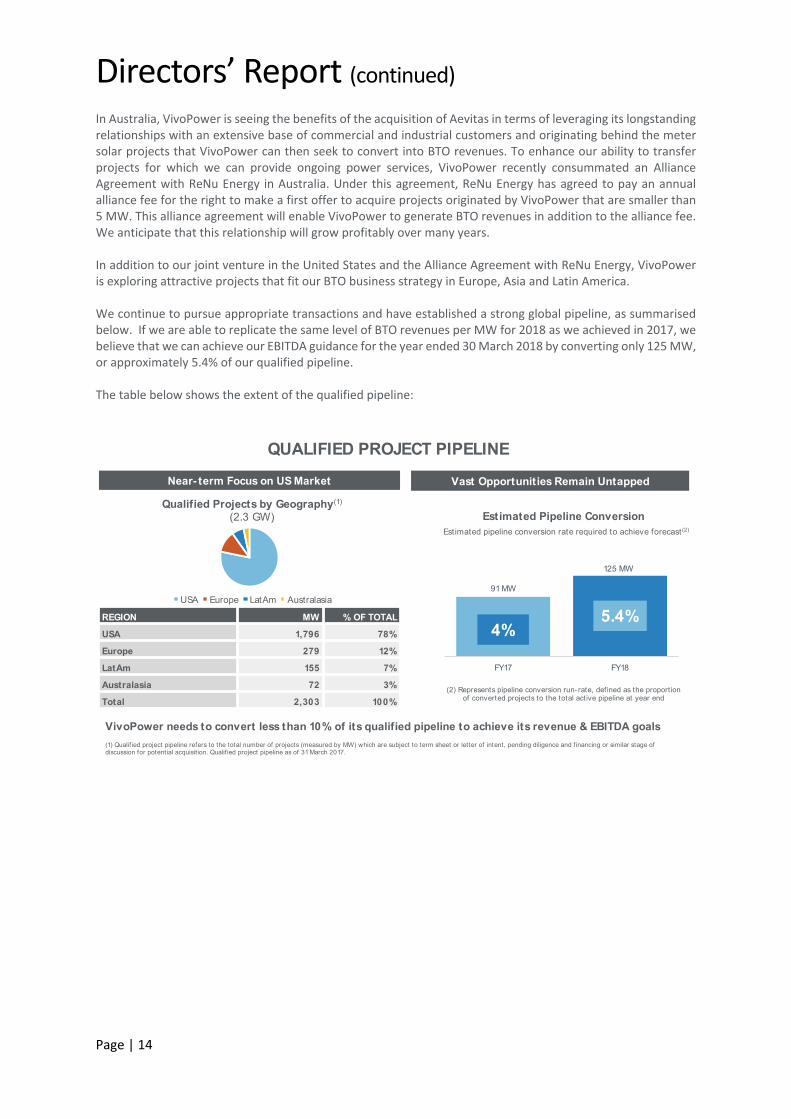
In Australia, VivoPower is seeing the benefits of the acquisition of Aevitas in terms of leveraging its longstanding relationships with an extensive base of commercial and industrial customers and originating behind the meter solar projects that VivoPower can then seek to convert into BTO revenues. To enhance our ability to transfer projects for which we can provide ongoing power services, VivoPower recently consummated an Alliance Agreement with ReNu Energy in Australia. Under this agreement, ReNu Energy has agreed to pay an annual alliance fee for the right to make a first offer to acquire projects originated by VivoPower that are smaller than 5 MW. This alliance agreement will enable VivoPower to generate BTO revenues in addition to the alliance fee. We anticipate that this relationship will grow profitably over many years. In addition to our joint venture in the United States and the Alliance Agreement with ReNu Energy, VivoPower is exploring attractive projects that fit our BTO business strategy in Europe, Asia and Latin America. We continue to pursue appropriate transactions and have established a strong global pipeline, as summarised below. If we are able to replicate the same level of BTO revenues per MW for 2018 as we achieved in 2017, we believe that we can achieve our EBITDA guidance for the year ended 30 March 2018 by converting only 125 MW, or approximately 5.4% of our qualified pipeline. The table below shows the extent of the qualified pipeline:
VivoPower needs to convert less than 10% of its qualified pipeline to achieve its revenue & EBITDA goals
QUALIFIED PROJECT PIPELINE
(2) Represents pipeline conversion run- rate, def ined as the proportion of converted projects to the total active pipeline at year end
91 MW
125 MW
0.00%
2000.00%
4000.00%
6000.00%
8000.00%
10000.00%
12000.00%
14000.00%
16000.00%
18000.00%
20000.00%
22000.00%
24000.00%
26000.00%
28000.00%
30000.00%
32000.00%
34000.00%
36000.00%
38000.00%
FY17 FY18
Estimated Pipeline ConversionQualified Projects by Geography(1)
(2.3 GW)
USA Europe LatAm Australasia
REGION MW % OF TOTAL
USA 1,796 78%
Europe 279 12%
LatAm 155 7%
Australasia 72 3%
Total 2,303 100%
(1) Qualif ied project pipeline refers to the total number of projects (measured by MW) which are subject to term sheet or letter of intent, pending diligence and financing or similar stage of discussion for potential acquisition. Qualif ied project pipeline as of 31 March 2017.
Estimated pipeline conversion rate required to achieve forecast(2)
Near- term Focus on US Market Vast Opportunities Remain Untapped
4%5.4%
Directors’ Report (continued)
Page | 15
Dividends The directors propose a nil dividend per ordinary share. There was no interim dividend declared during the financial period.
Capital Structure
Details of the issued share capital together with the details of the movements in the Company’s issued share capital, including treasury shares are shown in note 22 to the financial statements. Details of the share repurchase during the financial period are given in the Strategic Report on page 9 under “Share Buy‐Backs”.
Going Concern
Having reviewed the future plans and projections for the Company’s business and its current financial position, the directors are satisfied that the Company has adequate financial resources to continue to manage the business risks successfully and to remain in operational existence for the foreseeable future. Accordingly, they continue to adopt the going concern basis in preparing the report and accounts.
Suppliers
The group’s policy is to settle terms of payment with suppliers when agreeing the terms of each transaction, ensure that suppliers are made aware of the terms of payment and abide by the terms of payment. Trade creditors of the group at 31 March 2017 were equivalent to 45 days’ purchases, based upon the average daily amount invoiced by suppliers during the last quarter.
Donations
During the period, the group made no political contributions. Certain donations were made as described under “Communities” above.
Financial Management
The financial control of the Company is managed centrally. VivoPower aims to keep cash balances in each of its subsidiaries at a minimum and to fund the working capital requirements in time for each subsidiary to meet their financial obligations. A consolidated cash flow forecast is maintained on a weekly basis and is at the centre of our cash management strategy. The Company operates mainly in US Dollar and Australian Dollar and keeps sufficient balances in each currency to meet its working capital requirements, and does not currently see the need for any hedging arrangements. Further explanation of financial risk is contained in the Strategic Report on page 10.
Corporate Governance
While not a requirement under Nasdaq listing rules, the group has voluntarily disclosed the Company’s Corporate Governance Statement on pages 20 to 22 of the financial statements.
Directors’ Report (continued)
Page | 16
Directors
The directors who held office during the period and up until the date of this report: Non‐executive Executive KTF Chin (appointed 27 April 2016) P Comberg (appointed 1 May 2016) G Hui (appointed 21 December 2016) PM Broomhead (resigned 2 Nov 2016) EB Hyams (appointed 2 November 2016) P Emery (resigned 31 July 2016) P Sermol (appointed 21 December 2016) VC Guy (resigned 8 August 2016) DT Kenny (resigned 2 November 2016) LF Moore (resigned 1 April 2016) JA Reader (resigned 1 April 2016) Details of the current Board of Directors and their relevant experience is provided below.
Philip Comberg Philip brings over twenty years of experience as CEO, board member, investor, investment banker and attorney in Europe, the US andAsia. In the past ten years, he has taken different roles in the solar industry which most recently include non‐executive Chairman of Solarcentury Holdings in the UK. From 2011 to 2014 he was Chairman and CEO of Germany’s foremost solar company, Conergy, leading its restructuring and sale to Kawa Capital. Prior to that, he served on the board of the Chinese solar manufacturer Solarfun Power Holdings (now Hanwha QCells, HQCL). Previously, Philip co‐founded Alcosa Capital, a Frankfurt based special situationinvestment and advisory firm, in 2004 focusing on investments in the German SME sector, advising companies on M&A, debt and equity transactions as well as operational issues and serving as their board member. Prior to Alcosa Capital, Philip worked as an investment banker at Deutsche Bank and as an M&A lawyer with Freshfield Bruckhaus Deringer in Germany and China. Philip studied law and Chinese at the University of Heidelberg and Zhong Shan University in China, subsequently completing his Master’s degree at New York University and a Doctor of Law at the University of Düsseldorf. Philip speaks English, French, Chinese and German.
Kevin Chin
Kevin has extensive experience in “hands on” strategic and operational management having served as CEO, CFO and COO of various companies across a range of industries, including solar energy, software, traffic management, education, funds management and vocational education.
He also has significant international experience in private equity, buyouts of public companies, mergers and acquisitions and capital raisings as well as funds management,accounting, litigation support and valuations.
Kevin is the founder of Arowana & Co. (Arowana), a diversified investment group with operations across Australia, New Zealand and Southeast Asia. Arowana has listed companies on the Australian Stock Exchange and NASDAQ as well as unlisted companies. Arowana International Limited, listed on the Australian Stock Exchange is the largest shareholder in VivoPower. Kevin is primarily responsible for delivering annualised returns in excess of 30% to investors acrossArowana’s investments sinceitsformationin 2007.
Over his twenty‐year career, Kevin has held a number of strategic and operationalleadership roles and was also previously with Lowy Family Group,J.P. Morgan, Ord Minnett, PwC and Deloitte.
Kevin holds a Bachelor of Commerce degree from the University of New South Wales where he was one of the inaugural University Co‐Op Scholars with the School of Banking and Finance. He is also a qualified Chartered Accountant and a Fellow of FINSIA, wherehe was a lecturerin theMasters of Applied Finance programme.
Directors’ Report (continued)
Page | 17
Peter Sermol Peter has over thirty years of experience in institutional finance. Peter is the co‐founder of North Star Solar Ltd, a company focused on installing UK rooftop solar PV and battery storage which developed a model to install renewable technologies with energy savings repaying capex. Prior to this, with his proven track record in trading distressed debt, Peter ran the Toronto office of Amstel Securities, a Dutch regulated brokerage firm for eight years. During this period Peter expanded the office to focus on uncovering and seeding uncorrelated investment opportunities. Taking a sector agnostic view, investments ranged from Latin American NPL’s, financing Canadian property developers, Australian non‐conforming loans, US viatical life insurance policies, US non‐prime auto loans. During this period he also served as CEO of an online media distribution company. Previously, Peter worked with specialist brokerage and advisory firms including Anca Capital Partners and Amstel as well as co‐founding his own brokerage firm, Global Markets Ltd trading Asian Convertible Bonds and GDRs. Peter studied marine electronics at the Merchant Naval College, Greenhithe.
Edward Hyams
Edward has over forty years of experience in Power Engineering, Renewables and inEnergy Efficiency as an Executive, Private Equity Partner and as a Non‐Executive Director. As a Partner at Englefield Capital, he co‐led the Renewable Energy Fund, investing in Solar, Wind and Biomass developments in Europe. He joined Englefield having led the management team which Englefield and another PE firm backed to invest in Zephyr, the first structured financing of a portfolio of renewables assets in the UK. Prior to Englefield, Edward held senior executive roles as CEO of BizzEnergy, Managing Director of Eastern Group PLC and Director of Engineering at Southern Electric Plc. Edward was a non‐executive Director of the UK Energy Saving Trust following the electricity and gas privatisationsinthe early 1990’s. He re‐joined the Trust as Non‐Executive Chairman in2005. Edward is a Chartered Engineer, graduating with a degree in Electrical Engineering from Imperial College, London and holds a Diploma in Accounting and Finance from the Association of Certified Chartered Accountants. He has completed executive programs in finance at Harvard Business School and in strategy and organisationat Stanford.
Gary Hui
Gary has over twenty years of investment experience in the Asia Pacific region.
He currently serves as the Chief Investment Officer for ArowanaInternationalLimited andthe ArowanaAustralasianValue Opportunities Fund Limited, a listed investment company that has significantly outperformed its benchmarks since inception.
Prior to this, he was with Indus Capital, a hedge fund founded by former Soros Fund Management Partners, where he was Managing Director and Chief Representative of Indus’ Singapore office. Prior to becoming a principal investor, Gary was an investment banker at J.P. Morgan in Australia and Hong Kong, where he advised clients across a broad range of industries.
Gary qualified as a Chartered Accountant and completed the Securities Institute of Australia (now FINSIA) program where he placed first nationally in Mergers & Acquisitions. He holds a Bachelor of Commerce degree from the University of New South Wales.
Directors’ Report (continued)
Page | 18
The Company is governed by its Articles of Association (the “Articles”) the Companies Act 2006 and related legislation with regard to the appointment and replacement of directors. The Articles themselves may be amended by special resolution of the shareholders. In accordance with the Articles of Association of the Company, directors are required to retire by rotation at the next Annual General Meeting and, if eligible, may offer themselves for re‐election. The Company maintains insurance cover for all directors and officers of group companies against liabilities which may be incurred by them while acting as directors or officers of group companies. Details of directors’ total remuneration are contained in the Directors’ Remuneration Report on page 23.
Disclosure of Information to Auditors
The directors who held office at the date of approval of this Directors’ Report confirm that, so far as they are each aware, there is no relevant audit information of which the Company’s auditors are unaware; and each director has taken all the steps that he ought to have taken as a director to make himself aware of any relevant audit information and to establish that the Company’s auditors are aware of that information. This confirmation is given and should be interpreted in accordance with the provisions of s418 of the Companies Act 2006.
Auditors
PKF‐Littlejohn LLP were appointed auditors during the course of the period. In accordance with s489 of the Companies Act 2006, a resolution to re‐appoint them as auditors for the ensuing year will be put to the members at the forthcoming Annual General Meeting. By order of the Board.
Dr. Philip Comberg Director 28 July 2017
Statement of Directors’ Responsibilities
Page | 19
The directors are responsible for preparing the Annual Report and the group with parent company financial statements in accordance with applicable law and regulations. Company law requires the directors to prepare group and parent company financial statements for the financial period. Under that law they have elected to prepare the group financial statements in accordance with International Financial Reporting Standards and applicable law and have elected to prepare the financial statements for Company under the same methodology. Under company law the directors must not approve the financial statements unless they are satisfied that they give a true and fair view of the state of affairs of the group and parent company and of their profit or loss for that period. In preparing each of the group and parent company financial statements, the directors are required to:
Select suitable accounting policies and then apply them consistently;
Make judgements and estimates that are reasonable and prudent;
For the group financial statements, state whether they have been prepared in accordance with IFRS; and
For the parent company financial statements, state whether applicable UK Accounting Standards have been followed, subject to any material departures disclosed and explained in the financial statements.
The directors are responsible for keeping adequate accounting records that are sufficient to show and explain the parent company’s transactions and disclose with reasonable accuracy at any time the financial position of the parent company and enable them to ensure that its financial statements comply with the Companies Act 2006. They have general responsibility for taking such steps as are reasonably open to them to safeguard the assets of the group and to prevent and detect fraud and other irregularities. This annual report and financial statements together with the Notice of Annual General Meeting and other information regarding the group may be viewed on the Company’s website at www.vivopower.com.
Corporate Governance Statement
Page | 20
VivoPower is committed to maintaining a high standard of corporate governance.
Board of Directors
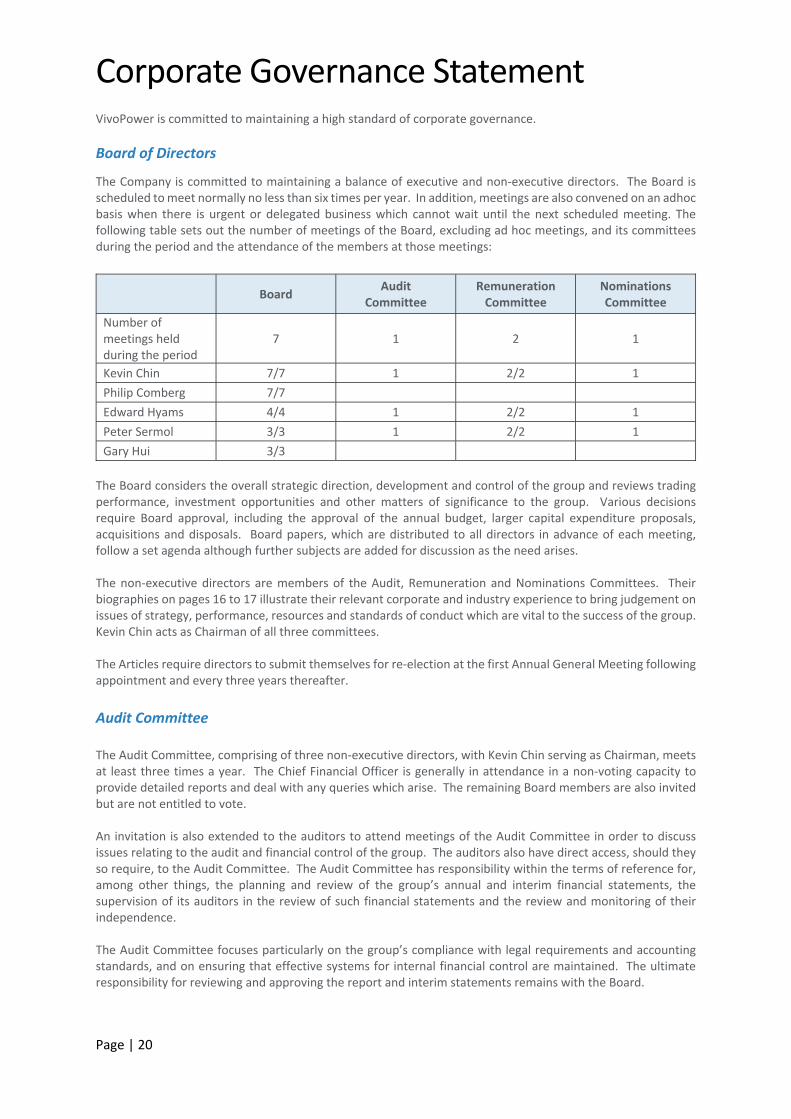
The Company is committed to maintaining a balance of executive and non‐executive directors. The Board is scheduled to meet normally no less than six times per year. In addition, meetings are also convened on an adhoc basis when there is urgent or delegated business which cannot wait until the next scheduled meeting. The following table sets out the number of meetings of the Board, excluding ad hoc meetings, and its committees during the period and the attendance of the members at those meetings:
Board Audit
Committee Remuneration Committee
Nominations Committee
Number of meetings held during the period
7 1 2 1
Kevin Chin 7/7 1 2/2 1
Philip Comberg 7/7
Edward Hyams 4/4 1 2/2 1
Peter Sermol 3/3 1 2/2 1
Gary Hui 3/3
The Board considers the overall strategic direction, development and control of the group and reviews trading performance, investment opportunities and other matters of significance to the group. Various decisions require Board approval, including the approval of the annual budget, larger capital expenditure proposals, acquisitions and disposals. Board papers, which are distributed to all directors in advance of each meeting, follow a set agenda although further subjects are added for discussion as the need arises. The non‐executive directors are members of the Audit, Remuneration and Nominations Committees. Their biographies on pages 16 to 17 illustrate their relevant corporate and industry experience to bring judgement on issues of strategy, performance, resources and standards of conduct which are vital to the success of the group. Kevin Chin acts as Chairman of all three committees. The Articles require directors to submit themselves for re‐election at the first Annual General Meeting following appointment and every three years thereafter.
Audit Committee The Audit Committee, comprising of three non‐executive directors, with Kevin Chin serving as Chairman, meets at least three times a year. The Chief Financial Officer is generally in attendance in a non‐voting capacity to provide detailed reports and deal with any queries which arise. The remaining Board members are also invited but are not entitled to vote. An invitation is also extended to the auditors to attend meetings of the Audit Committee in order to discuss issues relating to the audit and financial control of the group. The auditors also have direct access, should they so require, to the Audit Committee. The Audit Committee has responsibility within the terms of reference for, among other things, the planning and review of the group’s annual and interim financial statements, the supervision of its auditors in the review of such financial statements and the review and monitoring of their independence. The Audit Committee focuses particularly on the group’s compliance with legal requirements and accounting standards, and on ensuring that effective systems for internal financial control are maintained. The ultimate responsibility for reviewing and approving the report and interim statements remains with the Board.
Corporate Governance Statement (continued)
Page | 21
Remuneration Committee
The Remuneration Committee comprises three non‐executive directors, with Kevin Chin serving as Chairman. Board members are invited to join but only Remuneration Committee members may vote. The Remuneration Committee meets at least twice a year and has the responsibility for determining, within the agreed terms of reference, the group’s policy on the remuneration of senior executives.
Nominations Committee
The Nominations Committee consists of three non‐executive board members with Kevin Chin serving as Chairman. The Nominations Committee identifies, evaluates and selects candidates for Board positions, ensures appropriate succession planning and reviews annually the composition and the size of the Board. In considering the appointment of a new director, the Nominations Committee considers and defines the characteristics, qualities, skills and experience that it considers would complement the overall balance and composition of the Board.
Internal Control
The Board oversees management’s activities in relation to the systems of internal control. Management has responsibility for maintaining the group’s system of internal control and for reviewing its effectiveness. The system of internal control is designed to manage rather than eliminate the risk of failure to achieve the group’s strategic business objectives and can only provide reasonable assurance against material misstatement or loss. The key elements of the system of internal control are: Control environment There is sufficient segregation of duties and authorisation controls on approval of customer and supplier contracts, recruitment of staff, approval of purchases and payment of suppliers. Financial reporting The Senior management has regular meetings to discuss all aspects of the business and review financial performance against budget and provides a monthly summary report to the Chairman of the Board. The group has a sustainable system of financial reporting and forecasting covering profits, assets, liabilities, cash flow and capital expenditure. The systems include regular monitoring of cash, monthly reporting of financial results. Budgets and business plans are prepared annually and reviewed by the Board. Capital investment For any significant investment, a detailed proposal is first approved by the Company’s Investment Committee then by the board of directors of VivoPower International Services Limited (“Services Board”). Any major investment is always approved by the Board or the Services Board.
Going Concern
The directors have reviewed the latest budget and cash flow projections. The directors are satisfied that the group has adequate resources to continue in operation for the foreseeable future. The financial statements have therefore been prepared on a going concern basis. This is supported based upon current cash balances, historical profits and positive cash flows.
Corporate Governance Statement (continued)
Page | 22
Communications with Shareholders
The Company encourages two‐way communications with shareholders. The Board endeavours to maintain good relationships with its institutional shareholders by holding regular meetings after results are published with further dialogue as requested. The Company’s Annual General Meeting will be held on 5 September 2017 at the Company’s registered office. The notice of the meeting is sent to shareholders at least 21 days before the Annual General Meeting. The directors are available for questions both formally during the meeting and informally afterwards. This annual report and financial statements together with the Notice of Annual General Meeting and other information regarding the group may be viewed on the Company’s website at www.vivopower.com. Approved by the Board and signed on behalf of the Board on 28 July 2017.
Dr. Philip Comberg Director 28 July 2017
Directors’ Remuneration Report
Page | 23
This report has been prepared in accordance with the provisions of the United Kingdom Companies Act 2006 and Schedule 8 of The Large and Medium‐sized Companies and Groups (Accounts and Reports) Regulations 2008 (as amended in 2013).
Annual Statement by the Chairman of the Remuneration Committee
Dear Shareholders,
On behalf of the Remuneration Committee (the "Committee"), I am pleased to present the Remuneration
Report for the 14 months ended 31 March 2017.
This is the Company's first Remuneration Report since its listing on the NASDAQ stock exchange on 29 December 2016.
This report sets out the Directors' Remuneration Policy for Executive and Non‐Executive Directors (on pages 24 to 34) for which, in accordance with United Kingdom law requirements (which apply by virtue of the Company being incorporated in the United Kingdom), the Company is required to seek approval from shareholders at its meeting of Shareholders, to be held on 5 September 2017.
In accordance with United Kingdom law, the Company is required to seek approval for its Remuneration Policy at least every three years. This means that the Remuneration Policy set out below needs to cover all the possible scenarios which the Company may face in the future. In particular, therefore, the Remuneration Policy needs to explain what the Company's approach to compensation would be in the event that new directors, including a new CEO, were to be appointed, even though this may not occur during the life of the Remuneration Policy. In particular, therefore, the Remuneration Policy may address elements of compensation which are not currently paid by the Company to our current Executive Director.
After the Remuneration Policy section, pages 35 to 41 set out the Company's Annual Report on Remuneration, disclosing the compensation paid to directors in respect of the 14 months ended 31 March 2017. Again, the format of this Annual Report on Remuneration is specified in accordance with United Kingdom law. This Annual Report on Remuneration will be subject to a separate advisory vote at the Company's annual meeting of shareholders.
Kevin Chin Chair of the Remuneration Committee
28 July 2017
Directors’ Remuneration Report (continued)
Page | 24
This Remuneration Policy will apply with effect from the date on which shareholders approve the policy at the Company’s Annual General Meeting.
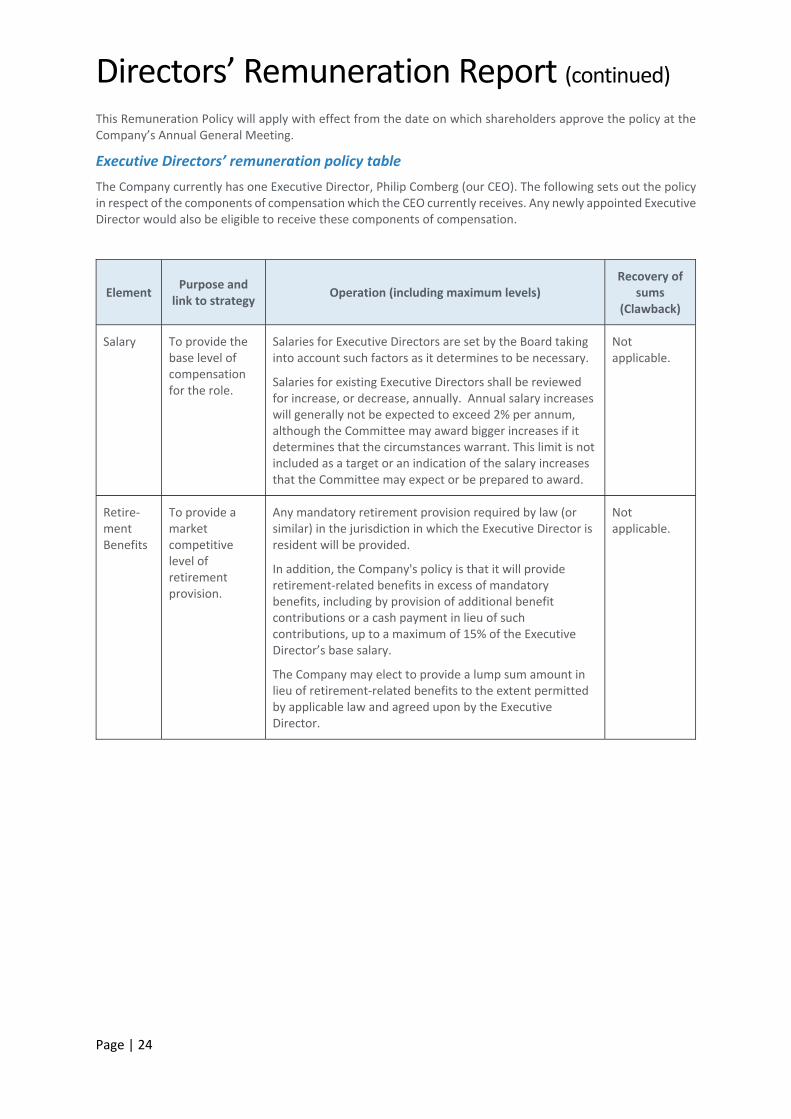
Executive Directors’ remuneration policy table
The Company currently has one Executive Director, Philip Comberg (our CEO). The following sets out the policy in respect of the components of compensation which the CEO currently receives. Any newly appointed Executive Director would also be eligible to receive these components of compensation.
Element Purpose and
link to strategy Operation (including maximum levels)
Recovery of sums
(Clawback)
Salary To provide the base level of compensation for the role.
Salaries for Executive Directors are set by the Board taking into account such factors as it determines to be necessary.
Salaries for existing Executive Directors shall be reviewed for increase, or decrease, annually. Annual salary increases will generally not be expected to exceed 2% per annum, although the Committee may award bigger increases if it determines that the circumstances warrant. This limit is not included as a target or an indication of the salary increases that the Committee may expect or be prepared to award.
Not applicable.
Retire‐ment Benefits
To provide a market competitive level of retirement provision.
Any mandatory retirement provision required by law (or similar) in the jurisdiction in which the Executive Director is resident will be provided.
In addition, the Company's policy is that it will provide retirement‐related benefits in excess of mandatory benefits, including by provision of additional benefit contributions or a cash payment in lieu of such contributions, up to a maximum of 15% of the Executive Director’s base salary.
The Company may elect to provide a lump sum amount in lieu of retirement‐related benefits to the extent permitted by applicable law and agreed upon by the Executive Director.
Not applicable.
Directors’ Remuneration Report (continued)
Page | 25
To provide a market competitive level of benefits.
Benefits to be provided to Executive Directors will be determined by the Remuneration Committee taking into account such factors as it determines to be necessary, with the aim of creating a competitive overall package. The provision of benefits would not be expected to be performance related.
Benefits include, but are not limited to, participation in a life assurance scheme and participation in a medical insurance scheme.
Benefits may also be provided to reflect the jurisdiction in which an Executive Director is recruited or to which an Executive Director is relocated for business reasons, including relocation costs, tax equalisation arrangements and arrangements to take into account exchange rates.
Benefits may also include participation in any broad‐based equity plan operated by the Company from time to time, up to the relevant limit for participation as applies to such arrangement.
Benefits also include a directors’ and officers’ indemnification insurance policy.
The Company may elect to pay contributions to existing Executive Director private medical insurance arrangements.
Not applicable.
Annual bonus
To provide an incentive for superior work and to motivate executives toward even higher achievement and business results, to tie their goals and interests to those of the Company and its stockholders and to enable the Company to attract and retain highly qualified executives.
Annual bonuses will be determined by reference to performance, in the normal course measured over one financial period. The performance measures, weightings and targets for the annual bonus will be set by the Remuneration Committee on an annual basis.
Performance measures will normally include tests of both business and individual performance and may include measures or a combination of measures relating to: pipeline, profit measures (including but not limited to pre‐tax profit budget, ROIC and margin), strategy concern and people targets.
The Remuneration Committee shall have discretion to determine the terms and level at which annual bonuses may be granted, including the minimum performance required for an annual bonus to be payable. The maximum annual bonus that may be awarded shall be determined by the Remuneration Committee in its absolute discretion. The maximum annual bonus that may be granted to executive directors other than the CEO is not currently expected to exceed 100% of salary. The CEO has a contractual entitlement to participate in an annual bonus arrangement paying up to 150% of base salary.
In respect of an Executive Directors' participation in annual bonus arrangements in any year, the Remuneration Committee will have power to amend performance measures and targets after they have been set if events happen that mean they are no longer a fair test of performance.
Not applicable.
Directors’ Remuneration Report (continued)
Page | 26
Equity incentive plans
To encourage and enable executives to obtain an equity stake in the Company, which will assure a closer identification of their interests with those of the Company and its stockholders, thereby stimulating their efforts on the Company’s behalf and strengthening their desire to remain with the Company.
To incentivise key individuals to achieve key long term objectives.
To retain key individuals.
Executive Directors are eligible to participate in the Company’s Omnibus Equity Incentive Plan (the “Plan”).
Under the Plan, the Company has the authority to issue stock options, stock units, stock appreciation rights or other equity incentives to Executive Directors. Awards are considered by the Remuneration Committee. Such awards may require the participant to pay a price for shares acquired or enable the participant to receive the shares for nil cost.
The Remuneration Committee may determine that awards should be subject to performance measures, including any of the following or a combination thereof: (i) net earnings or net income; (ii) basic or diluted earnings per share; (iii) net revenue or revenue growth; (iv) gross profit or gross profit growth; (v) operating profit; (vi) return measures; (vii) cash flow; (viii) earnings before or after taxes, interest, depreciation and/or amortization; (ix) gross or operating margins; (x) productivity ratios; (xi) share price; (xii) expense targets; (xiii) margins; (xiv) operating efficiency; (xv) objective measures of customer satisfaction; (xvi) working capital targets; (xvii) measures of economic value added; (xviii) inventory control; (xix) enterprise value; (xx) sales; (xxi) debt levels and net debt; (xxii) timely launch of new facilities; (xxiii) client retention; (xxiv) employee retention; (xxv) timely completion of new product rollouts; and (xxvi) objective measures of personal targets, goals, reviews or completion of projects. The Remuneration Committee considers that this choice of performance measures provides it with the flexibility to set performance targets that are relevant to the individual and take into account the position of the Company at the time of grant.
Any one or more of these performance measures may be used on an absolute or relative basis, as the Remuneration Committee may deem appropriate, and may be compared to the performance of a selected group of comparison companies, or an index that the Remuneration Committee deems appropriate. The Remuneration Committee may determine the minimum performance required for an award to vest.
The Remuneration Committee shall have discretion to determine the length of the performance period that shall apply to any performance conditions.
The Remuneration Committee shall have discretion to determine the maximum value of an award that may be made under the Plan. It is currently expected that the maximum value that may be awarded under the Plan will be 100% of salary.
In the event that the Company adopts new equity incentive plans, Executive Directors would be eligible to participate in such plans, subject to the terms of, and the maximum levels of participation provided in, the rules of such plans.
The Committee may clawback awards granted under the Plan if such payments are made: (i) on account of fraud or misconduct by the Participant; (ii) following an accounting restatement; or (iii) as may be required by any other general clawback policy of the Company which may now exist or hereafter be adopted regarding repayment of incentive‐based compensation.
Directors’ Remuneration Report (continued)
Page | 27
In respect of any performance‐related equity awards grant to Executive Directors, performance measures, weightings and targets will be set by the Remuneration Committee. Following grant of an award, the Remuneration Committee will have power to amend performance measures and targets if events happen that mean they are no longer a fair test of performance.
Notes to the Executive Directors' Remuneration Policy Table
In considering the appropriate measures to apply to performance‐based awards, the Remuneration Committee will seek to incentivise and reinforce delivery of the Company's strategic objectives of achieving a balance between delivering annual returns to shareholders and ensuring long term profitability and growth.
The performance targets set will be stretching and achievable, taking into account the Company's strategic priorities and the economic environment in which the Company operates.
Other matters
In addition to the above, the Company is entitled to honour any contractual entitlement to compensation or benefits, and any cash or equity incentive awards, which is held by: (i) any current or former Executive Director on the effective date of this policy; or (ii) an employee or officer of the Group on the date they are promoted to the role of Executive Director. Appropriate disclosure will be made of any compensation paid (or similar) to an Executive Director pursuant to any such arrangements.
The Company may reimburse all reasonable expenses incurred by an Executive Director in connection with their role. This will include expenses in attending Board or Board‐committee meetings, or the Company may alternatively provide a travel allowance for such purpose. This may also include items which, for tax purposes, are treated as a taxable benefit, and in which case the Company may also pay any such tax on behalf of the Executive Director.
External non‐executive appointments
Executive Directors are able to accept up to three non‐executive appointments outside of the Group (as long as this does not lead to a conflict of interest or competitive issue), as such appointments can enhance their experience and add value to the Company. Any fees received are retained by the Executive Director.
Service contracts
Service Agreement contract of the CEO
On 4 August 2016, VivoPower International Services Ltd and Philip Comberg entered into a Service Agreement under which Philip Comberg (the “CEO”) is employed as Chief Executive Officer of the Company. Philip was appointed as a statutory director of the Company and VivoPower International Services Ltd on 1 May 2016. The employment under such Service Agreement commenced on 1 September 2016 and is to continue, subject to the terms of the Service Agreement, until determined by either party giving to the other not less than 12 months’ written notice.
The Service Agreement provides that the CEO is entitled to a salary at the rate of £540,000 per annum; the Service Agreement provides that the CEO’s salary shall be reviewed by the Remuneration Committee at least once each twelve months save after notice of termination of the Service Agreement has been served, and the Company shall not be obligated to make any increase in salary but shall not make any decrease in salary. In addition to his salary, the CEO is provided with:
a) the entitlement to participate in such discretionary bonus scheme and other incentive arrangements,
as may be operated by the Company, on such terms and at such level as the Remuneration Committee
may from time to time determine, subject to the CEO's right always to participate in an annual bonus
arrangement paying up to 150% of base salary for attainment of pre‐agreed key performance
indicators;
Directors’ Remuneration Report (continued)
Page | 28
b) participation opportunity in a separate carried interest arrangement. At present the Remuneration
Committee has not implemented a carried interest arrangement; if such an arrangement is
implemented, this will be disclosed in the relevant Annual Report on Remuneration;
c) an annual payment of 10% of base salary in lieu of pension contributions;
d) participation in the Company's (i) life assurance scheme (with coverage at four times the CEO’s salary);
(ii) personal accident insurance (iii) permanent health insurance and (iv) private medical (or payment
to the CEO's existing scheme to a maximum of £1,800 per month); and
e) directors and officers’ liability insurance including coverage of legal expenses, for a period extending
through six years after the termination date under the Service Agreement.
The Service Agreement additionally provides for reimbursement of expenses (including reasonable expenses in respect of personal mobile phone and computer use by the CEO in respect of his role). The Service Agreement also provides for 30 days of holiday (plus English public holidays) each fiscal year of the Company. The CEO shall also be entitled to receive his full salary and contractual benefits during any period of sickness of up to 90 days (increasing to 120 days in the Company's discretion) in any rolling period of 12 months.
The Company may terminate the CEO's employment summarily for gross misconduct or similar grounds or by serving twelve months' written notice on the CEO. The CEO may terminate his employment by serving 12 months' written notice on the Company.
In circumstances where the employment is terminated on notice, the Company may elect to put in place any of the following arrangements:
a) The CEO may be required to actively work throughout the entirety of his notice period;
b) The CEO may be required to spend some or all of his notice period on garden leave (during which time
the CEO would remain entitled to receive his full salary and contractual benefits as referred to above
at (c) and (d) in the service agreement section); or
c) The Company may elect to make a payment in lieu of notice in respect of the whole or any unexpired
proportion of the CEO's notice period. In these circumstances, the payment in lieu of notice would be
calculated based on the CEO's annual base salary plus the cost to the Company of the contractual
benefits described above at (c) and (d) in the service agreement section. Any such payment due shall
be in two equal instalments, the first within seven days after the termination of the CEO's employment
and the second no later than the date which is six months thereafter. The second instalment shall be
reduced by an amount equal to any payment or benefits received by the CEO from any new alternative
employment or engagement after the termination date in respect of such six‐month period.
If the CEO is terminated (otherwise than for cause) the CEO shall also be entitled to reimbursement for his costs of relocation back to Germany on a grossed up for tax basis and shall remain eligible to receive a pro‐rata proportion of any bonus calculated up to the termination date.
The Service Agreement contains certain non‐competition and other restrictive covenant provisions that may apply for six months less any time spent on garden leave after the end of the CEO’s services with the Company. The non‐competition restrictive covenant shall only apply if the CEO receives a remuneration payment (including base salary, the cost to the Company of the contractual benefits referred to at (c) and (d) above, in the service agreement section, bonus in respect of the relevant period of restriction (provided always that the CEO shall be deemed to have received a remuneration payment if the period of restriction encompasses a period in respect of which he has received a payment in lieu of notice).
The CEO's Service Agreement is available for inspection at the Company’s registered office during normal hours of business, and will also be available at the Company’s Annual General Meeting until the close of the meeting.
Internal promotions
In the event that an employee, or officer, of the Group is promoted to the role of Executive Director, the Company will be permitted to honour the terms of the employee's existing employment agreement.
Directors’ Remuneration Report (continued)
Page | 29
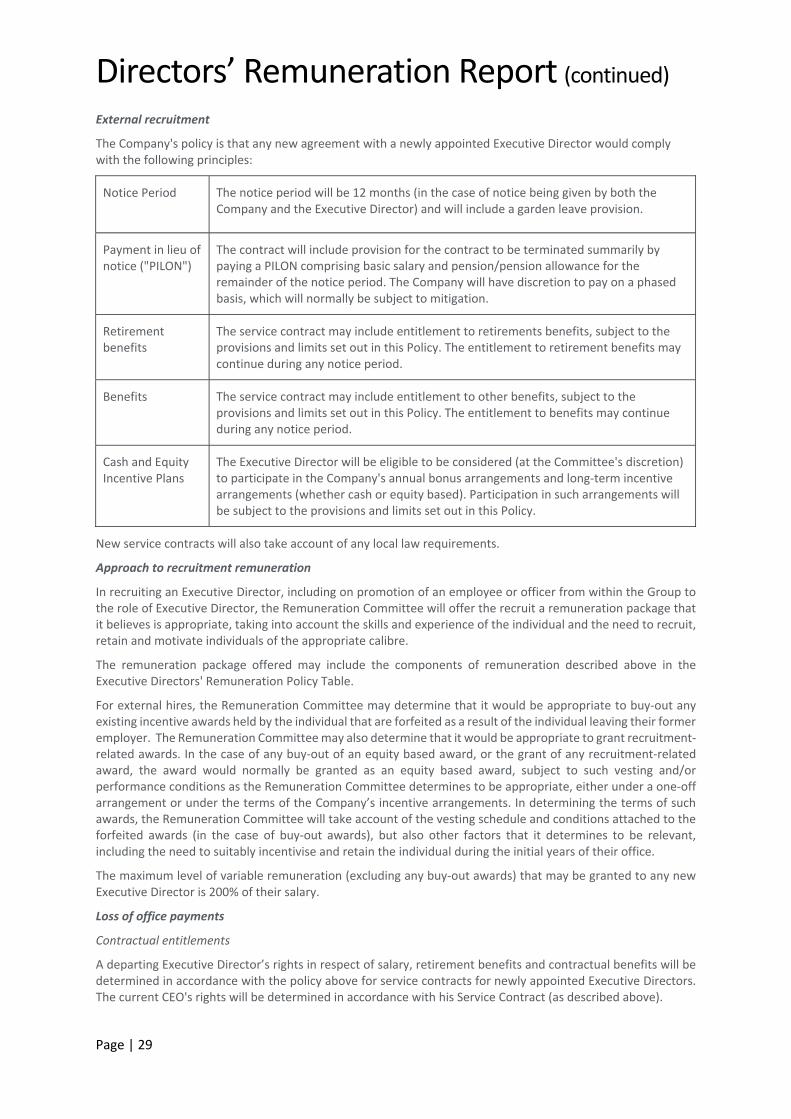
External recruitment
The Company's policy is that any new agreement with a newly appointed Executive Director would comply with the following principles:
Notice Period
The notice period will be 12 months (in the case of notice being given by both the Company and the Executive Director) and will include a garden leave provision.
Payment in lieu of notice ("PILON")
The contract will include provision for the contract to be terminated summarily by paying a PILON comprising basic salary and pension/pension allowance for the remainder of the notice period. The Company will have discretion to pay on a phased basis, which will normally be subject to mitigation.
Retirement benefits
The service contract may include entitlement to retirements benefits, subject to the provisions and limits set out in this Policy. The entitlement to retirement benefits may continue during any notice period.
Benefits The service contract may include entitlement to other benefits, subject to the provisions and limits set out in this Policy. The entitlement to benefits may continue during any notice period.
Cash and Equity Incentive Plans
The Executive Director will be eligible to be considered (at the Committee's discretion) to participate in the Company's annual bonus arrangements and long‐term incentive arrangements (whether cash or equity based). Participation in such arrangements will be subject to the provisions and limits set out in this Policy.
New service contracts will also take account of any local law requirements.
Approach to recruitment remuneration
In recruiting an Executive Director, including on promotion of an employee or officer from within the Group to the role of Executive Director, the Remuneration Committee will offer the recruit a remuneration package that it believes is appropriate, taking into account the skills and experience of the individual and the need to recruit, retain and motivate individuals of the appropriate calibre.
The remuneration package offered may include the components of remuneration described above in the Executive Directors' Remuneration Policy Table.
For external hires, the Remuneration Committee may determine that it would be appropriate to buy‐out any existing incentive awards held by the individual that are forfeited as a result of the individual leaving their former employer. The Remuneration Committee may also determine that it would be appropriate to grant recruitment‐related awards. In the case of any buy‐out of an equity based award, or the grant of any recruitment‐related award, the award would normally be granted as an equity based award, subject to such vesting and/or performance conditions as the Remuneration Committee determines to be appropriate, either under a one‐off arrangement or under the terms of the Company’s incentive arrangements. In determining the terms of such awards, the Remuneration Committee will take account of the vesting schedule and conditions attached to the forfeited awards (in the case of buy‐out awards), but also other factors that it determines to be relevant, including the need to suitably incentivise and retain the individual during the initial years of their office.
The maximum level of variable remuneration (excluding any buy‐out awards) that may be granted to any new Executive Director is 200% of their salary.
Loss of office payments
Contractual entitlements
A departing Executive Director’s rights in respect of salary, retirement benefits and contractual benefits will be determined in accordance with the policy above for service contracts for newly appointed Executive Directors. The current CEO's rights will be determined in accordance with his Service Contract (as described above).
Directors’ Remuneration Report (continued)
Page | 30
Incentive plans
The terms of a departing Executive Director’s participation in any annual bonus or long term incentive plans will be governed by the terms of such arrangements. The terms regarding participation in the annual bonus plan are disclosed in the Service Agreement of the CEO summarised above.
Equity Incentive Plan
Unless otherwise provided by the Remuneration Committee in an award agreement for awards granted under the Equity Incentive Plan, the unvested portion of an award shall expire upon termination of employment or service of the participant granted the award, and the vested portion of such award shall (if relevant) remain exercisable for:
one year following termination of employment or service by reason of such participant’s death or disability
(as determined by the Remuneration Committee), but not later than the expiration of the standard exercise
period; or
90 days following termination of employment or service for any reason other than such participant’s death
or disability, and other than such participant’s termination of employment or service for cause, but not
later than the expiration of the standard exercise period.
Both the unvested and the vested portion of an award shall expire upon the termination of the participant’s employment or service by the Company for cause.
In respect of any awards made to an Executive Director under any broad‐based equity plans, the same leaver conditions will apply as apply in respect of employees generally.
Other
The Company may enter into new contractual arrangements with a departing Executive Director in connection with the cessation of office or employment, including (but not limited to) in respect of settlement of claims, confidentiality, restrictive covenants and/or consultancy arrangements, where the Committee determines it necessary or appropriate to do so. The Company may pay reasonable legal fees on behalf of an Executive Director in connection with their cessation of office and employment. The Company may agree to provide other ancillary or non‐material benefits, payments or similar to a departing Executive Director.
Corporate actions
The treatment of incentive awards in the event of a corporate action affecting the Company will be determined in accordance with the terms of such awards.
In the event of a corporate action, unless otherwise determined by the Remuneration Committee, any annual bonus granted to an Executive Director shall continue on the same terms. The Remuneration Committee maintains the discretion to adjust an annual bonus to account for the occurrence of a corporate action in any manner, including but not limited to amending performance measures and targets after they have been set if the occurrence of the corporate action means that they are no longer a fair test of performance.
Under the terms of the Equity Incentive Plan, upon a change of control the Remuneration Committee may make such adjustments to awards as it, in its discretion, determines are necessary or appropriate, provided that the Remuneration Committee determines that such adjustments do not have an adverse economic impact on the participant. The Remuneration Committee may, but shall not be limited to, determine that (i) all or a portion of any outstanding options and stock appreciation rights shall become fully exercisable, (ii) all or a portion of any other outstanding awards shall become vested and transferable, and all or a portion of any outstanding performance‐based awards will be earned, or (iii) all or a portion of any outstanding awards may be cancelled in exchange for a payment of cash, or (iv) all or a portion of any outstanding awards may be substituted for awards that will substantially preserve the otherwise applicable terms of any affected awards.
The Company may agree to pay reasonable legal fees on behalf of an Executive Director in respect of the effect of any corporate action on their personal position.
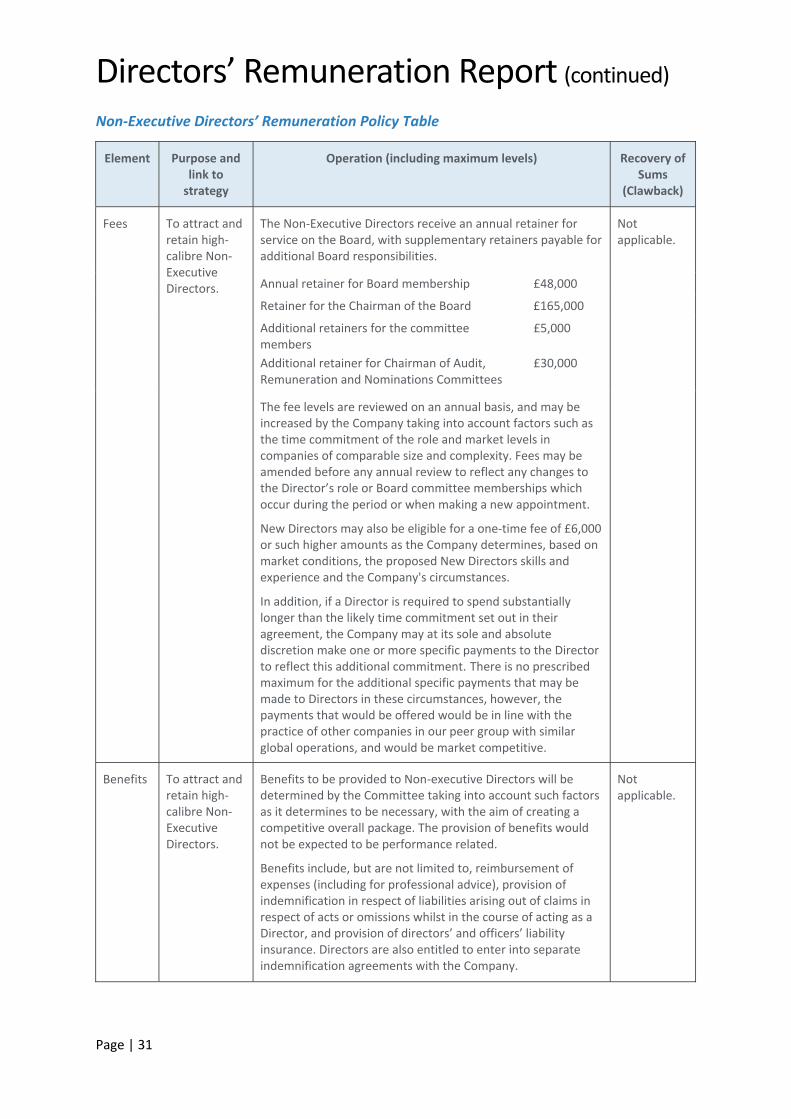
Directors’ Remuneration Report (continued)
Page | 31
Non‐Executive Directors’ Remuneration Policy Table
Element Purpose and link to strategy
Operation (including maximum levels) Recovery of Sums
(Clawback)
Fees To attract and retain high‐calibre Non‐Executive Directors.
The Non‐Executive Directors receive an annual retainer for service on the Board, with supplementary retainers payable for additional Board responsibilities.
Not applicable.
Annual retainer for Board membership £48,000
Retainer for the Chairman of the Board £165,000
Additional retainers for the committee members
Additional retainer for Chairman of Audit, Remuneration and Nominations Committees
£5,000
£30,000
The fee levels are reviewed on an annual basis, and may be increased by the Company taking into account factors such as the time commitment of the role and market levels in companies of comparable size and complexity. Fees may be amended before any annual review to reflect any changes to the Director’s role or Board committee memberships which occur during the period or when making a new appointment.
New Directors may also be eligible for a one‐time fee of £6,000 or such higher amounts as the Company determines, based on market conditions, the proposed New Directors skills and experience and the Company's circumstances.
In addition, if a Director is required to spend substantially longer than the likely time commitment set out in their agreement, the Company may at its sole and absolute discretion make one or more specific payments to the Director to reflect this additional commitment. There is no prescribed maximum for the additional specific payments that may be made to Directors in these circumstances, however, the payments that would be offered would be in line with the practice of other companies in our peer group with similar global operations, and would be market competitive.
Benefits To attract and retain high‐calibre Non‐Executive Directors.
Benefits to be provided to Non‐executive Directors will be determined by the Committee taking into account such factors as it determines to be necessary, with the aim of creating a competitive overall package. The provision of benefits would not be expected to be performance related.
Benefits include, but are not limited to, reimbursement of expenses (including for professional advice), provision of indemnification in respect of liabilities arising out of claims in respect of acts or omissions whilst in the course of acting as a Director, and provision of directors’ and officers’ liability insurance. Directors are also entitled to enter into separate indemnification agreements with the Company.
Not applicable.
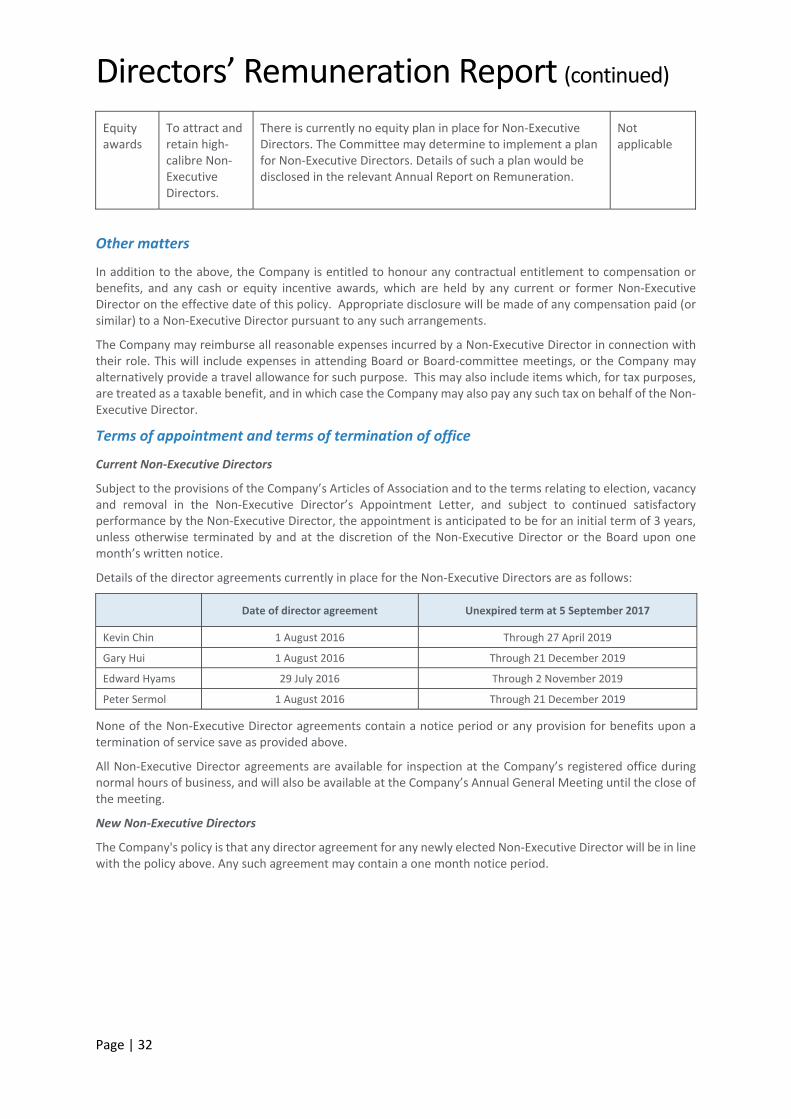
Directors’ Remuneration Report (continued)
Page | 32
Equity awards
To attract and retain high‐calibre Non‐Executive Directors.
There is currently no equity plan in place for Non‐Executive Directors. The Committee may determine to implement a plan for Non‐Executive Directors. Details of such a plan would be disclosed in the relevant Annual Report on Remuneration.
Not applicable
Other matters
In addition to the above, the Company is entitled to honour any contractual entitlement to compensation or benefits, and any cash or equity incentive awards, which are held by any current or former Non‐Executive Director on the effective date of this policy. Appropriate disclosure will be made of any compensation paid (or similar) to a Non‐Executive Director pursuant to any such arrangements.
The Company may reimburse all reasonable expenses incurred by a Non‐Executive Director in connection with their role. This will include expenses in attending Board or Board‐committee meetings, or the Company may alternatively provide a travel allowance for such purpose. This may also include items which, for tax purposes, are treated as a taxable benefit, and in which case the Company may also pay any such tax on behalf of the Non‐Executive Director.
Terms of appointment and terms of termination of office
Current Non‐Executive Directors
Subject to the provisions of the Company’s Articles of Association and to the terms relating to election, vacancy and removal in the Non‐Executive Director’s Appointment Letter, and subject to continued satisfactory performance by the Non‐Executive Director, the appointment is anticipated to be for an initial term of 3 years, unless otherwise terminated by and at the discretion of the Non‐Executive Director or the Board upon one month’s written notice.
Details of the director agreements currently in place for the Non‐Executive Directors are as follows:
Date of director agreement Unexpired term at 5 September 2017
Kevin Chin 1 August 2016 Through 27 April 2019
Gary Hui 1 August 2016 Through 21 December 2019
Edward Hyams 29 July 2016 Through 2 November 2019
Peter Sermol 1 August 2016 Through 21 December 2019
None of the Non‐Executive Director agreements contain a notice period or any provision for benefits upon a termination of service save as provided above.
All Non‐Executive Director agreements are available for inspection at the Company’s registered office during normal hours of business, and will also be available at the Company’s Annual General Meeting until the close of the meeting.
New Non‐Executive Directors
The Company's policy is that any director agreement for any newly elected Non‐Executive Director will be in line with the policy above. Any such agreement may contain a one month notice period.
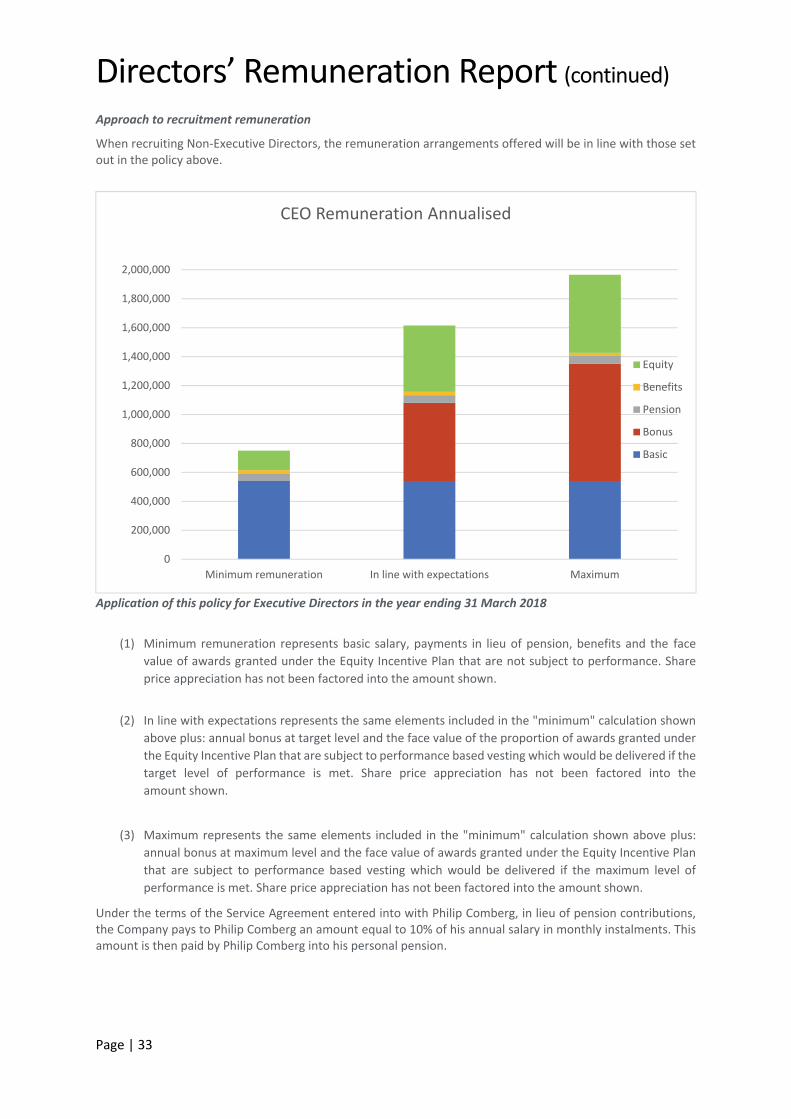
Directors’ Remuneration Report (continued)
Page | 33
Approach to recruitment remuneration
When recruiting Non‐Executive Directors, the remuneration arrangements offered will be in line with those set out in the policy above.
Application of this policy for Executive Directors in the year ending 31 March 2018
(1) Minimum remuneration represents basic salary, payments in lieu of pension, benefits and the face value of awards granted under the Equity Incentive Plan that are not subject to performance. Share
price appreciation has not been factored into the amount shown.
(2) In line with expectations represents the same elements included in the "minimum" calculation shown
above plus: annual bonus at target level and the face value of the proportion of awards granted under
the Equity Incentive Plan that are subject to performance based vesting which would be delivered if the
target level of performance is met. Share price appreciation has not been factored into the
amount shown.
(3) Maximum represents the same elements included in the "minimum" calculation shown above plus:
annual bonus at maximum level and the face value of awards granted under the Equity Incentive Plan
that are subject to performance based vesting which would be delivered if the maximum level of
performance is met. Share price appreciation has not been factored into the amount shown.
Under the terms of the Service Agreement entered into with Philip Comberg, in lieu of pension contributions, the Company pays to Philip Comberg an amount equal to 10% of his annual salary in monthly instalments. This amount is then paid by Philip Comberg into his personal pension.
0
200,000
400,000
600,000
800,000
1,000,000
1,200,000
1,400,000
1,600,000
1,800,000
2,000,000
Minimum remuneration In line with expectations Maximum
CEO Remuneration Annualised
Equity
Benefits
Pension
Bonus
Basic
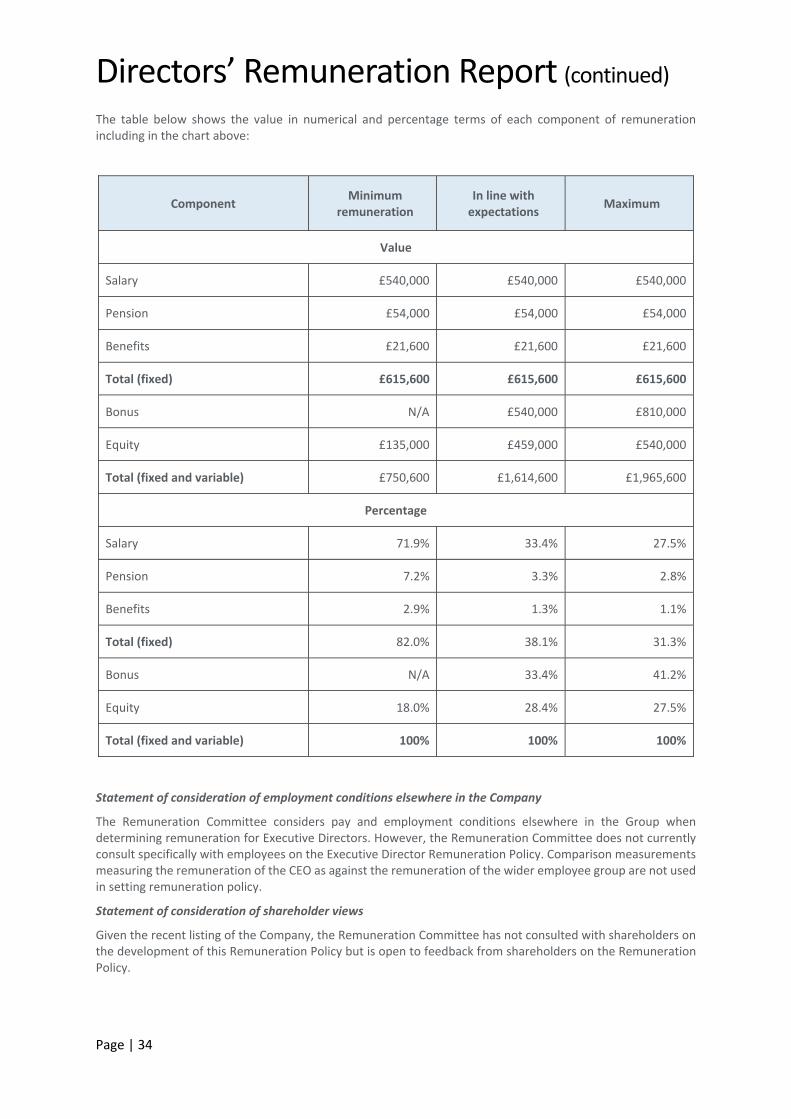
Directors’ Remuneration Report (continued)
Page | 34
The table below shows the value in numerical and percentage terms of each component of remuneration including in the chart above:
Component Minimum
remuneration In line with expectations
Maximum
Value
Salary £540,000 £540,000 £540,000
Pension £54,000 £54,000 £54,000
Benefits £21,600 £21,600 £21,600
Total (fixed) £615,600 £615,600 £615,600
Bonus N/A £540,000 £810,000
Equity £135,000 £459,000 £540,000
Total (fixed and variable) £750,600 £1,614,600 £1,965,600
Percentage
Salary 71.9% 33.4% 27.5%
Pension 7.2% 3.3% 2.8%
Benefits 2.9% 1.3% 1.1%
Total (fixed) 82.0% 38.1% 31.3%
Bonus N/A 33.4% 41.2%
Equity 18.0% 28.4% 27.5%
Total (fixed and variable) 100% 100% 100%
Statement of consideration of employment conditions elsewhere in the Company
The Remuneration Committee considers pay and employment conditions elsewhere in the Group when determining remuneration for Executive Directors. However, the Remuneration Committee does not currently consult specifically with employees on the Executive Director Remuneration Policy. Comparison measurements measuring the remuneration of the CEO as against the remuneration of the wider employee group are not used in setting remuneration policy.
Statement of consideration of shareholder views
Given the recent listing of the Company, the Remuneration Committee has not consulted with shareholders on the development of this Remuneration Policy but is open to feedback from shareholders on the Remuneration Policy.
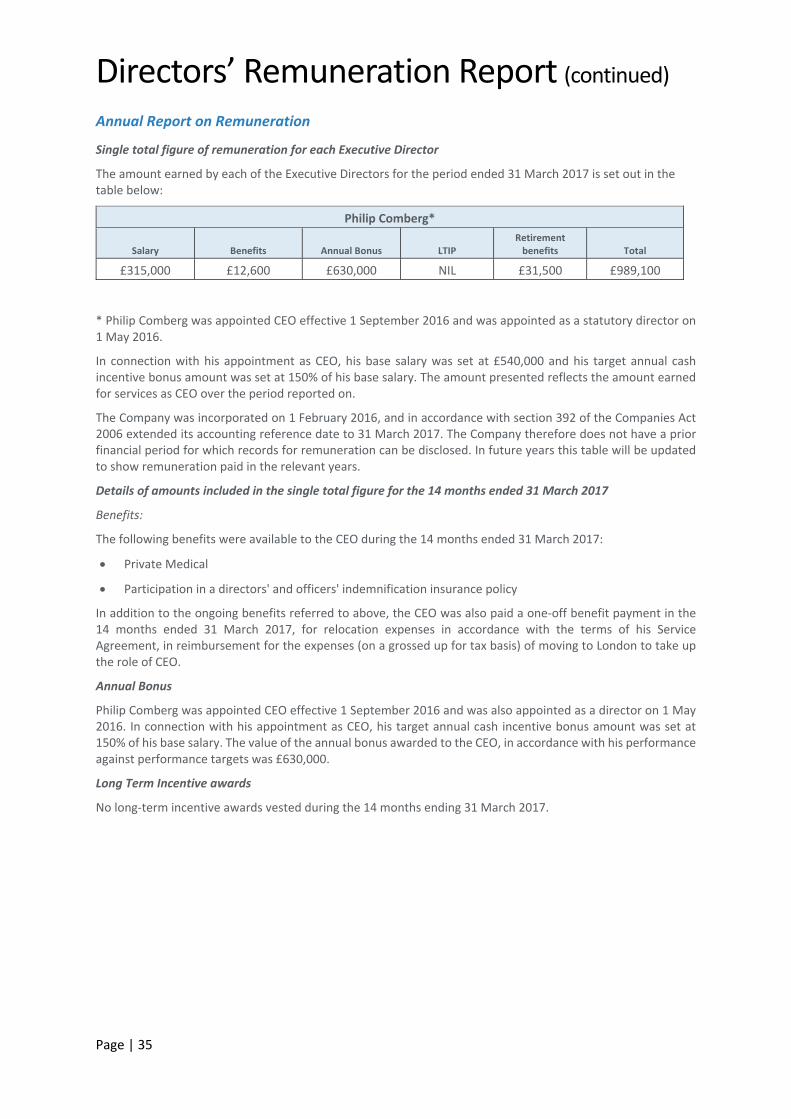
Directors’ Remuneration Report (continued)
Page | 35
Annual Report on Remuneration
Single total figure of remuneration for each Executive Director
The amount earned by each of the Executive Directors for the period ended 31 March 2017 is set out in the table below:
Philip Comberg*
Salary Benefits Annual Bonus LTIP Retirement benefits Total
£315,000 £12,600 £630,000 NIL £31,500 £989,100
* Philip Comberg was appointed CEO effective 1 September 2016 and was appointed as a statutory director on 1 May 2016.
In connection with his appointment as CEO, his base salary was set at £540,000 and his target annual cash incentive bonus amount was set at 150% of his base salary. The amount presented reflects the amount earned for services as CEO over the period reported on.
The Company was incorporated on 1 February 2016, and in accordance with section 392 of the Companies Act 2006 extended its accounting reference date to 31 March 2017. The Company therefore does not have a prior financial period for which records for remuneration can be disclosed. In future years this table will be updated to show remuneration paid in the relevant years.
Details of amounts included in the single total figure for the 14 months ended 31 March 2017
Benefits:
The following benefits were available to the CEO during the 14 months ended 31 March 2017:
Private Medical
Participation in a directors' and officers' indemnification insurance policy
In addition to the ongoing benefits referred to above, the CEO was also paid a one‐off benefit payment in the 14 months ended 31 March 2017, for relocation expenses in accordance with the terms of his Service Agreement, in reimbursement for the expenses (on a grossed up for tax basis) of moving to London to take up the role of CEO.
Annual Bonus
Philip Comberg was appointed CEO effective 1 September 2016 and was also appointed as a director on 1 May 2016. In connection with his appointment as CEO, his target annual cash incentive bonus amount was set at 150% of his base salary. The value of the annual bonus awarded to the CEO, in accordance with his performance against performance targets was £630,000.
Long Term Incentive awards
No long‐term incentive awards vested during the 14 months ending 31 March 2017.
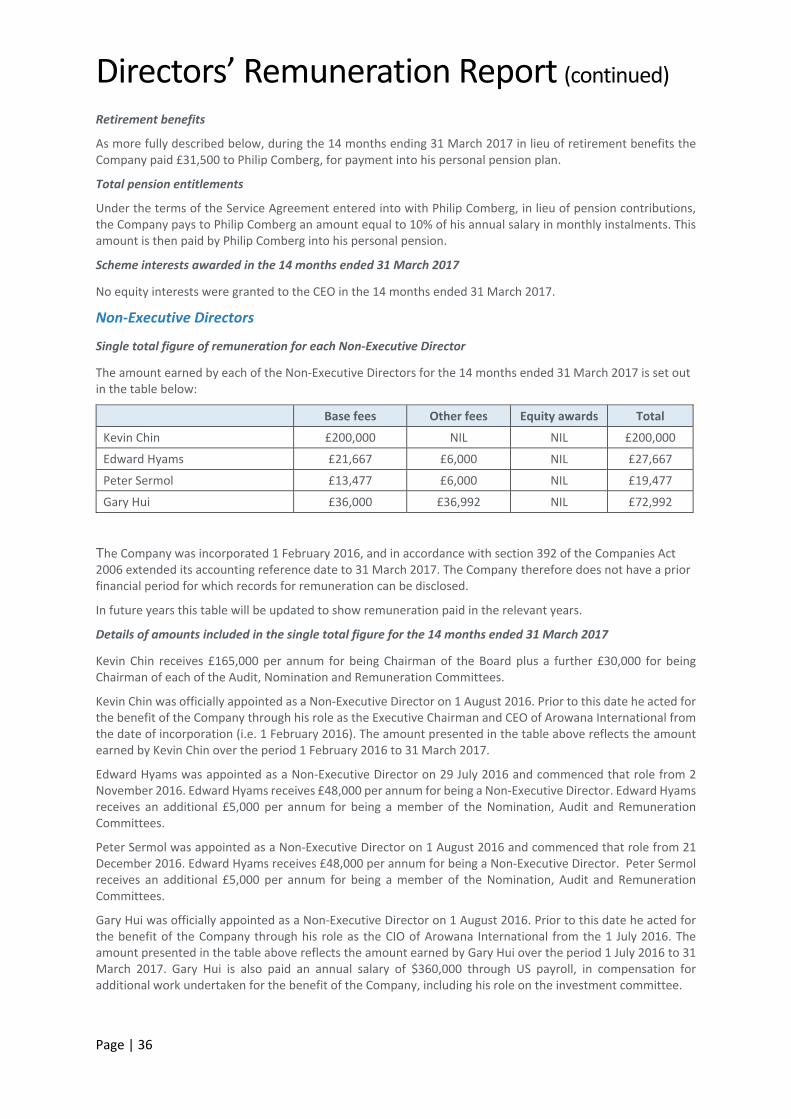
Directors’ Remuneration Report (continued)
Page | 36
Retirement benefits
As more fully described below, during the 14 months ending 31 March 2017 in lieu of retirement benefits the Company paid £31,500 to Philip Comberg, for payment into his personal pension plan.
Total pension entitlements
Under the terms of the Service Agreement entered into with Philip Comberg, in lieu of pension contributions, the Company pays to Philip Comberg an amount equal to 10% of his annual salary in monthly instalments. This amount is then paid by Philip Comberg into his personal pension.
Scheme interests awarded in the 14 months ended 31 March 2017
No equity interests were granted to the CEO in the 14 months ended 31 March 2017.
Non‐Executive Directors
Single total figure of remuneration for each Non‐Executive Director
The amount earned by each of the Non‐Executive Directors for the 14 months ended 31 March 2017 is set out in the table below:
Base fees Other fees Equity awards Total
Kevin Chin £200,000 NIL NIL £200,000
Edward Hyams £21,667 £6,000 NIL £27,667
Peter Sermol £13,477 £6,000 NIL £19,477
Gary Hui £36,000 £36,992 NIL £72,992
The Company was incorporated 1 February 2016, and in accordance with section 392 of the Companies Act 2006 extended its accounting reference date to 31 March 2017. The Company therefore does not have a prior financial period for which records for remuneration can be disclosed.
In future years this table will be updated to show remuneration paid in the relevant years.
Details of amounts included in the single total figure for the 14 months ended 31 March 2017
Kevin Chin receives £165,000 per annum for being Chairman of the Board plus a further £30,000 for being Chairman of each of the Audit, Nomination and Remuneration Committees.
Kevin Chin was officially appointed as a Non‐Executive Director on 1 August 2016. Prior to this date he acted for the benefit of the Company through his role as the Executive Chairman and CEO of Arowana International from the date of incorporation (i.e. 1 February 2016). The amount presented in the table above reflects the amount earned by Kevin Chin over the period 1 February 2016 to 31 March 2017.
Edward Hyams was appointed as a Non‐Executive Director on 29 July 2016 and commenced that role from 2 November 2016. Edward Hyams receives £48,000 per annum for being a Non‐Executive Director. Edward Hyams receives an additional £5,000 per annum for being a member of the Nomination, Audit and Remuneration Committees.
Peter Sermol was appointed as a Non‐Executive Director on 1 August 2016 and commenced that role from 21 December 2016. Edward Hyams receives £48,000 per annum for being a Non‐Executive Director. Peter Sermol receives an additional £5,000 per annum for being a member of the Nomination, Audit and Remuneration Committees.
Gary Hui was officially appointed as a Non‐Executive Director on 1 August 2016. Prior to this date he acted for the benefit of the Company through his role as the CIO of Arowana International from the 1 July 2016. The amount presented in the table above reflects the amount earned by Gary Hui over the period 1 July 2016 to 31 March 2017. Gary Hui is also paid an annual salary of $360,000 through US payroll, in compensation for additional work undertaken for the benefit of the Company, including his role on the investment committee.
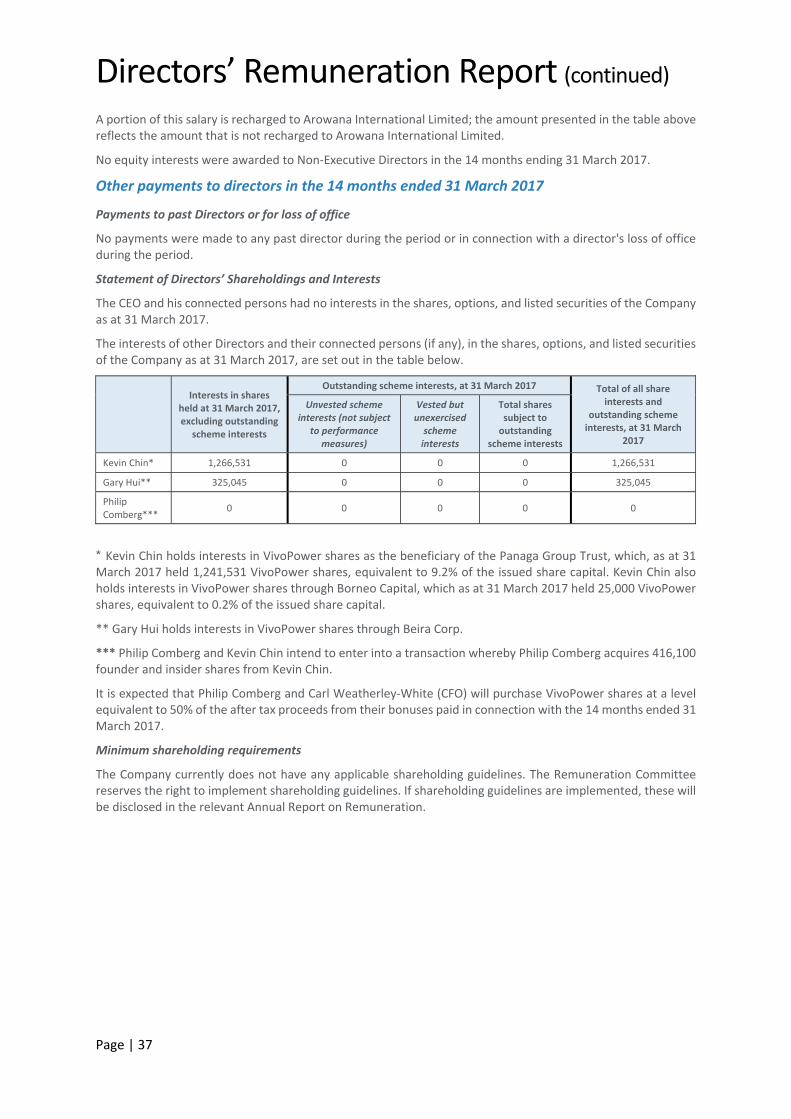
Directors’ Remuneration Report (continued)
Page | 37
A portion of this salary is recharged to Arowana International Limited; the amount presented in the table above reflects the amount that is not recharged to Arowana International Limited.
No equity interests were awarded to Non‐Executive Directors in the 14 months ending 31 March 2017.
Other payments to directors in the 14 months ended 31 March 2017
Payments to past Directors or for loss of office
No payments were made to any past director during the period or in connection with a director's loss of office during the period.
Statement of Directors’ Shareholdings and Interests
The CEO and his connected persons had no interests in the shares, options, and listed securities of the Company as at 31 March 2017.
The interests of other Directors and their connected persons (if any), in the shares, options, and listed securities of the Company as at 31 March 2017, are set out in the table below.
Interests in shares held at 31 March 2017, excluding outstanding
scheme interests
Outstanding scheme interests, at 31 March 2017 Total of all share interests and
outstanding scheme interests, at 31 March
2017
Unvested scheme interests (not subject
to performance measures)
Vested but unexercised scheme interests
Total shares subject to outstanding
scheme interests
Kevin Chin* 1,266,531 0 0 0 1,266,531
Gary Hui** 325,045 0 0 0 325,045
Philip Comberg***
0 0 0 0 0
* Kevin Chin holds interests in VivoPower shares as the beneficiary of the Panaga Group Trust, which, as at 31 March 2017 held 1,241,531 VivoPower shares, equivalent to 9.2% of the issued share capital. Kevin Chin also holds interests in VivoPower shares through Borneo Capital, which as at 31 March 2017 held 25,000 VivoPower shares, equivalent to 0.2% of the issued share capital.
** Gary Hui holds interests in VivoPower shares through Beira Corp.
*** Philip Comberg and Kevin Chin intend to enter into a transaction whereby Philip Comberg acquires 416,100 founder and insider shares from Kevin Chin.
It is expected that Philip Comberg and Carl Weatherley‐White (CFO) will purchase VivoPower shares at a level equivalent to 50% of the after tax proceeds from their bonuses paid in connection with the 14 months ended 31 March 2017.
Minimum shareholding requirements
The Company currently does not have any applicable shareholding guidelines. The Remuneration Committee reserves the right to implement shareholding guidelines. If shareholding guidelines are implemented, these will be disclosed in the relevant Annual Report on Remuneration.
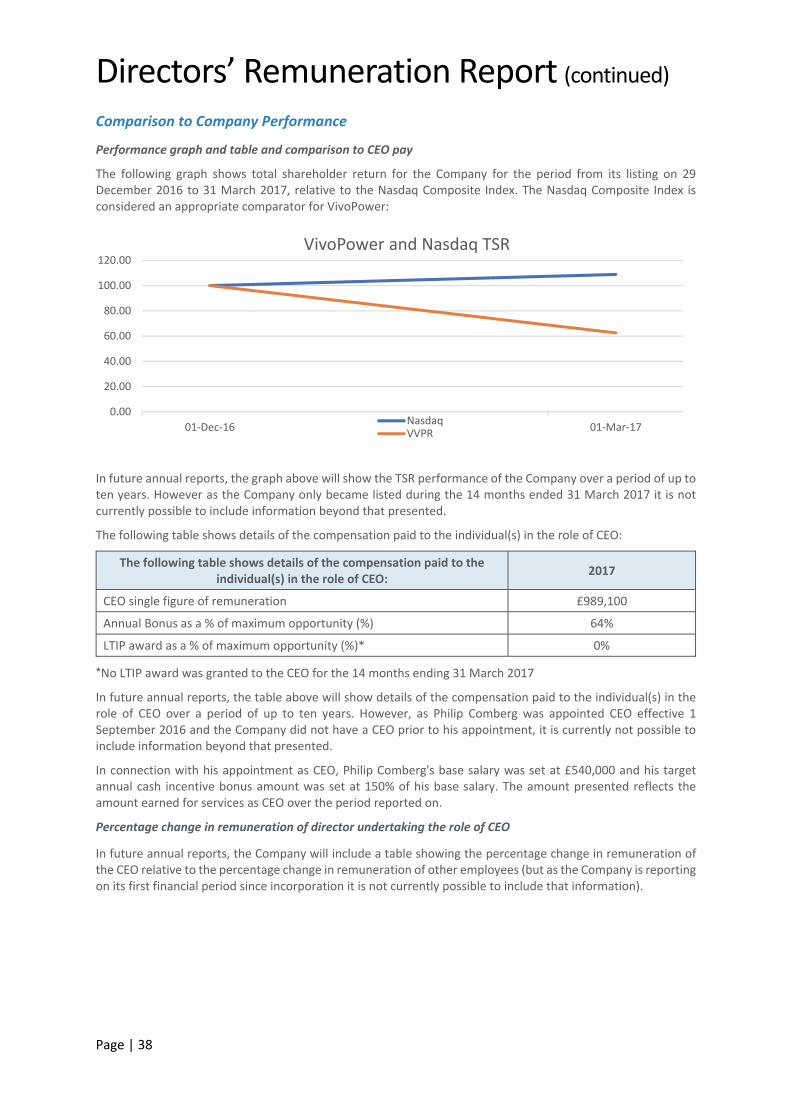
Directors’ Remuneration Report (continued)
Page | 38
Comparison to Company Performance
Performance graph and table and comparison to CEO pay
The following graph shows total shareholder return for the Company for the period from its listing on 29 December 2016 to 31 March 2017, relative to the Nasdaq Composite Index. The Nasdaq Composite Index is considered an appropriate comparator for VivoPower:
In future annual reports, the graph above will show the TSR performance of the Company over a period of up to ten years. However as the Company only became listed during the 14 months ended 31 March 2017 it is not currently possible to include information beyond that presented.
The following table shows details of the compensation paid to the individual(s) in the role of CEO:
The following table shows details of the compensation paid to the individual(s) in the role of CEO: 2017
CEO single figure of remuneration £989,100
Annual Bonus as a % of maximum opportunity (%) 64%
LTIP award as a % of maximum opportunity (%)* 0%
*No LTIP award was granted to the CEO for the 14 months ending 31 March 2017
In future annual reports, the table above will show details of the compensation paid to the individual(s) in the role of CEO over a period of up to ten years. However, as Philip Comberg was appointed CEO effective 1 September 2016 and the Company did not have a CEO prior to his appointment, it is currently not possible to include information beyond that presented.
In connection with his appointment as CEO, Philip Comberg's base salary was set at £540,000 and his target annual cash incentive bonus amount was set at 150% of his base salary. The amount presented reflects the amount earned for services as CEO over the period reported on.
Percentage change in remuneration of director undertaking the role of CEO
In future annual reports, the Company will include a table showing the percentage change in remuneration of the CEO relative to the percentage change in remuneration of other employees (but as the Company is reporting on its first financial period since incorporation it is not currently possible to include that information).
29 Dec 2016 31 Mar 2017 0.00
20.00
40.00
60.00
80.00
100.00
120.00
01‐Dec‐16 01‐Mar‐17
VivoPower and Nasdaq TSR
NasdaqVVPR
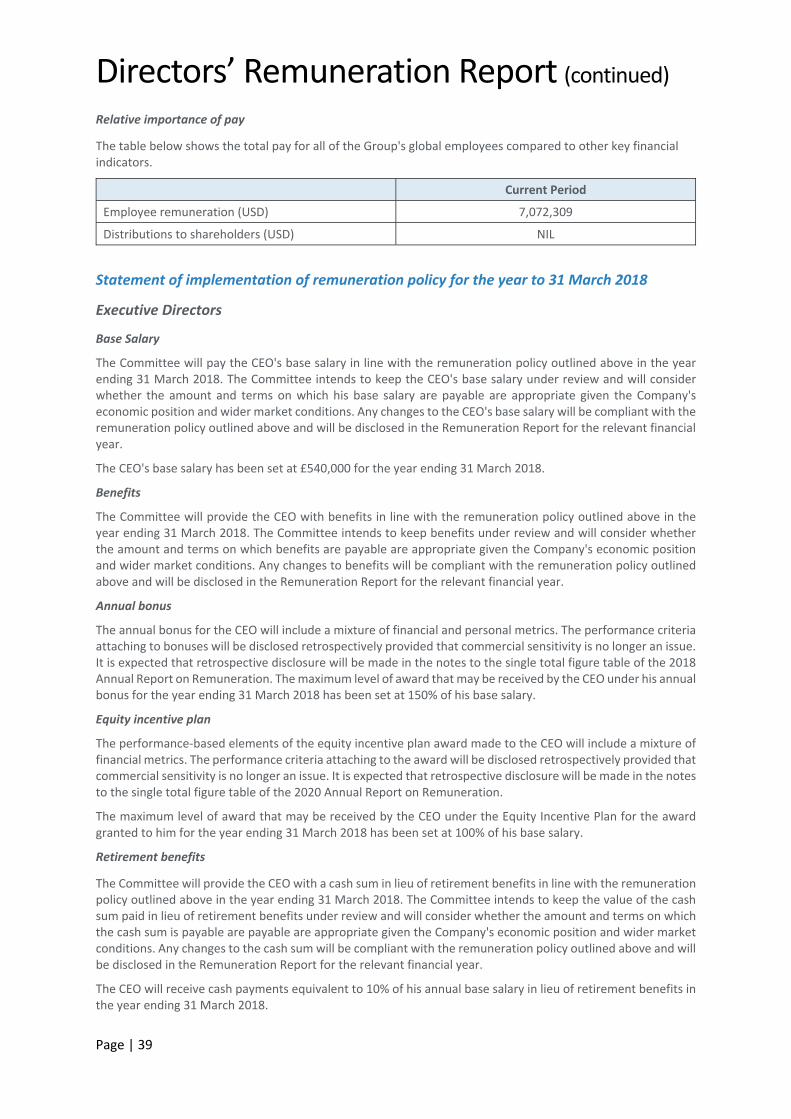
Directors’ Remuneration Report (continued)
Page | 39
Relative importance of pay
The table below shows the total pay for all of the Group's global employees compared to other key financial indicators.
Current Period
Employee remuneration (USD) 7,072,309
Distributions to shareholders (USD) NIL
Statement of implementation of remuneration policy for the year to 31 March 2018
Executive Directors
Base Salary
The Committee will pay the CEO's base salary in line with the remuneration policy outlined above in the year ending 31 March 2018. The Committee intends to keep the CEO's base salary under review and will consider whether the amount and terms on which his base salary are payable are appropriate given the Company's economic position and wider market conditions. Any changes to the CEO's base salary will be compliant with the remuneration policy outlined above and will be disclosed in the Remuneration Report for the relevant financial year.
The CEO's base salary has been set at £540,000 for the year ending 31 March 2018.
Benefits
The Committee will provide the CEO with benefits in line with the remuneration policy outlined above in the year ending 31 March 2018. The Committee intends to keep benefits under review and will consider whether the amount and terms on which benefits are payable are appropriate given the Company's economic position and wider market conditions. Any changes to benefits will be compliant with the remuneration policy outlined above and will be disclosed in the Remuneration Report for the relevant financial year.
Annual bonus
The annual bonus for the CEO will include a mixture of financial and personal metrics. The performance criteria attaching to bonuses will be disclosed retrospectively provided that commercial sensitivity is no longer an issue. It is expected that retrospective disclosure will be made in the notes to the single total figure table of the 2018 Annual Report on Remuneration. The maximum level of award that may be received by the CEO under his annual bonus for the year ending 31 March 2018 has been set at 150% of his base salary.
Equity incentive plan
The performance‐based elements of the equity incentive plan award made to the CEO will include a mixture of financial metrics. The performance criteria attaching to the award will be disclosed retrospectively provided that commercial sensitivity is no longer an issue. It is expected that retrospective disclosure will be made in the notes to the single total figure table of the 2020 Annual Report on Remuneration.
The maximum level of award that may be received by the CEO under the Equity Incentive Plan for the award granted to him for the year ending 31 March 2018 has been set at 100% of his base salary.
Retirement benefits
The Committee will provide the CEO with a cash sum in lieu of retirement benefits in line with the remuneration policy outlined above in the year ending 31 March 2018. The Committee intends to keep the value of the cash sum paid in lieu of retirement benefits under review and will consider whether the amount and terms on which the cash sum is payable are payable are appropriate given the Company's economic position and wider market conditions. Any changes to the cash sum will be compliant with the remuneration policy outlined above and will be disclosed in the Remuneration Report for the relevant financial year.
The CEO will receive cash payments equivalent to 10% of his annual base salary in lieu of retirement benefits in the year ending 31 March 2018.
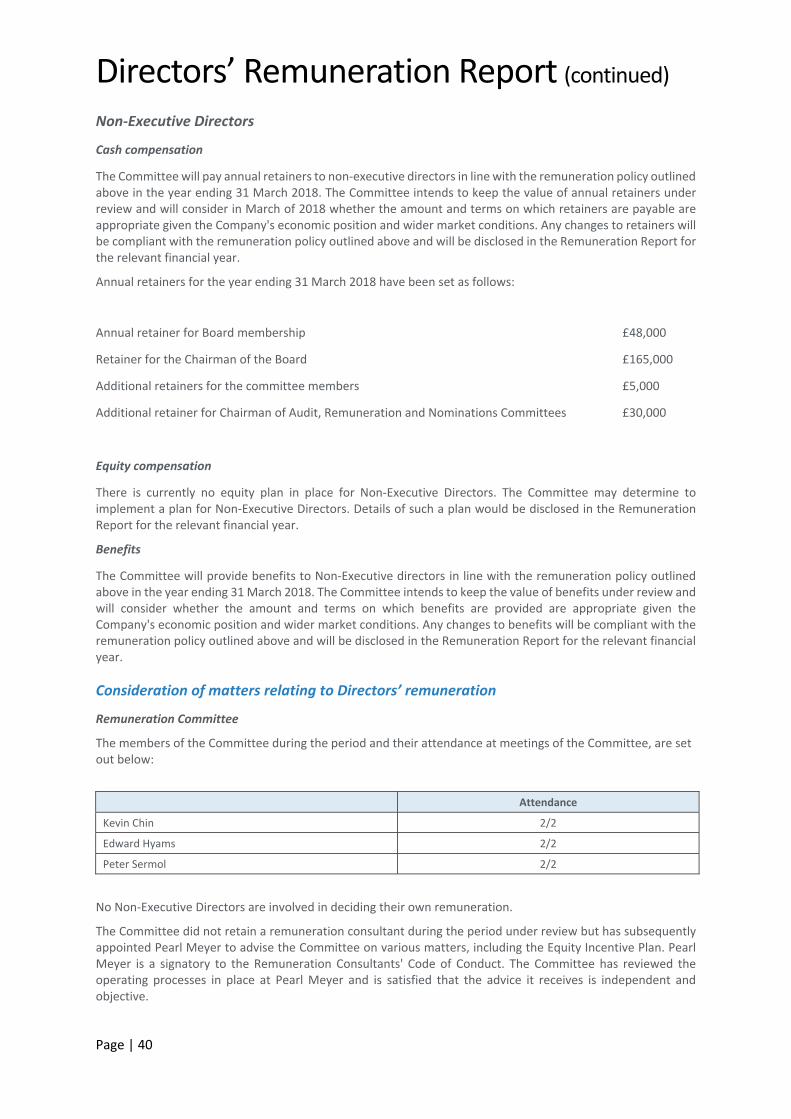
Directors’ Remuneration Report (continued)
Page | 40
Non‐Executive Directors
Cash compensation
The Committee will pay annual retainers to non‐executive directors in line with the remuneration policy outlined above in the year ending 31 March 2018. The Committee intends to keep the value of annual retainers under review and will consider in March of 2018 whether the amount and terms on which retainers are payable are appropriate given the Company's economic position and wider market conditions. Any changes to retainers will be compliant with the remuneration policy outlined above and will be disclosed in the Remuneration Report for the relevant financial year.
Annual retainers for the year ending 31 March 2018 have been set as follows:
Annual retainer for Board membership £48,000
Retainer for the Chairman of the Board £165,000
Additional retainers for the committee members £5,000
Additional retainer for Chairman of Audit, Remuneration and Nominations Committees £30,000
Equity compensation
There is currently no equity plan in place for Non‐Executive Directors. The Committee may determine to implement a plan for Non‐Executive Directors. Details of such a plan would be disclosed in the Remuneration Report for the relevant financial year.
Benefits
The Committee will provide benefits to Non‐Executive directors in line with the remuneration policy outlined above in the year ending 31 March 2018. The Committee intends to keep the value of benefits under review and will consider whether the amount and terms on which benefits are provided are appropriate given the Company's economic position and wider market conditions. Any changes to benefits will be compliant with the remuneration policy outlined above and will be disclosed in the Remuneration Report for the relevant financial year. Consideration of matters relating to Directors’ remuneration
Remuneration Committee
The members of the Committee during the period and their attendance at meetings of the Committee, are set out below:
Attendance
Kevin Chin 2/2
Edward Hyams 2/2
Peter Sermol 2/2
No Non‐Executive Directors are involved in deciding their own remuneration.
The Committee did not retain a remuneration consultant during the period under review but has subsequently appointed Pearl Meyer to advise the Committee on various matters, including the Equity Incentive Plan. Pearl Meyer is a signatory to the Remuneration Consultants' Code of Conduct. The Committee has reviewed the operating processes in place at Pearl Meyer and is satisfied that the advice it receives is independent and objective.
Directors’ Remuneration Report (continued)
Page | 41
Herbert Smith Freehills LLP and Winston & Strawn LLP provide the Company with legal advice. Advice from Herbert Smith Freehills LLP and Winston & Strawn LLP is made available to the Remuneration Committee, where it relates to matters within its remit.
Statement of voting at general meeting
This is the first financial period in respect of which the Company is required to produce a Remuneration Policy, and therefore no shareholder vote has previously been held on the Remuneration Policy. The Company will report on the votes cast by shareholders on the Company's Remuneration Policy and Annual Report on Remuneration in future annual reports.
The Remuneration Report was approved by a duly authorised Committee of the Board of Directors on 28 July 2017 and signed on its behalf by:
Kevin Chin Chair of the Remuneration Committee
28 July 2017
Independent Auditor’s Report to the Members of VivoPower International PLC
Page | 42
We have audited the financial statements of VivoPower International PLC for the 14 months ended 31 March 2017 which comprise the Group and Parent Company Statements of Financial Position, the Group Statements of Comprehensive Income, the Group Statements of Cash Flows, the Group and Parent Company Statements of Changes in Equity and the related notes. The financial reporting framework that has been applied in their preparation is applicable law and International Financial Reporting Standards (IFRSs). This report is made solely to the Company’s members, as a body, in accordance with Chapter 3 of Part 16 of the Companies Act 2006. Our audit work has been undertaken so that we might state to the company’s members those matters we are required to state to them in an auditor’s report and for no other purpose. To the fullest extent permitted by law, we do not accept or assume responsibility to anyone, other than the company and the company's members as a body, for our audit work, for this report, or for the opinions we have formed. Respective responsibilities of Directors and Auditor As explained more fully in the Directors’ Responsibilities Statement, the Directors are responsible for the preparation of the financial statements and for being satisfied that they give a true and fair view. Our responsibility is to audit and express an opinion on the financial statements in accordance with applicable law and International Standards on Auditing (UK and Ireland). Those standards require us to comply with the Auditing Practices Board’s Ethical Standards for Auditors. Scope of the audit of the financial statements An audit involves obtaining evidence about the amounts and disclosures in the financial statements sufficient to give reasonable assurance that the financial statements are free from material misstatement, whether caused by fraud or error. This includes an assessment of: whether the accounting policies are appropriate to the group’s and parent company’s circumstances and have been consistently applied and adequately disclosed; the reasonableness of significant accounting estimates made by Directors; and the overall presentation of the financial statements. In addition, we read all the financial and non‐financial information in the Annual Report to identify material inconsistencies with the audited financial statements and to identify any information that is apparently materially incorrect based on, or materially inconsistent with, the knowledge acquired by us in the course of performing the audit. If we become aware of any apparent material misstatements or inconsistencies we consider the implications for our report. Opinion on financial statements In our opinion: • the financial statements give a true and fair view of the state of the group’s and of the parent company’s
affairs as at 31 March 2017 and of the group’s and the parent company’s profit for the period then ended; • the financial statements have been properly prepared in accordance with IFRS; and • the financial statements have been prepared in accordance with the requirements of the Companies Act
2006. Opinion on other matter prescribed by the Companies Act 2006 In our opinion, based on the work undertaken in the course of the audit: • the information given in the Strategic Report and the Directors’ Report for the financial period for which
the financial statements are prepared is consistent with the financial statements; and • the Strategic Report and the Directors’ Report have been prepared in accordance with applicable legal
requirements.
Independent Auditor’s Report to the Members of VivoPower International PLC
Page | 43
Matters on which we are required to report by exception In light of the knowledge and understanding of the company and its environment obtained in the course of the audit, we have not identified material misstatements in the Strategic Report and the Directors’ Report. We have nothing to report in respect of the following matters where the Companies Act 2006 requires us to report to you if, in our opinion:
• adequate accounting records have not been kept by the parent company, or returns adequate for our audit
have not been received from branches not visited by us; or • the parent company financial statements are not in agreement with the accounting records and returns;
or • certain disclosures of Directors’ remuneration specified by law are not made; or • we have not received all the information and explanations we require for our audit.
Alistair Roberts 1 Westferry Circus, For and on behalf of PKF Littlejohn LLP Canary Wharf, Senior statutory auditor London, UK, E14 4HD 28 July 2017
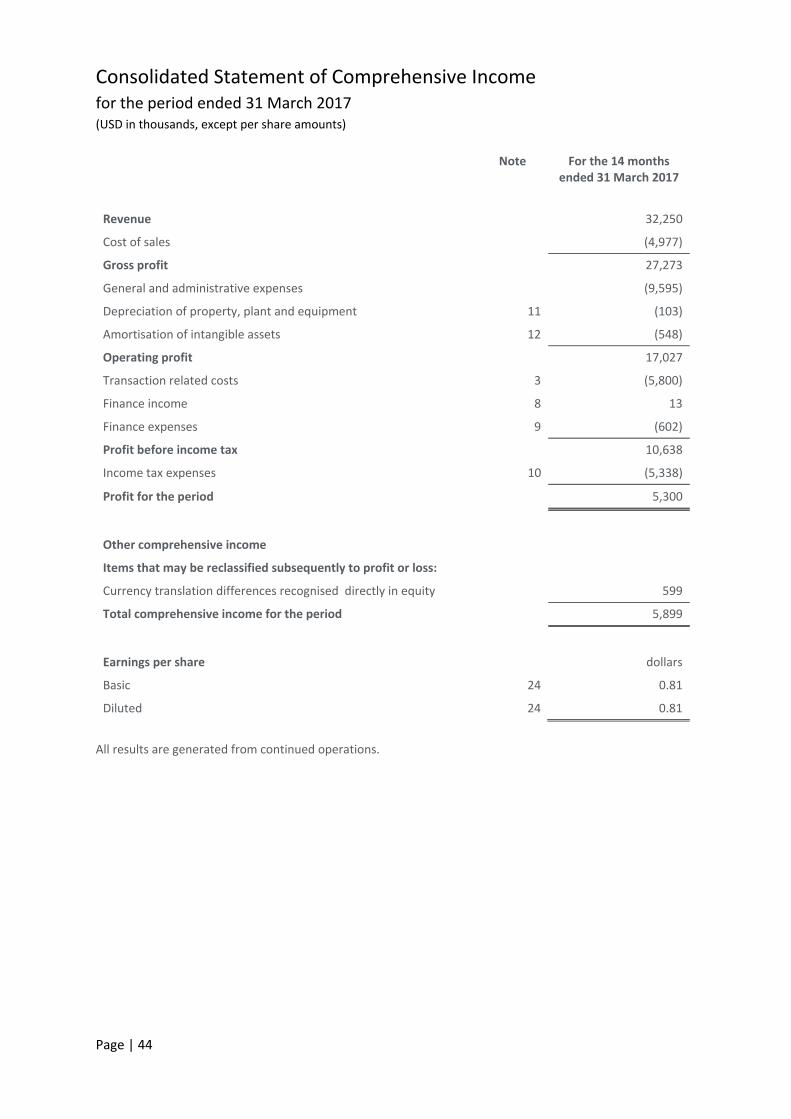
Consolidated Statement of Comprehensive Income for the period ended 31 March 2017 (USD in thousands, except per share amounts)
Page | 44
Note For the 14 months
ended 31 March 2017
Revenue 32,250
Cost of sales (4,977)
Gross profit 27,273
General and administrative expenses (9,595)
Depreciation of property, plant and equipment 11 (103)
Amortisation of intangible assets 12 (548)
Operating profit 17,027
Transaction related costs 3 (5,800)
Finance income 8 13
Finance expenses 9 (602)
Profit before income tax 10,638
Income tax expenses 10 (5,338)
Profit for the period 5,300
Other comprehensive income
Items that may be reclassified subsequently to profit or loss:
Currency translation differences recognised directly in equity 599
Total comprehensive income for the period 5,899
Earnings per share dollars
Basic 24 0.81
Diluted 24 0.81
All results are generated from continued operations.
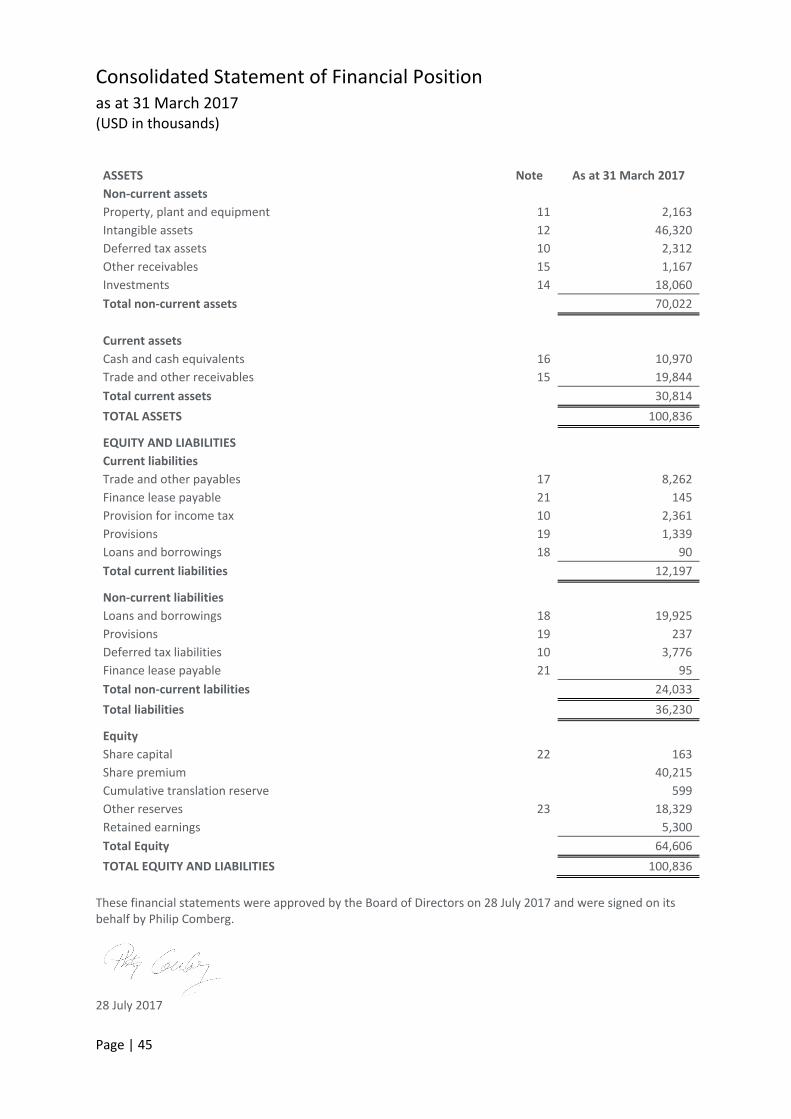
Consolidated Statement of Financial Position as at 31 March 2017 (USD in thousands)
Page | 45
These financial statements were approved by the Board of Directors on 28 July 2017 and were signed on its behalf by Philip Comberg.
28 July 2017
ASSETS Note As at 31 March 2017
Non‐current assets
Property, plant and equipment 11 2,163
Intangible assets 12 46,320
Deferred tax assets 10 2,312
Other receivables 15 1,167
Investments 14 18,060
Total non‐current assets 70,022
Current assets
Cash and cash equivalents 16 10,970
Trade and other receivables 15 19,844
Total current assets 30,814
TOTAL ASSETS 100,836
EQUITY AND LIABILITIES
Current liabilities
Trade and other payables 17 8,262
Finance lease payable 21 145
Provision for income tax 10 2,361
Provisions 19 1,339
Loans and borrowings 18 90
Total current liabilities 12,197
Non‐current liabilities
Loans and borrowings 18 19,925
Provisions 19 237
Deferred tax liabilities 10 3,776
Finance lease payable 21 95
Total non‐current labilities 24,033
Total liabilities 36,230
Equity
Share capital 22 163
Share premium 40,215
Cumulative translation reserve 599
Other reserves 23 18,329
Retained earnings 5,300
Total Equity 64,606
TOTAL EQUITY AND LIABILITIES
100,836
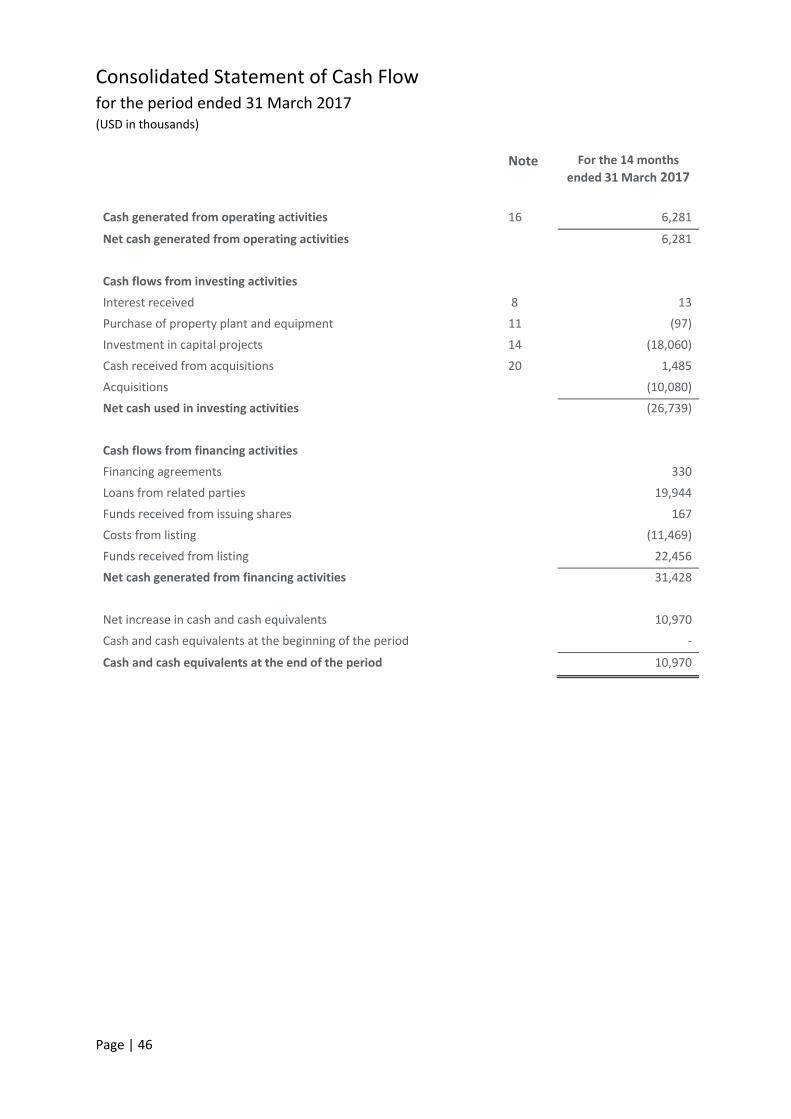
Consolidated Statement of Cash Flow for the period ended 31 March 2017 (USD in thousands)
Page | 46
Note For the 14 months
ended 31 March 2017
Cash generated from operating activities 16 6,281
Net cash generated from operating activities 6,281
Cash flows from investing activities
Interest received 8 13
Purchase of property plant and equipment 11 (97)
Investment in capital projects 14 (18,060)
Cash received from acquisitions 20 1,485
Acquisitions
(10,080)
Net cash used in investing activities (26,739)
Cash flows from financing activities
Financing agreements 330
Loans from related parties 19,944
Funds received from issuing shares
167
Costs from listing
(11,469)
Funds received from listing 22,456
Net cash generated from financing activities 31,428
Net increase in cash and cash equivalents 10,970
Cash and cash equivalents at the beginning of the period ‐
Cash and cash equivalents at the end of the period 10,970
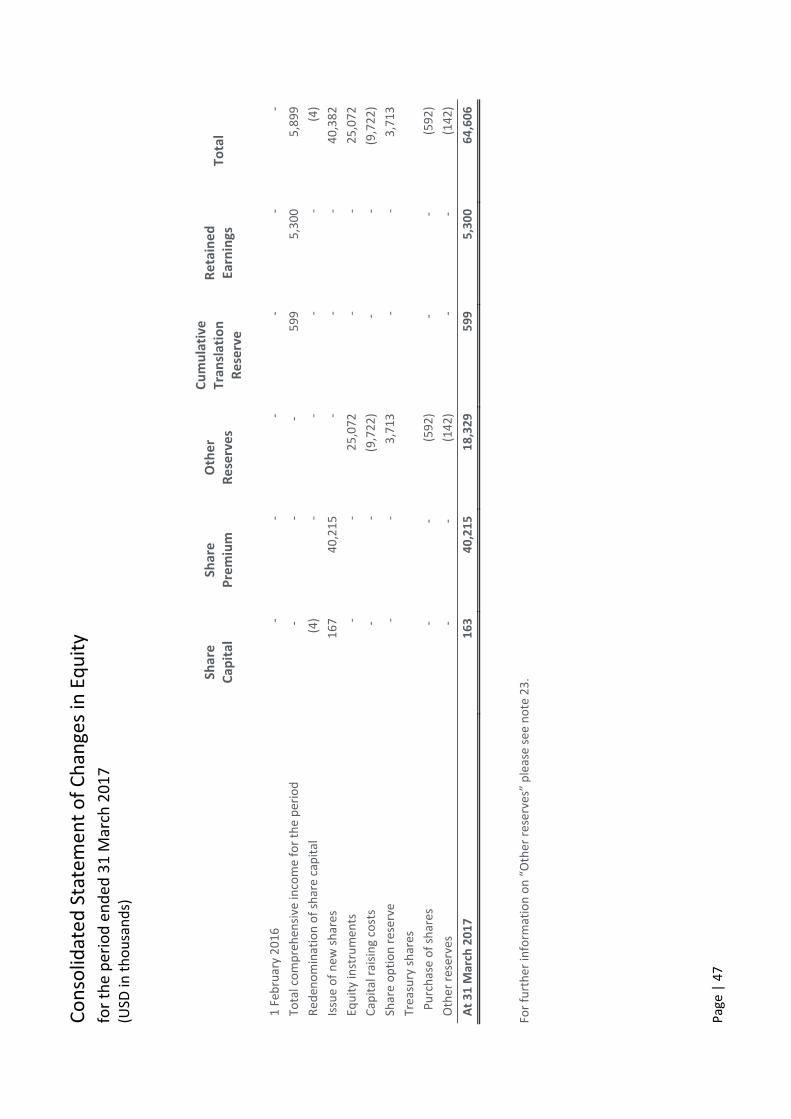
Consolid
ated
Statemen
t of Chan
ges in Equity
for the period ended
31 M
arch 2017
(USD
in thousands)
Page | 47
Share
Cap
ital
Share
Premium
Other
Reserves
Cumulative
Tran
slation
Reserve
Retained
Earnings
Total
1 Feb
ruary 2016
‐‐
‐‐
‐‐
Total comprehen
sive in
come for the period
‐ ‐
‐ 599
5,300
5,899
Red
enomination of share capital
(4)
‐ ‐
‐ ‐
(4)
Issue of new
shares
167
40,215
‐ ‐
‐ 40,382
Equity instrumen
ts
‐ ‐
25,072
‐ ‐
25,072
Cap
ital raising costs
‐ ‐
(9,722)
‐ ‐
(9,722)
Share option reserve
‐ ‐
3,713
‐ ‐
3,713
Treasury shares
Purchase of shares
‐ ‐
(592)
‐ ‐
(592)
Other reserves
‐ ‐
(142)
‐ ‐
(142)
At 31 M
arch 2017
163
40,215
18,329
599
5,300
64,606
For further in
form
ation on “Other reserves” please see note 23.
Notes to the Financial Statements for the period ended 31 March 2017
Page | 48
1. Reporting entity
VivoPower International PLC (“VivoPower” or the “Company”) is a company domiciled in the United Kingdom. The address of the Company’s registered office is 91 Wimpole Street, Marylebone, London, W1G 0EF. The consolidated financial statements of the Company as at and for the period ended 31 March 2017 comprise the financial statements of the Company and its subsidiaries (together referred to as the ‘group’ and individually as ‘group entities’. The ultimate parent company into which these results are consolidated is Arowana International Limited.
2. Accounting policies
Summary of significant accounting policies:
The principal accounting policies applied in the preparation of these financial statements are set out below. These policies have been consistently applied to all periods presented, unless otherwise stated.
2.1 Basis of preparation
VivoPower International PLC consolidated financial statements were prepared in accordance with International Financial Reporting Standards (IFRS), IFRIC interpretations and the Companies Act 2006 applicable to companies reporting under IFRS. The consolidated financial statements have been prepared under the historical cost convention. The financial statements are the first to be prepared for VivoPower International PLC and are for the 14 months from the date of formation to 31 March 2017. The Company has elected to prepare its parent company financial statements in accordance with IFRS. These are presented on page 77. The preparation of financial statements with adopted IFRS requires the use of critical accounting estimates. It also requires the management to exercise judgement in the process of applying the Company’s accounting policies. The areas involving a higher degree of judgement or complexity, or areas where the assumptions and estimates are significant to the consolidated financial statements are disclosed in note 3.
The directors believe that the Company is well placed to manage its business risk successfully, despite some current economic and political uncertainty. The directors therefore have a reasonable expectation that the Company has adequate resources to continue in operational existence for the foreseeable future. Thus, they have continued to adopt the going concern basis in preparing these financial statements.
All financial information presented in US Dollars has been rounded to the nearest thousand.
Significant accounting policies 2.1.1 Basis of consolidation
The consolidated financial statements include those of VivoPower International PLC and all of its subsidiary undertakings.
Subsidiary undertakings are those entities controlled directly or indirectly by the Company. The results of the subsidiaries acquired are included in the consolidated Statement of Comprehensive Income from the date of acquisition using the same accounting policies of those of the group. All business combinations are accounted for using the purchase method. Where necessary, adjustments are made to the financial statements of subsidiaries to bring their accounting policies in line with those used by other members of the group.All intra‐group balances and transactions, including any unrealised income and expense arising from intra‐group transactions, are eliminated in full in preparing the consolidated financial statements.
Notes to the Financial Statements (continued) for the period ended 31 March 2017
Page | 49
Unrealised gains arising from transactions with equity invested investees are eliminated against the investment to the extent of the group’s interest in the investee. Unrealised losses are eliminated in the same way as unrealised gains, but only to the extent that there is no evidence of impairment.
2.2.2 Intangible assets
All intangible assets, except goodwill, are stated at fair value less accumulated amortisation and any accumulated impairment losses. Goodwill is not amortised and is stated at cost less any accumulated impairment losses.
Goodwill Goodwill arose on the effective acquisition of VivoPower Pty Limited and the Aevitas Group of companies. Goodwill is reviewed annually to test for impairment.
Other intangible assets Intangible assets acquired through a business combination are initially measured at fair value and then amortised over their useful economic lives. The Group has taken advantage of the provisions of IFRS 3 in accounting for the business combinations arising from the acquisitions of Aevitas O Holdings Pty Ltd and VivoPower Pty Ltd. Accordingly, the financial statements currently recognise the Directors' best estimate of the individual allocation of goodwill and other separately identifiable assets acquired. The completion of the purchase price allocation exercise will be finalised within 12 months following the date of acquisition. Amortisation is calculated on a straight‐line basis to write down the assets over their useful economic lives at the following rates: Customer relationships – 7 years Trade names – 14 years Favourable supply contracts – 5 years Databases – 5 years
2.2.3 Property, plant and equipment
Property, plant and equipment are stated at cost less accumulated depreciation and any accumulated impairment losses. The cost of an item of property, plant and equipment comprises its purchase price and the costs directly attributable to bringing the asset into use. When parts of an item of property, plant and equipment have different useful lives, they are accounted as separate items (major components) of property, plant and equipment. Depreciation is calculated on a straight‐line basis so as to write down the assets to their estimated residual value over their useful economic lives at the following rates: Computer equipment – 3 years Fixtures and fittings – 3 years Motor vehicles – 5 years
2.2.4 Business combinations
Acquisitions of subsidiaries and businesses are accounted for using the acquisition method. The consideration transferred in a business combination is the fair value at the acquisition date of the assets transferred and the liabilities incurred by the Group and includes the fair value of any contingent
Notes to the Financial Statements (continued) for the period ended 31 March 2017
Page | 50
consideration arrangement. Acquisition‐related costs are recognised in the income statement as incurred.
2.2.5 Leases
Leases are classified as finance leases whenever the terms of the lease transfer substantially all the risks and rewards of ownership to the lessee. All other leases are classified as operating leases. Assets held under finance leases are initially recognised as property, plant and equipment at an amount equal to the fair value of the leased assets or, if lower, the present value of the minimum lease payments at the inception of the lease, and then depreciated over their useful economic lives. Lease payments are apportioned between the repayment of capital and interest. The capital element of future lease payments is included in the Statement of Financial Position as a liability. Interest is charged to the Statement of Comprehensive Income so as to achieve a constant rate of interest on the remaining balance of the liability. Rentals payable under operating leases are charged to the Statement of Comprehensive Income on a straight‐line basis over the lease term. Operating leases incentives are recognised as a reduction in the rental expense over the lease term.
2.2.6 Impairment of non‐financial assets
Goodwill is allocated to cash‐generating units for the purposes of impairment testing. The recoverable amount of the cash‐generating unit (‘CGU’) to which the goodwill relates is tested annually for impairment or when events or changes to circumstances indicate that it might be impaired. The carrying values of property, plant and equipment, investments and intangible assets other than goodwill are reviewed for impairment only when events indicate the carrying value may be impaired. In an impairment test the recoverable amount of the cash‐generating unit or asset is estimated in order to determine the existence or extent of any impairment loss. The recoverable amount is the higher of fair value less costs to sell and the value in use to the group. An impairment loss is recognised to the extent that the carrying value exceeds the recoverable amount. In determining a cash‐generating unit’s or asset’s value in use, estimated future cash flows are discounted to their present value using a pre‐tax discount rate that reflects current market assessments of the time‐value of money and risks specific to the cash‐generating unit or asset that have not already been included in the estimate of future cash flows. All impairment losses are recognised in the Statement of Comprehensive Income. An impairment loss in respect of goodwill is not reversed. In the case of other assets, impairment losses recognised in prior periods are assessed at each reporting date for any indications that the loss has decreased or no longer exists. These impairment losses are reversed if there has been any change in the estimates used to determine the recoverable amount. An impairment loss is reversed only to the extent so that the asset’s carrying amount does not exceed the carrying value that would have been determined, net of depreciation or amortisation, if no impairment loss had been recognised.
2.2.7 Financial instruments
Financial assets and liabilities are recognised in the group’s Statement of Financial Position when the group becomes a party to the contracted provision of the instrument. The following policies for financial instruments have been applied in the preparation of the consolidated financial statements. Fair value is the price that would be received to sell an asset or paid to transfer a liability in an orderly transaction between market participants at the measurement date. The fair value measurement is
Notes to the Financial Statements (continued) for the period ended 31 March 2017
Page | 51
based on the presumption that the transaction to sell the asset ortransfer the liability takes place either:
in the principal market for the asset or liability; or
in the absence of a principal market, in the most advantageous market for the asset or liability.
The principal or the most advantageous market must be accessible by the group. The fair value of an asset or a liability is measured using the assumptions that market participants would use when pricingthe asset orliability, assuming that market participants act in their economic best interest.
All assets and liabilities for which fair value is measured or disclosed in the financial statements are categorised within the fair value hierarchy, described as follows, based on the lowest level input that is significant to the fair value measurement asa whole:
Level 1 — quoted (unadjusted) market prices in active markets for identical assets or liabilities;
Level 2 — valuation techniques for which the lowest level input that is significant to the fair value measurement is directly or indirectly observable; and
Level 3 — valuation techniques for which the lowest level input that is significant to the fair value measurement is unobservable.
Cash and cash equivalents For the purpose of preparation of the Statement of Cash Flow, cash and cash equivalents includes cash at bank and in hand.
Bank borrowings Interest‐bearing bank loans are recorded at the proceeds received. Direct issue costs paid on the establishment of loan facilities are recognised over the term of the loan on a straight‐line basis. The initial payment is taken to the Statement of Financial Position and then amortised over the full‐length of the facility.
Trade and other receivables Trade and other receivables are stated at amounts receivable less any allowance for the expected future issue of credit notes and for non‐recoverability due to credit risk.
Trade payables Trade payables are non‐interest bearing and are stated at their amortised cost.
Share capital Ordinary shares are classified as equity. Incremental costs directly attributable to the issue of ordinary shares are recognised as a deduction from equity, net of any tax effects.
Repurchase of share capital (treasury shares) When share capital recognised as equity is repurchased as equity by the Company the amount of the consideration paid, which includes directly attributable costs, net of any tax effects, is recognised as a deduction from equity, and excluded from the number of shares in issue when calculating earnings per share.
Notes to the Financial Statements (continued) for the period ended 31 March 2017
Page | 52
2.2.8 Taxation Income tax expense comprises current and deferred tax.
Current tax is recognised based on the amounts expected to be paid or recovered under the tax rates and laws that have been enacted or substantively enacted by the end of the reporting period. Deferred tax is provided on temporary timing differences that arise between the carrying amounts of assets and liabilities for financial reporting purposes and their corresponding tax values. Liabilities are recorded on all temporary differences except in respect of initial recognition of goodwill and in respect of investments in subsidiaries where the timing of the reversal of the temporary difference is controlled by the group and it is probable that it will not reverse in the foreseeable future. Deferred tax assets are recognised to the extent that it is probable that future taxable profits will be available against which the asset can be offset. Deferred tax is measured on an undiscounted basis using the tax rates and laws that have been enacted or substantively enacted by the end of the accounting period. Deferred tax assets and liabilities are offset if there is a legally enforceable right to offset current tax assets and liabilities, they relate to income taxes levied by the same tax authority and the group intends to settle current tax liabilities and assets on a net basis or their tax assets and liabilities will be realised simultaneously. Current and deferred tax are recognised in the Statement of Comprehensive Income, except when the tax relates to items charged or credited directly to equity, in which case it is also dealt with directly in equity.
2.2.9 Provisions
Provisions are recognised when the group has a present obligation because of a past event, it is probable that the group will be required to settle that obligation, and it can be measured reliably. Provisions are measured at the directors’ best estimate of the expenditure required to settle the obligation at the date of Statement of Financial Position. Where the time value of money is material, provisions are measured at the present value of expenditures expected to be paid in settlement.
2.2.10 Earnings per share
The group presents basic and diluted earnings per share (EPS) data for ordinary shares. Basic EPS is calculated by dividing the profit or loss attributable to ordinary shareholders of the Company by the weighted average number of ordinary shares, excluding the shares held as treasury shares. Currently there are no diluting effects on EPS for ordinary shares, therefore, diluted EPS is the same as basic EPS.
2.2.11 Foreign currencies
The Company’s functional and presentational currency is the US Dollar. Items included in the separate financial statements of each group entity are measured in the functional currency of that entity. Transactions denominated in foreign currencies are translated into the functional currency of the entity at the rates of exchange prevailing at the dates of the individual transactions. Foreign currency monetary assets and liabilities are translated at the rates of exchange prevailing at the end of the reporting period. Exchange gains and losses arising are charged to the Statement of Comprehensive Income within finance income or expenses. The Statement of Comprehensive and Statement of Financial Position of
Notes to the Financial Statements (continued) for the period ended 31 March 2017
Page | 53
foreign entities are translated into US dollars on consolidation at the average rates for the period and the rates prevailing at the end of the reporting period respectively. Exchange gains and losses arising on the translation of the group’s net investment foreign entities are recognised as a separate component of shareholders’ equity. Foreign currency denominated share capital and related share premium and reserve accounts are recorded at the historical exchange rate at the time the shares were issued or the equity created.
2.2.12 Revenue recognition
Revenue comprises the fair value of the consideration received or receivable for the sale of services in the ordinary course of the group’s activities. Revenue is shown net of discounts, value‐added tax, other sales related taxes, and after the elimination of sales within the group. Revenue comprises project developer fees, electrical manufacturing and installations, electrical servicing and maintenance and generator sales.
Revenue associated with longer term projects is recognised on a percentage completion basis. Revenue for smaller jobs and projects is recognised upon completion.
IFRS 15 is mandatory for adoption from accounting periods beginning on or after 1 January 2017. However, the group has elected to adopt the standard early, with effect from date of incorporation.
The group has a number of different revenue streams and the key components in determining the correct recognition are as follows:
BTO revenue, which is revenue generated from development services relating to the building and construction of solar projects, is recognised on a percentage completion basis as the value is accrued by the end user over the life of the contract. The periodic recognition is calculated through weekly project progress reports.
Aevitas revenue is recognised when jobs are completed. On longer term projects revenue is recognised on a percentage completion basis. The projects have defined milestones which determines the timing of the billing to the customers. The achievement of the milestones then also provides an accurate indication of how much of the project is complete.
2.2.13 Segment reporting
The group determines and presents operating segments based on the information that is provided internally to the Board of Directors, which is the group’s chief operating decision maker. The group considers that it has three reportable segments, USA, UK and Australasia. The secondary segment is based upon product groups and the split is between Aevitas and the core VivoPower business. An operating segment is a component of the group that engages in business activities from which it may earn revenues and incur expenses, including any revenues and expenses that relate to the transactions with any of the group’s other components. Operating segments results are reviewed regularly by the Board of Directors to assess its performance and make decisions about resources to be allocated to the segment, and for which discrete financial information is available. Segment results that are reported to the Board of Directors include items directly attributable to a segment as well as those that can be allocated to a segment on a reasonable basis.
Notes to the Financial Statements (continued) for the period ended 31 March 2017
Page | 54
2.2.14 Employee benefits
Pension The employer pension contributions are associated with defined contribution schemes. The costs are therefore recognised in the month in which the contribution is incurred, which is consistent with recognition of payroll expenses.
Short‐term benefits Short‐term employee benefit obligations are measured on an undiscounted basis and are expensed as the related service is provided. A liability is recognised for the amount expected to be paid under short‐term cash bonus or profit‐sharing plans if the group has a present legal or constructive obligation to pay this amount because of past service provided by the employee and the obligation can be reliably measured.
Short‐term compensated absences A liability for short‐term compensated absences, such as holiday, is recognised for the amount the group may be required to pay because of the unused entitlement that has accumulated at the end of the reporting period.
2.2.15 New standards, amendments and interpretations not yet adopted
The IASB and IFRIC have issued the following standards and with an effective date after the date of the financial statements and have not been applied in preparing these consolidated financial statements.
IFRS 15 – “Revenue from Contracts with Customers” ‐ early adoption As this is the first period of financial reporting for the group, management took the decision to adopt IFRS 15 early as it represented a major development in the recognition of revenue under International Financial Reporting Standards.
Compared to IAS 18, Revenue and IAS 11, Construction Contracts and related interpretations, there was no material difference adopting IFRS 15 early.
The standard is effective for annual periods beginning on or after 1 January 2017, however, the group took advantage of early application.
IFRS 16 Leases IFRS 16 specifies how a company will recognise, measure, present and disclose leases. The standard provides a single lessee accounting model, requiring lessees to recognise assets and liabilities for all leases unless the lease term is 12 months or less or the underlying asset has a low value. Lessors continue to classify leases as operating or finance, with IFRS 16’s approach to lessor accounting substantially unchanged from its predecessor, IAS 17. IFRS 16 will be applicable to annual reporting periods beginning on or after 1 January 2019.
Recognition of Deferred Tax Assets for Unrealised Losses (Amendments to IAS 12) Amends IAS12 Income Taxes, which is effective for annual periods beginning on or after 1 January 2017 to clarify the following aspects: Unrealised losses on debt instruments measured at fair value and measured at cost for tax purposes give rise to a deductible temporary difference regardless of whether the debt instrument's holder expects to recover the carrying amount of the debt instrument by sale or by use. The carrying amount of an asset does not limit the estimation of probable future taxable profits.
Notes to the Financial Statements (continued) for the period ended 31 March 2017
Page | 55
Estimates for future taxable profits exclude tax deductions resulting from the reversal of deductible temporary differences. An entity assesses a deferred tax asset in combination with other deferred tax assets. Where tax law restricts the utilisation of tax losses, an entity would assess a deferred tax asset in combination with other deferred tax assets of the same type. There are no other IFRS or IFRIC interpretations that are not yet effective that would be expected to have a material impact on the Group.
3. Critical accounting judgements and estimates
In preparing the consolidated financial statements, the directors are required to make judgements in applying the group’s accounting policies and in making estimates and making assumptions about the future. These estimates could have a significant risk of causing a material adjustment to the carrying value of assets and liabilities in the future financial periods. The critical judgements that have been made in arriving at the amounts recognised in the consolidated financial statements are discussed below.
Critical accounting judgements:
3.1 IFRS 10 – Consolidated Financial Statements
The objective of the standard is to establish principles for the presentation and preparation of consolidated financial statements when an entity controls one or more other entities. The group has assessed whether it controls project companies in which the group has an interest.
The group assessed control by reviewing, first, whether the group had power over the entity, secondly, had exposure, or rights, to variable returns from its involvement with the project, and finally, whether it had the ability to use its power over the investee to affect the amount of the project’s returns.
On assessing the three criteria, all of which must exist, the group concluded that it did not in fact have control and elected not to consolidate the project companies into the consolidated financial statements of the group.
3.2 Transaction related costs
The transaction related costs were incurred by the business in preparation for the entry onto Nasdaq. The costs incurred were recharged costs from Arowana International Limited including legal, accounting and professional fees in relation to our operations in the United States. The costs by nature are one‐off, and therefore, have no bearing on the financial performance of the business. To enable comparability in future periods the costs are disclosed separately on the face on the Statement of Comprehensive Income.
Critical estimates:
3.3 Income taxes
In recognising income tax assets and liabilities, management makes estimates of the likely outcome of decisions by tax authorities on transactions and events whose treatment for tax purposes is uncertain. Where the outcome of such matters is different, or expected to be different, from previous assessments made by management, a change to the carrying value of the income tax assets and liabilities will be recorded in the period in which such determination is made. The carrying values of income tax assets and liabilities are disclosed separately in the consolidated Statement of Financial Position.
Notes to the Financial Statements (continued) for the period ended 31 March 2017
Page | 56
3.4 Share option reserve
As part of the Initial Public Offering Listing, VivoPower International issued an amended and restated unit purchase option (UPO) replacing the options issued by Arowana Inc. The options are viewed as a share‐based award granted to Early Bird Capital. The cost of the award is recognized directly in equity and is applied against capital raising costs. As the option holder has the right to receive shares in VivoPower international PLC the share‐based payment transaction would be equity settled. The fair value of the options were determined at the grant date, using the Black Scholes Model, and not remeasured subsequently. As the options have no vesting conditions the related expense are recognized immediately.
3.5 Convertible preference shares and loan notes
As part of the IPO listing process VivoPower International PLC acquired the Aevitas Group. The instruments previously issued by Aevitas were restructured to become convertible into VivoPower International PLC shares. The company considered IAS 32 paragraph 16 in determining the accounting treatment. The Company has determined the instruments to be treated as equity under the “fixed‐for‐fixed” rule meaning that both the amount of consideration received/receivable and the number of equity instruments to be issued must be fixed for the instrument to be classified as equity. Both elements are satisfied within the instruments.
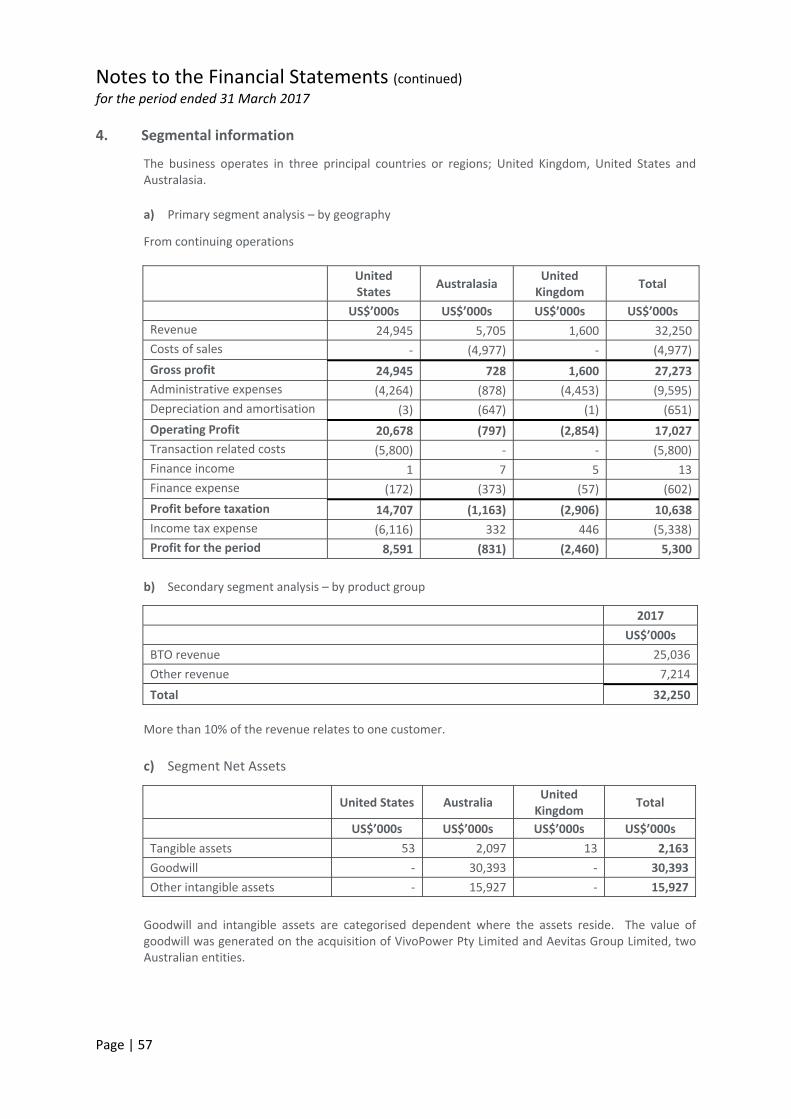
Notes to the Financial Statements (continued) for the period ended 31 March 2017
Page | 57
4. Segmental information
The business operates in three principal countries or regions; United Kingdom, United States and Australasia.
a) Primary segment analysis – by geography
From continuing operations
United States
Australasia United Kingdom
Total
US$’000s US$’000s US$’000s US$’000s
Revenue 24,945 5,705 1,600 32,250
Costs of sales ‐ (4,977) ‐ (4,977)
Gross profit 24,945 728 1,600 27,273
Administrative expenses (4,264) (878) (4,453) (9,595)
Depreciation and amortisation (3) (647) (1) (651)
Operating Profit 20,678 (797) (2,854) 17,027
Transaction related costs (5,800) ‐ ‐ (5,800)
Finance income 1 7 5 13
Finance expense (172) (373) (57) (602)
Profit before taxation 14,707 (1,163) (2,906) 10,638
Income tax expense (6,116) 332 446 (5,338)
Profit for the period 8,591 (831) (2,460) 5,300
b) Secondary segment analysis – by product group
2017
US$’000s
BTO revenue 25,036
Other revenue 7,214
Total 32,250
More than 10% of the revenue relates to one customer.
c) Segment Net Assets
United States Australia United Kingdom
Total
US$’000s US$’000s US$’000s US$’000s
Tangible assets 53 2,097 13 2,163
Goodwill ‐ 30,393 ‐ 30,393
Other intangible assets ‐ 15,927 ‐ 15,927
Goodwill and intangible assets are categorised dependent where the assets reside. The value of goodwill was generated on the acquisition of VivoPower Pty Limited and Aevitas Group Limited, two Australian entities.
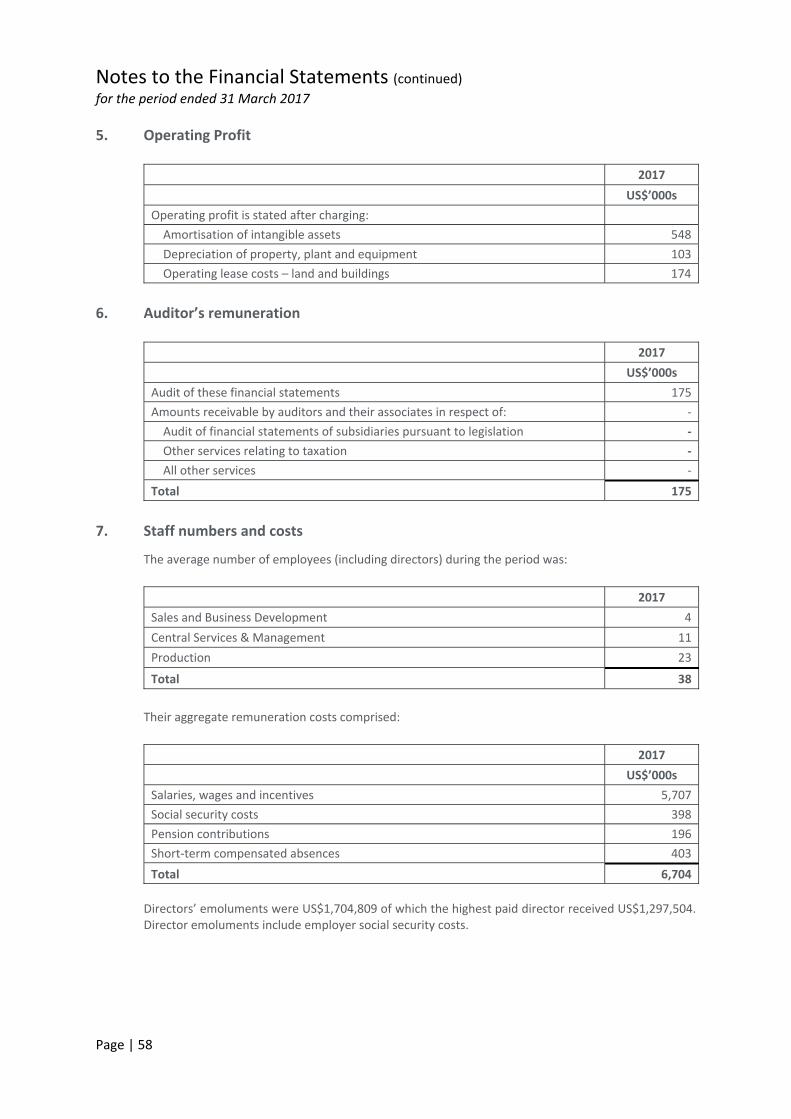
Notes to the Financial Statements (continued) for the period ended 31 March 2017
Page | 58
5. Operating Profit
2017
US$’000s
Operating profit is stated after charging:
Amortisation of intangible assets 548
Depreciation of property, plant and equipment 103
Operating lease costs – land and buildings 174
6. Auditor’s remuneration
2017
US$’000s
Audit of these financial statements 175
Amounts receivable by auditors and their associates in respect of: ‐
Audit of financial statements of subsidiaries pursuant to legislation ‐
Other services relating to taxation ‐
All other services ‐
Total 175
7. Staff numbers and costs
The average number of employees (including directors) during the period was:
2017
Sales and Business Development 4
Central Services & Management 11
Production 23
Total 38
Their aggregate remuneration costs comprised:
2017
US$’000s
Salaries, wages and incentives 5,707
Social security costs 398
Pension contributions 196
Short‐term compensated absences 403
Total 6,704
Directors’ emoluments were US$1,704,809 of which the highest paid director received US$1,297,504. Director emoluments include employer social security costs.
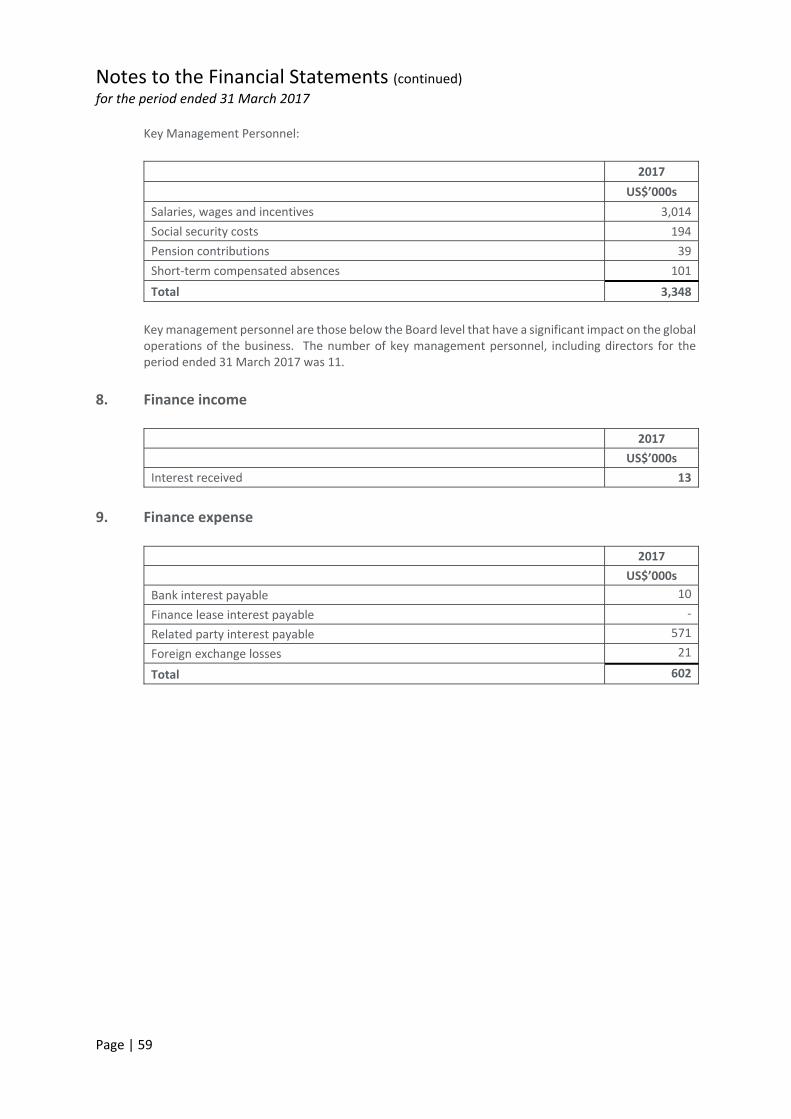
Notes to the Financial Statements (continued) for the period ended 31 March 2017
Page | 59
Key Management Personnel:
2017
US$’000s
Salaries, wages and incentives 3,014
Social security costs 194
Pension contributions 39
Short‐term compensated absences 101
Total 3,348
Key management personnel are those below the Board level that have a significant impact on the global operations of the business. The number of key management personnel, including directors for the period ended 31 March 2017 was 11.
8. Finance income
2017
US$’000s
Interest received 13
9. Finance expense
2017
US$’000s
Bank interest payable 10
Finance lease interest payable ‐
Related party interest payable 571
Foreign exchange losses 21
Total 602
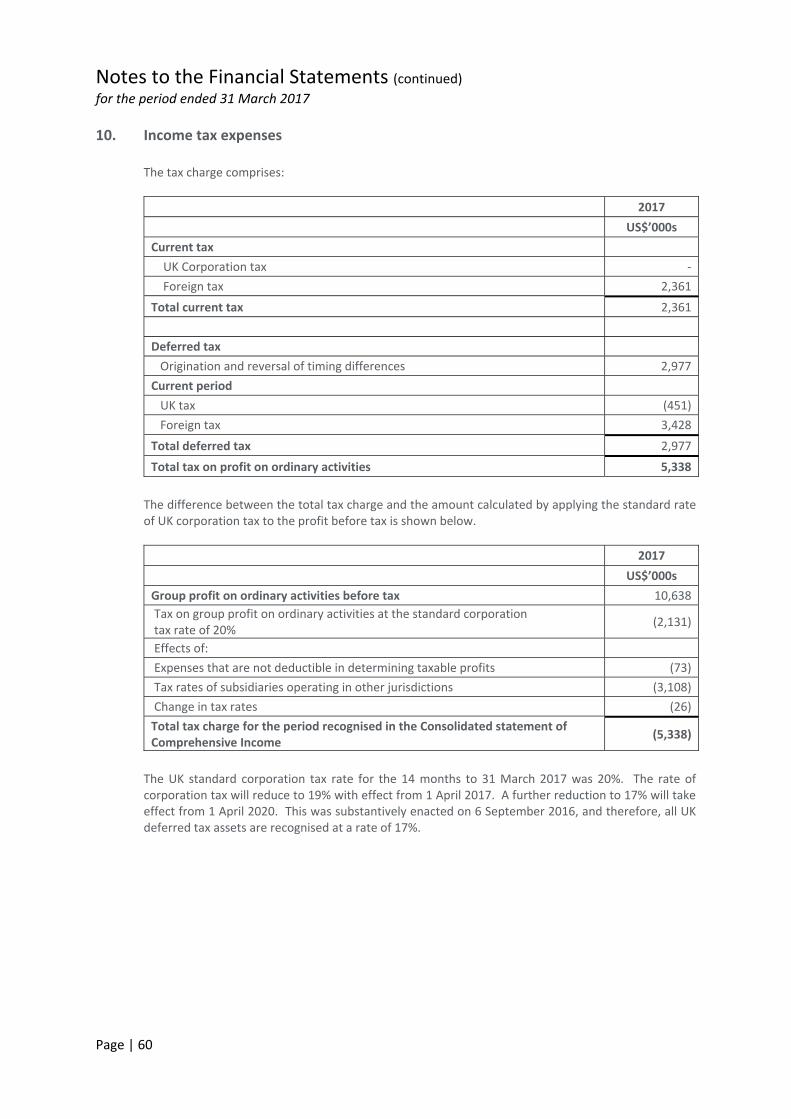
Notes to the Financial Statements (continued) for the period ended 31 March 2017
Page | 60
10. Income tax expenses
The tax charge comprises:
2017
US$’000s
Current tax
UK Corporation tax ‐
Foreign tax 2,361
Total current tax 2,361
Deferred tax
Origination and reversal of timing differences 2,977
Current period
UK tax (451)
Foreign tax 3,428
Total deferred tax 2,977
Total tax on profit on ordinary activities 5,338
The difference between the total tax charge and the amount calculated by applying the standard rate of UK corporation tax to the profit before tax is shown below.
2017
US$’000s
Group profit on ordinary activities before tax 10,638
Tax on group profit on ordinary activities at the standard corporation tax rate of 20%
(2,131)
Effects of:
Expenses that are not deductible in determining taxable profits (73)
Tax rates of subsidiaries operating in other jurisdictions (3,108)
Change in tax rates (26)
Total tax charge for the period recognised in the Consolidated statement of Comprehensive Income
(5,338)
The UK standard corporation tax rate for the 14 months to 31 March 2017 was 20%. The rate of corporation tax will reduce to 19% with effect from 1 April 2017. A further reduction to 17% will take effect from 1 April 2020. This was substantively enacted on 6 September 2016, and therefore, all UK deferred tax assets are recognised at a rate of 17%.
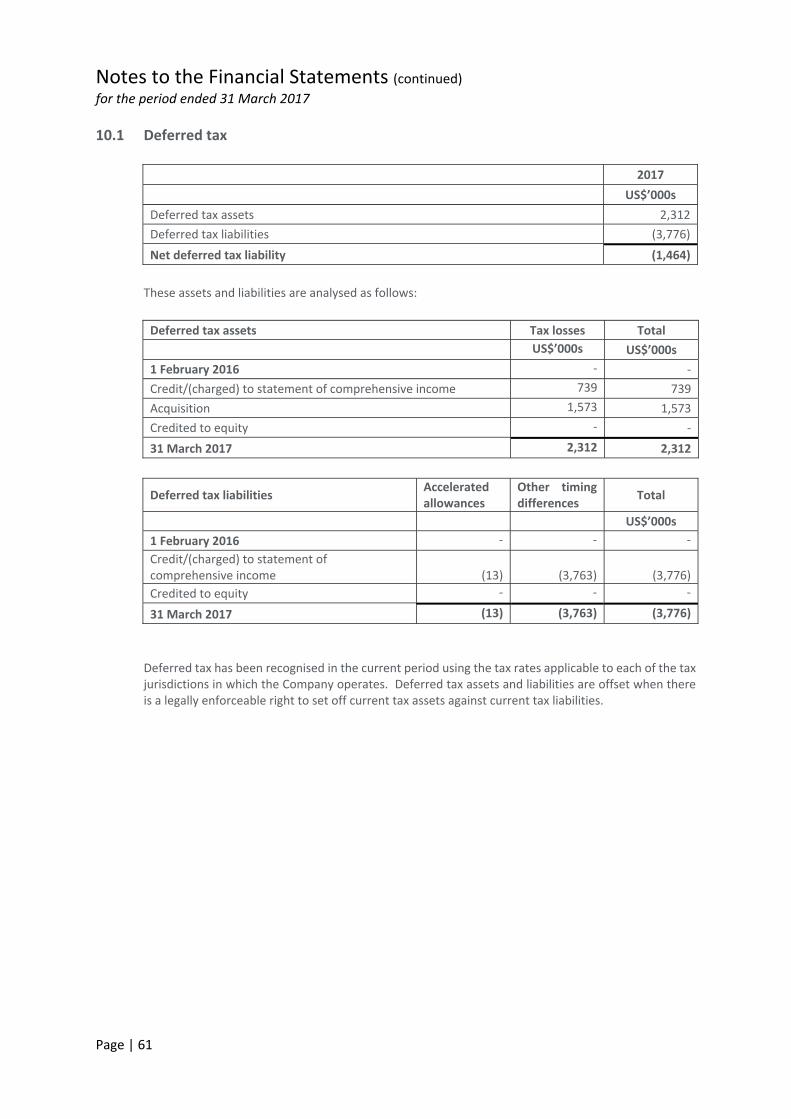
Notes to the Financial Statements (continued) for the period ended 31 March 2017
Page | 61
10.1 Deferred tax
2017
US$’000s
Deferred tax assets 2,312
Deferred tax liabilities (3,776)
Net deferred tax liability (1,464)
These assets and liabilities are analysed as follows:
Deferred tax assets Tax losses Total
US$’000s US$’000s
1 February 2016 ‐ ‐
Credit/(charged) to statement of comprehensive income 739 739
Acquisition 1,573 1,573
Credited to equity ‐ ‐
31 March 2017 2,312 2,312
Deferred tax liabilities Accelerated allowances
Other timing differences
Total
US$’000s
1 February 2016 ‐ ‐ ‐
Credit/(charged) to statement of comprehensive income
(13)
(3,763)
(3,776)
Credited to equity ‐ ‐ ‐
31 March 2017 (13) (3,763) (3,776)
Deferred tax has been recognised in the current period using the tax rates applicable to each of the tax jurisdictions in which the Company operates. Deferred tax assets and liabilities are offset when there is a legally enforceable right to set off current tax assets against current tax liabilities.
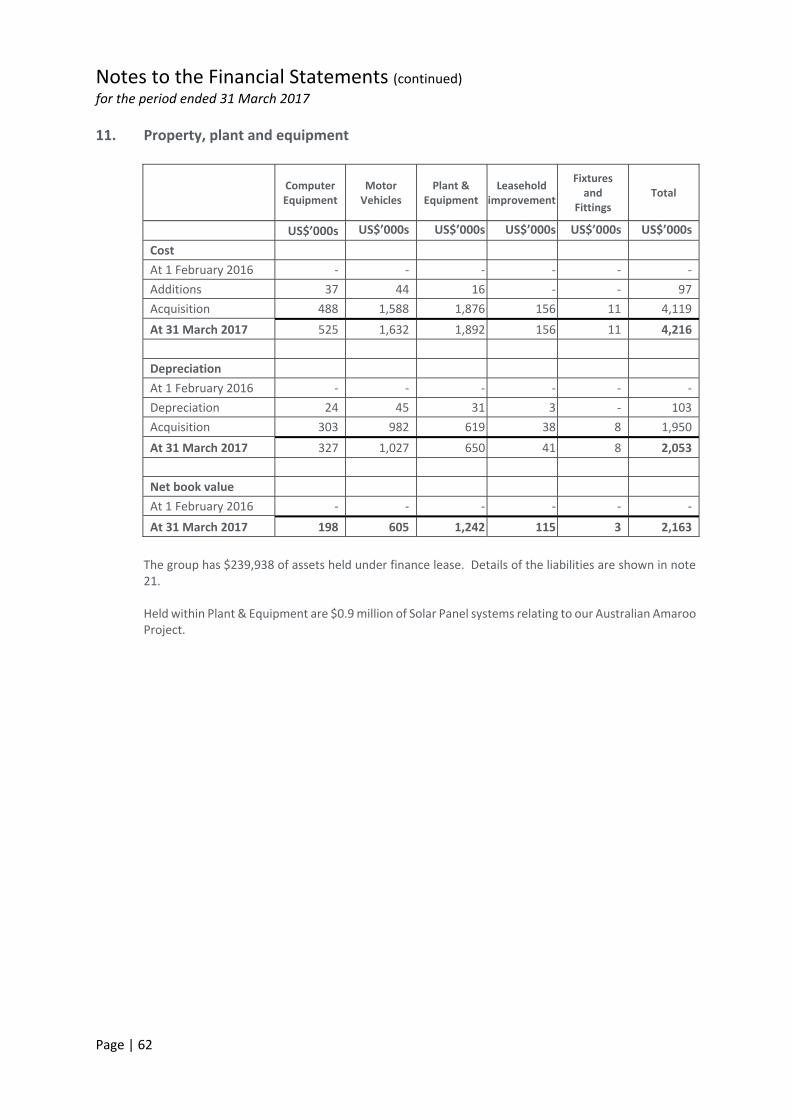
Notes to the Financial Statements (continued) for the period ended 31 March 2017
Page | 62
11. Property, plant and equipment
Computer Equipment
Motor Vehicles
Plant & Equipment
Leasehold improvement
Fixtures and
Fittings Total
US$’000s US$’000s US$’000s US$’000s US$’000s US$’000s
Cost
At 1 February 2016 ‐ ‐ ‐ ‐ ‐ ‐
Additions 37 44 16 ‐ ‐ 97
Acquisition 488 1,588 1,876 156 11 4,119
At 31 March 2017 525 1,632 1,892 156 11 4,216
Depreciation
At 1 February 2016 ‐ ‐ ‐ ‐ ‐ ‐
Depreciation 24 45 31 3 ‐ 103
Acquisition 303 982 619 38 8 1,950
At 31 March 2017 327 1,027 650 41 8 2,053
Net book value
At 1 February 2016 ‐ ‐ ‐ ‐ ‐ ‐
At 31 March 2017 198 605 1,242 115 3 2,163
The group has $239,938 of assets held under finance lease. Details of the liabilities are shown in note 21.
Held within Plant & Equipment are $0.9 million of Solar Panel systems relating to our Australian Amaroo Project.
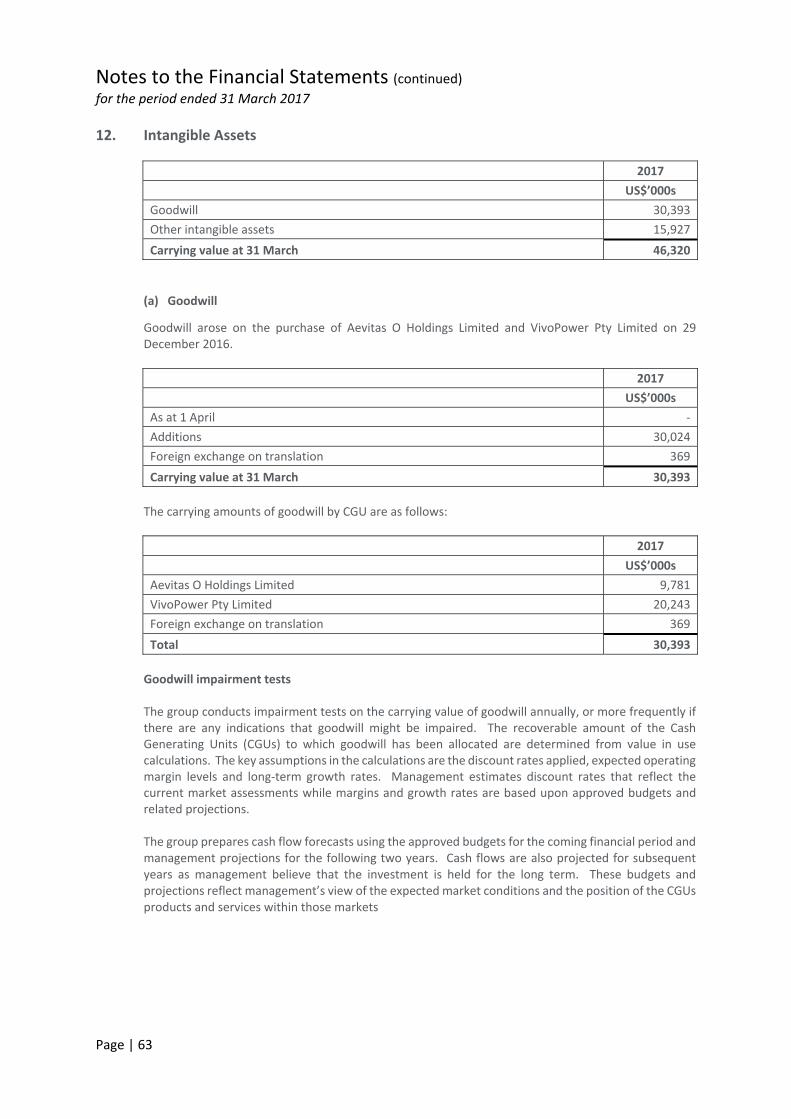
Notes to the Financial Statements (continued) for the period ended 31 March 2017
Page | 63
12. Intangible Assets
2017
US$’000s
Goodwill 30,393
Other intangible assets 15,927
Carrying value at 31 March 46,320
(a) Goodwill
Goodwill arose on the purchase of Aevitas O Holdings Limited and VivoPower Pty Limited on 29 December 2016.
2017
US$’000s
As at 1 April ‐
Additions 30,024
Foreign exchange on translation 369
Carrying value at 31 March 30,393
The carrying amounts of goodwill by CGU are as follows:
2017
US$’000s
Aevitas O Holdings Limited 9,781
VivoPower Pty Limited 20,243
Foreign exchange on translation 369
Total 30,393
Goodwill impairment tests The group conducts impairment tests on the carrying value of goodwill annually, or more frequently if there are any indications that goodwill might be impaired. The recoverable amount of the Cash Generating Units (CGUs) to which goodwill has been allocated are determined from value in use calculations. The key assumptions in the calculations are the discount rates applied, expected operating margin levels and long‐term growth rates. Management estimates discount rates that reflect the current market assessments while margins and growth rates are based upon approved budgets and related projections. The group prepares cash flow forecasts using the approved budgets for the coming financial period and management projections for the following two years. Cash flows are also projected for subsequent years as management believe that the investment is held for the long term. These budgets and projections reflect management’s view of the expected market conditions and the position of the CGUs products and services within those markets
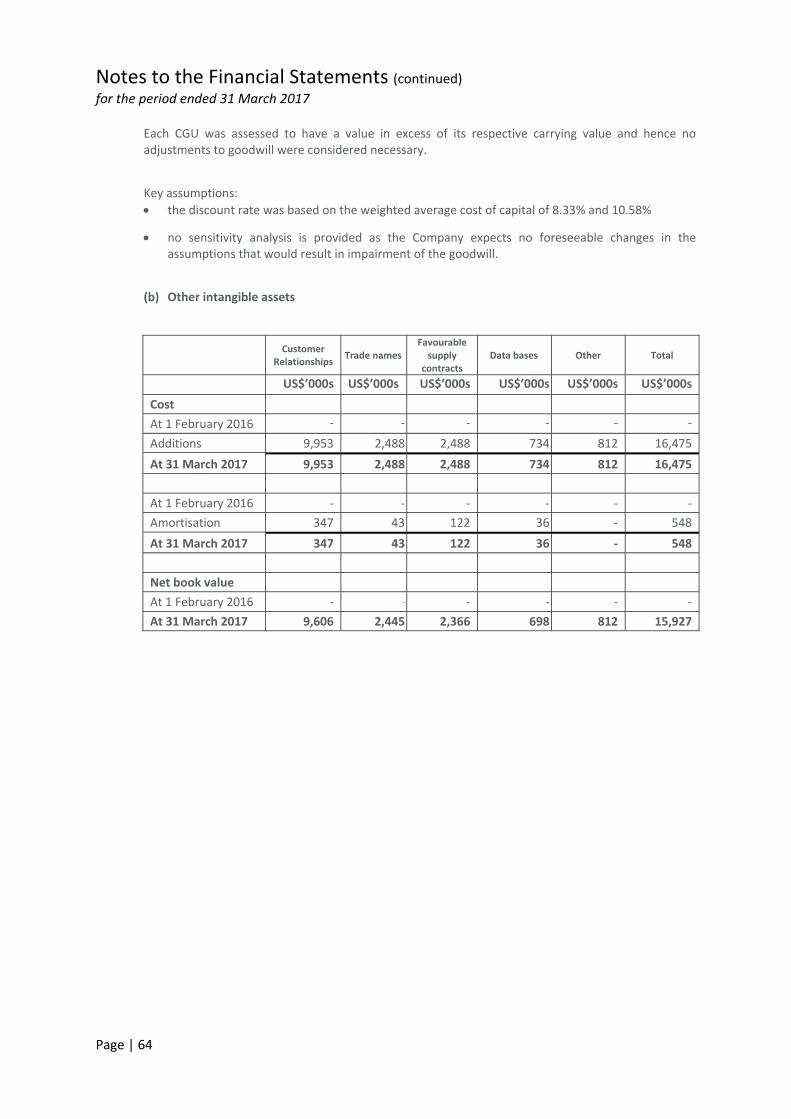
Notes to the Financial Statements (continued) for the period ended 31 March 2017
Page | 64
Each CGU was assessed to have a value in excess of its respective carrying value and hence no adjustments to goodwill were considered necessary.
Key assumptions:
the discount rate was based on the weighted average cost of capital of 8.33% and 10.58%
no sensitivity analysis is provided as the Company expects no foreseeable changes in the assumptions that would result in impairment of the goodwill.
(b) Other intangible assets
Customer Relationships
Trade names Favourable supply
contracts Data bases Other Total
US$’000s US$’000s US$’000s US$’000s US$’000s US$’000s
Cost
At 1 February 2016 ‐ ‐ ‐ ‐ ‐ ‐
Additions 9,953 2,488 2,488 734 812 16,475
At 31 March 2017 9,953 2,488 2,488 734 812 16,475
At 1 February 2016 ‐ ‐ ‐ ‐ ‐ ‐
Amortisation 347 43 122 36 ‐ 548
At 31 March 2017 347 43 122 36 ‐ 548
Net book value
At 1 February 2016 ‐ ‐ ‐ ‐ ‐ ‐
At 31 March 2017 9,606 2,445 2,366 698 812 15,927
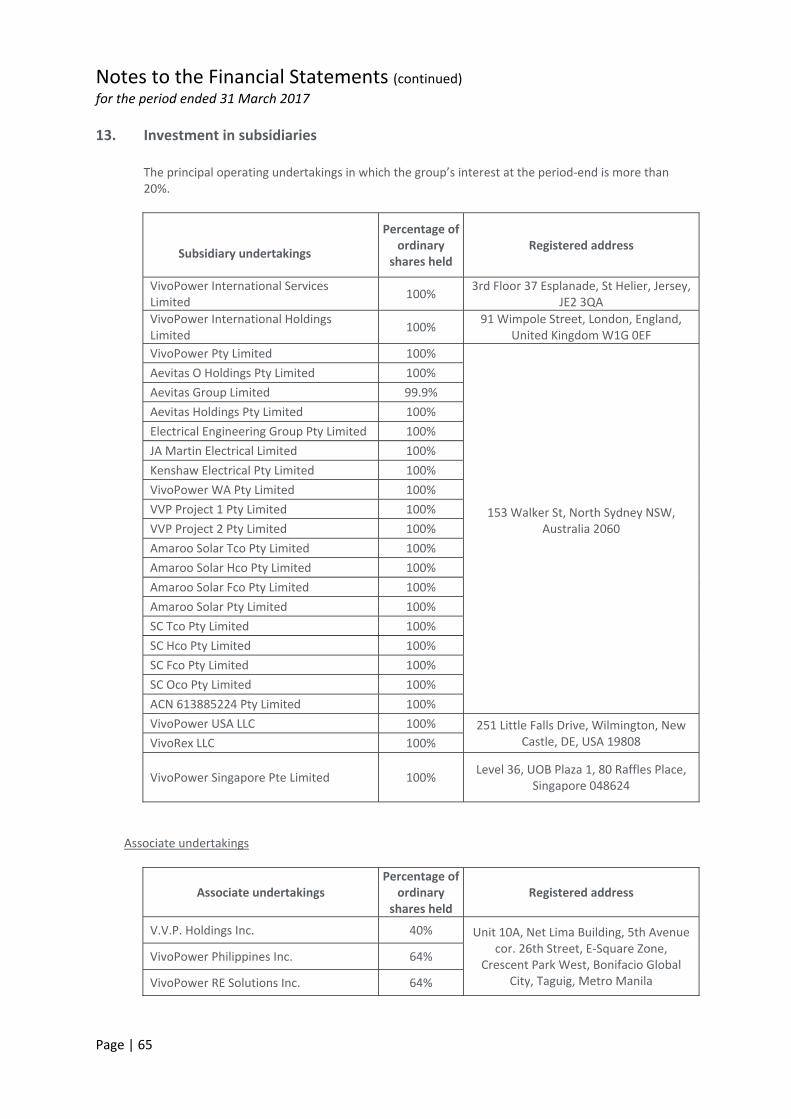
Notes to the Financial Statements (continued) for the period ended 31 March 2017
Page | 65
13. Investment in subsidiaries
The principal operating undertakings in which the group’s interest at the period‐end is more than 20%.
Subsidiary undertakings
Percentage of ordinary
shares held Registered address
VivoPower International Services Limited
100% 3rd Floor 37 Esplanade, St Helier, Jersey,
JE2 3QA
VivoPower International Holdings Limited
100% 91 Wimpole Street, London, England,
United Kingdom W1G 0EF
VivoPower Pty Limited 100%
153 Walker St, North Sydney NSW, Australia 2060
Aevitas O Holdings Pty Limited 100%
Aevitas Group Limited 99.9%
Aevitas Holdings Pty Limited 100%
Electrical Engineering Group Pty Limited 100%
JA Martin Electrical Limited 100%
Kenshaw Electrical Pty Limited 100%
VivoPower WA Pty Limited 100%
VVP Project 1 Pty Limited 100%
VVP Project 2 Pty Limited 100%
Amaroo Solar Tco Pty Limited 100%
Amaroo Solar Hco Pty Limited 100%
Amaroo Solar Fco Pty Limited 100%
Amaroo Solar Pty Limited 100%
SC Tco Pty Limited 100%
SC Hco Pty Limited 100%
SC Fco Pty Limited 100%
SC Oco Pty Limited 100%
ACN 613885224 Pty Limited 100%
VivoPower USA LLC 100% 251 Little Falls Drive, Wilmington, New Castle, DE, USA 19808 VivoRex LLC 100%
VivoPower Singapore Pte Limited
100% Level 36, UOB Plaza 1, 80 Raffles Place,
Singapore 048624
Associate undertakings
Associate undertakings Percentage of
ordinary shares held
Registered address
V.V.P. Holdings Inc. 40% Unit 10A, Net Lima Building, 5th Avenue cor. 26th Street, E‐Square Zone,
Crescent Park West, Bonifacio Global City, Taguig, Metro Manila
VivoPower Philippines Inc. 64%
VivoPower RE Solutions Inc. 64%
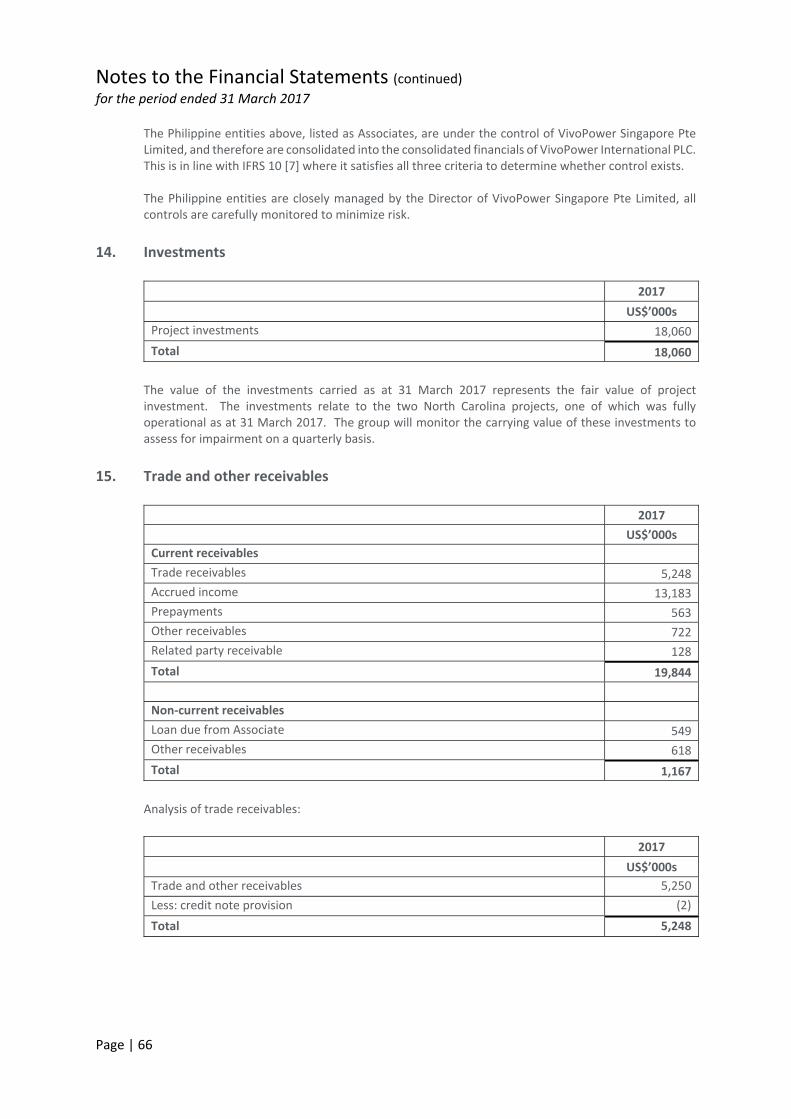
Notes to the Financial Statements (continued) for the period ended 31 March 2017
Page | 66
The Philippine entities above, listed as Associates, are under the control of VivoPower Singapore Pte Limited, and therefore are consolidated into the consolidated financials of VivoPower International PLC. This is in line with IFRS 10 [7] where it satisfies all three criteria to determine whether control exists.
The Philippine entities are closely managed by the Director of VivoPower Singapore Pte Limited, all controls are carefully monitored to minimize risk.
14. Investments
2017
US$’000s
Project investments 18,060
Total 18,060
The value of the investments carried as at 31 March 2017 represents the fair value of project investment. The investments relate to the two North Carolina projects, one of which was fully operational as at 31 March 2017. The group will monitor the carrying value of these investments to assess for impairment on a quarterly basis.
15. Trade and other receivables
2017
US$’000s
Current receivables
Trade receivables 5,248
Accrued income 13,183
Prepayments 563
Other receivables 722
Related party receivable 128
Total 19,844
Non‐current receivables
Loan due from Associate 549
Other receivables 618
Total 1,167
Analysis of trade receivables:
2017
US$’000s
Trade and other receivables 5,250
Less: credit note provision (2)
Total 5,248
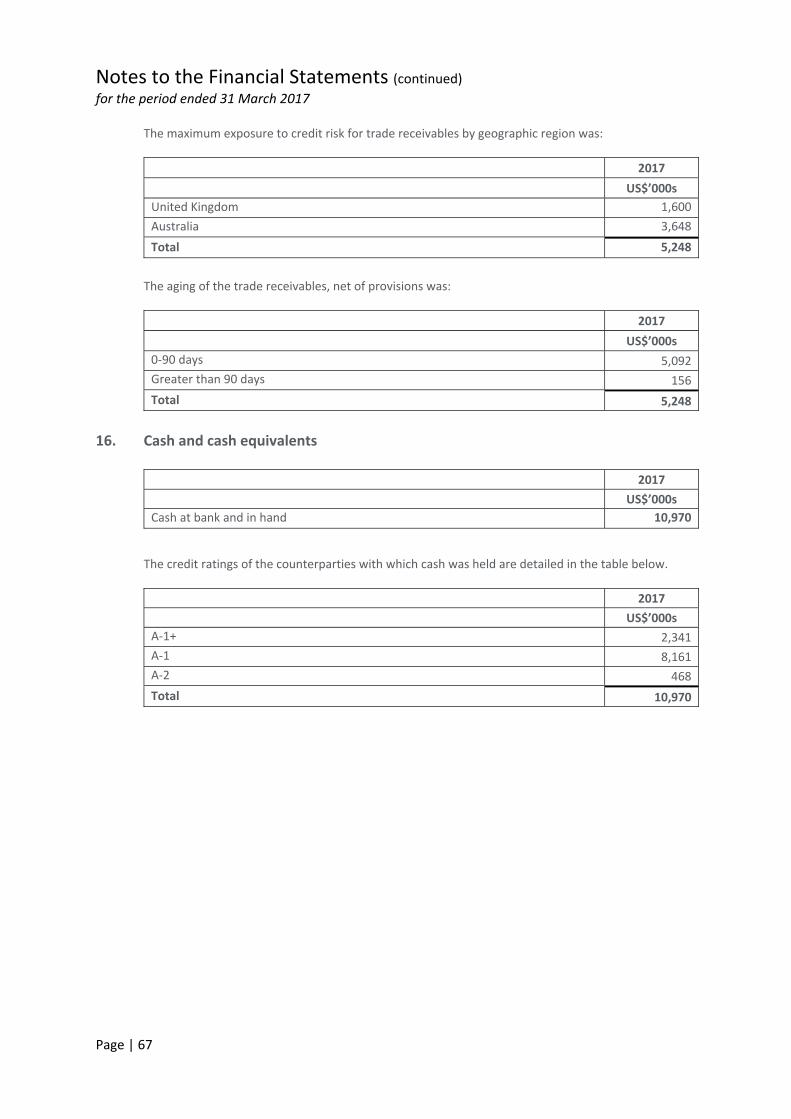
Notes to the Financial Statements (continued) for the period ended 31 March 2017
Page | 67
The maximum exposure to credit risk for trade receivables by geographic region was:
2017
US$’000s
United Kingdom 1,600
Australia 3,648
Total 5,248
The aging of the trade receivables, net of provisions was:
2017
US$’000s
0‐90 days 5,092
Greater than 90 days 156
Total 5,248
16. Cash and cash equivalents
2017
US$’000s
Cash at bank and in hand 10,970
The credit ratings of the counterparties with which cash was held are detailed in the table below.
2017
US$’000s
A‐1+ 2,341
A‐1 8,161
A‐2 468
Total 10,970
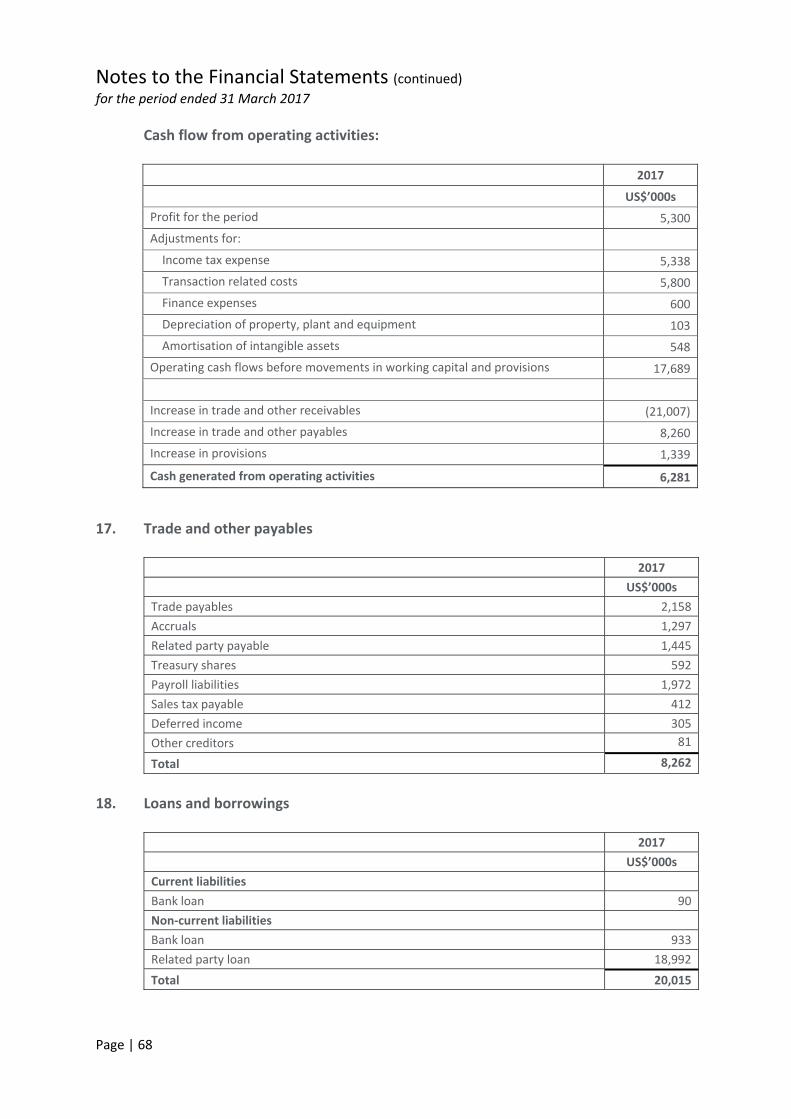
Notes to the Financial Statements (continued) for the period ended 31 March 2017
Page | 68
Cash flow from operating activities:
2017
US$’000s Profit for the period 5,300
Adjustments for:
Income tax expense 5,338
Transaction related costs 5,800
Finance expenses 600
Depreciation of property, plant and equipment 103
Amortisation of intangible assets 548
Operating cash flows before movements in working capital and provisions 17,689
Increase in trade and other receivables (21,007)
Increase in trade and other payables 8,260
Increase in provisions 1,339
Cash generated from operating activities 6,281
17. Trade and other payables
2017
US$’000s
Trade payables 2,158
Accruals 1,297
Related party payable 1,445
Treasury shares 592
Payroll liabilities 1,972
Sales tax payable 412
Deferred income 305
Other creditors 81
Total 8,262
18. Loans and borrowings
2017
US$’000s
Current liabilities
Bank loan 90
Non‐current liabilities
Bank loan 933
Related party loan 18,992
Total 20,015
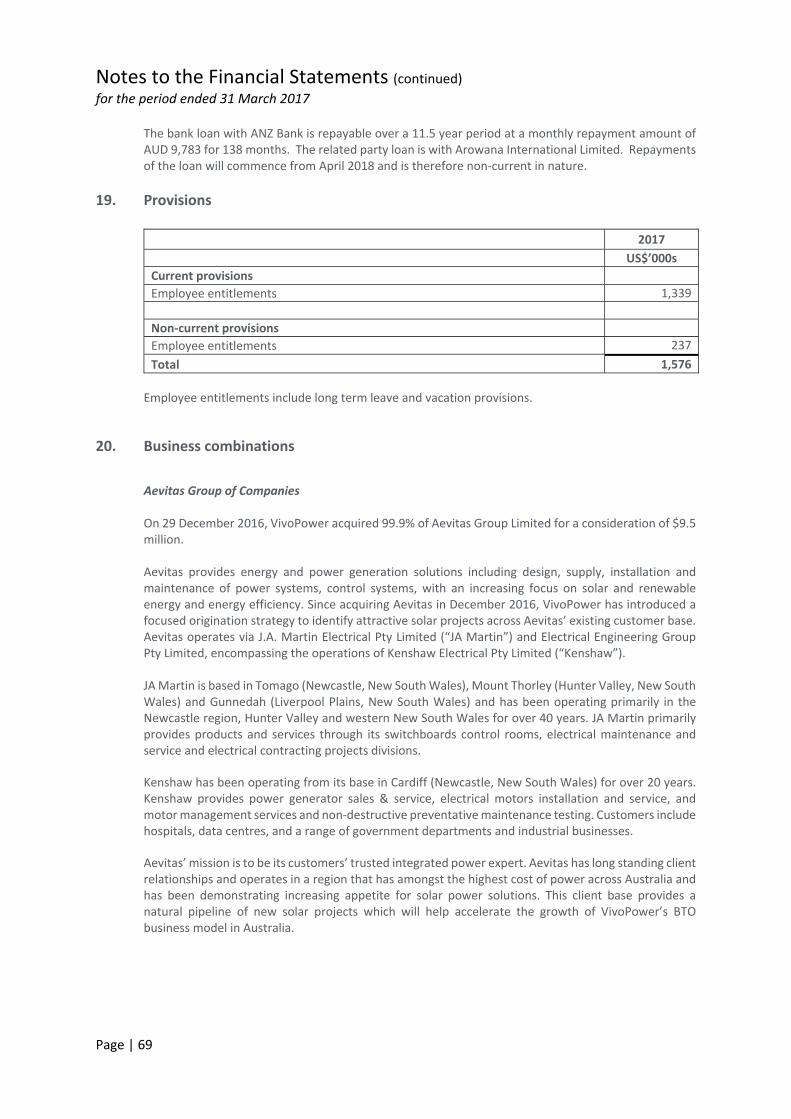
Notes to the Financial Statements (continued) for the period ended 31 March 2017
Page | 69
The bank loan with ANZ Bank is repayable over a 11.5 year period at a monthly repayment amount of AUD 9,783 for 138 months. The related party loan is with Arowana International Limited. Repayments of the loan will commence from April 2018 and is therefore non‐current in nature.
19. Provisions
2017
US$’000s
Current provisions
Employee entitlements 1,339
Non‐current provisions
Employee entitlements 237
Total 1,576
Employee entitlements include long term leave and vacation provisions.
20. Business combinations
Aevitas Group of Companies
On 29 December 2016, VivoPower acquired 99.9% of Aevitas Group Limited for a consideration of $9.5 million. Aevitas provides energy and power generation solutions including design, supply, installation and maintenance of power systems, control systems, with an increasing focus on solar and renewable energy and energy efficiency. Since acquiring Aevitas in December 2016, VivoPower has introduced a focused origination strategy to identify attractive solar projects across Aevitas’ existing customer base. Aevitas operates via J.A. Martin Electrical Pty Limited (“JA Martin”) and Electrical Engineering Group Pty Limited, encompassing the operations of Kenshaw Electrical Pty Limited (“Kenshaw”). JA Martin is based in Tomago (Newcastle, New South Wales), Mount Thorley (Hunter Valley, New South Wales) and Gunnedah (Liverpool Plains, New South Wales) and has been operating primarily in the Newcastle region, Hunter Valley and western New South Wales for over 40 years. JA Martin primarily provides products and services through its switchboards control rooms, electrical maintenance and service and electrical contracting projects divisions.
Kenshaw has been operating from its base in Cardiff (Newcastle, New South Wales) for over 20 years. Kenshaw provides power generator sales & service, electrical motors installation and service, and motor management services and non‐destructive preventative maintenance testing. Customers include hospitals, data centres, and a range of government departments and industrial businesses.
Aevitas’ mission is to be its customers’ trusted integrated power expert. Aevitas has long standing client relationships and operates in a region that has amongst the highest cost of power across Australia and has been demonstrating increasing appetite for solar power solutions. This client base provides a natural pipeline of new solar projects which will help accelerate the growth of VivoPower’s BTO business model in Australia.
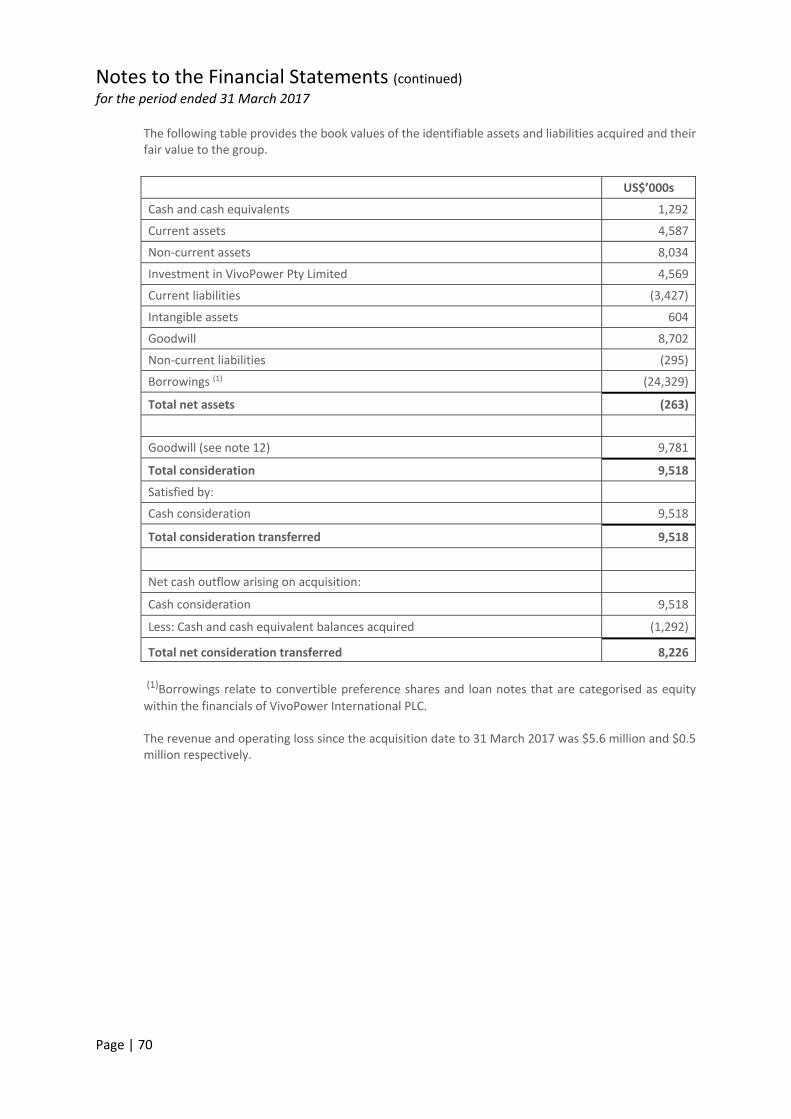
Notes to the Financial Statements (continued) for the period ended 31 March 2017
Page | 70
The following table provides the book values of the identifiable assets and liabilities acquired and their fair value to the group.
(1)Borrowings relate to convertible preference shares and loan notes that are categorised as equity
within the financials of VivoPower International PLC. The revenue and operating loss since the acquisition date to 31 March 2017 was $5.6 million and $0.5 million respectively.
US$’000s
Cash and cash equivalents 1,292
Current assets 4,587
Non‐current assets 8,034
Investment in VivoPower Pty Limited 4,569
Current liabilities (3,427)
Intangible assets 604
Goodwill 8,702
Non‐current liabilities (295)
Borrowings (1) (24,329)
Total net assets (263)
Goodwill (see note 12) 9,781
Total consideration 9,518
Satisfied by:
Cash consideration 9,518
Total consideration transferred 9,518
Net cash outflow arising on acquisition:
Cash consideration 9,518
Less: Cash and cash equivalent balances acquired (1,292)
Total net consideration transferred 8,226
Notes to the Financial Statements (continued) for the period ended 31 March 2017
Page | 71
VivoPower Pty Limited On 29 December 2016, VivoPower acquired 100% of VivoPower Pty Limited for a consideration of $23.1 million. VivoPower Australia is a next generation renewable energy company that is involved in the origination, financing,construction, transfer, operation and optimisation of solar electricity generation facilities globally. VivoPower Australia operates a BTO model involving thedesign, installation, transfer and maintenance of solar power plants through on site generation facilities and large scale grid feed projects. As of 31 March 2017, VivoPower Australia had 2 employees located at 2 offices.
The business is organized primarily into a single pillar, being the provision of solar services. Within this, there are two key target submarkets, the Commercial, Industrial and Government (CIG) sectors and Utility Scale projects.
The CIG sub market focuses on solar facilities which are situated behind‐the‐meter for CIG clients. VivoPower Australia constructs solar generation facilities on customer’s sites and feed energy directly to the client. In this fashion, VivoPower Australia disintermediates the wholesale electricity market, the electricity grid and the electricity retailer sharing in the savings with the client.
The Utility Scale sub market focuses on wholesale electricity generation through large or Utility Scale sized installations. These are generally situated on large tracts of land and are directly connected to the distribution (low voltage) or transmission (high voltage) grids. These large projects sell electricity directly to the spot market or to electricity retailers/traders. The revenue and operating loss since the acquisition date to 31 March 2017 was $0.1 million and ($0.2 million) respectively.
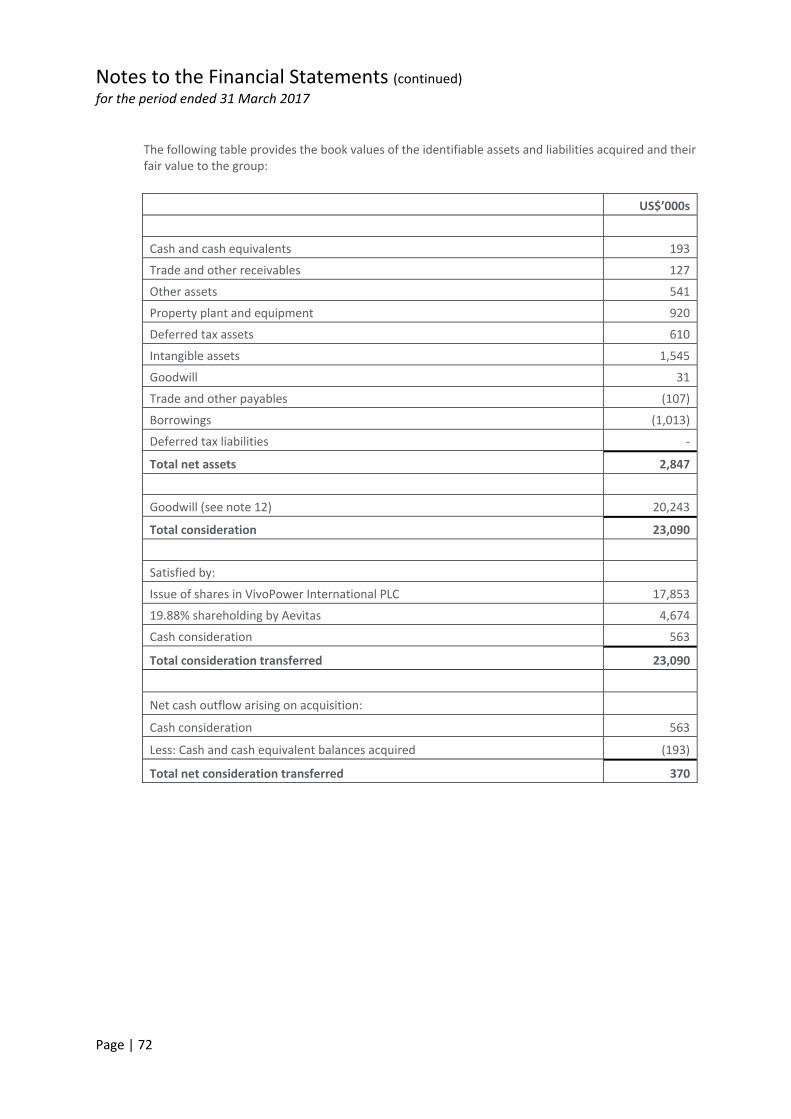
Notes to the Financial Statements (continued) for the period ended 31 March 2017
Page | 72
The following table provides the book values of the identifiable assets and liabilities acquired and their fair value to the group:
US$’000s
Cash and cash equivalents 193
Trade and other receivables 127
Other assets 541
Property plant and equipment 920
Deferred tax assets 610
Intangible assets 1,545
Goodwill 31
Trade and other payables (107)
Borrowings (1,013)
Deferred tax liabilities ‐
Total net assets 2,847
Goodwill (see note 12) 20,243
Total consideration 23,090
Satisfied by:
Issue of shares in VivoPower International PLC 17,853
19.88% shareholding by Aevitas 4,674
Cash consideration 563
Total consideration transferred 23,090
Net cash outflow arising on acquisition:
Cash consideration 563
Less: Cash and cash equivalent balances acquired (193)
Total net consideration transferred 370
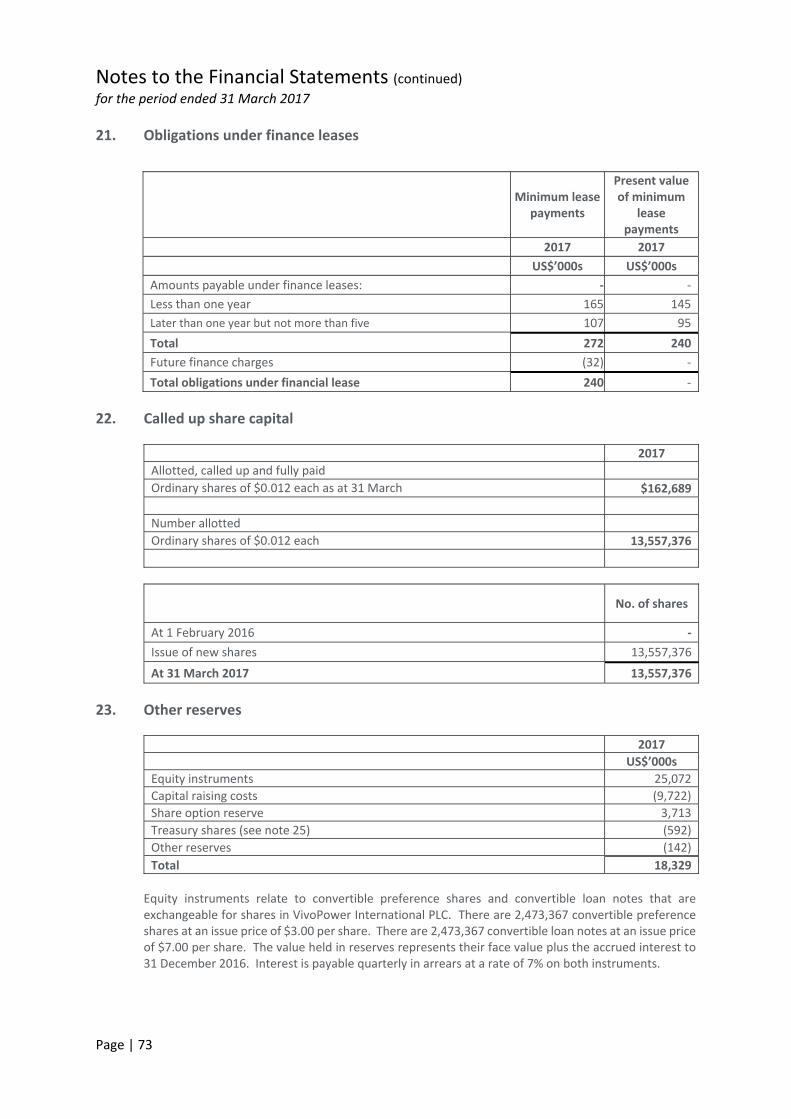
Notes to the Financial Statements (continued) for the period ended 31 March 2017
Page | 73
21. Obligations under finance leases
Minimum lease
payments
Present value of minimum
lease payments
2017 2017
US$’000s US$’000s
Amounts payable under finance leases: ‐ ‐
Less than one year 165 145
Later than one year but not more than five 107 95
Total 272 240
Future finance charges (32) ‐
Total obligations under financial lease 240 ‐
22. Called up share capital
2017
Allotted, called up and fully paid
Ordinary shares of $0.012 each as at 31 March $162,689
Number allotted
Ordinary shares of $0.012 each 13,557,376
No. of shares
At 1 February 2016 ‐
Issue of new shares 13,557,376
At 31 March 2017 13,557,376
23. Other reserves
2017
US$’000s
Equity instruments 25,072
Capital raising costs (9,722)
Share option reserve 3,713
Treasury shares (see note 25) (592)
Other reserves (142)
Total 18,329
Equity instruments relate to convertible preference shares and convertible loan notes that are exchangeable for shares in VivoPower International PLC. There are 2,473,367 convertible preference shares at an issue price of $3.00 per share. There are 2,473,367 convertible loan notes at an issue price of $7.00 per share. The value held in reserves represents their face value plus the accrued interest to 31 December 2016. Interest is payable quarterly in arrears at a rate of 7% on both instruments.
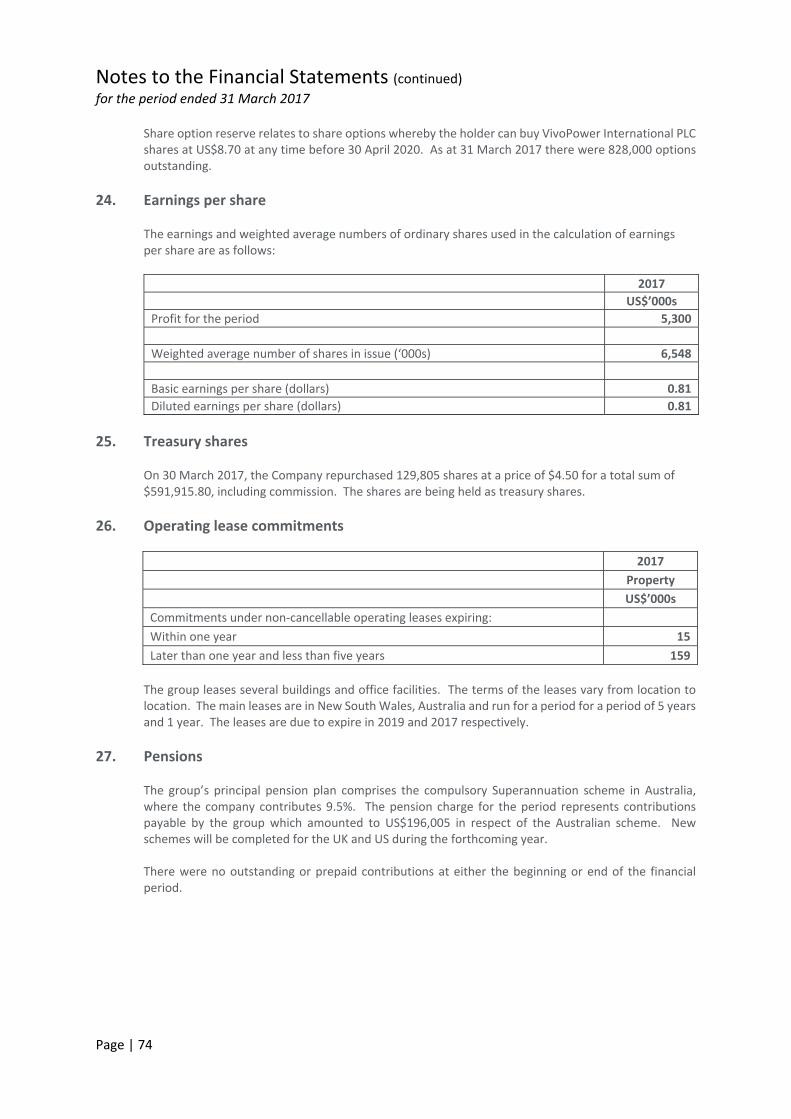
Notes to the Financial Statements (continued) for the period ended 31 March 2017
Page | 74
Share option reserve relates to share options whereby the holder can buy VivoPower International PLC shares at US$8.70 at any time before 30 April 2020. As at 31 March 2017 there were 828,000 options outstanding.
24. Earnings per share
The earnings and weighted average numbers of ordinary shares used in the calculation of earnings per share are as follows:
2017
US$’000s
Profit for the period 5,300
Weighted average number of shares in issue (‘000s) 6,548
Basic earnings per share (dollars) 0.81
Diluted earnings per share (dollars) 0.81
25. Treasury shares
On 30 March 2017, the Company repurchased 129,805 shares at a price of $4.50 for a total sum of $591,915.80, including commission. The shares are being held as treasury shares.
26. Operating lease commitments
2017
Property
US$’000s
Commitments under non‐cancellable operating leases expiring:
Within one year 15
Later than one year and less than five years 159
The group leases several buildings and office facilities. The terms of the leases vary from location to location. The main leases are in New South Wales, Australia and run for a period for a period of 5 years and 1 year. The leases are due to expire in 2019 and 2017 respectively.
27. Pensions
The group’s principal pension plan comprises the compulsory Superannuation scheme in Australia, where the company contributes 9.5%. The pension charge for the period represents contributions payable by the group which amounted to US$196,005 in respect of the Australian scheme. New schemes will be completed for the UK and US during the forthcoming year. There were no outstanding or prepaid contributions at either the beginning or end of the financial period.
Notes to the Financial Statements (continued) for the period ended 31 March 2017
Page | 75
28. Financial instruments (a) Financial risk management
The group’s principal financial instruments are bank balances, cash and medium term loans. The main purpose of these financial instruments is to manage the group’s funding and liquidity requirements. The group also has other financial instruments such as trade receivables and trade payables which arise directly from its operations. The group is exposed through its operations to the following financial risks:
Liquidity risk
Credit risk
Interest rate risk
Foreign currency risk
The Board of Directors has overall responsibility for the establishment and oversight of the group’s risk management framework. Policy for managing risks is set by the Chief Financial Officer and is implemented by the group’s finance department. All risks are managed centrally with a tight control of all financial matters.
(b) Liquidity risk
Liquidity risk is the risk that the group will not be able to meet its financial obligations as they fall due. The group considers that it has no significant liquidity risk. The group held cash resources of $10.9 million with related party loan of $19.0 million. The ratio of current assets to current liabilities is 2.5:1. The group manages its liquidity as a whole and ensures that there are sufficient available cash resources for each group company to operate effectively.
(c) Credit risk
The primary risk arises from the group’s receivables from customers. The majority of the group’s customers are long standing and have been with the subsidiary companies for many years. Losses have occurred infrequently. The group is mainly exposed to credit risks from credit sales but the group has no significant concentrations of credit risk and keeps the credit status of customers under review. Credit risks of customers of new customers are reviewed before entering into contracts. The debtor exposure is monitored by group finance and the local entities review and report their exposure on a monthly basis. The group does not consider the exposure to the above risks to be significant and has therefore not presented a sensitivity analysis on the identified risks. The credit quality of debtors neither past due nor impaired is good. Refer to note 15 for further analysis on trade receivables.
(d) Foreign currency risk
The group operates internationally and is exposed to foreign exchange risk on sales and purchases that are denominated in currencies other than the respective functional currencies of the group entities to which they relate, primarily with respect to GBP and USD, but also between USD and AUD.
Notes to the Financial Statements (continued) for the period ended 31 March 2017
Page | 76
The group’s investments in overseas subsidiaries are not hedged as those currency positions are either USD denominated and/or considered to be long‐term in nature. The related party loans are denominated in USD, and therefore, foreign currency risk is eliminated.
(e) Interest rate risk
As a result of the related party loan agreement the group is exposed to interest rate volatility. However, the interest rate is fixed for the medium term, therefore, the risk is largely mitigated for the near future. The group will continue to monitor the movements in the wider global economy.
29. Related party transactions
Kevin Chin is also Chief Executive of Arowana International Limited, an Australian registered company, listed on the Australian Stock Exchange (ASX). During the course of the period, a number of services were provided to VivoPower International PLC and its subsidiaries from a number of Arowana companies. Arowana International Limited is a majority shareholder of VivoPower International PLC and the extent of the transactions between the two groups is listed below. Arowana International Limited during the course of the period Arowana has helped fund investments in renewable energy projects. Additionally, prior to VivoPower’s Nasdaq listing it was a source of working capital funding. As at 31 March 2017, there was in place a related party loan of $18,992,263. The loan interest is payable monthly in arrears and the first capital repayment on the loan is due on 1 April 2018. There were additional short term balances outstanding at the period‐end $1,404,919.23 which were due for repayment at the end of May 2017.
Arowana Group (Asia) Pte Ltd – provided specialist consultancy advice relating to Singapore for $97,745. The amount paid during the period was $97,745. The balance outstanding at the end of the financial period was nil.
Arowana Partners Group Pty Limited ‐ Kevin Chin, receives a Non‐Executive Director’s fee per month of £16,250. The total costs charged to VivoPower during the course of the financial period were £200,000. The balance outstanding at the end of the financial period was £200,000. Payments were made during April 2017 to clear the balance.
30. Key management personnel compensation
Key management personnel, which have a group management role, are included in note 7 to the consolidated financial statements.
31. Ultimate controlling party
The ultimate controlling party and the results into which these financials are consolidated is Arowana International Limited.
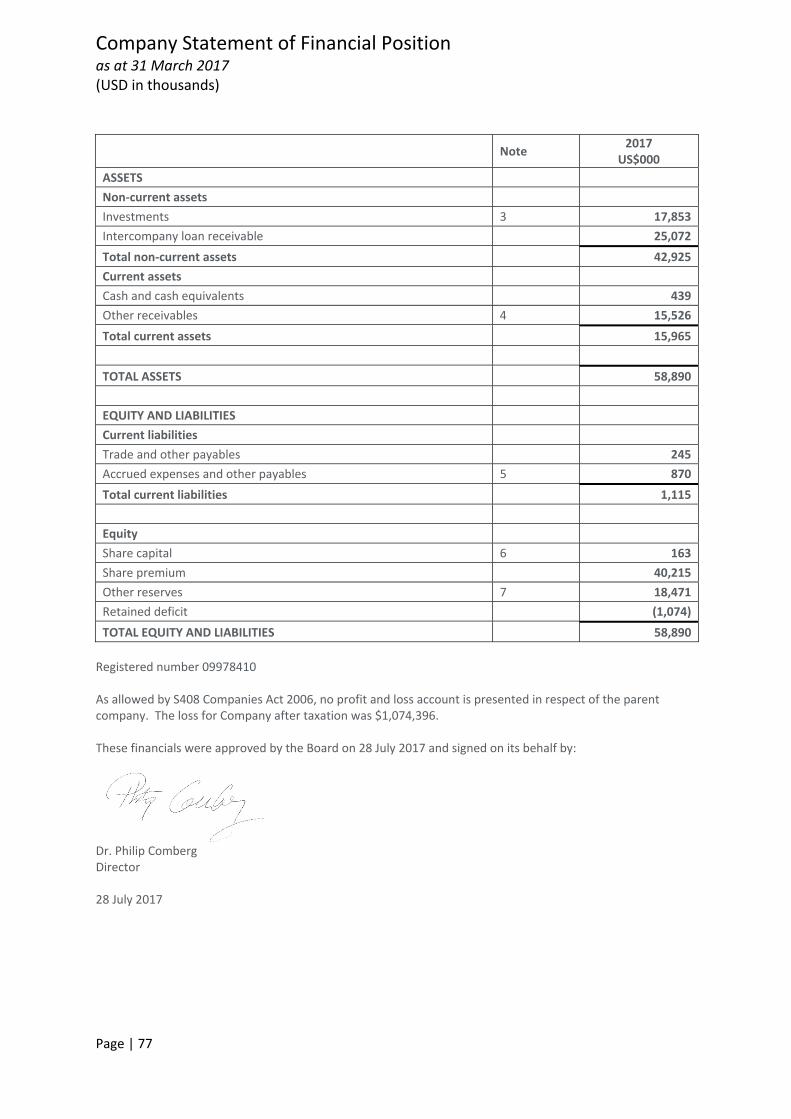
Company Statement of Financial Position as at 31 March 2017 (USD in thousands)
Page | 77
Registered number 09978410 As allowed by S408 Companies Act 2006, no profit and loss account is presented in respect of the parent company. The loss for Company after taxation was $1,074,396. These financials were approved by the Board on 28 July 2017 and signed on its behalf by:
Dr. Philip Comberg Director 28 July 2017
Note 2017
US$000
ASSETS
Non‐current assets
Investments 3 17,853
Intercompany loan receivable 25,072
Total non‐current assets 42,925
Current assets
Cash and cash equivalents 439
Other receivables 4 15,526
Total current assets 15,965
TOTAL ASSETS 58,890
EQUITY AND LIABILITIES
Current liabilities
Trade and other payables 245
Accrued expenses and other payables 5 870
Total current liabilities 1,115
Equity
Share capital 6 163
Share premium 40,215
Other reserves 7 18,471
Retained deficit (1,074)
TOTAL EQUITY AND LIABILITIES 58,890
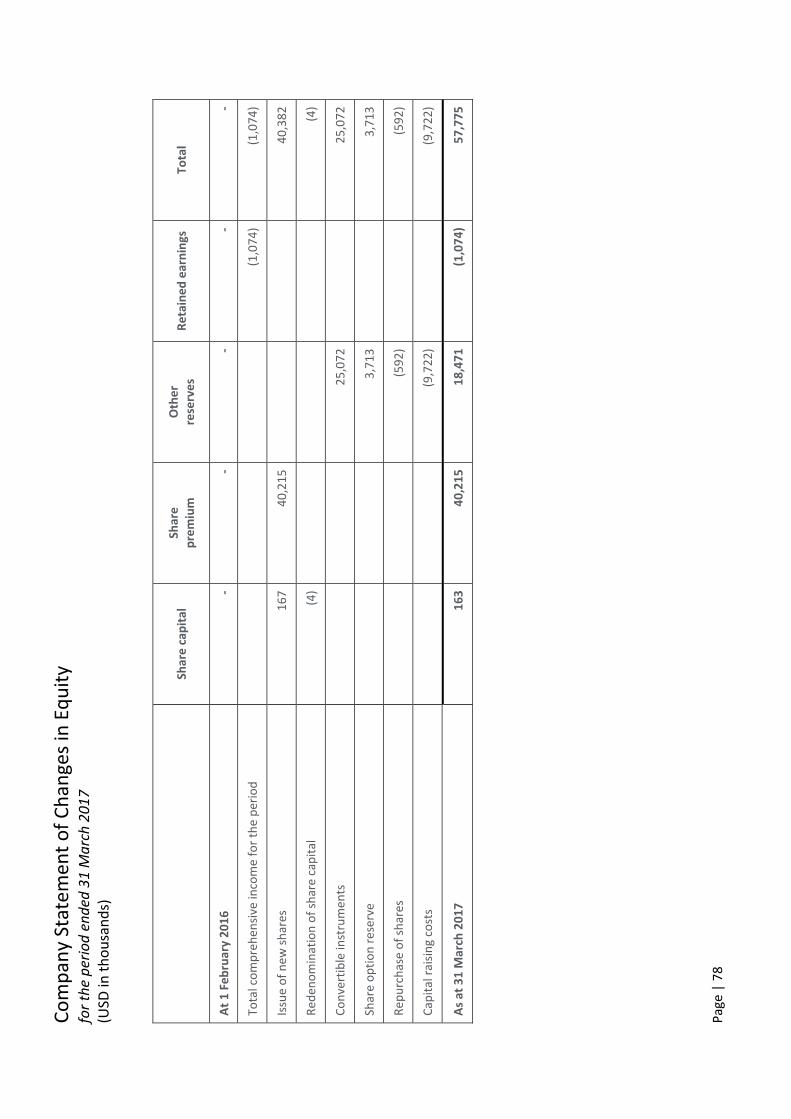
Compan
y Statem
ent of Chan
ges in Equity
for the period ended
31 M
arch 2017
(USD
in thousands)
Page | 78
Sh
are cap
ital
Share
premium
Other
reserves
Retained
earnings
Total
At 1 Feb
ruary 2016
‐ ‐
‐ ‐
‐
Total comprehen
sive in
come for the period
(1,074)
(1,074)
Issue of new
shares
167
40,215
40,382
Red
enomination of share capital
(4)
(4)
Convertible in
strumen
ts
25,072
25,072
Share option reserve
3,713
3,713
Rep
urchase of shares
(592)
(592)
Cap
ital raising costs
(9,722)
(9,722)
As at 31 M
arch 2017
163
40,215
18,471
(1,074)
57,775
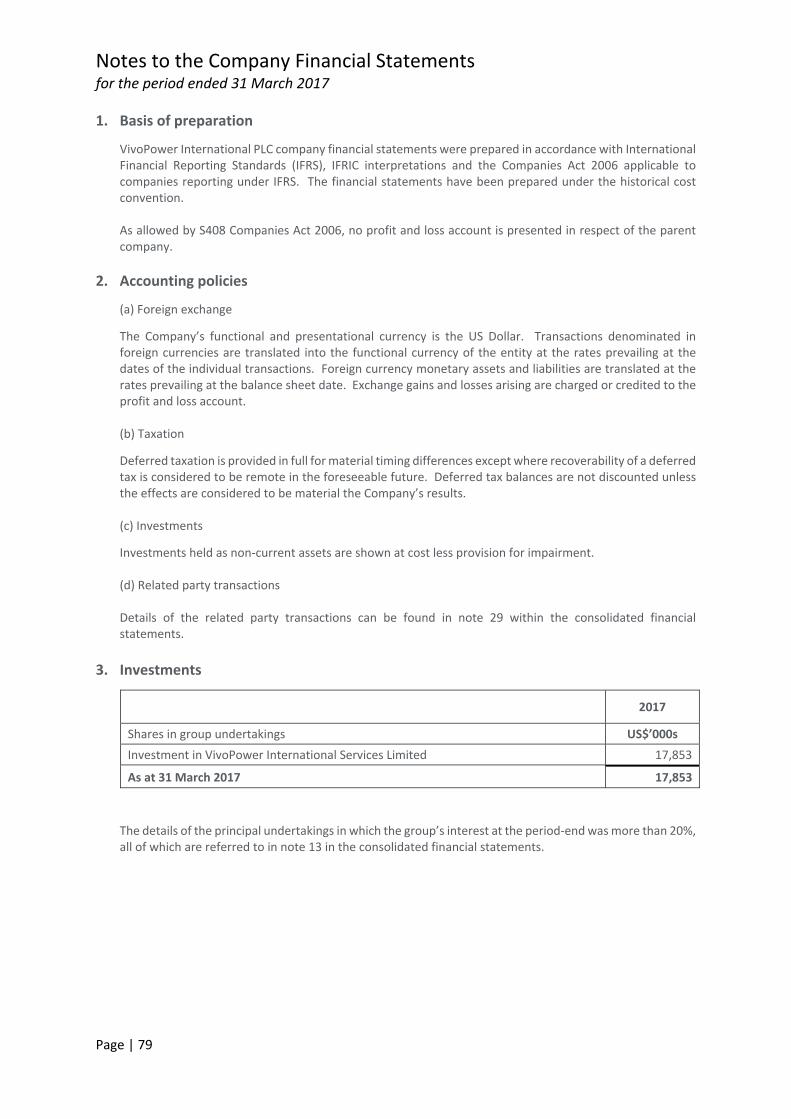
Notes to the Company Financial Statements for the period ended 31 March 2017
Page | 79
1. Basis of preparation
VivoPower International PLC company financial statements were prepared in accordance with International Financial Reporting Standards (IFRS), IFRIC interpretations and the Companies Act 2006 applicable to companies reporting under IFRS. The financial statements have been prepared under the historical cost convention. As allowed by S408 Companies Act 2006, no profit and loss account is presented in respect of the parent company.
2. Accounting policies
(a) Foreign exchange
The Company’s functional and presentational currency is the US Dollar. Transactions denominated in foreign currencies are translated into the functional currency of the entity at the rates prevailing at the dates of the individual transactions. Foreign currency monetary assets and liabilities are translated at the rates prevailing at the balance sheet date. Exchange gains and losses arising are charged or credited to the profit and loss account. (b) Taxation
Deferred taxation is provided in full for material timing differences except where recoverability of a deferred tax is considered to be remote in the foreseeable future. Deferred tax balances are not discounted unless the effects are considered to be material the Company’s results.
(c) Investments
Investments held as non‐current assets are shown at cost less provision for impairment. (d) Related party transactions Details of the related party transactions can be found in note 29 within the consolidated financial statements.
3. Investments
2017
Shares in group undertakings US$’000s
Investment in VivoPower International Services Limited 17,853
As at 31 March 2017 17,853
The details of the principal undertakings in which the group’s interest at the period‐end was more than 20%, all of which are referred to in note 13 in the consolidated financial statements.
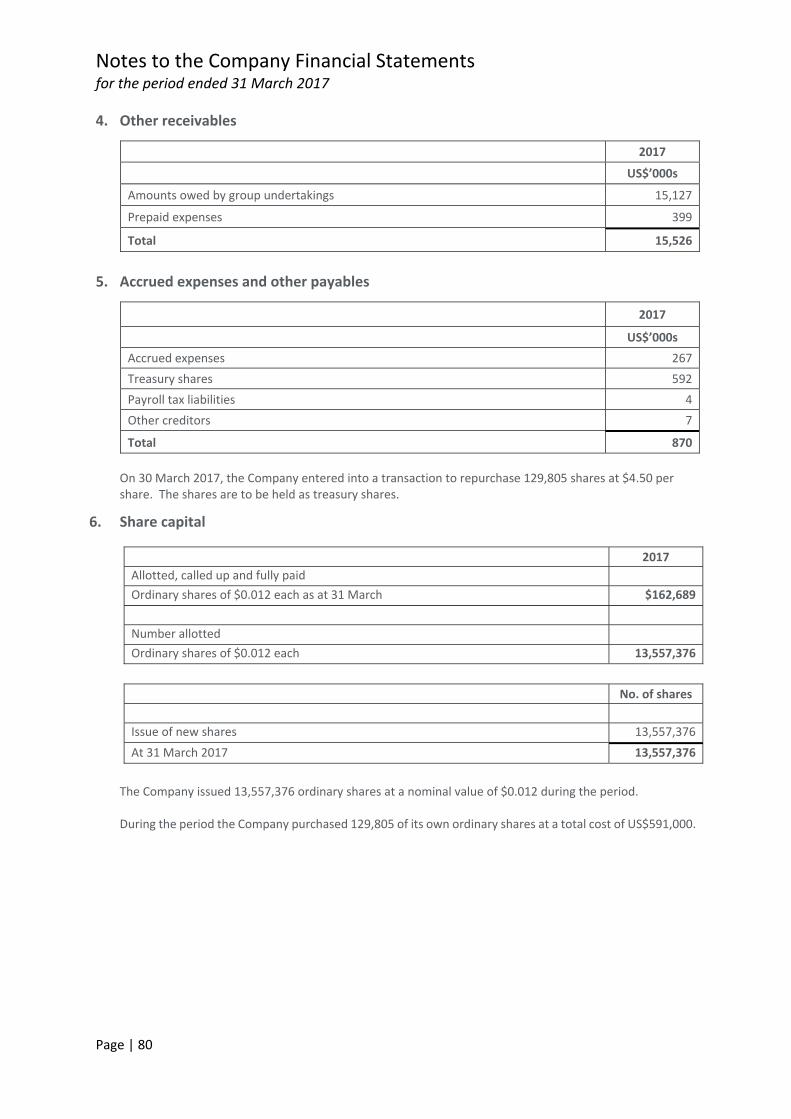
Notes to the Company Financial Statements for the period ended 31 March 2017
Page | 80
4. Other receivables
2017
US$’000s
Amounts owed by group undertakings 15,127
Prepaid expenses 399
Total 15,526
5. Accrued expenses and other payables
2017
US$’000s
Accrued expenses 267
Treasury shares 592
Payroll tax liabilities 4
Other creditors 7
Total 870
On 30 March 2017, the Company entered into a transaction to repurchase 129,805 shares at $4.50 per share. The shares are to be held as treasury shares.
2017
Allotted, called up and fully paid
Ordinary shares of $0.012 each as at 31 March $162,689
Number allotted
Ordinary shares of $0.012 each 13,557,376
No. of shares
Issue of new shares 13,557,376
At 31 March 2017 13,557,376
The Company issued 13,557,376 ordinary shares at a nominal value of $0.012 during the period. During the period the Company purchased 129,805 of its own ordinary shares at a total cost of US$591,000.
6. Share capital
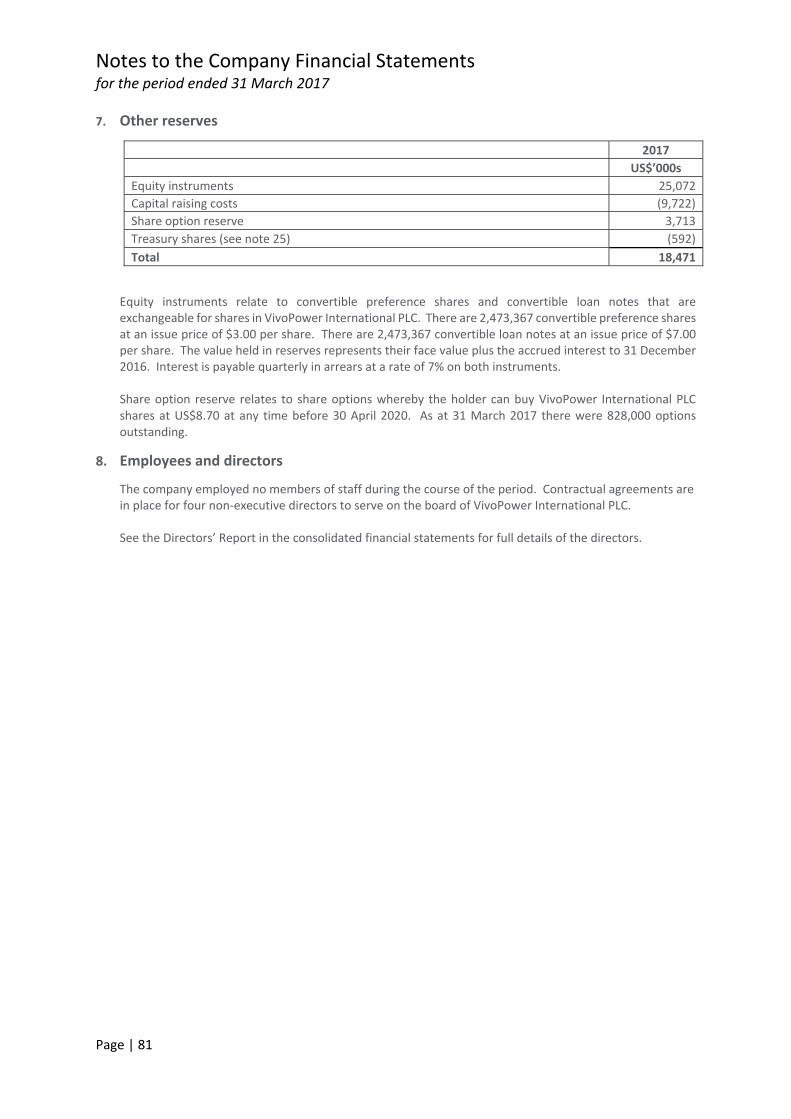
Notes to the Company Financial Statements for the period ended 31 March 2017
Page | 81
7. Other reserves
2017
US$’000s
Equity instruments 25,072
Capital raising costs (9,722)
Share option reserve 3,713
Treasury shares (see note 25) (592)
Total 18,471
Equity instruments relate to convertible preference shares and convertible loan notes that are exchangeable for shares in VivoPower International PLC. There are 2,473,367 convertible preference shares at an issue price of $3.00 per share. There are 2,473,367 convertible loan notes at an issue price of $7.00 per share. The value held in reserves represents their face value plus the accrued interest to 31 December 2016. Interest is payable quarterly in arrears at a rate of 7% on both instruments.
Share option reserve relates to share options whereby the holder can buy VivoPower International PLC shares at US$8.70 at any time before 30 April 2020. As at 31 March 2017 there were 828,000 options outstanding.
8. Employees and directors
The company employed no members of staff during the course of the period. Contractual agreements are in place for four non‐executive directors to serve on the board of VivoPower International PLC. See the Directors’ Report in the consolidated financial statements for full details of the directors.
Company Information
Page | 82
ADVISORS
Company registrars Legal Advisers
Computershare Inc., Herbert Smith Freehills LLP, 250 Royall Street, Exchange House, Canton, MA, USA 02021 Primrose Street, London, UK EC2A 2EG
Correspondence address: Principal Bankers Computershare Inc., Barclays Bank PLC, P.O. Box 505000, Level 16, 1 Churchill Place, Louisville, KY, USA 40233 Canary Wharf, London, UK E14 5HP
Independent auditors Company Secretary
PKF Littlejohn LLP, First Names Global Limited, 1 Westferry Circus, 4th Floor, 45 Monmouth Street, Canary Wharf, London, UK WC2H 9DG London, UK E14 4HD
SHAREHOLDER INFORMATION
Country of Incorporation and main Number of securities in issue countries of operation As of 26 July 2017, the Company’s VivoPower
International PLC is incorporated in issued share capital consists of England & Wales. The Company operates in the 13,557,376 ordinary shares United Kingdom, United States with a nominal value of $0.012 each. and Australia The Company has 129,805 treasury shares.
Company registration
Registered office: 91 Wimpole Street, London, UK W1G 0EF Registered in England & Wales Company number: 09978410
FINANCIAL CALENDAR
Annual General Meeting (“AGM”)
The Company’s AGM will be held at 09:30 am on 5 September 2017, at the Company’s headquarters, located at 91 Wimpole Street, Marylebone, London, United Kingdom W1G 0EF.