Embed Size (px)
Citation preview

Vivek Vivek MuralidharanMuralidharan
Simulation and imaging Simulation and imaging experiments of fluid flow through a experiments of fluid flow through a
fracture surface: a new fracture surface: a new perspectiveperspective

Log Log AnalysisAnalysis
Fracture Fracture CharacterizationCharacterization
Aperture distribution
Fracture Fracture ModelModel
ww
Fractured Reservoirs
Poor recovery
Laboratory Laboratory ExperimentsExperiments
SimulationSimulation
Workstation 3D CT Image3D CT Image
Digital DetectorX-Ray Source
Object
X-Ray Tomography
X-ray CT scanner

Presentation Outline
• Historical Perspective Historical Perspective
• Objectives and ApproachObjectives and Approach
• ApplicationsApplications
• ConclusionsConclusions

Fracture Model
Historical perspective Historical perspective
w
Constant fracture aperture

Historical perspective Historical perspective
Cubic Law
L
pplbq L
03
12
Aperture Size

Parallel Plate Assumption Parallel Plate Assumption
w
Single Fracture Aperture

Fracture Aperture Fracture Aperture
Fracture roughness
Better History Match
Realistic simulation model

Fracture Aperture Fracture Aperture DistributionDistribution
Fracture aperture
distribution
Pyrak-Nolte et al., (1987)
Tsang et al., 1987
Gale, 1987Keller, (1996)
Lognormal distribution for natural fractures
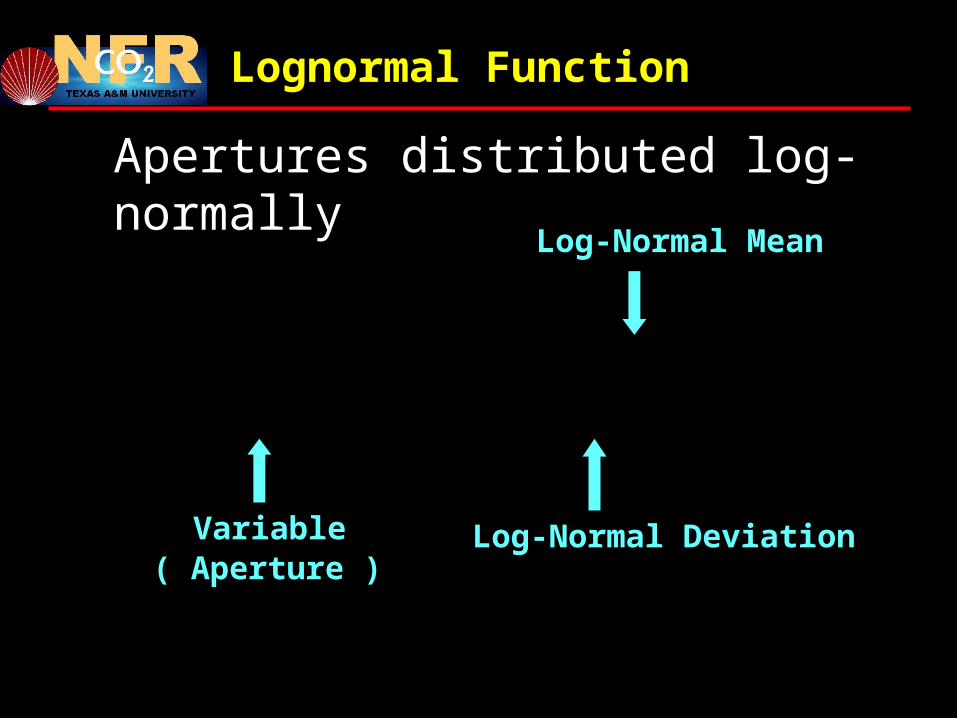
2ln
2
1exp
2
1)(
x
xxf
Log-Normal Mean
Log-Normal Deviation
Variable( Aperture )
Apertures distributed log-normally
Lognormal Function Lognormal Function

Generation of aperturesGeneration of apertures

Smooth fracture surfaceSmooth fracture surface
Aperture Distribution Aperture Distribution
0
0.0005
0.001
0.0015
0.002
0.0025
0.003
0.0035
0.004
0.0045
0 200 400 600 800 1000 1200
Fracture aperture, microns
Rel
ativ
e fr
equ
ency

0
0.0005
0.001
0.0015
0.002
0.0025
0.003
0.0035
0.004
0.0045
0 200 400 600 800 1000 1200
Fracture aperture, microns
Rel
ativ
e F
req
uen
cy
Aperture Distribution Aperture Distribution
Slightly rough fracture surfaceSlightly rough fracture surface

0
0.0005
0.001
0.0015
0.002
0.0025
0.003
0.0035
0.004
0.0045
0 200 400 600 800 1000 1200
Fracture aperture, microns
Rel
ativ
e F
req
uen
cy
Highly rough surface fractureHighly rough surface fracture
Aperture Distribution Aperture Distribution
Larger Aperture Size

Problems Problems
• Aperture distribution is proved for fractures without experiencing any stress.
• Aperture distribution has not yet been investigated under different stress condition.
• Single fracture aperture does not represent the actual flow through fracture

Presentation Outline
• Historical PerspectiveHistorical Perspective
• Objectives and ApproachObjectives and Approach
• ApplicationsApplications
• ConclusionsConclusions

Objectives Objectives
X-ray CT scanner
Stress
Aperture distribution?
Aperture distribution has not yet been investigated
under different stress condition.
Problem:

Objectives Objectives
X-ray CT scanner
Gravity drainage experiment
Single fracture aperture does not represent the actual flow through fracture
Problem:

Aperture distribution under Aperture distribution under stress using X-ray CT scanner stress using X-ray CT scanner

Workstation 3D CT Image3D CT Image
Digital DetectorX-Ray Source
Object
X-Ray Tomography
Experiments in X-ray CT scanner
ApproachApproach
Scan
Scans at multiple locations
Calibration
Aperture Distribution

X-ray CT Scanner
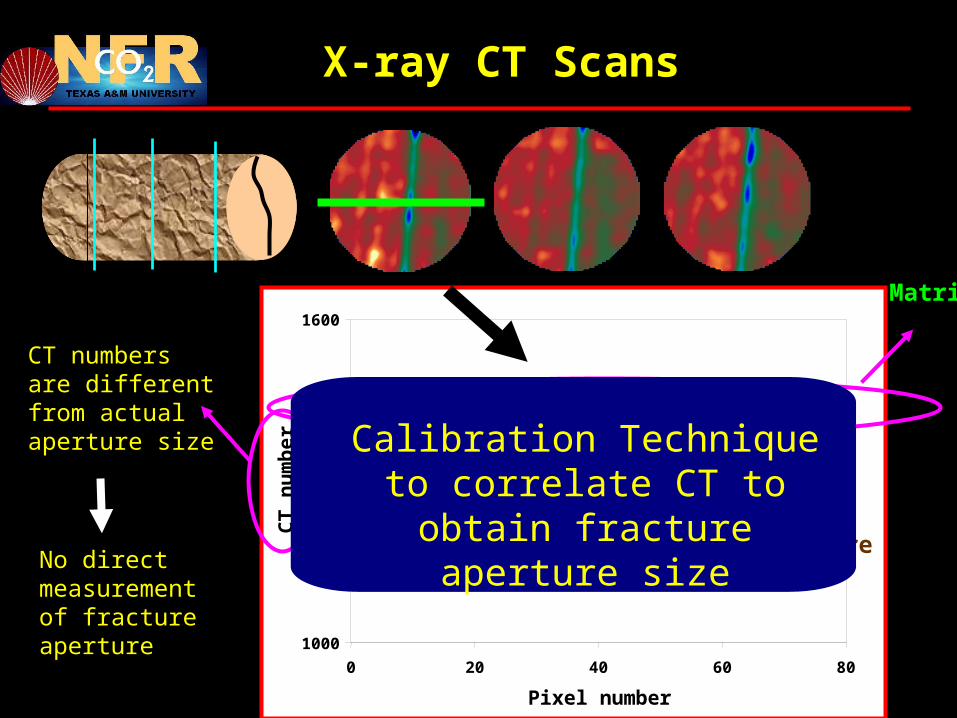
CT scanner analyzes density differences between objects
Matrix and fracture identification
Density of rock
Density of fluid in fracture
1000
1200
1400
1600
0 20 40 60 80
Pixel number
CT
nu
mb
er
X-ray CT Scans
Matrix
Fracture
CT numbers are different from actual aperture size Calibration Technique to
correlate CT to obtain fracture aperture size
No direct measurement of fracture aperture

Scanned the core between
feeler gauges
Calibration Procedure
Smooth surface
Feeler gauge of known size

Calibration Procedure
Fracture
Matrix

Min rock CT
Calibration Procedure
Integrated CT area

0
1000
2000
3000
4000
5000
6000
7000
8000
0 100 200 300 400 500 600 700 800 900
Fracture aperture (microns)
Inte
gra
ted
CT
sig
nal
Calibration Curve
7.4607616.8 xCTarea
Feeler gauge size

Calibration curve
Integrated CT area
Scans of fractured core of unknown
apertures
Fracture aperture

0
1000
2000
3000
4000
5000
6000
7000
8000
0 100 200 300 400 500 600 700 800 900
Fracture aperture (microns)
Inte
gra
ted
CT
sig
nal
Calibration Curve
7.4607616.8 xCTarea
Determination of fracture aperture
7616.8
7.460 areaCTx

Aperture Distribution

Scans taken along the length of the core

Animation
Apertures along the length of the core
No stress 500 psi 1000 psi 1500 psi

Apertures
90 sections70 locations
Around 6000 sectionsFour different stress conditions
24000 aperturesApertures are calculated from
calibration curve

Aperture Distribution without stress
Lognormal distributionMean = 370.527
σ = 211.772

Aperture Distribution with stress
Mean = 370.527, σ = 211.772
Mean = 197.997, σ = 172.573

Aperture Distribution with stress
Mean = 370.527, σ = 211.772
Mean = 197.997, σ = 172.573
Mean = 157.418, σ = 162.395

Aperture Distribution with stress
Mean = 370.527, σ = 211.772
Mean = 197.997, σ = 172.573
Mean = 157.418, σ = 162.395
Mean = 138.656, σ = 150.33

Aperture Distribution with stress
Aperture distribution follows Lognormal distribution at all
conditions

Highly rough surface fractureHighly rough surface fracture
Larger Aperture Size
Fracture apertures have to be distributed
Lognormal Distribution Lognormal Distribution
Presentation Outline
• Historical Perspective Historical Perspective
• Objectives and ApproachObjectives and Approach
• ApplicationsApplications
• ConclusionsConclusions

Experimental ProcedureUnfractured Core
pPressure Drop
Km qinj/ p
Matrix Permeability
qinj
Injection rate
5 cc/min
500,1000,1500

matrix
fracture
l
Experimental ProcedureExperimental ProcedureFractured CoreFractured Core
pavg
Average Pressure
Drop
Kavg qinj/ pavg
Average Permeability
qinj
Injection rate
5 cc/min

Analytical Equations
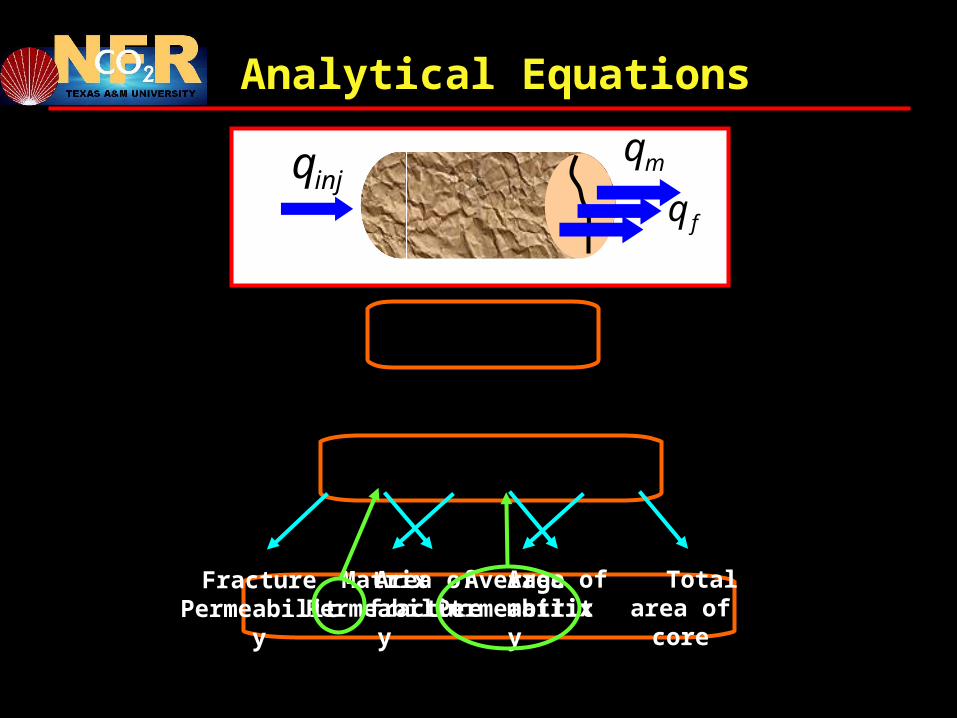
Analytical Equations
AKwdAKwdk avgmf )(
AKAKAk avgmmff
mfinj qqq
fqinjq mq
Fracture Permeability
Area of fracture
Matrix Permeability
Area of matrix
Average Permeability
Total area of core

Analytical Equations
wd
wdAkAkk mavgf
)(
0)(1045.8 39 wdAkAkdw mavg
Combining above equations to determine w
w Ad
matrix fractureFracture Permeability
291045.8 wk f
Cubic Law

0)(1045.8 39 wlAkAklw mav
Fracture Aperture

Fracture Permeability
291045.8 wk f

Fracture Flowrate
L
pdwq avgf 121086.9
13
9
500 Psi
1000 Psi
1500 Psi

Flow through fracture and matrix
Flow through fracture

Flow through fracture and matrix
Flow through fracture
Flow through matrix

Modeling Laboratory Experiment
Simulation model using aperture distribution

Simulation Model
Model Description
• 10x10x15 grids
• Fracture in 8th block in K dirn
ij
k
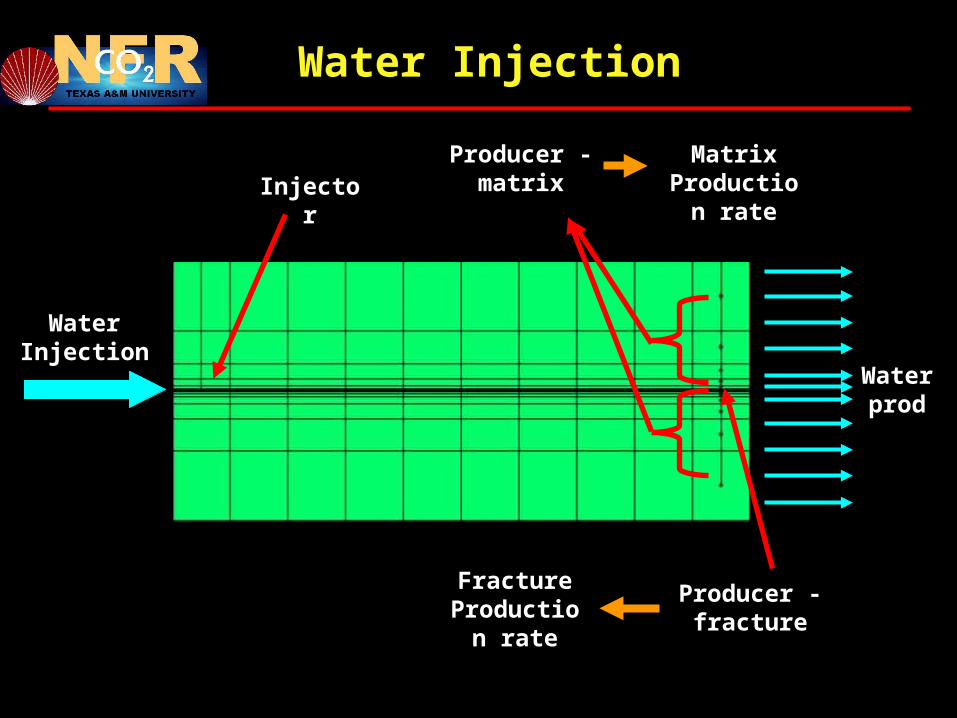
Injector
Water Injection
Water Injection
Producer - matrix
Matrix Production
rate
Producer - fracture
Fracture Production
rate
Water prod

Aperture distribution in fracture region
Aperture distribution
maps
Lognormal
Mean eff aperturevariance
500 psi 1000 psi
1500 psi

Example flow on the distributed fracture surface

Flow Through Matrix and Fracture
Flow through fracture
Flow through matrix

Pressure drop

Objectives Objectives
X-ray CT scanner
Gravity drainage experiment

ApproachApproach
Gravity Drainage Experiment

X-Ray
DetectorX-Ray Source
Brine
X-ray CT scan

Fluid flow pattern
0 min
12 min

Parallel Plate
Experiment
Simulation

Flow on a smooth Flow on a smooth fracture surfacefracture surface
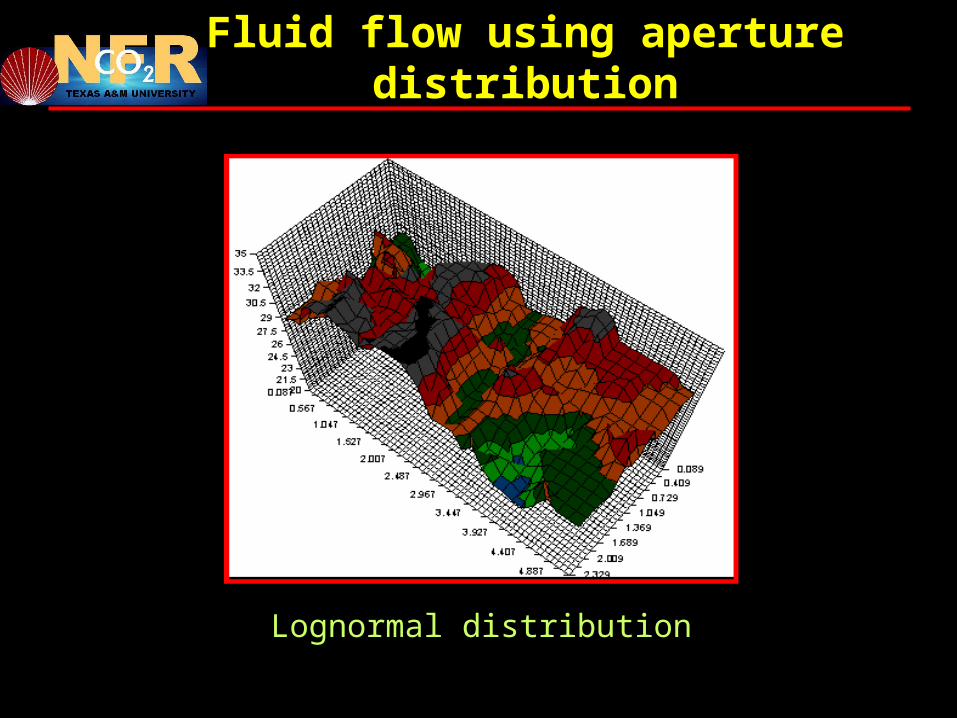
Lognormal distribution
Fluid flow using aperture distribution

Fluid flow using aperture distribution
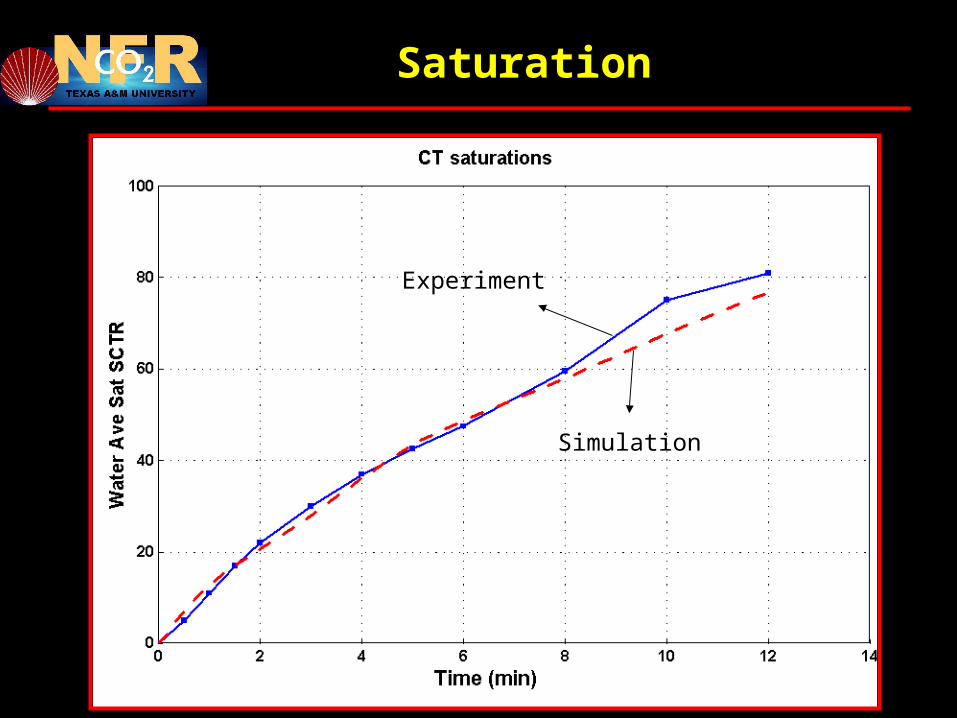
Saturation
Experiment
Simulation

Presentation Outline
• Historical Perspective Historical Perspective
• Objectives and ApproachObjectives and Approach
• ApplicationApplication
• ConclusionsConclusions

Fluid flow experiments under stress
Recap

Recap
Gravity drainage experiment

Conclusions
•Fracture Aperture Lognormal distribution
•Parallel plate assumption valid
•Distributed apertures Realistic flow behavior
Better History Match

Acknowledgement
• Dr. D. S. Schechter, Texas A&M University
• Dr. Erwin Putra, Texas A&M University
• Mr. Dicman Alfred, Schlumberger
• Department of Energy (D.O.E) for sponsoring the project.

Thank You