Embed Size (px)
Citation preview
Viva Industrial Trust
4Q2017 & FY2017
Results Presentation
26 January 2018
1

VIVA ITRUST 2
This presentation is for information purposes only and does not constitute or form part of an offer, invitation or solicitation of any
offer to purchase or subscribe for any Stapled Securities of Viva Industrial Trust (“VIT”) in Singapore or any other jurisdiction nor
should it or any part of it form the basis of, or be relied upon in connection with, any contract or commitment whatsoever.
The value of the Stapled Securities and the income derived from them may fall as well as rise. The Stapled Securities are not
obligations of, deposits in, or guaranteed by, Viva Industrial Trust Management Pte. Ltd., in its capacity as manager of Viva
Industrial Real Estate Investment Trust (“VI-REIT”, and the manager of VI-REIT, the “REIT Manager”), Viva Asset Management
Pte. Ltd., in its capacity as trustee-manager of Viva Industrial Business Trust (“VI-BT”, and the trustee-manager of VI-BT, the
“Trustee-Manager”, and collectively with the REIT Manager, the “Managers”), Perpetual (Asia) Limited, as trustee of VI-REIT, or
any of their respective affiliates.
An investment in the Stapled Securities is subject to investment risks, including the possible loss of the principal amount invested.
Stapled Securityholders have no right to request that the Managers redeem or purchase their Stapled Securities while the Stapled
Securities are listed. It is intended that Stapled Securityholders may only deal in their Stapled Securities through trading on
Singapore Exchange Securities Trading Limited (“SGX-ST”). Listing of the Stapled Securities on the SGX-ST does not guarantee a
liquid market for the Stapled Securities.
This presentation may contain forward-looking statements that involve assumptions, risks and uncertainties. Actual future
performance, outcomes and results may differ materially from those expressed in forward-looking statements as a result of a
number of risks, uncertainties and assumptions. Predictions, projections or forecasts of the economy or economic trends of the
markets are not necessarily indicative of the future or likely performance of VIT. The forecast financial performance of VIT is not
guaranteed. A potential investor is cautioned not to place undue reliance on these forward-looking statements, which are based on
the Managers’ current view of future events.
Important Notice
VIVA ITRUST 3
Contents
Key Highlights
Financial Performance
Portfolio Update
Outlook & Strategic Focus
VIVA ITRUST 4
Key Highlights
VIVA ITRUST 5
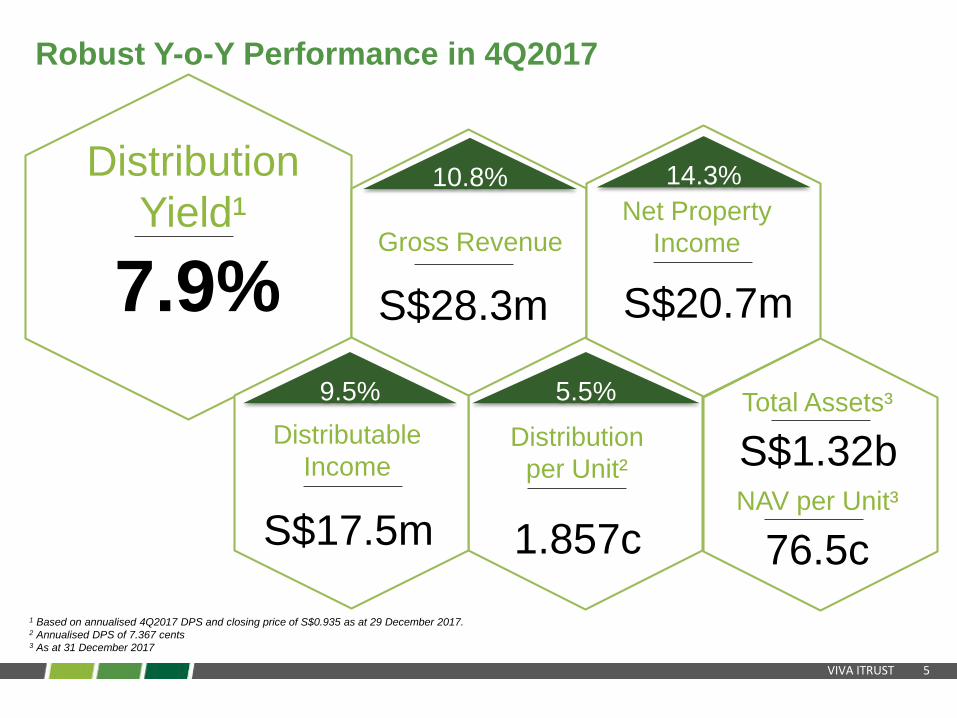
Robust Y-o-Y Performance in 4Q2017
Distribution
Yield¹
7.9%Gross Revenue
10.8% 14.3%
5.5%9.5%
S$28.3m
Net Property
Income
S$17.5m
Distributable
Income
S$20.7m
Distribution
per Unit²
1.857c
Total Assets³
NAV per Unit³
S$1.32b
76.5c
1 Based on annualised 4Q2017 DPS and closing price of S$0.935 as at 29 December 2017.2 Annualised DPS of 7.367 cents3 As at 31 December 2017
VIVA ITRUST 6
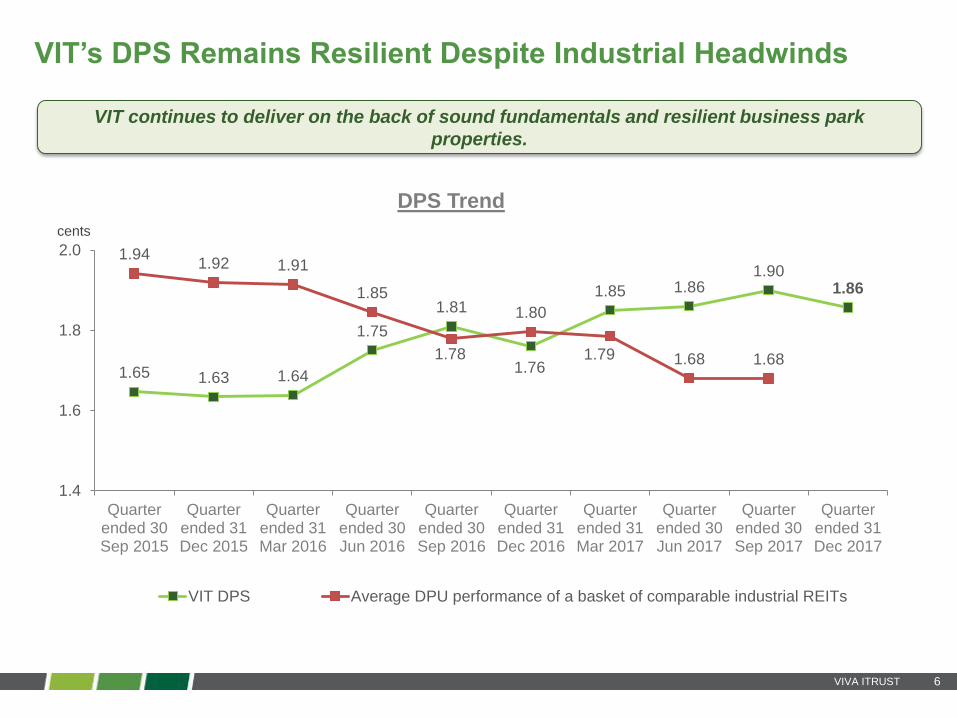
VIT’s DPS Remains Resilient Despite Industrial Headwinds
1.65 1.63 1.64
1.75
1.81
1.76
1.85 1.861.90
1.86
1.941.92 1.91
1.85
1.78
1.80
1.79 1.68 1.68
1.4
1.6
1.8
2.0
Quarterended 30Sep 2015
Quarterended 31Dec 2015
Quarterended 31Mar 2016
Quarterended 30Jun 2016
Quarterended 30Sep 2016
Quarterended 31Dec 2016
Quarterended 31Mar 2017
Quarterended 30Jun 2017
Quarterended 30Sep 2017
Quarterended 31Dec 2017
DPS Trend
VIT DPS Average DPU performance of a basket of comparable industrial REITs
cents
VIT continues to deliver on the back of sound fundamentals and resilient business park
properties.
VIVA ITRUST 7
0
200
400
600
800
1,000
1,200
1,400
1,600
0.60
0.70
0.80
0.90
1.00
No
v-1
3
Ja
n-1
4
Ma
r-14
Ma
y-1
4
Ju
l-1
4
Sep
-14
No
v-1
4
Ja
n-1
5
Ma
r-15
Ma
y-1
5
Ju
l-1
5
Sep
-15
No
v-1
5
Ja
n-1
6
Ma
r-16
Ma
y-1
6
Ju
l-1
6
Sep
-16
No
v-1
6
Ja
n-1
7
Ma
r-17
Ma
y-1
7
Ju
l-1
7
Sep
-17
No
v-1
7
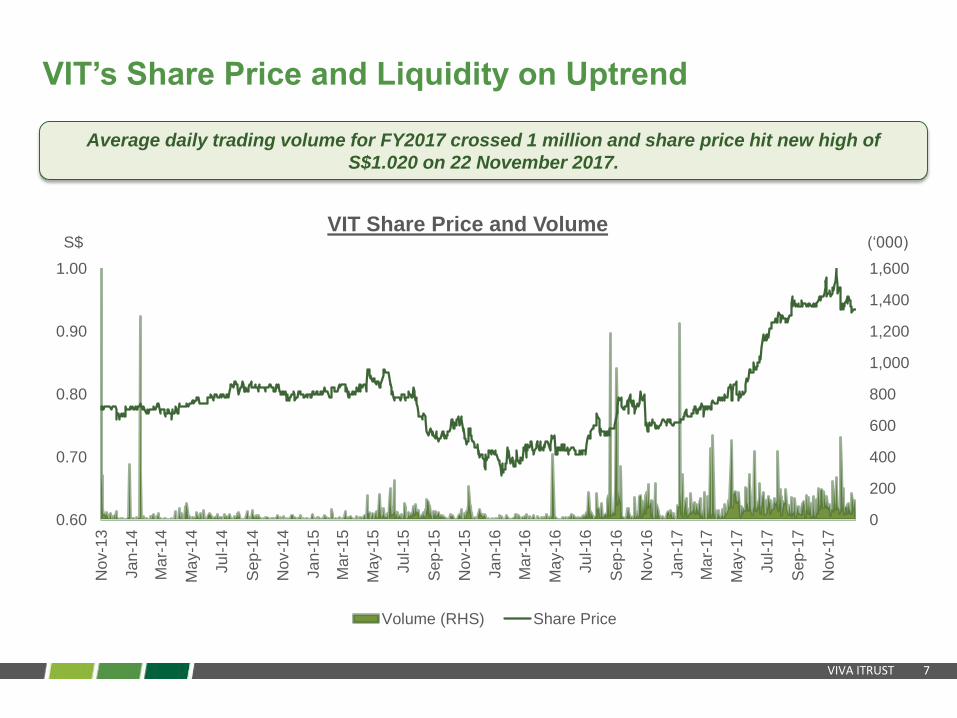
VIT Share Price and Volume
Volume (RHS) Share Price
VIT’s Share Price and Liquidity on Uptrend
Average daily trading volume for FY2017 crossed 1 million and share price hit new high of
S$1.020 on 22 November 2017.
S$ (‘000)
VIVA ITRUST 8
Financial Performance
VIVA ITRUST 9
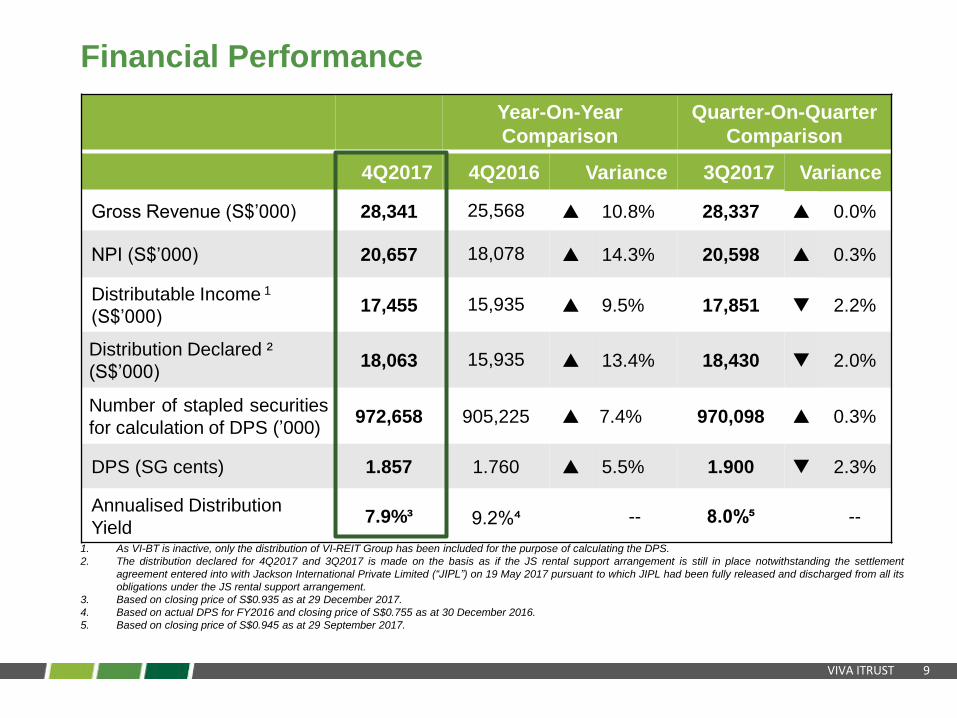
Year-On-Year
Comparison
Quarter-On-Quarter
Comparison
4Q2017 4Q2016 Variance 3Q2017 Variance
Gross Revenue (S$’000) 28,341 25,568 10.8% 28,337 0.0%
NPI (S$’000) 20,657 18,078 14.3% 20,598 0.3%
Distributable Income 1
(S$’000)17,455 15,935 9.5% 17,851 2.2%
Distribution Declared ²
(S$’000)18,063 15,935 13.4% 18,430 2.0%
Number of stapled securities
for calculation of DPS (’000)972,658 905,225 7.4% 970,098 0.3%
DPS (SG cents) 1.857 1.760 5.5% 1.900 2.3%
Annualised Distribution
Yield 7.9%³ 9.2%⁴ -- 8.0%⁵ --
1. As VI-BT is inactive, only the distribution of VI-REIT Group has been included for the purpose of calculating the DPS.
2. The distribution declared for 4Q2017 and 3Q2017 is made on the basis as if the JS rental support arrangement is still in place notwithstanding the settlement
agreement entered into with Jackson International Private Limited (“JIPL”) on 19 May 2017 pursuant to which JIPL had been fully released and discharged from all its
obligations under the JS rental support arrangement.
3. Based on closing price of S$0.935 as at 29 December 2017.
4. Based on actual DPS for FY2016 and closing price of S$0.755 as at 30 December 2016.
5. Based on closing price of S$0.945 as at 29 September 2017.
Financial Performance
VIVA ITRUST 10
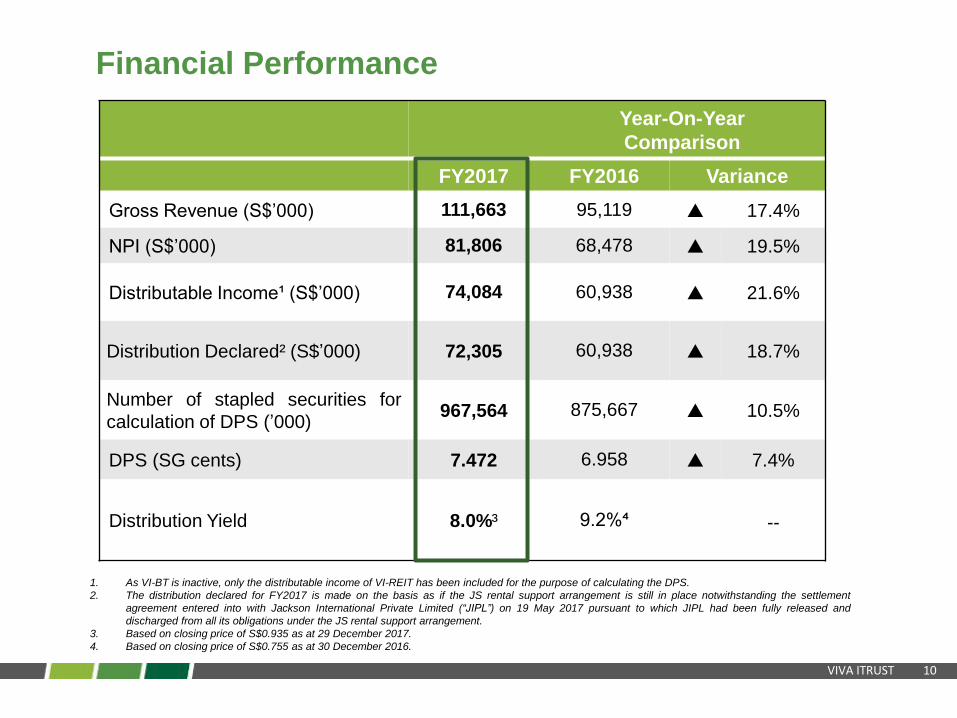
Year-On-Year
Comparison
FY2017 FY2016 Variance
Gross Revenue (S$’000) 111,663 95,119 17.4%
NPI (S$’000) 81,806 68,478 19.5%
Distributable Income¹ (S$’000) 74,084 60,938 21.6%
Distribution Declared² (S$’000) 72,305 60,938 18.7%
Number of stapled securities for
calculation of DPS (’000)967,564 875,667 10.5%
DPS (SG cents) 7.472 6.958 7.4%
Distribution Yield 8.0%³ 9.2%⁴ --
1. As VI-BT is inactive, only the distributable income of VI-REIT has been included for the purpose of calculating the DPS.
2. The distribution declared for FY2017 is made on the basis as if the JS rental support arrangement is still in place notwithstanding the settlement
agreement entered into with Jackson International Private Limited (“JIPL”) on 19 May 2017 pursuant to which JIPL had been fully released and
discharged from all its obligations under the JS rental support arrangement.
3. Based on closing price of S$0.935 as at 29 December 2017.
4. Based on closing price of S$0.755 as at 30 December 2016.
Financial Performance
VIVA ITRUST 11
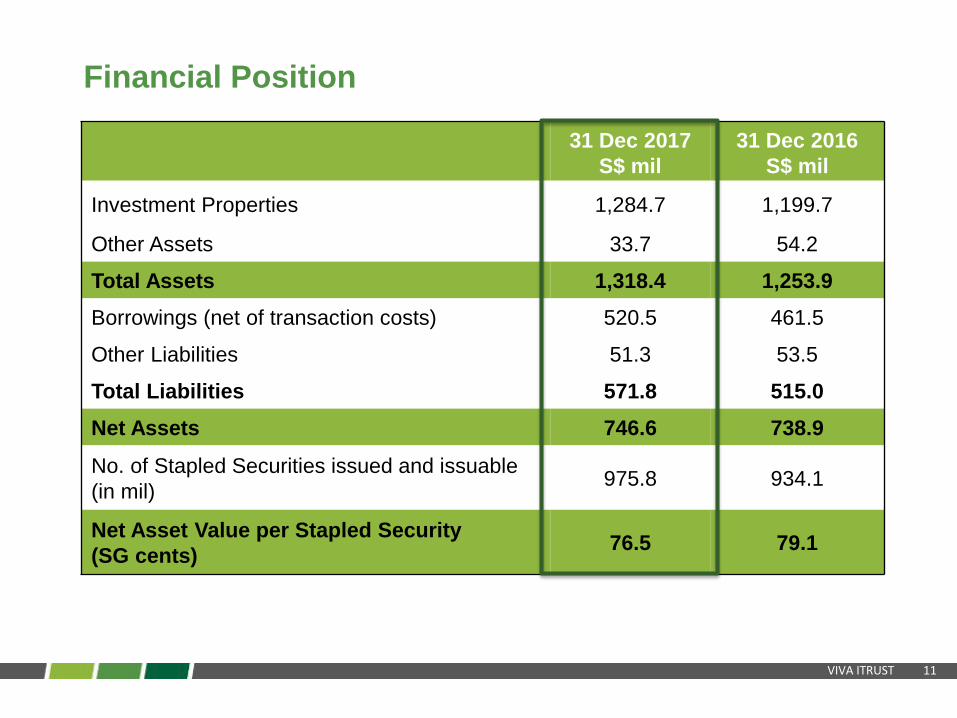
31 Dec 2017
S$ mil
31 Dec 2016
S$ mil
Investment Properties 1,284.7 1,199.7
Other Assets 33.7 54.2
Total Assets 1,318.4 1,253.9
Borrowings (net of transaction costs) 520.5 461.5
Other Liabilities 51.3 53.5
Total Liabilities 571.8 515.0
Net Assets 746.6 738.9
No. of Stapled Securities issued and issuable
(in mil)975.8 934.1
Net Asset Value per Stapled Security
(SG cents)76.5 79.1
Financial Position
VIVA ITRUST 12
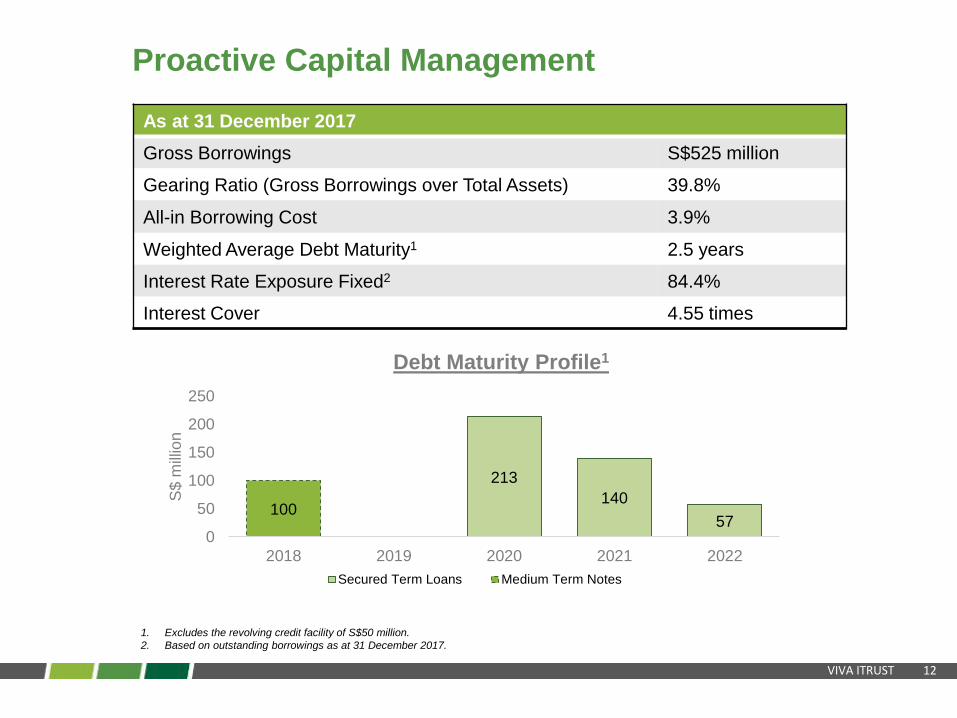
1. Excludes the revolving credit facility of S$50 million.
2. Based on outstanding borrowings as at 31 December 2017.
As at 31 December 2017
Gross Borrowings S$525 million
Gearing Ratio (Gross Borrowings over Total Assets) 39.8%
All-in Borrowing Cost 3.9%
Weighted Average Debt Maturity1 2.5 years
Interest Rate Exposure Fixed2 84.4%
Interest Cover 4.55 times
100
213
140
570
50
100
150
200
250
2018 2019 2020 2021 2022
S$
mill
ion
Debt Maturity Profile1
Secured Term Loans Medium Term Notes
Proactive Capital Management

VIVA ITRUST 13
Distribution Details
4Q2017 Distribution Details
Distribution Period 1 October 2017 – 31 December 2017
Distribution per Stapled Security
(Singapore cents)
1.857 comprising
(a) taxable income – 1.588
(b) tax exempt income – 0.269
Ex-Date 1 Feb 2018
Books Closure Date 5 Feb 2018
Distribution Payment Date 28 Feb 2018

VIVA ITRUST 14
Portfolio Update
VIVA ITRUST 15
Mauser Singapore
30 Pioneer Road
Viva Business Park
Home-Fix Building
11 Ubi Road 1
Jackson Design Hub
UE BizHub EAST
(Hotel & Business Park)
Business
Park
Properties
Light
Industrial
Properties
Logistics
Properties
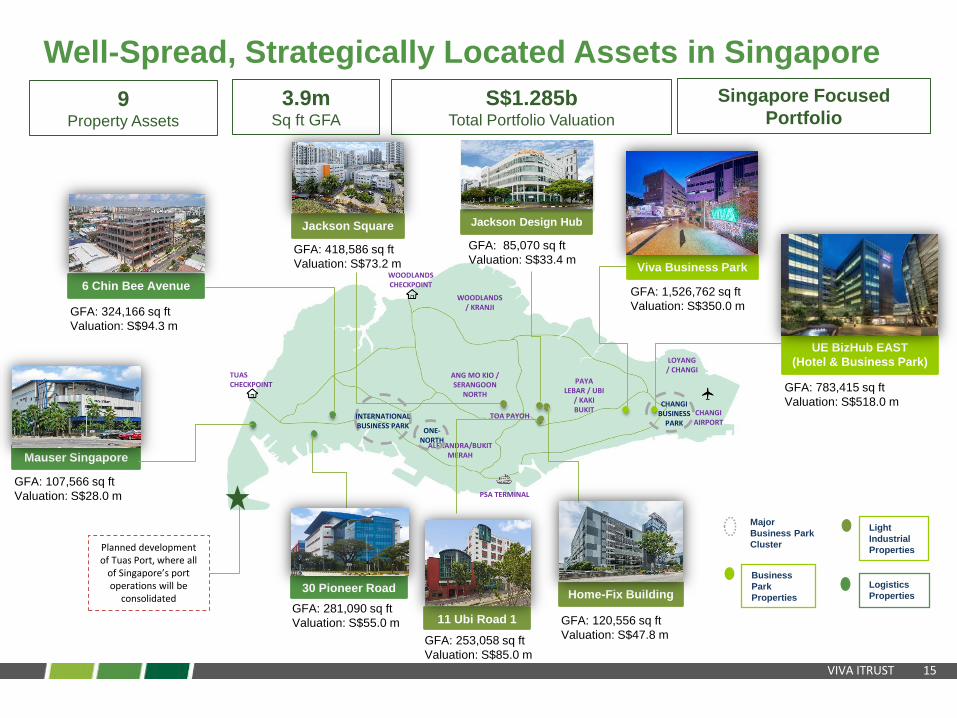
Well-Spread, Strategically Located Assets in Singapore
9Property Assets
3.9mSq ft GFA
S$1.285bTotal Portfolio Valuation
Singapore Focused
Portfolio
Major
Business Park
Cluster
TUAS CHECKPOINT
PSA TERMINAL
CHANGI AIRPORT
LOYANG / CHANGI
CHANGI BUSINESS
PARK
WOODLANDSCHECKPOINT
ONE-NORTH
WOODLANDS/ KRANJI
ANG MO KIO / SERANGOON
NORTH
TOA PAYOHINTERNATIONALBUSINESS PARK
6 Chin Bee Avenue
Planned development of Tuas Port, where all
of Singapore’s port operations will be
consolidated
Jackson Square
PAYA LEBAR / UBI
/ KAKI BUKIT
GFA: 324,166 sq ft
Valuation: S$94.3 m
GFA: 107,566 sq ft
Valuation: S$28.0 m
GFA: 418,586 sq ft
Valuation: S$73.2 m
GFA: 85,070 sq ft
Valuation: S$33.4 m
GFA: 1,526,762 sq ft
Valuation: S$350.0 m
GFA: 783,415 sq ft
Valuation: S$518.0 m
GFA: 281,090 sq ft
Valuation: S$55.0 m
GFA: 253,058 sq ft
Valuation: S$85.0 m
GFA: 120,556 sq ft
Valuation: S$47.8 m
VIVA ITRUST 16
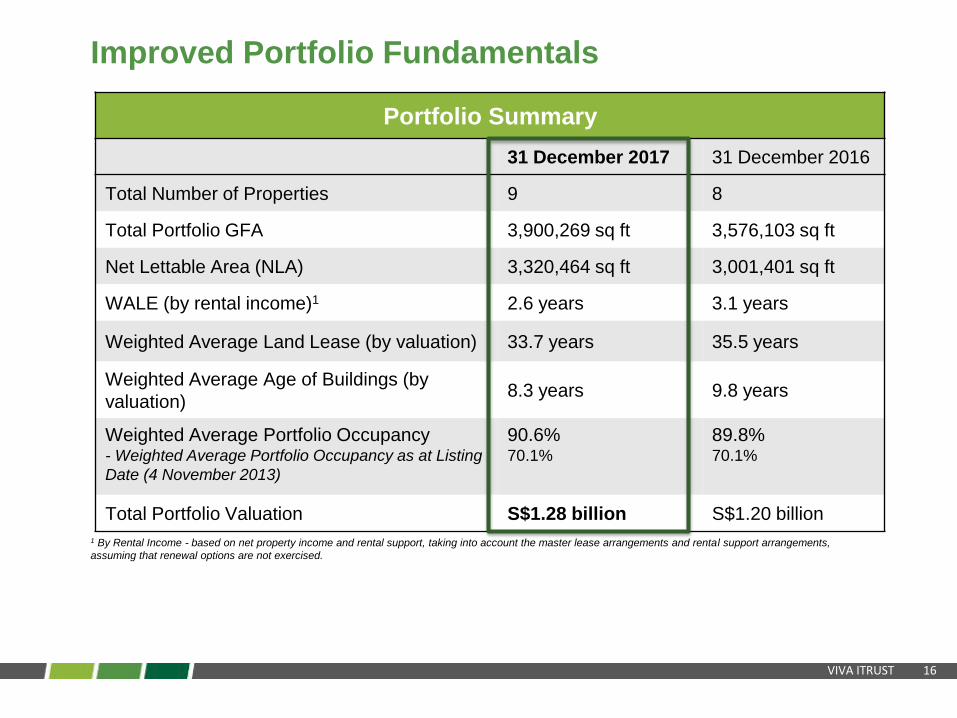
Portfolio Summary
31 December 2017 31 December 2016
Total Number of Properties 9 8
Total Portfolio GFA 3,900,269 sq ft 3,576,103 sq ft
Net Lettable Area (NLA) 3,320,464 sq ft 3,001,401 sq ft
WALE (by rental income)1 2.6 years 3.1 years
Weighted Average Land Lease (by valuation) 33.7 years 35.5 years
Weighted Average Age of Buildings (by
valuation)8.3 years 9.8 years
Weighted Average Portfolio Occupancy- Weighted Average Portfolio Occupancy as at Listing
Date (4 November 2013)
90.6%70.1%
89.8%70.1%
Total Portfolio Valuation S$1.28 billion S$1.20 billion
Improved Portfolio Fundamentals
1 By Rental Income - based on net property income and rental support, taking into account the master lease arrangements and rental support arrangements,
assuming that renewal options are not exercised.
VIVA ITRUST 17
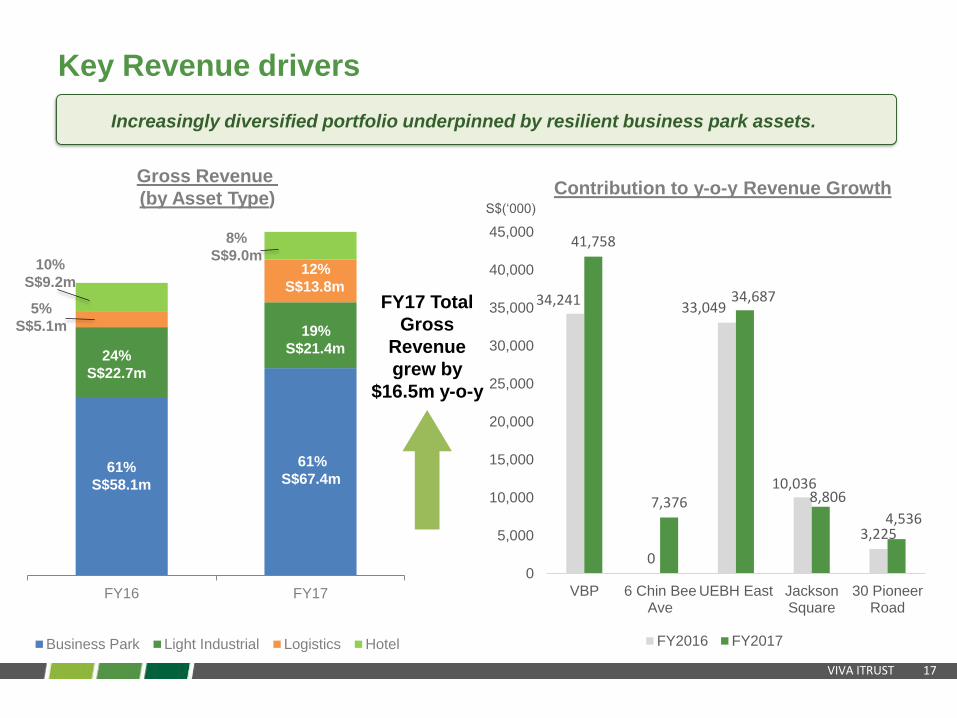
FY16 FY17
Business Park Light Industrial Logistics Hotel
Gross Revenue
(by Asset Type)
61%
S$67.4m
24%
S$22.7m
8%
S$9.0m12%
S$13.8m
19%
S$21.4m
61%
S$58.1m
5%
S$5.1m
10%
S$9.2m
Key Revenue drivers
Increasingly diversified portfolio underpinned by resilient business park assets.
FY17 Total
Gross
Revenue
grew by
$16.5m y-o-y
34,241
0
33,049
10,036
3,225
41,758
7,376
34,687
8,806
4,536
0
5,000
10,000
15,000
20,000
25,000
30,000
35,000
40,000
45,000
VBP 6 Chin BeeAve
UEBH East JacksonSquare
30 PioneerRoad
Contribution to y-o-y Revenue Growth
FY2016 FY2017
S$(‘000)
VIVA ITRUST 18
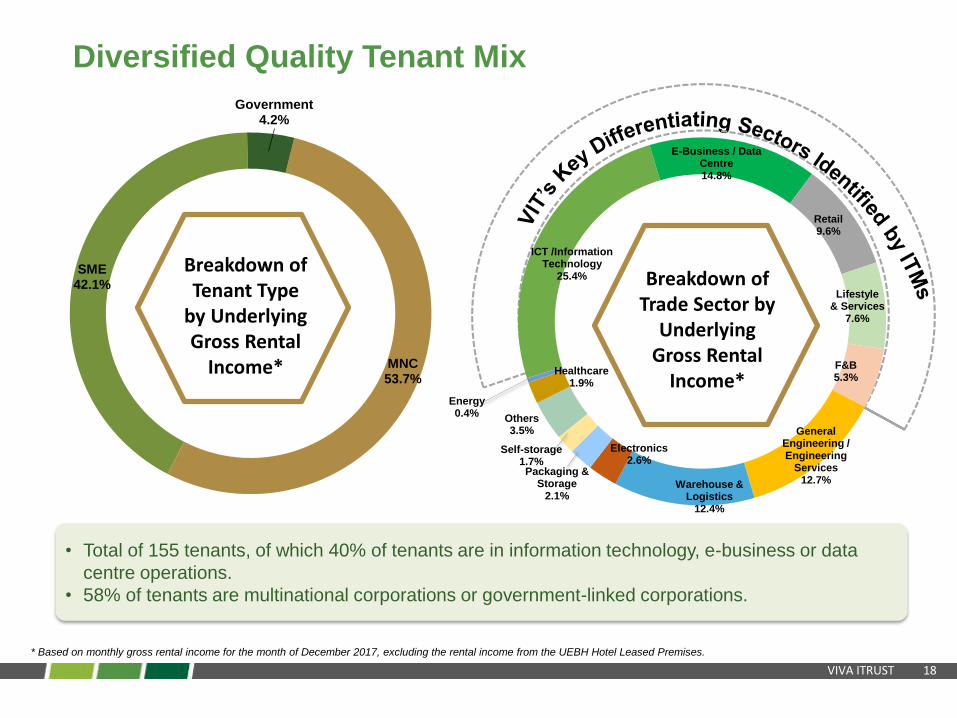
Diversified Quality Tenant Mix
* Based on monthly gross rental income for the month of December 2017, excluding the rental income from the UEBH Hotel Leased Premises.
• Total of 155 tenants, of which 40% of tenants are in information technology, e-business or data
centre operations.
• 58% of tenants are multinational corporations or government-linked corporations.
MNC53.7%
SME42.1%
Government4.2%
Breakdown of Tenant Type
by Underlying Gross Rental
Income*
ICT /Information Technology
25.4%
E-Business / Data Centre14.8%
Retail9.6%
Lifestyle & Services
7.6%
F&B5.3%
General Engineering / Engineering
Services12.7%Warehouse &
Logistics12.4%
Electronics2.6%
Packaging & Storage
2.1%
Self-storage1.7%
Others3.5%
Healthcare1.9%
Energy0.4%
Breakdown of Trade Sector by
Underlying Gross Rental
Income*

VIVA ITRUST 19
1 As at 31 December 2017, excluding United Engineers Developments Pte Ltd as lessee of the UEBH Hotel Leased Premises.
7.8%
6.1%
5.1%
4.6%
4.4%
3.6%
3.2%
3.1%
2.7%
2.4%
43.0%
Sharikat Logistics Pte Ltd
Cisco Systems (USA) Pte Ltd
Meiban Investment Pte Ltd
GKE Warehousing & Logistics Pte Ltd
1-Net Singapore Pte Ltd
NTUC Fairprice Co-operative Limited
Home-Fix D.I.Y Pte Ltd
Decathlon Singapore Pte Ltd
Johnson Controls (S) Pte Ltd
Pertama Mechandising Pte Ltd
Total
Diversified Quality Tenant Mix1
Top 10 tenants/sub-tenants account for 43% of monthly committed rental
income.
VIVA ITRUST 20
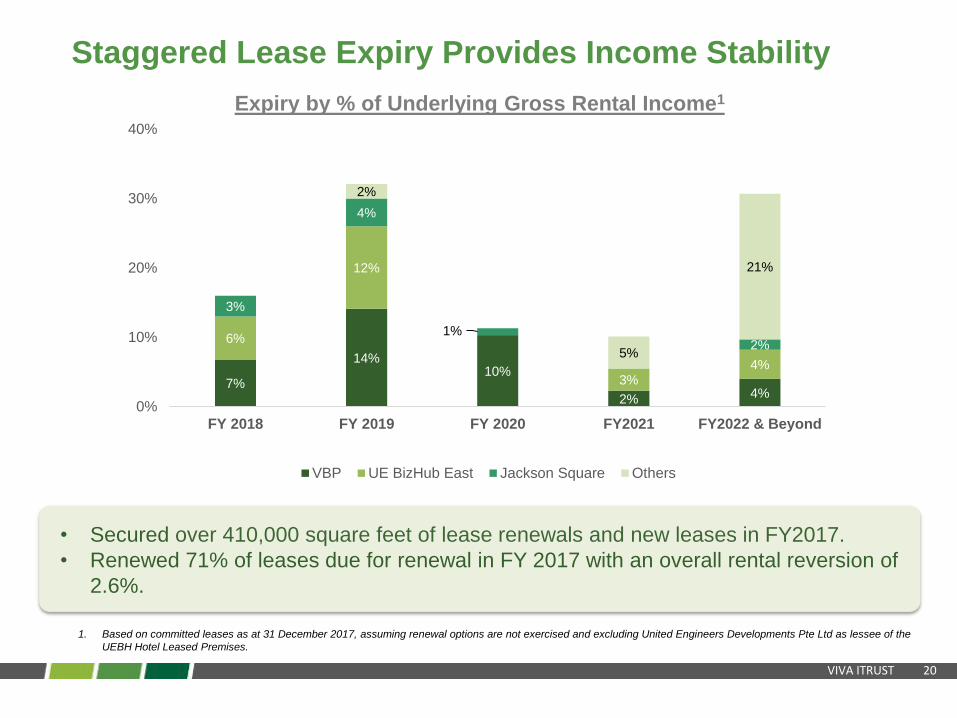
7%
14%10%
2% 4%
6%
12%
3%4%
3%
4%
1%2%
2%
5%
21%
0%
10%
20%
30%
40%
FY 2018 FY 2019 FY 2020 FY2021 FY2022 & Beyond
Expiry by % of Underlying Gross Rental Income1
VBP UE BizHub East Jackson Square Others
Staggered Lease Expiry Provides Income Stability
1. Based on committed leases as at 31 December 2017, assuming renewal options are not exercised and excluding United Engineers Developments Pte Ltd as lessee of the
UEBH Hotel Leased Premises.
• Secured over 410,000 square feet of lease renewals and new leases in FY2017.
• Renewed 71% of leases due for renewal in FY 2017 with an overall rental reversion of
2.6%.
VIVA ITRUST 21
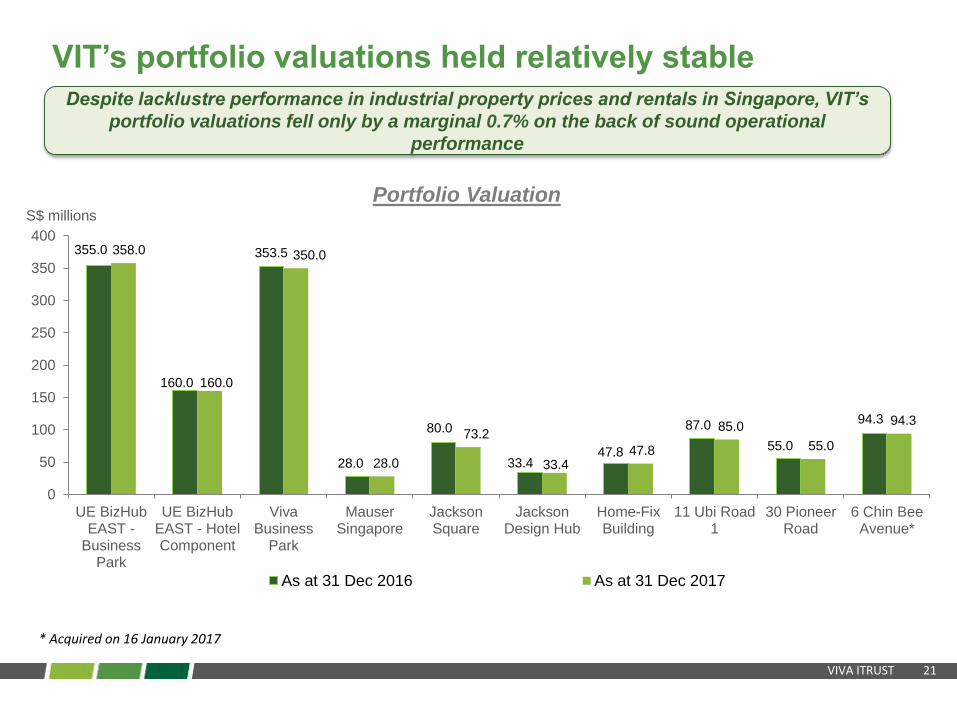
355.0
160.0
353.5
28.0
80.0
33.447.8
87.0
55.0
94.3
358.0
160.0
350.0
28.0
73.2
33.447.8
85.0
55.0
94.3
0
50
100
150
200
250
300
350
400
UE BizHubEAST -
BusinessPark
UE BizHubEAST - HotelComponent
VivaBusiness
Park
MauserSingapore
JacksonSquare
JacksonDesign Hub
Home-FixBuilding
11 Ubi Road1
30 PioneerRoad
6 Chin BeeAvenue*
Portfolio Valuation
As at 31 Dec 2016 As at 31 Dec 2017
* Acquired on 16 January 2017
VIT’s portfolio valuations held relatively stable
Despite lacklustre performance in industrial property prices and rentals in Singapore, VIT’s
portfolio valuations fell only by a marginal 0.7% on the back of sound operational
performance
S$ millions

VIVA ITRUST 22
Outlook & Strategic Focus
VIVA ITRUST 23
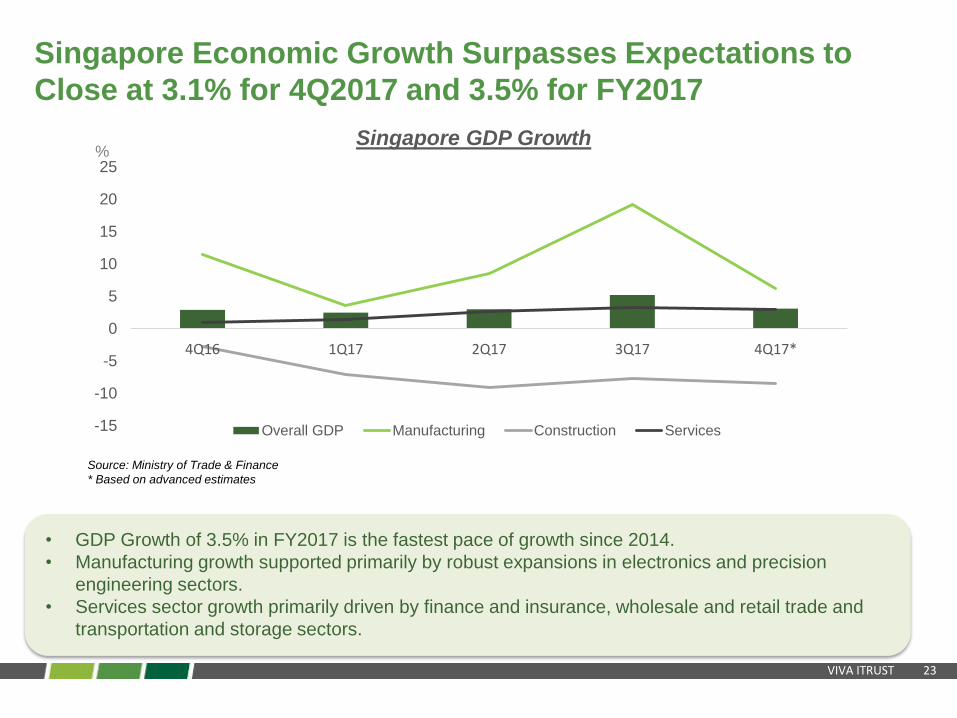
%
• GDP Growth of 3.5% in FY2017 is the fastest pace of growth since 2014.
• Manufacturing growth supported primarily by robust expansions in electronics and precision
engineering sectors.
• Services sector growth primarily driven by finance and insurance, wholesale and retail trade and
transportation and storage sectors.
Source: Ministry of Trade & Finance
* Based on advanced estimates
-15
-10
-5
0
5
10
15
20
25
4Q16 1Q17 2Q17 3Q17 4Q17*
Singapore GDP Growth
Overall GDP Manufacturing Construction Services
Singapore Economic Growth Surpasses Expectations to
Close at 3.1% for 4Q2017 and 3.5% for FY2017
VIVA ITRUST 24
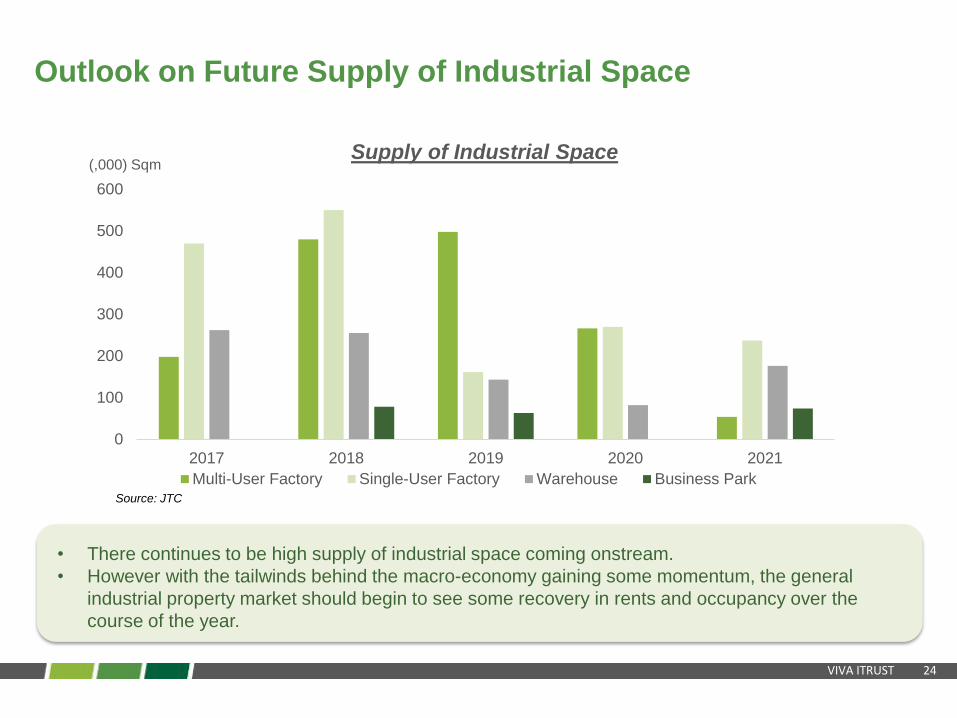
0
100
200
300
400
500
600
2017 2018 2019 2020 2021
Supply of Industrial Space
Multi-User Factory Single-User Factory Warehouse Business Park
Outlook on Future Supply of Industrial Space
• There continues to be high supply of industrial space coming onstream.
• However with the tailwinds behind the macro-economy gaining some momentum, the general
industrial property market should begin to see some recovery in rents and occupancy over the
course of the year.
Source: JTC
(,000) Sqm
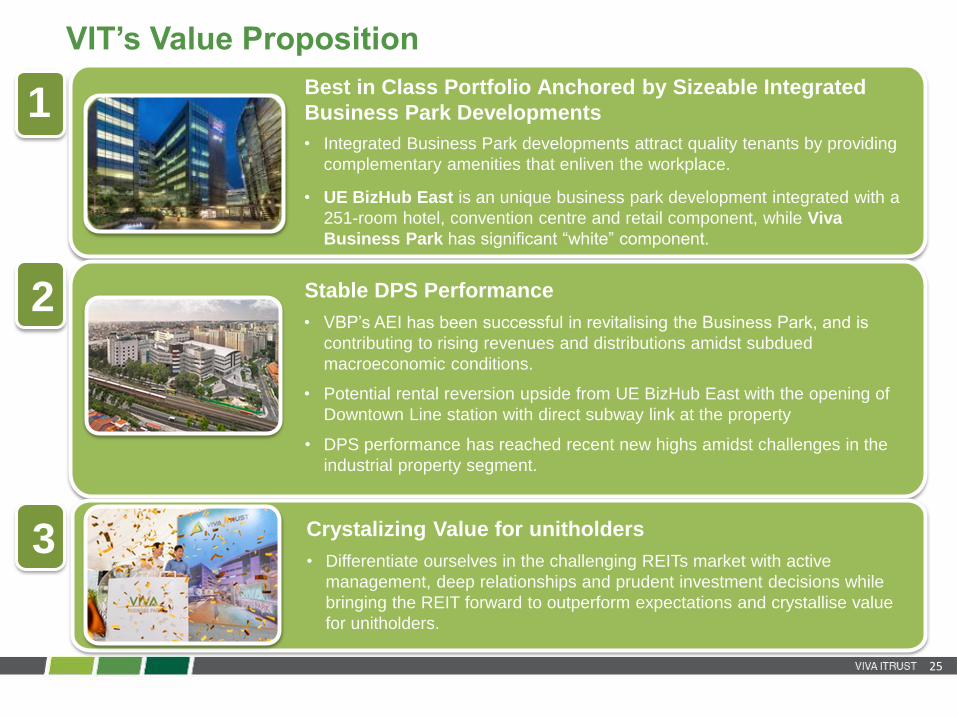
VIT’s Value Proposition
25
Best in Class Portfolio Anchored by Sizeable Integrated
Business Park Developments
• Integrated Business Park developments attract quality tenants by providing
complementary amenities that enliven the workplace.
• UE BizHub East is an unique business park development integrated with a
251-room hotel, convention centre and retail component, while Viva
Business Park has significant “white” component.
Stable DPS Performance
• VBP’s AEI has been successful in revitalising the Business Park, and is
contributing to rising revenues and distributions amidst subdued
macroeconomic conditions.
• Potential rental reversion upside from UE BizHub East with the opening of
Downtown Line station with direct subway link at the property
• DPS performance has reached recent new highs amidst challenges in the
industrial property segment.
Crystalizing Value for unitholders
• Differentiate ourselves in the challenging REITs market with active
management, deep relationships and prudent investment decisions while
bringing the REIT forward to outperform expectations and crystallise value
for unitholders.
1
2
3

Thank you