Embed Size (px)
Citation preview
4Q20 and 2020 Results
1
VITRU LIMITED
Announces Fourth Quarter and Full Year 2020 Financial Results
4Q20 and 2020 Results
2
Florianopolis, Brazil, March 31, 2021 – Vitru Limited, or Vitru (Nasdaq: VTRU), leading pure digital
education group in the post-secondary digital education market in Brazil, today reported financial and operating results for the three and 12 months period ended December 31, 2020 (fourth quarter 2020 or 4Q20 and full year of 2020 or 2020). Financial results are expressed in Brazilian Reais and are presented in accordance with International Financial Reporting Standards (IFRS). Vitru operates its hubs under the UNIASSELVI brand with almost 302 thousand students in digital education undergraduate and graduate courses, more than 3.5 thousand tutors and 709 hubs distributed throughout Brazil.
Vitru’s 2020 financial results boosted by a strong organic growth, market
share increases and high-quality indicators, which drove Adjusted EBITDA up 25%
To our shareholders
Pedro Graça, Vitru’s CEO, commented: “We are delighted that our full year results confirm our ability
to deliver continued and sustainable growth despite all the challenges brought about by SARS COVID-
19.
It has been a challenging year for most industries, including education, as well to ourselves as citizens.
And I am very proud of the positive attitude and outstanding response of Vitru’s great team to keep
providing a quality education experience and unparallel value proposition for our students.
Looking back to the beginning of 2020, it is possible to see how promptly Vitru adapted its processes
and platforms to provide the necessary infrastructure to continue offering its hybrid classes, while at
the same time the hubs, tutors and academic professionals stepped up to meet the challenges imposed
by the pandemic.
This quick response is part of Vitru’s DNA. The disruptive hybrid student-centric model - which
emphasizes flexibility, affordability and a strong relationship with all stakeholders engaged in our
platform - is proving to be a successful strategy and delivering consistent growth across key academic,
operating and financial metrics.
Vitru ended 2020 with 310 thousand enrolled students– 97% of them in digital education –
representing a 28.5% growth over 2019 students base. Intake in our core business (Digital Education
- or DE – Undergraduate) reached 132.0 thousand new students in the first half of 2020 and 109.4
thousand new students in the second half of the year, an increase of 30% and 40%, respectively when
compared to the corresponding intake cycles of 2019. These increases, combined with the continued
maturation of our hubs, have driven the 26% year over year growth in the Net Revenue of the Digital
Education Undergraduate segment in 2020. Moreover, the Consolidated Adjusted EBITDA margin
increased to 28.2% in 2020 vs 25.5% in 2019, given the continued improvement of our operational
leverage.
Importantly, 2020 was a year with plenty of milestones to be celebrated. In September 2020, Vitru
completed its initial public offering (IPO), becoming the sixth company in Brazil to have its shares
traded on the Nasdaq Stock Exchange in the United States. Through a primary offering we raised
US$96 million, which will be directed mainly to fund inorganic growth opportunities.
We have also developed and launched a new version of our Digital Platform for Content Delivery,
aiming at improving even further the user’s experience, including through certain adaptative learning
concepts. Our Leo app, which provides full mobile access for our students, was also upgraded
throughout last year to bring even more flexibility and optionality in the academic journey. All our
digital content is available in this mobile-friendly platform, in which the student has integrated support
through WhatsApp and can also perform administrative and transactional tasks related to their studies.
Besides, the internet access is paid by Uniasselvi, so the student has no additional cost to exploit the
full capacity of the new Leo app.

4Q20 and 2020 Results
3
In October, the most recent post-secondary education census was released by the Brazilian Ministry
of Education (MEC), with figures as of 2019. It has confirmed that, in 2019, Vitru was the #1 pure
distance learning education group in the private post-secondary distance learning education market
in Brazil for the second consecutive year, with a market share of 12.3% (up from 10.8% in 2018).
The compound annual growth rate (CAGR) of the post-secondary distance learning education private
market between 2016 and 2019 was 18.7%, while Vitru’s CAGR was 41.9% in the same period, i.e.
more than twice the market’s growth rate, which highlights the strength of our academic value
proposition and our team’s outstanding execution. The continued expansion within the DE segment –
in all Brazilian regions - is fully aligned with our core strategy, as we seek to increase market share in
an asset-light segment which will drive profitability through scale.
As a reminder, MEC has granted us a CI1 score of five, which is the highest score possible. Moreover,
in October 2020 MEC announced that our average IDD2 increased from 3.08 to 3.33, while the
average of digital education private institutions shrank from 2.78 to 2.63 in the same period, which
means that Vitru’s average IDD is now 26.8% above the market’s average, confirming the higher
value proposition for our students.
Likewise, we are very pleased with the results of the annual survey conducted by Great Place to Work
(GPTW) on the satisfaction level of our employees, released in November 2020. The survey revealed
that in 2020 we reached an overall score of 86 on a scale of 0 to 100, our highest level to date. This
significant accomplishment validates our people-oriented culture, which is paramount in the segments
we operate.
We have also been structuring initiatives that enhance our product offerings and distribution channels,
thereby accelerating our organic growth even further. In this sense, in early 2021 we announced
important developments, including a pilot project to offer technical courses and a partnership with
Brazilian gym chain Smart Fit, the largest network of gym centers in Latin America. The technical
courses project is part of the Vitru’s strategy to expand complementary offerings throughout the
students’ lifelong journey, providing an opportunity for students to follow a certificate program
(technical courses) in parallel with high school studies or prior to their enrollment in an undergraduate
degree. As part of the first phase of a pilot project, there are three technical courses already authorized
and being offered at ten hubs located in certain states of Brazil. On top of an additional revenue
source, this initiative can contribute to a dilution of our customers acquisition cost, as these students
may extend their learning journey with the pursuit of an undergraduate degree afterwards. Regarding
the partnership with Smart Fit, Uniasselvi will become the post-secondary institution responsible for
certifying the Fitness continuing education course that Smart Fit offers to its employees. In addition,
Uniasselvi's Physical Education undergraduate courses - in hybrid digital model and intended for the
general public - are now offered in partnership with Smart Fit within preset units.
As we look forward to 2021, we will remain focused on delivering our mission and positively impacting
the lives of hundreds of thousands of Brazilians, while improving operational and financial metrics.
Although the uncertainties of Covid-19 pandemic are still present, and they continue to demand quick
decision making, the Vitru team has the strength and confidence needed to keep delivering a superior
performance. The preliminary numbers regarding the intake process for the first half of 2021 are
strong, confirming the attractiveness of our academic model and the attributes of our brand.
Furthermore, our focus in also on the selective pursuit of M&A opportunities aligned with the stated
use of proceeds of our primary offering in the IPO. Finally, it is now clearer than ever that the Digital
Education segment in Brazil is at a tipping point, with increased market prospects going forward given
the changes, accelerated by the pandemic, in the customer’s digital habits and preferences. With our
strategic focus, a disciplined capital allocation mindset and purposeful actions, Vitru could not be
better positioned to grow even further in 2021.
1 CI or Institutional Concept is a quality indicator for postsecondary education institutions measured and published by the MEC through evaluations that comprise educational organization aspects, such as institutional planning and development, academic and management subjects. The CI score has a scale of 1 to 5.
2 The IDD is intended to provide a reference of the real added value of the post-secondary studies to the development of each student, as it compares the results of a standard evaluation taken at the end of high school with the performance of the same student at college graduation.

4Q20 and 2020 Results
4
CONFERENCE CALL AND WEBCAST INFORMATION Vitru will discuss its fourth quarter 2020 results via conference call.
When: Wednesday, March 31th, 2021 at 4:30 p.m. ET (5:30 p.m. BR).
Dial-in: +(833) 614-1391 (U.S. Toll-Free); +1 (914) 987-7112 (International).
Conference ID: 8152378. Webcast: https://investors.vitru.com.br/ Replay: available at our website.
Carlos Freitas Chief Financial and Investor Relations Officer
Maria Carolina de Freitas Gonçalves Investor Relations Manager
Investor Relations Contact [email protected]

4Q20 and 2020 Results
5
4Q20 and 2020 highlights
▪ Launch of the new Digital Platform for Content Delivery, improving the
student experience;
▪ Partnership with Smart Fit, the largest network of fitness clubs in Latin America,
enriching the course offering in physical education degree;
▪ Launch of a pilot project in technical courses, a promising growth avenue;
▪ Almost 302 thousand digital education students;
▪ A healthy average ticket in the DE Undergraduate segment of R$ 263.6 per student
in 2H20, up 3.5% when compared to 2H19, despite the COVID-19 challenges;
▪ Net revenue in the core DE Undergraduate business increasing 33.2% in 4Q20 vs
4Q19, with Consolidated Net Revenues up 16.5%;
▪ Consolidated Adjusted EBITDA up 24.7% for full year 2020 vs 2019, with Adjusted
EBITDA Margin increasing 2.7 percentage points (p.p.) to 28.2% in 2020;
▪ Adjusted Net Income up 70.2% for full year 2020 vs 2019;
▪ Cash Flow from Operations of R$ 141.6 million in 2020, with a solid improvement
to 88.2% in Adjusted Cash Flow Conversion from Operations (vs 75.4% in 2019).
Table 1: Key financial highlights
R$ million (except otherwise stated)
4Q19 4Q20 % Chg 2019 2020 % Chg
Net Revenue 117.2 136.5 16.5% 461.1 519.2 12.6%
DE Undergraduate Net Revenue 85.4 113.7 33.2% 336.3 423.0 25.8%
Adjusted EBITDA1 19.6 39.2 100.0% 117.6 146.6 24.7%
Adjusted EBITDA Margin 16.7% 28.7% 12.0pp 25.5% 28.2% 2.7pp
Adjusted Net Income2 3.8 19.0 399.0% 57.7 98.2 70.2%
Cash flow from operations 14.6 22.0 50.7% 98.0 141.6 44.5%
Adjusted cash flow conversion from operations3
59.3% 45.3% -14.0pp 75.4% 88.2% 12.8 pp
(1) For a reconciliation of Adjusted EBITDA see “—Reconciliations of Non-GAAP Financial Measures—Reconciliation between Adjusted
EBITDA” at the end of this document. Please refer as well to section “Net impairment losses on financial assets” for more explanations
on the Adjusted EBITDA variations between 2019 and 2020.
(2) For a reconciliation of Adjusted Net Income, see “—Reconciliations of Non-GAAP Financial Measures—Reconciliation of Adjusted Net
Income” at the end of this document.
(3) For a reconciliation of Adjusted Cash Flow Conversion from Operations, see “—Reconciliations of Non-GAAP Financial Measures—
Reconciliation of Adjusted Cash Flow Conversion from Operations” at the end of this document.

4Q20 and 2020 Results
6
Businesses Seasonality
Vitru’s digital education undergraduate courses are structured around separate monthly modules. This
enables students to enroll in digital education courses at any time during a semester. Despite this
flexibility, Vitru generally experiences a higher number of enrollments in the first semester of each
year than in the second semester of each year, due to the high school calendar in Brazil, where classes
conclude in December. New enrollments in Digital Education Undergraduate courses are concentrated
in the 1st and 3rd quarters (beginning of academic semesters in Brazil).
The seasonality in enrollments has a direct impact on revenues. In addition, Vitru generally records
higher revenue in the second and fourth quarters of each year reflecting the impact of the dynamics
of the intake cycle.
Additionally, a significant portion of expenses are also seasonal. For example, due to the nature of the
intake cycle, a relevant amount of selling and marketing expenses are incurred in connection with the
first semester intake, particularly in the first quarter of each year.
Below is the breakdown of the consolidated Adj. EBITDA and the intake of the Digital Education
Undergraduate segment over the past four quarters of the financial years ended on December 31,
2019 and 2020:
4Q20 and 2020 Results
7
OPERATING RESULTS
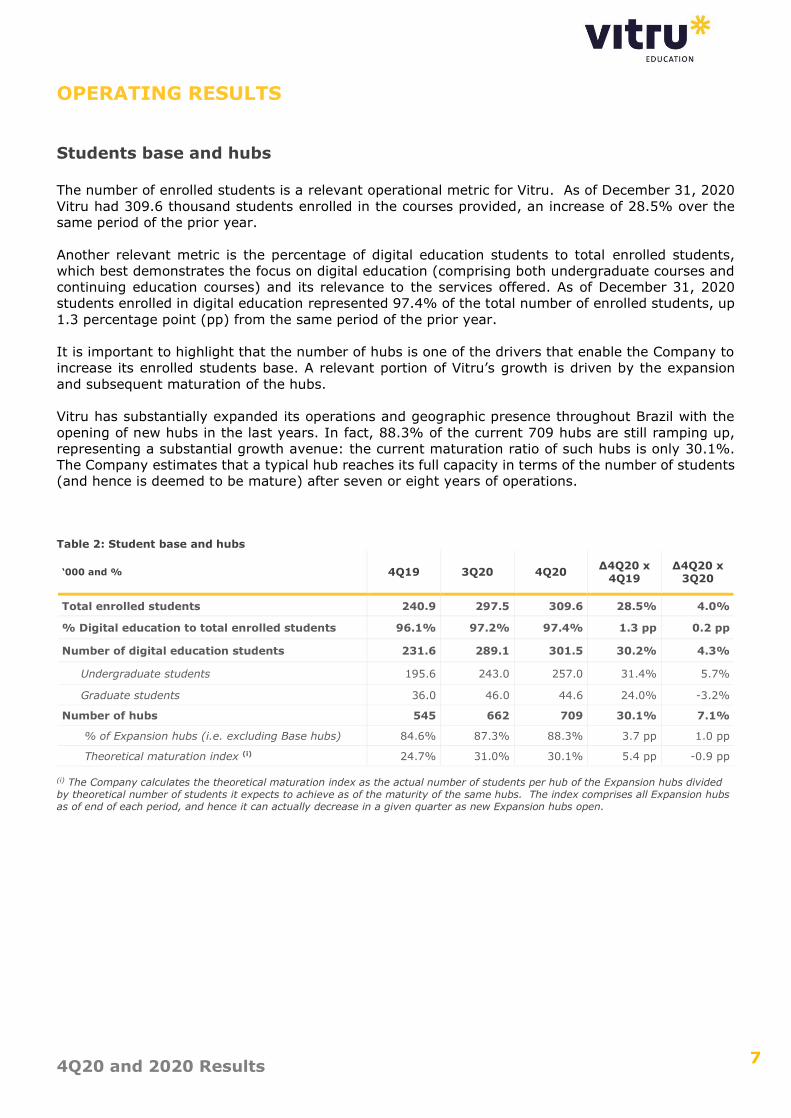
Students base and hubs The number of enrolled students is a relevant operational metric for Vitru. As of December 31, 2020
Vitru had 309.6 thousand students enrolled in the courses provided, an increase of 28.5% over the
same period of the prior year.
Another relevant metric is the percentage of digital education students to total enrolled students,
which best demonstrates the focus on digital education (comprising both undergraduate courses and
continuing education courses) and its relevance to the services offered. As of December 31, 2020
students enrolled in digital education represented 97.4% of the total number of enrolled students, up
1.3 percentage point (pp) from the same period of the prior year.
It is important to highlight that the number of hubs is one of the drivers that enable the Company to
increase its enrolled students base. A relevant portion of Vitru’s growth is driven by the expansion
and subsequent maturation of the hubs.
Vitru has substantially expanded its operations and geographic presence throughout Brazil with the
opening of new hubs in the last years. In fact, 88.3% of the current 709 hubs are still ramping up,
representing a substantial growth avenue: the current maturation ratio of such hubs is only 30.1%.
The Company estimates that a typical hub reaches its full capacity in terms of the number of students
(and hence is deemed to be mature) after seven or eight years of operations.
Table 2: Student base and hubs
‘000 and % 4Q19 3Q20 4Q20 Δ4Q20 x
4Q19 Δ4Q20 x
3Q20
Total enrolled students 240.9 297.5 309.6 28.5% 4.0%
% Digital education to total enrolled students 96.1% 97.2% 97.4% 1.3 pp 0.2 pp
Number of digital education students 231.6 289.1 301.5 30.2% 4.3%
Undergraduate students 195.6 243.0 257.0 31.4% 5.7%
Graduate students 36.0 46.0 44.6 24.0% -3.2%
Number of hubs 545 662 709 30.1% 7.1%
% of Expansion hubs (i.e. excluding Base hubs) 84.6% 87.3% 88.3% 3.7 pp 1.0 pp
Theoretical maturation index (i) 24.7% 31.0% 30.1% 5.4 pp -0.9 pp
(i) The Company calculates the theoretical maturation index as the actual number of students per hub of the Expansion hubs divided by theoretical number of students it expects to achieve as of the maturity of the same hubs. The index comprises all Expansion hubs as of end of each period, and hence it can actually decrease in a given quarter as new Expansion hubs open.

4Q20 and 2020 Results
8
Tuition and Ticket Table 3: Tuitions and ticket
4Q19 4Q20 % Chg 2019 2020 % Chg
Digital Education Undergraduate Tuitions (R$ MM) (i)
130.9 177.4 35.5% 522.7 670.2 28.2%
Average Ticket DE undergraduate (R$/month) (ii) 254.6 263.6 3.5% n.a. n.a. n.a.
(i) The tuitions are net of cancellations (ii) In the end of the second semester, the Company calculates the “Average Ticket DE undergraduate (R$/month)” as the sum of the Digital Education Undergraduate Tuitions net of cancellations of the semester divided by the average number of students at the end of the semester and the number of students at the beginning of the semester adjusted by the sum of non-renovation student base.
The compelling strength and sustainability of Vitru’s growth and the maturation of its hubs can be
demonstrated by the total amount charged as courses tuition from digital education undergraduate
students (which is the sum of gross revenue and the hub partners’ portion of the tuition less other
academic revenue and cancellations).
DE Undergraduate tuitions for 4Q20 amounted to R$177.4 million, 35.5% higher than the R$130.9
million recorded in 4Q19, reflecting the maturation and increase in the number of hubs. For 2020, DE
Undergraduate tuitions totaled R$ 670.2 million, 28.2% higher than the R$ 522.7 million in the same
period of the previous year, reflecting mostly the organic increase in the number of students enrolled
in digital education undergraduate courses.
The average monthly ticket of Digital Education Undergraduate courses increased 3.5%, from R$254.6
in 2H19 to R$ 263.6 in 2H20. This growth of average ticket in DE Undergraduate, despite the
substantial increase in the number of new students (which enroll throughout the intaking period and
hence “dilute” the average ticket), confirms the strength of the UNIASSELVI brand, its market
positioning and its differentiated hybrid model. Average tickets are presented by semester to reflect
the academic calendar, which is built on a semester basis.
FINANCIAL RESULTS
Net Revenue
Consolidated Net Revenue in 4Q20 was R$136.5 million, up 16.5% from 4Q19. For 2020, Consolidated
Net Revenue was R$519.2 million, an increase of 12.6% over the prior year. This organic growth was

4Q20 and 2020 Results
9
driven by the increase in the number of enrolled students in the Digital Education undergraduate
segment.
Net Revenue Breakdown (%)
Net Revenue from digital education undergraduate courses in 4Q20 was R$113.7 million, up 33.2%
from R$85.4 million in 4Q19, solely on an organic basis. For 2020, Net Revenue from digital education
undergraduate courses was R$423.0 million, up 25.8% from R$336.3 million in the previous year.
This achievement was primarily driven by the 35.5% increase in the student base, as a result of the
aforementioned expansion and maturation in operational hubs.
Net Revenue from continuing education courses for 4Q20 was R$10.6 million, down 21.0% from
R$13.4 million in 4Q19. Net Revenue for 2020 was R$40.6 million, down 13.8% from R$47.1 million
in 2019. In 2019 the Company secured certain timely revenues, including some public-bidding
contracts for the development of lifelong specialization courses. These processes were significantly
reduced by local governments as a consequence of the COVID-19 pandemic, therefore impacting these
revenues in 2020. Furthermore, the intake process of graduate courses was negatively impacted
throughout the year by the restrictions related to the pandemic, as the hubs (that play a relevant role
as sales channel) were closed for most of the period. Nevertheless, it is important to highlight that
the recent intake run-rate numbers provide more promising perspectives for this segment.
Net Revenue from on-campus undergraduate courses in 4Q20 amounted to R$12.2 million, a decrease
of 33.6% from R$18.3 million in 4Q19. Net Revenue for 2020 was R$55.6 million, down 28.4% from
R$77.6 million in 2019. The decrease was primarily attributable to the ongoing shift to digital education
as a whole, as a result of the increased number and attractiveness of digital education undergraduate
courses, a trend that accelerated due to the COVID-19 pandemic. The decline in the on-campus
performance is in line with the Company’s expectation that the contribution and relevance of this
segment to consolidated results will continue decreasing over time.
Table 4: Net Revenue Breakdown
R$ million 4Q19 4Q20 % Chg 2019 2020 % Chg
Digital education undergraduate 85.4 113.7 33.2% 336.3 423.0 25.8%
Continuing education 13.4 10.6 -21.0% 47.1 40.6 -13.8%
On-campus undergraduate 18.3 12.2 -33.6% 77.6 55.6 -28.4%
Net Revenue 117.2 136.5 16.5% 461.1 519.2 12.6%
4Q20 and 2020 Results
10
Cost of Services
Cost of services in 4Q20 amounted to R$56.7 million, 13.2% higher than the R$50.1 million reported
in 4Q19. Cost of services includes certain one-time restructuring costs as well as depreciation and
amortization expenses, which were R$11.2 million in 4Q20 and R$7.2 million in 4Q19.
Cost of services as reported in the Adjusted EBITDA calculation was R$45.5 million in 4Q20 and R$42.9
million in 4Q19, representing a year-over-year increase of 6.1%, but a decrease of 3.3 p.p. as a
percentage of Net Revenue in each period. This decrease was primarily attributable to optimizations
in personnel costs.
Table 5: Cost of Services
R$ million 4Q19 4Q20 % Chg 2019 2020 % Chg
Cost of Services 50.1 56.7 13.2% 211.6 221.5 4.7%
(-) Depreciation and amortization (6.8) (10.2) 50.0% (24.9) (36.8) 47.8%
(-) Impairment of non-current assets (0.2) - n.a. (0.2) - n.a.
(-) Restructuring expenses (0.2) (1.0) 400.0% (4.5) (4.3) -4.4%
Cost of Services for Adj. EBITDA calculation 42.9 45.5 6.1% 182.0 180.4 -0.9%
as % of Net Revenue 36.6% 33.3% -3.3 pp 39.5% 34.7% -4.8 pp
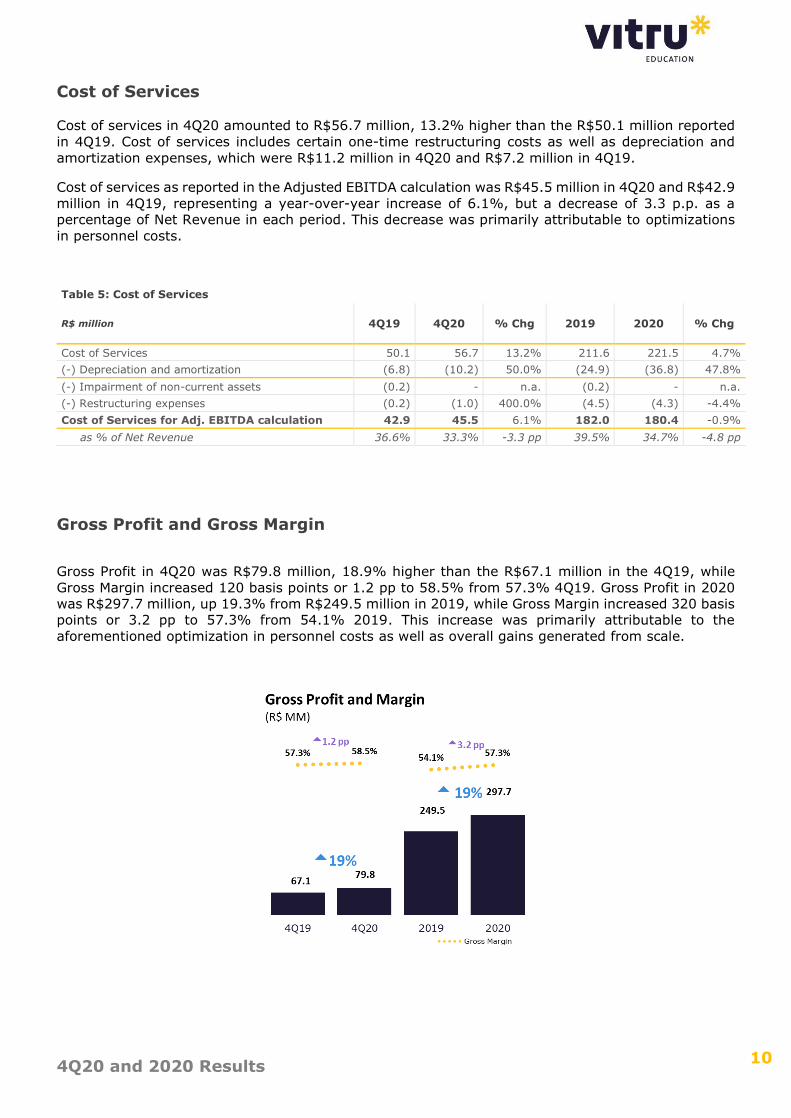
Gross Profit and Gross Margin
Gross Profit in 4Q20 was R$79.8 million, 18.9% higher than the R$67.1 million in the 4Q19, while
Gross Margin increased 120 basis points or 1.2 pp to 58.5% from 57.3% 4Q19. Gross Profit in 2020
was R$297.7 million, up 19.3% from R$249.5 million in 2019, while Gross Margin increased 320 basis
points or 3.2 pp to 57.3% from 54.1% 2019. This increase was primarily attributable to the
aforementioned optimization in personnel costs as well as overall gains generated from scale.

4Q20 and 2020 Results
11
Operating Expenses
SG&A Expenses
Selling expenses in 4Q20 were R$19.1 million, a decrease of R$14.6 million, or 43.3%, compared to
4Q19. This decrease was primarily attributable to depreciation and amortization expenses and
impairment of non-current assets during 4Q19. Selling expenses were 14.3% lower in 2020 (R$86.6
million) vs 2019 (R$101.0 million).
Selling expenses as reported in the Adjusted EBITDA calculation (i.e. excluding the aforementioned
depreciation and amortization expenses and impairment of non-current assets) were R$19.1 million
in 4Q20 and R$19.9 million in 4Q19 representing a YoY decrease of 4.0%. Selling expenses were
R$83.3 million and R$68.6 million in 2020 and 2019 respectively, equivalent to a YoY increase of
21.4%.
Table 6: Selling expenses
R$ million 4Q19 4Q20 % Chg 2019 2020 % Chg
Selling expenses 33.7 19.1 -43.3% 101.0 86.6 -14.3%
(-) Depreciation and amortization expenses (6.2) - n.a. (24.8) (3.3) -86.7%
(-) Impairment of non-current assets (7.6) - n.a. (7.6) - n.a.
Selling expenses for Adj. EBITDA calculation 19.9 19.1 -4.0% 68.6 83.3 21.4%
as % of Net Revenue 17.0% 14.0% -3.0 pp 14.9% 16.0% 1.1 pp
The full year increase is attributable to the strong growth in Digital Education in 2020 (as most of the
Selling Expenses is aimed at attracting new students for the DE Undergraduate segment) as well as
higher expenses with online advertising as a response the challenges related to the COVID-19
pandemic, when the hubs (an important channel in the Company’s sales process) were mostly closed.
Nevertheless, despite these issues, the Customer Acquisition Cost (CAC) decreased 9.4% in 2020 to
R$345 per new student in the DE Undergraduate segment, compared to R$381 per new student in
2019, as provided in the table below:
Table 7: Customer Acquisition Costs
R$ million 2S19 2S20 % Chg 2019 2020 % Chg
Selling expenses for Adj. EBITDA calculation 33.2 36.6 10.2% 68.6 83.3 21.4%
Number of intake students (DE Undergraduate) 78.2 109.4 39.8% 180.2 241.4 34.0%
Selling expenses per intake in the period (CAC) 424.4 334.6 -21.2% 380.8 345.1 -9.4%
Reported General and Administrative (G&A) expenses in 4Q20 were R$47.8 million, a decrease of
R$15.8 million, or 33.1%, compared to 4Q19. Fourth quarter 2019 was negatively impacted mostly
by expenses related to our share-based compensation plan and one-time impairment charges of non-
current assets (the on-campus segment). For full year 2020, G&A expenses were 41.0% lower than
2019, primarily due to one-time impairment charges of R$43.2 million for non-current assets (the on-
campus segment) taken in 2019.
G&A expenses as reported in the Adjusted EBITDA calculation were R$15.6 million in 4Q20 and R$10.1
million in 4Q19, representing an increase of 54.5%. This increase was mostly due to a higher provision
incurred in 4Q20 for the full 2020 bonus, in line with our annual variable compensation plan. Regarding
2020, Adjusted G&A expenses were R$47.7 million compared with R$43.0 million in 2019 and Adjusted

4Q20 and 2020 Results
12
G&A expenses as a percentage of Net Revenue were 9.2% in 2020, a decrease of 0.1 pp compared to
9.3% in 2019.
Table 8: G&A expenses
R$ million 4Q19 4Q20 % Chg 2019 2020 % Chg
General and Administrative (G&A) expenses 47.8 32.0 -33.1% 125.3 73.9 -41.0%
(-) Depreciation and amortization expenses (3.3) (3.9) 18.2% (12.7) (11.4) -10.2%
(-) Share-based compensation plan (22.6) (11.4) -49.6% (26.4) (11.9) -54.9%
(-) Impairment of non-current assets (11.8) - n.a. (43.2) - n.a.
(-) Restructuring, M&A and pre-offering expenses
- (1.1) n.a. - (2.9) n.a.
G&A expenses for Adj. EBITDA calculation 10.1 15.6 54.5% 43.0 47.7 10.9%
as % of Net Revenue 8.6% 11.4% 2.8 pp 9.3% 9.2% -0.1 pp
Net impairment losses on financial assets
Net impairment losses on financial assets represent the provisions for doubtful accounts, or PDA. In
4Q19, the Company implemented a stricter policy for the calculation of the PDA, which has been in
place since then. As a consequence of that, a substantially higher PDA charge was reflected in 4Q19
(R$26.4 million, equivalent to 23% of Net Revenue, as shown in the chart below), which retroactively
compensated for the abnormally low PDA charge in 3Q19 (R$6.5 million). In 4Q20, the PDA impact
was R$20.6 million.
Regarding the full year amount, the PDA impact was R$76.8 million in 2020 vs R$58.2 million in 2019.
The year over year increase in the annual rate is mainly explained by changes in the mix of students.

4Q20 and 2020 Results
13
Adjusted EBITDA
Adjusted EBITDA in 4Q20 totaled R$39.2 million, up 100.0% from R$19.6 million in 4Q19. Adjusted
EBITDA Margin was 28.7%, a 12.0 pp increase compared to 16.7% for 4Q19. Regarding 2020,
Adjusted EBITDA was R$146.6 million up from R$117.6 million in 2019, which represented an increase
of R$29.0 million or 24.7%, led by the growth of the Digital Education Undergraduate segment.
Adjusted EBITDA margins for 2020 and 2019 were 28.2% and 25.5%, respectively. These increases
in the Adj. EBITDA margins were primarily attributable to the improvement of the Gross Margin, due
to optimization of personnel costs and overall gains from scale in 2020.
Notes: (i) all figures in this slide include the adjustments applied in our definition of Adjusted EBITDA; (ii) PDA is defined as “Net impairment losses on financial and
contract assets” in our Financials
Adjusted Net Income

4Q20 and 2020 Results
14
Adjusted Net Income in 4Q20 was R$19.0 million, up 399% from the same period of the prior year.
This increase reflects the growth in Adjusted EBITDA as previously mentioned. For 2020, Adjusted Net
Income was R$98.2 million, a 70% increase over the same period in the prior year, reflecting the
increase in Adjusted EBITDA in 2020, and certain one-time events: the recognition of deferred taxes
assets (R$10.6MM) and non-taxable foreign exchange gains (R$10.8MM) in 2020.
Cash Flow and Cash Conversion from Operations Table 9: Cash Flow & Cash Conversion
R$ million 4Q19 4Q20 % Chg 2019 2020 % Chg
Cash Flow from Operations 14.6 22.0 50.7% 98.0 141.6 44.5%
(+) Income Tax Paid (3.1) (5.2) 67.7% (12.7) (18.7) 47.2%
Adjusted Cash Flow from Operations 11.5 16.8 46.1% 85.3 122.9 44.1%
Adjusted EBITDA 19.6 39.2 100.0% 117.6 146.6 24.7%
(-) Non-recurring Expenses (0.2) (2.1) 950.0% (4.5) (7.2) 60.0%
Adjusted EBITDA including Non-recurring Expenses
19.4 37.1 91.2% 113.1 139.4 23.3%
Adjusted Cash Flow Conversion from Operations1
59.3% 45.3% -14 pp 75.4% 88.2% 12.8 pp
(1) The Company calculates Adjusted Cash Flow Conversion from Operations as adjusted cash flow from operations (which we calculate as cash from
operations plus income tax paid) divided by Adjusted EBITDA (as defined above but without taking non-recurring expenses into consideration). Adjusted
Cash Flow Conversion from Operations is a non-GAAP measure. The calculation of Adjusted Cash Flow Conversion from Operations may be different from the calculation used by other companies, including competitors in the industry, and therefore, the Company’s measures may not be comparable to those of
other companies. For further information see “Non-GAAP Financial Measures”.
The annual Adjusted Cash Flow Conversion from Operations increased to 88.2% in 2020 from 75.4%
for 2019. This increase of 12.8pp was primarily attributable to the strong improvement in cash flow
from operations through a continued discipline in receivables management.
CAPEX
Table 10: CAPEX
R$ million 4Q19 4Q20 % Chg 2019 2020 % Chg
Investing activities 11.8 10.0 -15.3% 44.8 56.4 25.9%
Property and equipment 5.3 3.4 -35.8% 28.5 25.5 -10.5%
Intangible assets 6.5 6.6 1.5% 16.3 30.9 89.6%
Investing activities as % of Net Revenue 10.1% 7.3% -2.8 pp 9.7% 10.9% 1.2 pp
Capital Expenditures in 4Q20 totaled R$10.0 million, 15.3% lower than the R$11.8 million in 4Q19.
For 2020, CAPEX was R$56.4 million, a 25.9% increase over the same period in the prior year. This
increase was mainly due to the growth in investments in intangible assets, such as software
development and academic content, which is a fundamental pillar of the Company’s tech-enabled
business model.

4Q20 and 2020 Results
15
ABOUT VITRU (NASDAQ: VTRU)
VITRU is the leading pure digital education postsecondary group in Brazil based on the number of
enrolled undergraduate students as of December 31, 2019 according to the Brazilian Ministry of
Education (Ministério da Educação), or the MEC in October 2020, the latest data available.
Vitru is listed on the Nasdaq stock exchange in the United States (ticker symbol: VTRU) since
September 18th, 2020 and its mission is to democratize access to education in Brazil through a digital
ecosystem and empower every student to create their own successful story.
Through its subsidiaries, Vitru provides a complete pedagogical ecosystem focused on a hybrid
distance learning experience for undergraduate and continuing education students. All the academic
content is delivered in multiple formats (videos, eBooks, podcasts and html text, among others)
through its proprietary Virtual Learning Environment, or VLE. The pedagogical model also incorporates
in-person weekly meetings hosted by dedicated tutors who are mostly local working professionals in
the subject area they teach. The Company believes that this unique tutor-centric learning experience
sets it apart, creating a stronger sense of community and belonging and contributing to higher
engagement and retention rates of its student base.
The Company’s results are based on three operating segments:
▪ Digital education undergraduate courses. What differentiates Vitru’s digital education model is
its hybrid methodology, which consists of weekly in-person meetings with on-site tutors, alongside
the benefit of the virtual learning environment, where students are able to study where and when
they prefer. The Company’s portfolio of courses is composed mainly of pedagogy, business
administration, accounting, physical education, vocational, engineering and health-related courses.
This is Vitru’s largest business unit, accounting for approximately 83% of net revenue of 4Q20.
▪ Continuing education courses. Vitru offers continuing education and graduate courses
predominantly in pedagogy, finance and business, but also in other subjects such as law,
engineering, IT and health-related courses. Courses are offered in three different versions,
consisting of (i) hybrid model, (ii) 100% online and (iii) on-campus;
▪ On-campus undergraduate courses. Vitru has 14 campuses that offer traditional on-campus
undergraduate courses, including engineering, law and health-related courses.
FORWARD – LOOKING STATEMENTS
This press release contains forward-looking statements within the meaning of the Private Securities
Litigation Reform Act of 1995, which statements involve substantial risks and uncertainties. All
statements other than statements of historical fact, could be deemed forward looking, including risks
and uncertainties related to statements about the impact of the COVID-19 outbreak on general
economic and business conditions in Brazil and globally and any restrictive measures imposed by
governmental authorities in response to the outbreak; our ability to implement, in a timely and
efficient manner, any measure necessary to respond to, or reduce the impacts of the COVID-19
outbreak on our business, operations, cash flow, prospects, liquidity and financial condition; our ability
to efficiently predict, and react to, temporary or long-lasting changes in consumer behavior resulting
from the COVID-19 outbreak, including after the outbreak has been sufficiently controlled; our
competition; our ability to implement our business strategy; our ability to adapt to technological
changes in the educational sector; the availability of government authorizations on terms and
conditions and within periods acceptable to us; our ability to continue attracting and retaining new
students; our ability to maintain the academic quality of our programs; our ability to maintain the
relationships with our hub partners; our ability to collect tuition fees; the availability of qualified
personnel and the ability to retain such personnel; changes in government regulations applicable to
the education industry in Brazil; government interventions in education industry programs, that affect
the economic or tax regime, the collection of tuition fees or the regulatory framework applicable to

4Q20 and 2020 Results
16
educational institutions; a decline in the number of students enrolled in our programs or the amount
of tuition we can charge; our ability to compete and conduct our business in the future; the success
of operating initiatives, including advertising and promotional efforts and new product, service and
concept development by us and our competitors; changes in consumer demands and preferences and
technological advances, and our ability to innovate to respond to such changes; changes in labor,
distribution and other operating costs; our compliance with, and changes to, government laws,
regulations and tax matters that currently apply to us; general market, political, economic, and
business conditions; and our financial targets. Forward-looking statements by their nature address
matters that are, to different degrees, uncertain, such as statements about the potential impacts of
the COVID-19 pandemic on our business operations, financial results and financial position and on the
Brazilian economy.
The forward-looking statements can be identified, in certain cases, through the use of words such as
“believe,” “may,” “might,” “can,” “could,” “is designed to,” “will,” “aim,” “estimate,” “continue,”
“anticipate,” “intend,” “expect,” “forecast”, “plan”, “predict”, “potential”, “aspiration,” “should,”
“purpose,” “belief,” and similar, or variations of, or the negative of such words and expressions.
Forward-looking statements speak only as of the date they are made, and the Company does not
undertake any obligation to update them in light of new information or future developments or to
release publicly any revisions to these statements in order to reflect later events or circumstances or
to reflect the occurrence of unanticipated events. The achievement or success of the matters covered
by such forward-looking statements involves known and unknown risks, uncertainties and
assumptions. If any such risks or uncertainties materialize or if any of the assumptions prove incorrect,
our results could differ materially from the results expressed or implied by the forward-looking
statements we make. Readers should not rely upon forward-looking statements as predictions of
future events. Forward-looking statements represent management’s beliefs and assumptions only as
of the date such statements are made. Further information on these and other factors that could affect
the Company’s financial results is included in filings made with the United States Securities and
Exchange Commission (“SEC”) from time to time, including the section titled “Risk Factors” in the
most recent Rule 424(b)(1) prospectus of the Company. These documents are available on the SEC
Filings section of the investor relations section of our website at: investors.vitru.com.br.
NON-GAAP FINANCIAL MEASURES
To supplement the Company's consolidated financial statements, which are prepared and presented
in accordance with International Financial Reporting Standards as issued by the International
Accounting Standards Board—IASB, VITRU uses Adjusted EBITDA, Adjusted Net Income and Adjusted
Cash Flow Conversion from Operations information for the convenience of the investment community,
which are non-GAAP financial measures. A non-GAAP financial measure is generally defined as one
that purports to measure financial performance but excludes or includes amounts that would not be
so adjusted in the most comparable GAAP measure.
VITRU calculates Adjusted EBITDA as the net income (loss) for the period plus:
▪ deferred and current income tax, which is calculated based on income, adjusted based on certain
additions and exclusions provided for in applicable legislation. The income taxes in Brazil consist of
corporate income tax (Imposto de Renda Pessoa Jurídica), or IRPJ, CSLL, which are social
contribution taxes;
▪ financial results, which consists of interest expenses less interest income;
▪ depreciation and amortization;
▪ interest on tuition fees paid in arrears, which refers to interest received from students on late
payments of monthly tuition fees and which is added back;
▪ impairment of non-current assets, which consists of impairment charges associated with on-campus
undergraduate courses segment, given the deterioration in the prospects of this business;
▪ share-based compensation plan, which consists of non-cash expenses related to the grant of share-
based compensation, as well as fair value adjustments for share-based compensation expenses
classified as a liability in the consolidated financial statements;
▪ other income (expenses), net, which consists of other expenses such as contractual indemnities
and deductible donations among others;

4Q20 and 2020 Results
17
▪ M&A, pre-offering expenses and restructuring expenses, which consists of adjustments that
Company believes are appropriate to provide additional information to investors about certain
material non-recurring items. Such M&A, pre-offering expenses and restructuring expenses
comprise: mergers and acquisitions, or M&A, and pre-offering expenses, which are expenses
related to mergers, acquisitions and divestments (including due diligence, transaction and
integration costs), as well as the expenses related to the preparation of offerings; and restructuring
expenses, which refers to expenses related to employee severance costs in connection with
organizational and academic restructurings.
VITRU calculates Adjusted Net Income as net income (loss)for the period plus:
▪ share-based compensation plan, as defined above;
▪ M&A, pre-offering expenses and restructuring expenses, as defined above;
▪ impairment of non-current assets, as defined above;
▪ amortization of intangible assets recognized as a result of business combinations, which refers to
the amortization of the following intangible assets from business combinations: software,
trademark, distance learning operation licenses, non-compete agreements, customer relationship
and teaching-learning material. For more information, see notes to the unaudited interim
condensed consolidated financial statements in the Company’s filings with the U.S. Securities and
Exchange Commission;
▪ interest accrued at the original effective interest rate (excluding restatement as a result of inflation)
on the accounts payable from the acquisition of subsidiaries, related to the acquisition of our
operating units from Kroton in 2016 and 2017. See notes to the unaudited interim condensed
consolidated financial statements in the Company’s filings with the U.S. Securities and Exchange
Commission; and
▪ corresponding tax effects on adjustments, which represents the tax effect of pre-tax items excluded
from adjusted net income (loss). The tax effect of pre-tax items excluded from adjusted net income
(loss) is computed using the statutory rate related to the jurisdiction that was impacted by the
adjustment after taking into account the impact of permanent differences and valuation allowances.
VITRU calculates Adjusted Cash Flow Conversion from Operations as adjusted cash flow from
operations (which is calculated as cash from operations plus income tax paid) divided by Adjusted
EBITDA (as defined above but without taking M&A, pre-offering expenses and restructuring expenses
into consideration).
Adjusted EBITDA, Adjusted Net Income and Adjusted Cash Flow Conversion from Operations are the
key performance indicators used by Vitru to measure the financial performance of its core operations
and Vitru believes that these measures facilitate period-to-period comparisons on a consistent basis.
As a result, its management believes that these non-GAAP financial measures provide useful
information to investment community. These summarized, non-audited or non-GAAP financial
measures are in addition to, and not a substitute for or superior to, measures of financial performance
prepared in accordance with IFRS. Additionally, the calculations of Adjusted EBITDA, Adjusted Net
Income and Adjusted Cash Flow Conversion from Operations may be different from the calculations
used by other companies, including competitors in the education services industry, and therefore,
Vitru’s measures may not be comparable to those of other companies. For a reconciliation of Adjusted
EBITDA, Adjusted Net Income and Adjusted Cash Flow Conversion from Operations to the most
directly comparable IFRS measure, see the tables in the end of this document.

4Q20 and 2020 Results
18
FINANCIAL TABLES
Unaudited Interim condensed consolidated statements of income for the three-months and twelve-months periods ended December 31, 2020 and 2019 (in
millions of Brazilian Reais, except earnings per share)
4Q19 4Q20 2019 2020
NET REVENUE 117.2 136.5 461.1 519.2
Cost of services rendered (50.1) (56.7) (211.6) (221.5)
GROSS PROFIT 67.1 79.8 249.5 297.7
General and administrative expenses (47.8) (32.0) (125.3) (73.9)
Selling expenses (33.7) (19.1) (101.0) (86.6)
Net impairment losses on financial assets (26.4) (20.6) (58.2) (76.8)
Other income (expenses), net 0.2 (2.0) (0.9) 0.5
Operating expenses (107.7) (73.7) (285.4) (236.8)
OPERATING PROFIT (LOSS) (40.6) 6.1 (35.9) 60.9
Financial income 3.9 8.0 19.1 36.5
Financial expenses (17.8) (28.0) (60.3) (64.4)
Financial results (13.9) (20.0) (41.2) (27.9)
PROFIT (LOSS) BEFORE TAXES (54.5) (13.9) (77.1) 33.0
Current income taxes (4.0) 3.0 (14.8) (19.5)
Deferred income taxes 13.4 8.8 25.7 38.6
Income taxes 9.4 11.8 10.9 19.1
NET INCOME (LOSS) (45.1) (2.1) (66.2) 52.1
Other comprehensive income - - - -
TOTAL COMPREHENSIVE PROFIT (LOSS) (45.1) (2.1) (66.2) 52.1
Basic earnings (loss) per share (R$) (1.96) (0.09) (3.93) 2.79
Diluted earnings (loss) per share (R$) (1.96) (0.09) (3.93) 2.68

4Q20 and 2020 Results
19
Unaudited Interim condensed consolidated Balance Sheets as of December 31,
2020 and 2019 (in millions of Brazilian Reais)
December 31,
2019 December 31,
2020
ASSETS
CURRENT ASSETS
Cash and cash equivalents 2.5 85.9
Short-term investments 72.3 515.2
Trade receivables 88.1 115.1
Income taxes recoverable 4.8 2.2
Prepaid expenses 8.9 10.2
Other current assets 1.8 3.1
178.4 731.7
Assets classified as held for sale 36.4 -
TOTAL CURRENT ASSETS 214.8 731.7
NON-CURRENT ASSETS
Trade receivables 3.8 6.9
Indemnification assets 14.8 9.2
Deferred tax assets 37.1 50.8
Other non-current assets 1.4 3.6
Right-of-use assets 88.5 127.9
Property and equipment 70.0 96.7
Intangible assets 658.2 661.0
TOTAL NON-CURRENT ASSETS 873.8 956.1
TOTAL ASSETS 1,088.7 1,687.8

4Q20 and 2020 Results
20
December 31,
2019 December 31,
2020
LIABILITIES
CURRENT LIABILITIES
Trade payables 30.0 32.2
Loans and financing - 151.8
Lease liabilities 17.3 23.4
Labor and social obligations 16.8 26.7
Income taxes payable - -
Taxes payables 1.7 2.4
Prepayments from customers 3.2 9.7
Accounts payable from acquisition of subsidiaries 128.9 135.0
Other current liabilities 0.3 1.4
198.1 382.6
Liabilities directly associated with assets classified as held for sale 23.3 -
TOTAL CURRENT LIABILITIES 221.4 382.6
NON-CURRENT
Loans and financing - -
Lease liabilities 85.9 126.0
Share-based compensation 34.9 46.2
Accounts payable from acquisition of subsidiaries 250.7 139.9
Provisions for contingencies 18.4 14.4
Deferred tax liabilities 25.0 -
Other non-current liabilities 1.1 0.7
TOTAL NON-CURRENT LIABILITIES 416.0 327.2
TOTAL LIABILITIES 637.3 709.8
EQUITY
Share capital 548.4 -
Capital reserves (1.2) 1,022.1
Revenue reserves 0.4 -
Retained earnings (Accumulated losses) (96.2) (44.1)
TOTAL EQUITY 451.3 978.0
TOTAL LIABILITIES AND EQUITY 1,088.7 1,687.8

4Q20 and 2020 Results
21
Unaudited Interim condensed consolidated statements of cash flows for the years ended December 31, 2020 and 2019 (in millions of Brazilian Reais)
2019 2020
Cash flows from operating activities
Income before taxes (77.1) 33.0
Adjustments to reconcile income before taxes to cash provided on operating activities
Depreciation and amortization 62.4 51.5
Impairment of non-current assets 51.0 -
Net impairment losses on financial assets 58.2 76.9
Provision for revenue cancellation (0.4) (2.1)
Provision for contingencies 3.8 3.7
Accrued interests 45.0 34.1
Share-based compensation 26.4 11.8
Modification of lease contracts - (0.9)
Lease discounts - (2.0)
Loss on sale or disposal of non-current assets - -
Changes in operating assets and liabilities:
Trade receivables (80.0) (79.5)
Prepayments (1.9) (1.2)
Other assets (0.9) (0.3)
Trade payables 13.9 1.3
Labor and social obligations 3.4 7.3
Other taxes payable (1.6) 0.8
Prepayments from customers 2.1 6.3
Other payables (6.4) 0.7
Cash from operations 98.0 141.5
Income tax paid (12.7) (18.7)
Interest paid (27.5) (41.7)
Contingencies paid (1.7) (5.2)
Net cash provided by operating activities 56.0 75.9
Cash flows from investing activities
Purchase of property and equipment (28.5) (25.6)
Purchase and capitalization of intangible assets (16.3) (30.9)
Payments for the acquisition of interests in subsidiaries (108.0) (117.2)
Proceeds from (acquisition of) short-term investments, net 103.2 (436.6)
Net cash used in investing activities (49.5) (610.3)
Cash flows from financing activities
Payments of lease liabilities (6.1) (6.2)
Proceeds from loans and financing - 150.0
Proceeds from initial public offering - 521.6
Share issuance costs - (47.6)
Capital contributions 1.9 -
Share repurchase (2.2) -
Net cash (used in) provided by financing activities (6.5) 617.8
Net increase in cash and cash equivalents 0.1 83.5
Cash and cash equivalents at the beginning of the year 2.4 2.5
Cash and cash equivalents at the end of the year 2.5 85.9

4Q20 and 2020 Results
22
Reconciliation of Adjusted EBITDA
R$ millions 4Q19 4Q20 2019 2020
Profit (loss) for the year (45.1) (2.1) (66.2) 52.1
(+) Deferred and current income tax (9.4) (11.8) (10.9) (19.1)
(+) Financial result 13.9 20.0 41.2 27.9
(+) Depreciation and amortization 16.3 14.1 62.4 51.5
(+) Interest on tuition fees paid in arrears 1.7 3.5 8.3 15.6
(+) Impairment of non-current assets 19.6 - 51.0 -
(+) Share-based compensation plan 22.6 11.4 26.4 11.9
(+) Other income (expenses), net (0.2) 2.0 0.9 (0.5)
(+) M&A, pre-offering expenses and restructuring expenses 0.2 2.1 4.5 7.2
Adjusted EBITDA 19.6 39.2 117.6 146.6
Reconciliation of Adjusted Net Income
R$ millions 4Q19 4Q20 2019 2020
Profit (loss) for the year (45.1) (2.1) (66.2) 52.1
(+) M&A, pre-offering expenses and restructuring expenses 0.2 2.1 4.5 7.2
(+) Impairment of non-current assets 19.6 - 51.0 -
(+) Share-based compensation plan 22.6 11.4 26.4 11.9
(+) Amortization of intangible assets from business combinations
9.4 2.9 37.3 14.6
(+) Interest accrued on accounts payable from the acquisition of subsidiaries
6.0 4.6 23.4 18.0
(-) Corresponding tax effects on adjustments (8.9) 0.1 (18.7) (5.6)
Adjusted Net Income 3.8 19.0 57.7 98.2
Cash Conversion from Operations
R$ millions 4Q19 4Q20 2019 2020
Cash from Operations 14.6 22.0 98.0 141.6
(+) Income tax paid (3.1) (5.2) (12.7) (18.7)
Adjusted Cash from Operations 11.5 16.8 85.3 122.9
Adjusted EBITDA 19.6 39.2 117.6 146.6
(-) M&A, pre-offering expenses and restructuring expenses (0.2) (2.1) (4.5) (7.2)
Adjusted EBITDA including M&A, pre-offering expenses and restructuring expenses
19.4 37.1 113.1 139.4
Adjusted Cash Flow Conversion from Operations 59.3% 45.3% 75.4% 88.2%