Embed Size (px)
Citation preview
nzwine.com
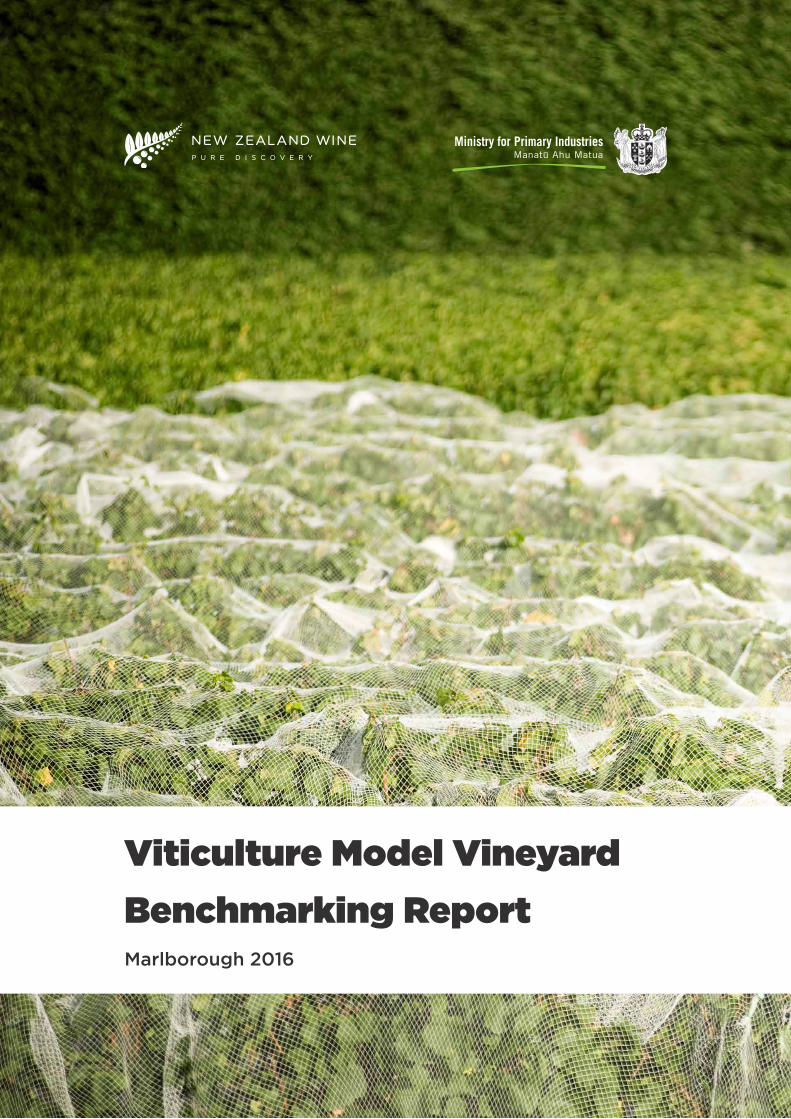
Viticulture Model Vineyard Benchmarking Report Marlborough 2016
Viticulture Model Vineyard Benchmarking Report Marlborough 2016
If you have any questions relating
to or for further information on
the model please contact :
Philip Gregan, CEO, NZ Winegrowers
[email protected] I 09 306 5555
Or Nick Dalgety, Policy & Trade, MPI
[email protected] I 03 545 9472
In collaboration with
Disclaimer
The information in this report by the Ministry for Primary Industries is based on the best information available to the
Ministry at the time it was drawn up and all due care was exercised in its preparation. As it is not possible to foresee
all uses of this information or to predict all future developments and trends, any subsequent action that relies on the
accuracy of the information in this report is the sole commercial decision of the user and is taken at his/her own risk.
Accordingly, the Ministry for Primary Industries disclaims any liability whatsoever for any losses or damages arising
out of the use of this information, or in respect of any actions taken.
Cover image courtesy of Palliser Estate
nzwine.com
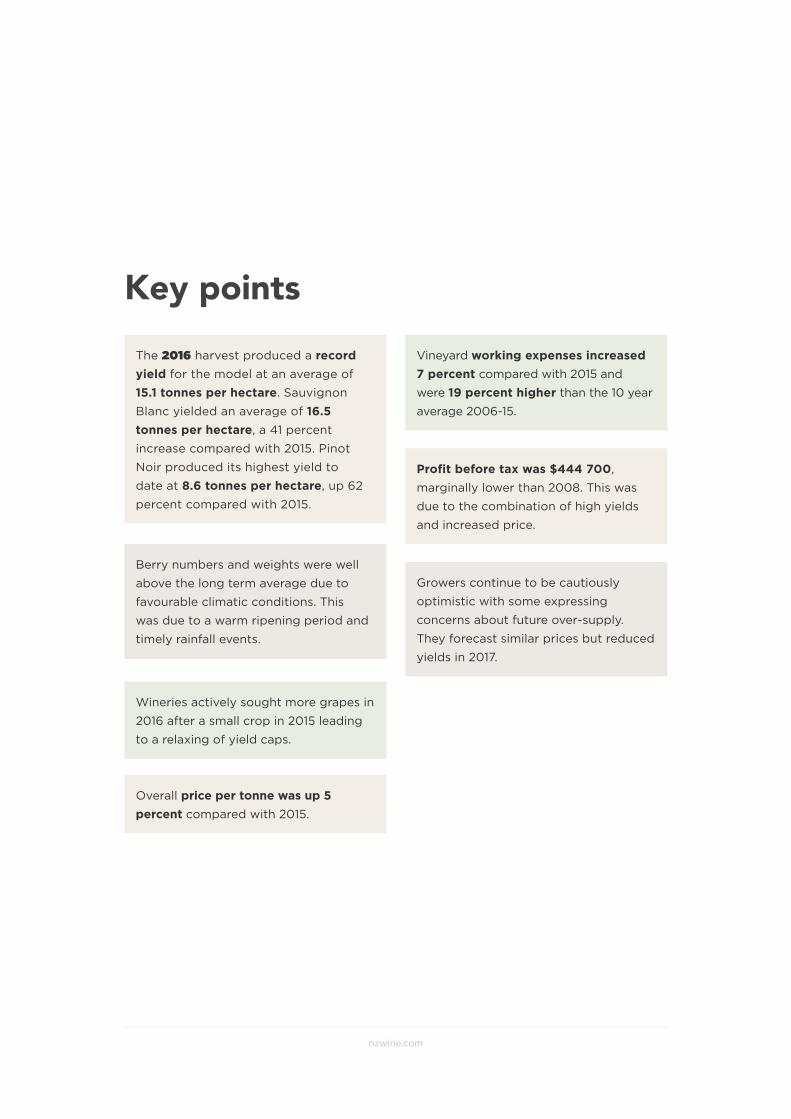
Key points The 2016 harvest produced a record yield for the model at an average of
15.1 tonnes per hectare. Sauvignon
Blanc yielded an average of 16.5 tonnes per hectare, a 41 percent
increase compared with 2015. Pinot
Noir produced its highest yield to
date at 8.6 tonnes per hectare, up 62
percent compared with 2015.
Berry numbers and weights were well
above the long term average due to
favourable climatic conditions. This
was due to a warm ripening period and
timely rainfall events.
Wineries actively sought more grapes in
2016 after a small crop in 2015 leading
to a relaxing of yield caps.
Overall price per tonne was up 5 percent compared with 2015.
Vineyard working expenses increased 7 percent compared with 2015 and
were 19 percent higher than the 10 year
average 2006-15.
Profit before tax was $444 700,
marginally lower than 2008. This was
due to the combination of high yields
and increased price.
Growers continue to be cautiously
optimistic with some expressing
concerns about future over-supply.
They forecast similar prices but reduced
yields in 2017.
2016 Viticulture Monitoring Report Marlborough
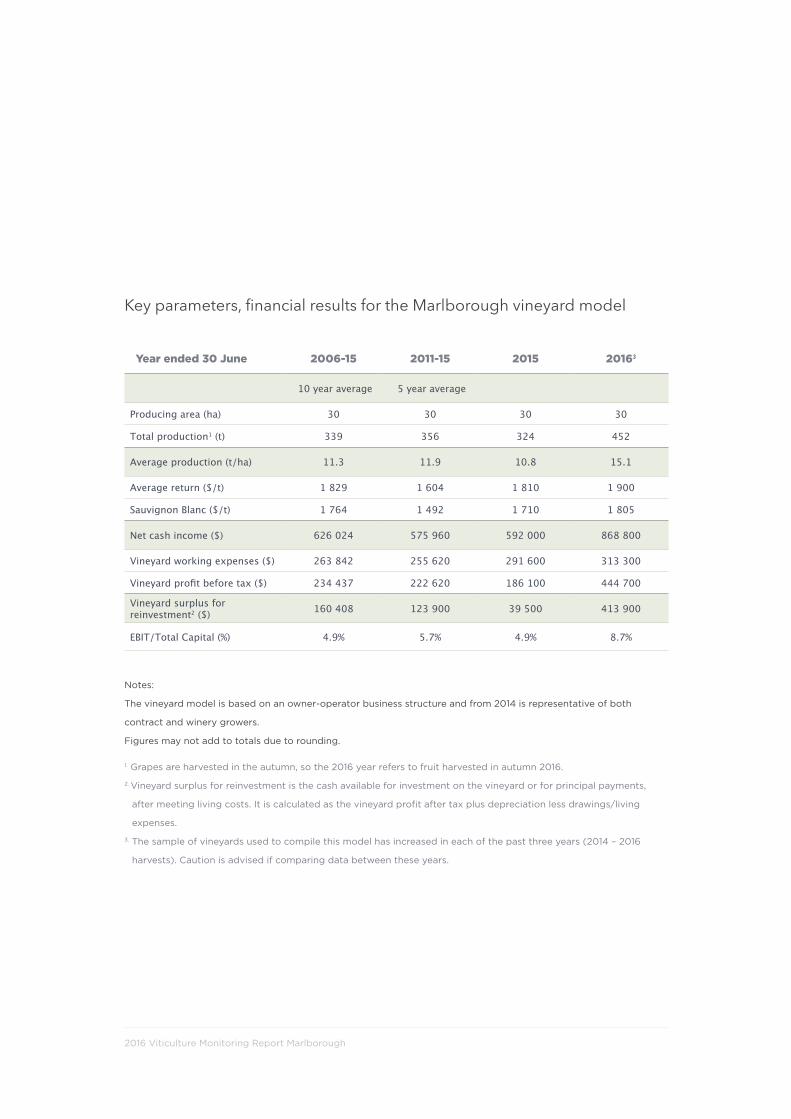
Key parameters, financial results for the Marlborough vineyard model
Year ended 30 June 2006-15 2011-15 2015 20163
10 year average 5 year average
Producing area (ha) 30 30 30 30
Total production1 (t) 339 356 324 452
Average production (t/ha) 11.3 11.9 10.8 15.1
Average return ($/t) 1 829 1 604 1 810 1 900
Sauvignon Blanc ($/t) 1 764 1 492 1 710 1 805
Net cash income ($) 626 024 575 960 592 000 868 800
Vineyard working expenses ($) 263 842 255 620 291 600 313 300
Vineyard profit before tax ($) 234 437 222 620 186 100 444 700
Vineyard surplus for reinvestment2 ($) 160 408 123 900 39 500 413 900
EBIT/Total Capital (%) 4.9% 5.7% 4.9% 8.7%
Notes:
The vineyard model is based on an owner-operator business structure and from 2014 is representative of both
contract and winery growers.
Figures may not add to totals due to rounding.
1. Grapes are harvested in the autumn, so the 2016 year refers to fruit harvested in autumn 2016.
2. Vineyard surplus for reinvestment is the cash available for investment on the vineyard or for principal payments,
after meeting living costs. It is calculated as the vineyard profit after tax plus depreciation less drawings/living
expenses.
3. The sample of vineyards used to compile this model has increased in each of the past three years (2014 – 2016
harvests). Caution is advised if comparing data between these years.
nzwine.com
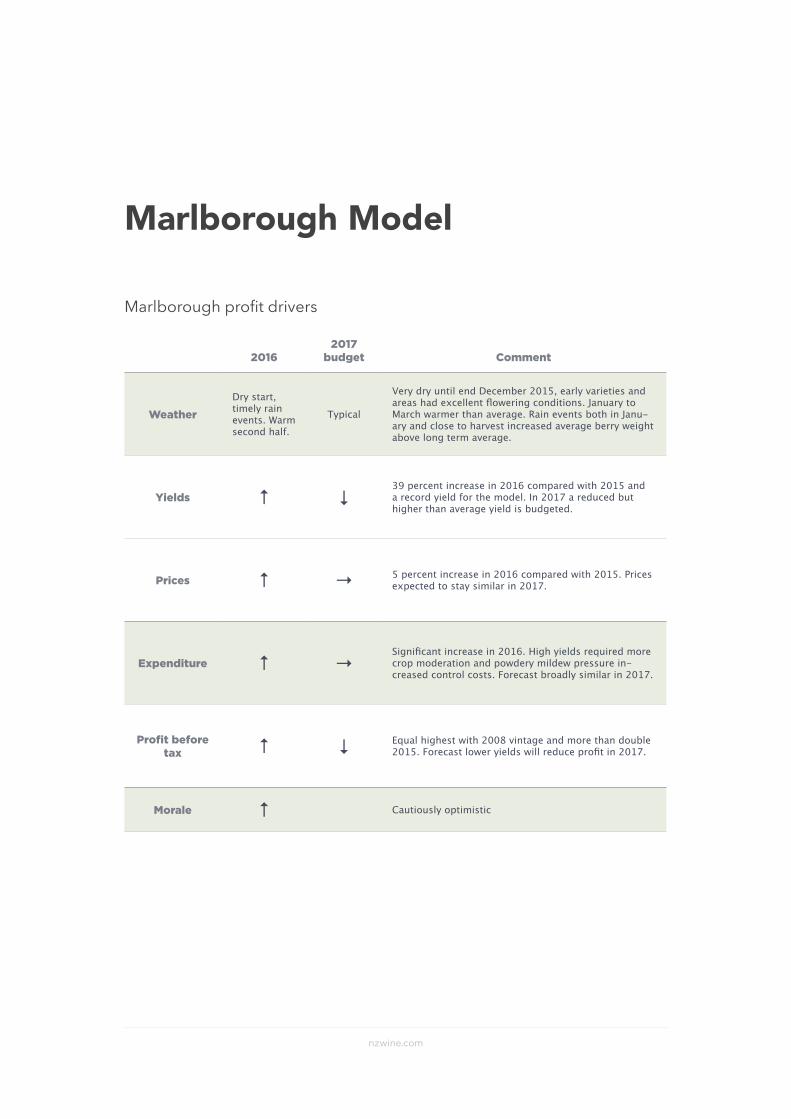
20162017
budget Comment
WeatherDry start, timely rain events. Warm second half.
Typical
Very dry until end December 2015, early varieties and areas had excellent flowering conditions. January to March warmer than average. Rain events both in Janu-ary and close to harvest increased average berry weight above long term average.
Yields ↑ ↓39 percent increase in 2016 compared with 2015 and a record yield for the model. In 2017 a reduced but higher than average yield is budgeted.
Prices ↑ → 5 percent increase in 2016 compared with 2015. Prices expected to stay similar in 2017.
Expenditure ↑ →Significant increase in 2016. High yields required more crop moderation and powdery mildew pressure in-creased control costs. Forecast broadly similar in 2017.
Profit before tax ↑ ↓ Equal highest with 2008 vintage and more than double
2015. Forecast lower yields will reduce profit in 2017.
Morale ↑ Cautiously optimistic
Marlborough Model
Marlborough profit drivers
2016 Viticulture Monitoring Report Marlborough
Financial Performance of the Marlborough Viticulture Model in 2016
Weather
The 2015/16 season started off extremely
dry following 2014/15 which was the driest
season on record for Marlborough. The
drought was becoming very serious with
only 26 mm of rain recorded between
October and December 2015. However,
timely rain events in January followed by
further rains in February and March ensured
that yield was not restricted by drought.
A period of warm weather in late November
and very early December gave excellent
fruit set1 on early flowering varieties and
early areas of Sauvignon Blanc. Later areas
of Sauvignon Blanc experienced cooler
flowering conditions but overall this did not
have an adverse effect on yields.
Growing degree days were average until mid-
January when they rapidly increased with
warmer temperatures continuing through to
mid-April. Growing degree days for January
– March 2016 were 18 percent above the long
term average. This shortened the ripening
period and ensured large crops were able to
be successfully ripened in good time.
For a small number of vineyards, localised
spring frost events caused serious damage
to early shoot and inflorescences.
Data from Plant and Food Research2 and
anecdotal evidence from growers show
that the higher yields were a combination
of high berry number per bunch and high
berry weight. Berry weight for Sauvignon
Blanc on many blocks was between 5 and
20 percent above average. Above average
growing degree days in January to March
and rain in early January, increasing cell
division and cell expansion, are the main
reasons for the increased berry weight.
The two main events on 23rd March and 1st
April also increased berry weight.
Apart from the just over 20mm of rainfall
on the 1st of April 2016, the remainder of
the month was very dry and this enabled
the majority of fruit to be harvested in
good condition without disease becoming a
major issue.
1 A measure of the number of flowers forming berries
2 Pers comm, Rob Agnew, Plant and Food Research, May 2016
nzwine.com
Yields
The model returned a record yield in 2016
of 452 tonnes or 15.1 tonnes per hectare,
surpassing the previous record in 2014 of
14.6 tonnes per hectare. The overall yield
was up 39 percent compared with 2015.
The main drivers of this increased yield
were significantly heavy bunches as both
berry weight and berry numbers per bunch
were well above the long term average.
Sauvignon Blanc yield of 16.5 tonnes per
hectare equalled the record 2014 yield up
41 percent compared with 2015. Pinot Noir
had a record average yield of 8.6 tonnes per
hectare, up 62 percent compared with 2015.
Pinot Gris and Chardonnay were both
up compared with 2015 and above their
model long term averages. Riesling yields
were also up on 2015 but close to its long
term average.
Growers have reported a relaxing of winery
imposed yield limits (yield cap) in the
past two seasons as wine companies have
sought more supply. This also increased the
overall yield of the model.
Prices
The combined average price for all varieties
was $1900 per tonne, up 5 percent
compared to 2015 and 4 percent above the
10-year average 2006-15.
Sauvignon Blanc’s price, at $1805 per tonne,
increased 6 percent compared with 2015.
However, the model yield includes 5 percent
that was surplus to winery imposed yield
limits and was sold at low prices in 2016.
Disregarding these sales, the average price
for Sauvignon Blanc would have been $1850
per tonne.
Pinot Noir’s 2016 price decreased 4 percent
compared with 2015 to $3085 per tonne.
This is still 2 percent higher than the 10-
year average. The high yields of Pinot
Noir resulted in some surplus fruit over
contracted cap being sold at lower prices.
2016 Viticulture Monitoring Report Marlborough
Expenditure
Model vineyard working expenses increased
7 percent compared with 2015 to $10 445
per hectare. Expenses are now only just
below their peak of $10 689 per hectare in
2008. Vineyard working expenses are
19 percent higher than the average of the
10-year period 2006-15.
Expenses have increased in each of the past
three seasons. This was due to the need to
improve yields after a period of low prices
and lower winery imposed yield caps 2010-
13 reduced inputs to the minimum.
Total labour expenses increased 9 percent
in 2016. This was largely driven by increased
crop moderation due to the large crop and
increased spraying required to combat
powdery mildew.
Pruning costs also increased 6 percent
compared with 2015 reflecting higher
labour rates and a move away from machine
stripping. Weed and pest control chemicals
increased 9 percent compared with 2015
due to more spraying and a more diverse
choice of chemistry to control powdery
mildew. In addition, some growers applied
expensive mealy bug control products.
Fertiliser and lime costs were up 8
percent with growers more aware of the
nutritional inputs needed in the vineyard
to maintain yield.
Irrigation costs (electricity and water)
increased in 2016 due to the dry season.
Several growers upgraded their irrigation
systems in 2016 after the lessons from
the previous dry year. This lead to more
effective but higher water use in 2016.
Frost protection costs were up for a second
year in a row due to a number of frost
events in spring.
Fuel costs were down significantly
compared with 2015 largely due to lower
diesel prices and new survey growers
contracting out tractor work.
Overhead costs were up 12 percent
compared with 2015. Grape grower levies
were up significantly in line with the
increased yield.
Financial Result
The record yield and increased price per
tonne gave a vineyard profit before tax of
$444 700. This is 143 percent up on 2015
and just marginally lower than the record of
$449 100 achieved in 2008.
The 2016 profit before tax equates to
$14 820 per hectare, higher than the
10-year average of $7815.
nzwine.com
Vineyard surplus for re-investment was
a record $413 900. The 2006-15 ten-year
average was $160 408. However, it is
important to note that tax is modelled
for the survey and has been calculated
as zero for payments in 2016 due to high
provisional tax payments in 2015. Tax
planning challenges will occur when there is
a significant profit variation between years.
Capital expenditure fell on the back of a
weak result the previous year. Expenditure
on tractors, machinery, vineyard buildings
and wind machines all fell. Growers continue
to invest in more efficient sprayers.
There was a decrease in new plantings after
some development in the previous year.
Long–term development looks promising
with nurseries reporting strong forward
orders. A recent Marlborough Labour
Market survey predicting a significant
increase in the Marlborough region planted
area in the next five years.
Vineyard property values increased 16
percent compared with 2015. The average
vineyard value was $190 200 per planted
hectare. Growers indicated that performing
vineyards in prime areas of the Wairau
Plains, are worth as much as $250 000 or
more per planted hectare.
Expected financial performance of the marlborough viticulture model in 2017
Growers forecast a model average yield of
13.1 tonnes per hectare in 2017, a 13 percent
decrease compared with 2016. This is still
1.8 tonnes above the 10-year average 2006-
15. This figure is influenced by the relaxing
of yield caps over the past two seasons.
Price per tonne for all varieties is expected
to stay at similar levels to 2016. Growers do
not expect to have fruit surplus to winery
yield caps that would be sold at low prices.
Therefore, the overall average prices are
expected to increase slightly in 2017 to
$1940 per tonne.
Several growers believe vineyards over
cropped in 2016 may give below average
yields in 2017. This was also seen in 2015
when there was a high yield the previous
season. However, conditions at fruit
bud initiation and flowering will still be
determining factors and growers are not
predicting yields to drop to the 2015 level.
The reduced yield aligns with the Plant and
Food Research grape yield model which
predicts a decrease of 13 percent in 2017
compared with long term averages .
3 WinePress, April 2016
4 WinePress, June 2016
2016 Viticulture Monitoring Report Marlborough
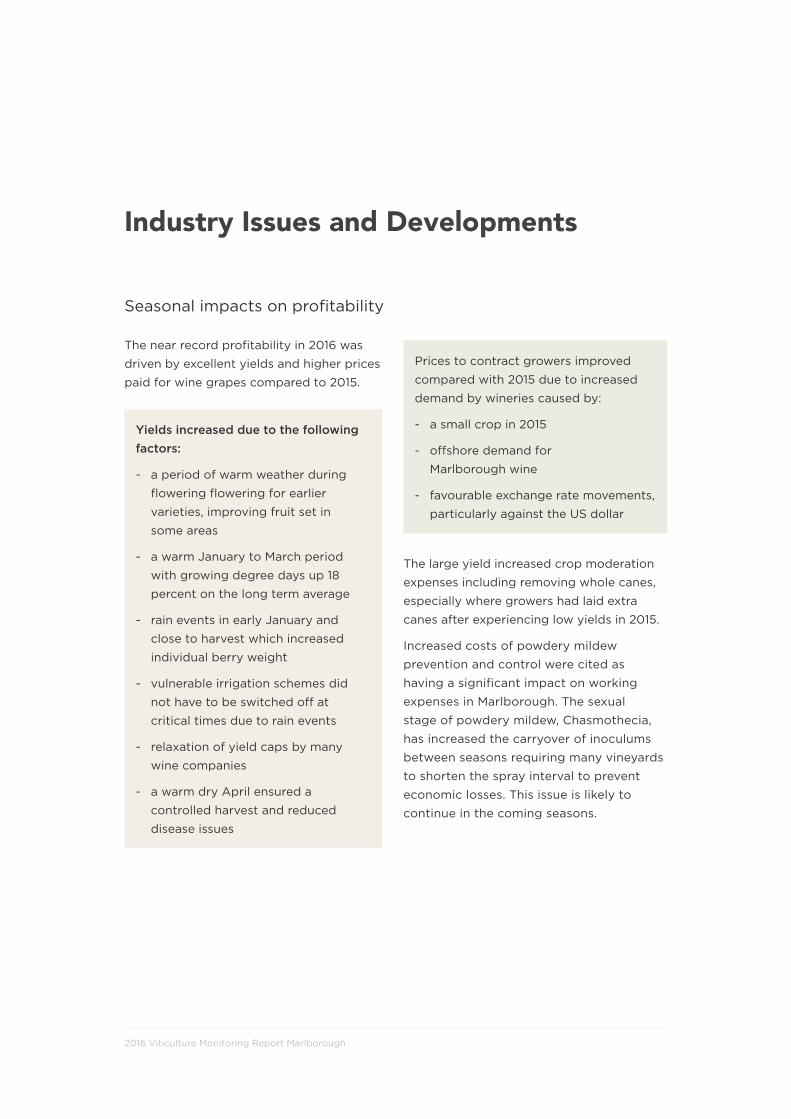
Industry Issues and Developments
Seasonal impacts on profitability
The near record profitability in 2016 was
driven by excellent yields and higher prices
paid for wine grapes compared to 2015.
Yields increased due to the following factors:
- a period of warm weather during
flowering flowering for earlier
varieties, improving fruit set in
some areas
- a warm January to March period
with growing degree days up 18
percent on the long term average
- rain events in early January and
close to harvest which increased
individual berry weight
- vulnerable irrigation schemes did
not have to be switched off at
critical times due to rain events
- relaxation of yield caps by many
wine companies
- a warm dry April ensured a
controlled harvest and reduced
disease issues
Prices to contract growers improved
compared with 2015 due to increased
demand by wineries caused by:
- a small crop in 2015
- offshore demand for
Marlborough wine
- favourable exchange rate movements,
particularly against the US dollar
The large yield increased crop moderation
expenses including removing whole canes,
especially where growers had laid extra
canes after experiencing low yields in 2015.
Increased costs of powdery mildew
prevention and control were cited as
having a significant impact on working
expenses in Marlborough. The sexual
stage of powdery mildew, Chasmothecia,
has increased the carryover of inoculums
between seasons requiring many vineyards
to shorten the spray interval to prevent
economic losses. This issue is likely to
continue in the coming seasons.
nzwine.com
Grower morale and business viability
All the growers interviewed reported
a positive morale and were cautiously
optimistic about their business. However,
more than half had concerns about future
over supply and its effect on prices and
quality. Several commented that fruit
surplus to requirement had been sold at
knock-down prices during the 2016 vintage.
They voiced their concerns about the
resulting effects on wine price, quality and
‘brand’ Marlborough.
The majority of the contract growers
in the group reported reasonable to
excellent relationships with their wineries.
In many cases yield restrictions have been
relaxed and are more likely related to
‘terroir’ potential rather than an across the
board yardstick.
The monitored group continues to invest
in business changes to improve business
viability. This includes purchasing or leasing
land of developed vineyards. A recent
survey5 of wine companies in Marlborough
found a significant expansion in planted
area is planned over the next five years.
Other reported changes to improve
business viability include risk mitigation,
investment in dams or schemes for water
security, debt reduction and staff training.
At an industry meeting in June there
were some further points raised around
improving future business prospects:
- fixed price contracts for grape
growers are becoming more common
e.g. for three years ahead
- top grafting less profitable varieties
to Sauvignon Blanc
- leveraging Geographic Indications
legislation
- timely replanting as the vineyard
profile ages
- mechanisation as labour costs and
shortages increase
5 The Marlborough Labour Market Survey, Wine Press, May 2016
2016 Viticulture Monitoring Report Marlborough
Environmental and natural resource management
The 2015/16 growing season started in
drought with 2015 ending up the driest year
on record for Marlborough. This prompted
a ‘Dry Season Seminar’ in November
organised by New Zealand Winegrowers
to discuss potential irrigation scheme shut
downs and water shortages. By the end of
December 2015 Blenheim had only had
26mm of rain since the beginning of
October and the situation was serious.
Fortunately, the drought was relieved
by timely rain events in January and
February but had concentrated the minds
of growers on water issues. Six growers
in the model are considering investing in
alternative water sources such as dams
and private schemes. These growers are
reliant on water sources that are prone
to being shut off due to low river flows.
A quarter of the growers in the model
already have alternative sources and
another quarter with existing consents
direct to aquifers do not perceive a need
for another source at present.
Growers in Marlborough are aware of the
Marlborough District Council’s (MDC)
proposals for managing future water
allocation and use after community
meetings in winter 2015. Several growers
voiced concerns over the impact on their
business in the future. MDC’s Marlborough
Environment Plan, which includes future
water allocation, was notified on 9th June
2016 with submissions being taken up to 1st
September 2016.
Five growers in the model had renewed
water permits in the previous year and
three of those had used a consultant to put
together the resource consent application.
Growers expressed both positive and
negative responses regarding the resource
consent process.
More than half the group have existing
environmental enhancement projects on
their properties including native plantings
and wetlands. A third of the group
expect to implement further projects in
the near future.
Two thirds of the group increased inputs
to manage powdery mildew in the 2015/16
season by decreasing spraying interval and
using a wider range of chemistry. Several
growers commented on the need for the
region as a whole to coordinate efforts to
keep on top of this increasing problem.
Poorly managed blocks can constantly re-
infect their neighbours.
The area of organic production amongst
the existing survey growers is the same as
2015. At the June 2016 Industry meeting, it
was stated that there are some increases in
organic production area but mainly within
existing organic businesses.
nzwine.com
Hot topics
The group reported a large and diverse list
of hot topics:
The predominant issue was around the yield
versus quality balance and its relationship
to the volume and price of wine presented
to the market. A portion of growers in the
survey were very concerned about over
supply leading to large volumes of low price
wine sent to the market.
Several growers argued that price per
hectare is a far better payment method
than price per tonne as it is an incentive
to produce better quality. However, other
growers and wineries rely on good yields to
keep their businesses viable and believe that
they are simply supplying what the market
wants – a good volume of reasonable quality
wine at a competitive price.
Many growers were dismayed at
opportunistic buyers purchasing excess
fruit in vintage 2016 at prices up to 75
percent lower than the district average. This
fruit was either above contracted yield or
rejected by the contracted winery. Several
growers were proud to have harvested fruit
to the ground despite being offered a deal
by these purchasers.
The group acknowledged the success
and importance of the Recognised
Seasonal Employer (RSE) scheme with
one describing it as ‘amazing’. There are
concerns around future negative changes
to the scheme or lack of upward movement
in numbers of workers allowed under this
scheme. Concerns would be compounded
if the number of vineyard workers required
in Marlborough increases as forecast in
the Marlborough Labour Market survey6.
Several growers also said that good quality
permanent skilled employees are getting
harder to find and keep as competition
increases for their services.
At the June 2016 Industry meeting, further hot topics were raised:
- concern about biosecurity
breaches from overseas pests and
diseases e.g. via imported vineyard
machinery. In August 2016, New
Zealand Winegrower’s members
are voting whether to join up with a
Government and Industry agreement
(GIA) for a joint response to
biosecurity protection and incursions
- expansion of vineyards into more
climatically marginal areas of
Marlborough e.g. areas with higher
rainfall that could increase disease
issues
- increasing resistance to certain
herbicides e.g. glyphosate resistant
perennial ryegrass – requires costlier
alternatives
- varietal mix – need to keep in tune
with consumer preference including
wine style.
6 WinePress, April 2016
2016 Viticulture Monitoring Report Marlborough
About the model
Marlborough vineyard benchmarking model
This report is based on data and comments
collected in personal interviews with grape
growers in Marlborough in May 2016. Model
vineyard budgets were prepared using
the data collected from these vineyards.
Feedback from industry representatives
incorporated after a meeting in
Marlborough to critique the draft models.
Additional industry intelligence and
Fruition Horticulture client interactions also
informed the supporting commentary.
The model is a continuation of the
Viticulture Benchmarking Programme that
the Ministry for Primary Industries initiated
in 2004. The Programme is now co-funded
by the Ministry for Primary Industries and
New Zealand Winegrowers.
This model represents the dominant
grape-growing region in New Zealand of
Marlborough. According to New Zealand
Winegrowers’ most recent vintage survey,
this region accounted for almost 77 percent
of the grape harvest in New Zealand.
The model is based on a combination of
contract grower and winery-operated
businesses where the main source of
income is derived from grape growing.
Smaller lifestyle properties are excluded
from the benchmarking programme.
The aim of the model is to typify an
average vineyard for the region. Income
includes income from grapes, off-
vineyard income, new borrowing and
other direct vineyard income. Expenditure
includes vineyard production costs, debt
servicing, leasing, drawings, taxation,
development and capital purchases. In
2014 some expense categories were
redefined to better reflect vineyard
business classifications. These included
moving tractor repairs and maintenance
from vehicle expenses to repairs and
maintenance and moving mechanical
stripping from contract machinery work to
pruning (and tying down).
From 2014, the addition of new growers,
which includes winery-operated vineyards,
has impacted on the time series for some
items. Caution should be taken when
comparing individual expense items
between 2013 and 2016, especially other
wages, rates, other administration and
legal/consultancy.
Profitability in several other New Zealand
grape growing regions is also being
assessed through the development of gross
margins specific to dominant varieties in
respective regions.
Financial data in the viticulture model
relates to a year-end of 30 June.
nzwine.com
Marlborough vineyard model
The Marlborough model remains at 30
producing hectares. For 2016, data was
sourced from 38 vineyards compared with
31 vineyards in the previous year. Nine
vineyards are located in the Awatere Valley
and 29 vineyards in the Wairau Valley. There
are 29 contract growers and nine winery-
operated vineyards in the monitoring group.
Eight of the vineyards are 0– 10 hectares,
eight are 10–20 hectares, thirteen are
20–50 hectares and nine are 50 hectares
or larger. Sauvignon Blanc is the dominant
grape variety in the model, representing
79 percent of the producing area, followed
by Pinot Noir, Chardonnay, Pinot Gris and
Riesling. Four vineyards out of the 38 are
Bio-Gro certified and two others have trial
areas of organically grown grapes.
2016 Viticulture Monitoring Report Marlborough
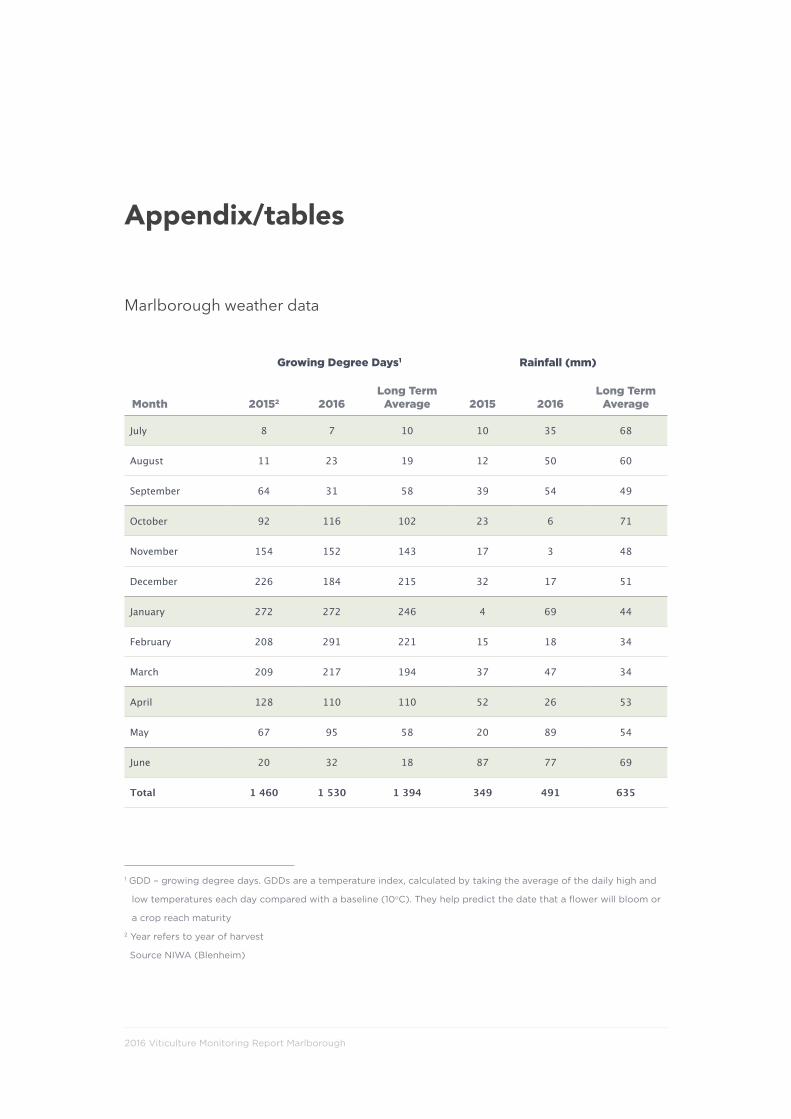
Marlborough weather data
Growing Degree Days1 Rainfall (mm)
Month 20152 2016Long Term
Average 2015 2016Long Term
Average
July 8 7 10 10 35 68
August 11 23 19 12 50 60
September 64 31 58 39 54 49
October 92 116 102 23 6 71
November 154 152 143 17 3 48
December 226 184 215 32 17 51
January 272 272 246 4 69 44
February 208 291 221 15 18 34
March 209 217 194 37 47 34
April 128 110 110 52 26 53
May 67 95 58 20 89 54
June 20 32 18 87 77 69
Total 1 460 1 530 1 394 349 491 635
Appendix/tables
1 GDD – growing degree days. GDDs are a temperature index, calculated by taking the average of the daily high and
low temperatures each day compared with a baseline (10oC). They help predict the date that a flower will bloom or
a crop reach maturity
2 Year refers to year of harvest
Source NIWA (Blenheim)
nzwine.com
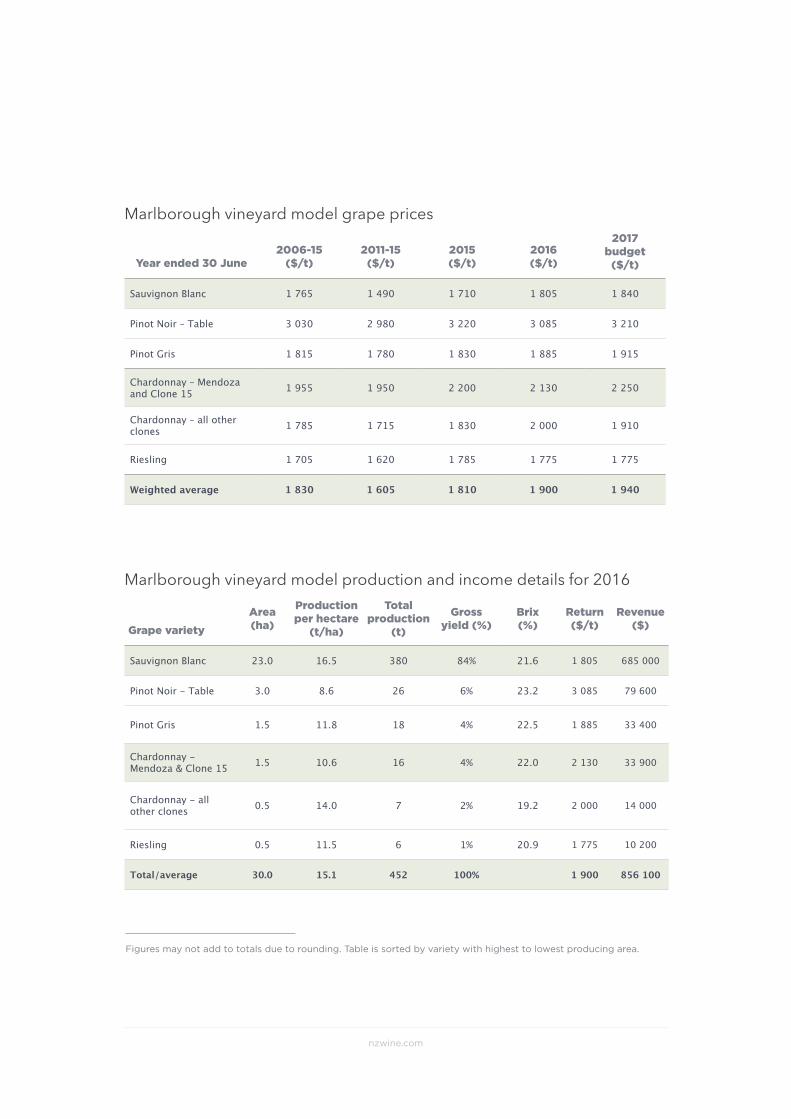
Marlborough vineyard model grape prices
Marlborough vineyard model production and income details for 2016
Year ended 30 June2006-15
($/t)2011-15
($/t)2015 ($/t)
2016 ($/t)
2017 budget
($/t)
Sauvignon Blanc 1 765 1 490 1 710 1 805 1 840
Pinot Noir – Table 3 030 2 980 3 220 3 085 3 210
Pinot Gris 1 815 1 780 1 830 1 885 1 915
Chardonnay – Mendoza and Clone 15 1 955 1 950 2 200 2 130 2 250
Chardonnay – all other clones 1 785 1 715 1 830 2 000 1 910
Riesling 1 705 1 620 1 785 1 775 1 775
Weighted average 1 830 1 605 1 810 1 900 1 940
Grape varietyArea (ha)
Production per hectare
(t/ha)
Total production
(t)
Gross yield (%)
Brix (%)
Return ($/t)
Revenue ($)
Sauvignon Blanc 23.0 16.5 380 84% 21.6 1 805 685 000
Pinot Noir - Table 3.0 8.6 26 6% 23.2 3 085 79 600
Pinot Gris 1.5 11.8 18 4% 22.5 1 885 33 400
Chardonnay - Mendoza & Clone 15 1.5 10.6 16 4% 22.0 2 130 33 900
Chardonnay - all other clones 0.5 14.0 7 2% 19.2 2 000 14 000
Riesling 0.5 11.5 6 1% 20.9 1 775 10 200
Total/average 30.0 15.1 452 100% 1 900 856 100
Figures may not add to totals due to rounding. Table is sorted by variety with highest to lowest producing area.
2016 Viticulture Monitoring Report Marlborough
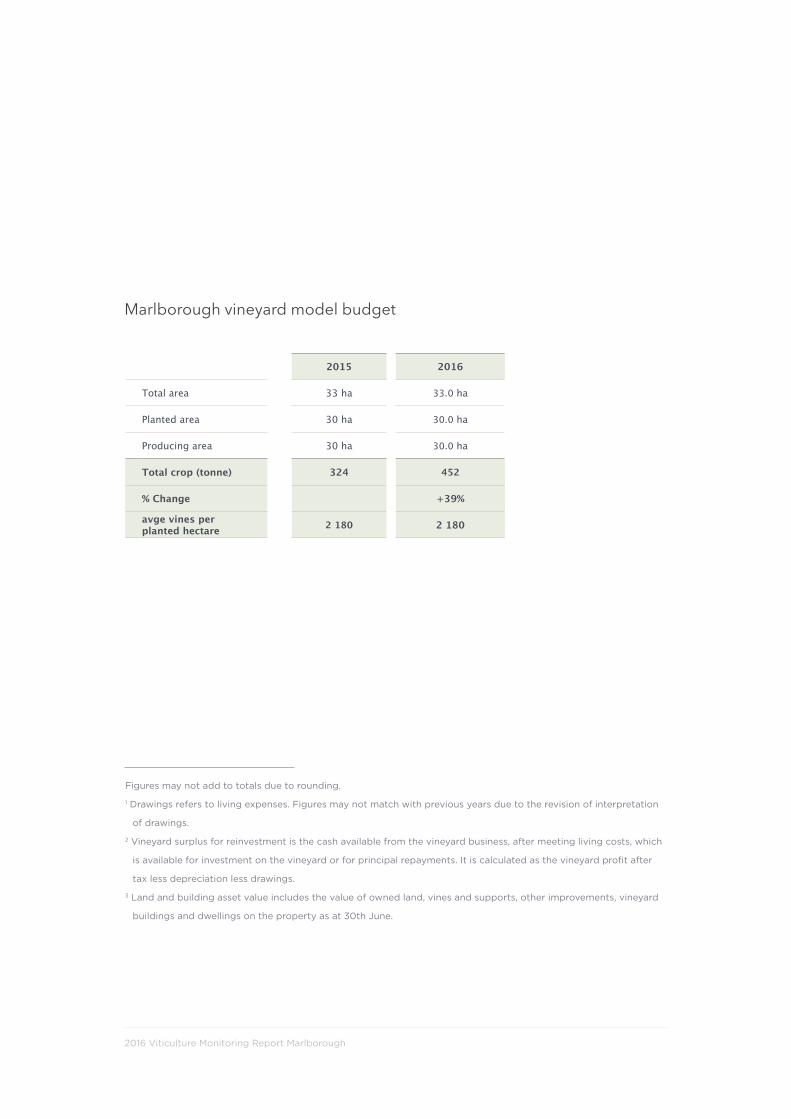
Marlborough vineyard model budget
2015 2016
Total area 33 ha 33.0 ha
Planted area 30 ha 30.0 ha
Producing area 30 ha 30.0 ha
Total crop (tonne) 324 452
% Change +39%
avge vines perplanted hectare 2 180 2 180
Figures may not add to totals due to rounding.
1 Drawings refers to living expenses. Figures may not match with previous years due to the revision of interpretation
of drawings.
2 Vineyard surplus for reinvestment is the cash available from the vineyard business, after meeting living costs, which
is available for investment on the vineyard or for principal repayments. It is calculated as the vineyard profit after
tax less depreciation less drawings.
3 Land and building asset value includes the value of owned land, vines and supports, other improvements, vineyard
buildings and dwellings on the property as at 30th June.
nzwine.com
Marlborough vineyard model budgetYear ending 30 June 2015 2016
Revenue Whole Vineyard ($)
% change
Whole Vineyard ($)
producing hectare ($)
per tonne gross ($)
per vine ($)
Income from grapes 587 300 46% 856 100 28 535 1 895 13.10
Other direct vineyard income 4 700 12 700 425 28 0.19
+ Net cash income 592 000 47% 868 800 28 960 1 924 13.29
+ Vineyard working expenses 291 600 7% 313 300 10 445 694 4.79
= Cash operating surplus 300 400 85% 555 500 18 515 1 230 8.50
- Interest 65 000 -6% 61 200 2 040 136 0.94
Rent &/or leases 8 200 0% 8 200 275 18 0.13
- Depreciation 44 000 -6% 41 400 1 380 92 0.63
- Net nonfruit cash income 0 0 0 0 0.00
- Vineyard profit before tax 183 200 143% 444 700 14 820 985 6.80
+ Tax 129 500 -100% 0 0 0 0.00
= Vineyard profit after tax 53 700 728% 444 700 14 825 985 6.80
- Allocation of funds
= Add back depreciation 44 000 -6% 41 400 1 380 92 0.63
Drawings/living expenses1 61 100 18% 72 200 2 405 160 1.10
+ Vineyard surplus for reinvestment2 36 600 1031% 413 900 13 795 916 6.33
- Reinvestment
Net capital purchases 30 900 -34% 20 400 680 45 0.31
Development 50 900 -83% 8 400 280 19 0.13
- Principal repayments 47 900 -5% 45 500 1 515 101 0.70
- Vineyard cash surplus/deficit -93 100 -465% 339 600 11 320 752 5.19
- Other cash sources
= Indirect cash income 24 000 13% 27 000 900 60 0.41
New borrowings 41 880 0 0 0 0.00
+ Introduced funds 0 0 0 0 0.00
+ Net cash position -27 220 -1 447% 366 600 12 220 812 5.61
+ Assets & liabilities
= Land and building3 4 927 830 16% 5 706 630 190 200 12 635 87.29
Plant and machinery 145 200 -6% 136 600 4 555 302 2.09
+ Total vineyard assets (closing) 5 073 030 15% 5 843 230 194 775 12 938 89.38
+ Total vineyard liabilities (closing) 1 073 300 -4% 1 027 800 34 260 2 276 15.72
= Total equity 3 999 730 20% 160 515 10 662 73.66
2016 Viticulture Monitoring Report Marlborough
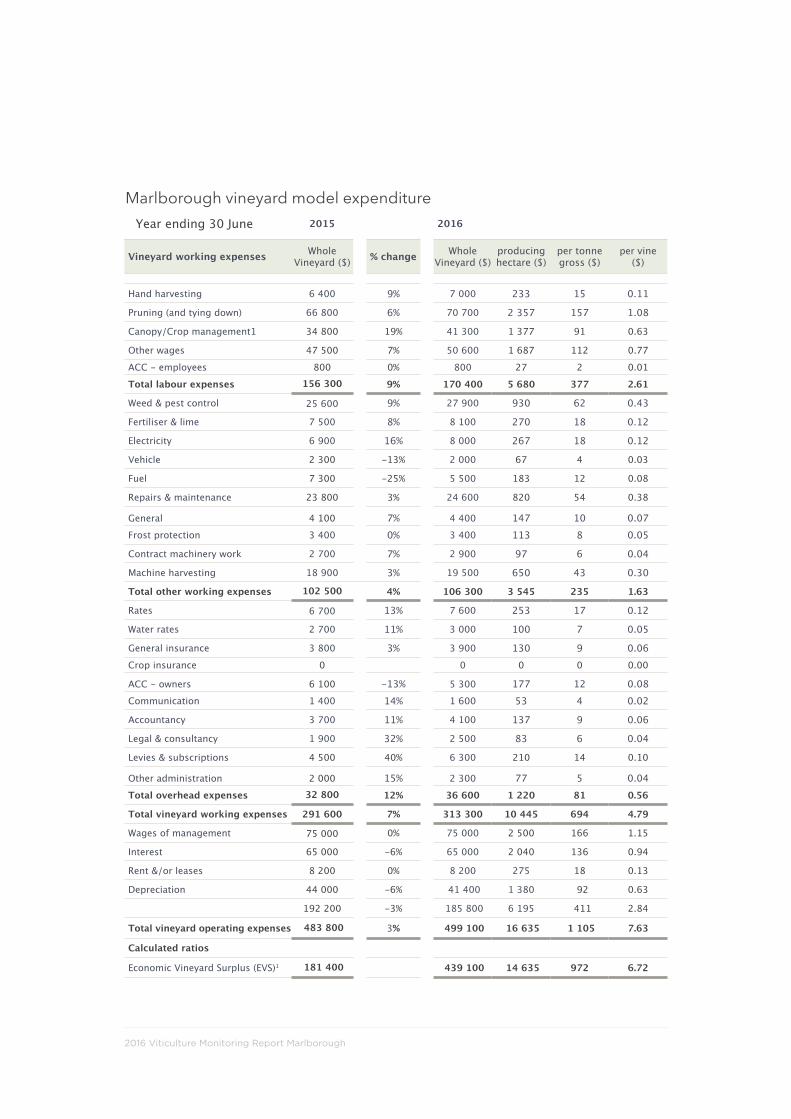
Marlborough vineyard model expenditureYear ending 30 June 2015 2016
Vineyard working expenses Whole Vineyard ($) % change Whole
Vineyard ($)producing hectare ($)
per tonne gross ($)
per vine ($)
Hand harvesting 6 400 9% 7 000 233 15 0.11
Pruning (and tying down) 66 800 6% 70 700 2 357 157 1.08
Canopy/Crop management1 34 800 19% 41 300 1 377 91 0.63
Other wages 47 500 7% 50 600 1 687 112 0.77
ACC - employees 800 0% 800 27 2 0.01
Total labour expenses 156 300 9% 170 400 5 680 377 2.61
Weed & pest control 25 600 9% 27 900 930 62 0.43
Fertiliser & lime 7 500 8% 8 100 270 18 0.12
Electricity 6 900 16% 8 000 267 18 0.12
Vehicle 2 300 -13% 2 000 67 4 0.03
Fuel 7 300 -25% 5 500 183 12 0.08
Repairs & maintenance 23 800 3% 24 600 820 54 0.38
General 4 100 7% 4 400 147 10 0.07Frost protection 3 400 0% 3 400 113 8 0.05
Contract machinery work 2 700 7% 2 900 97 6 0.04
Machine harvesting 18 900 3% 19 500 650 43 0.30
Total other working expenses 102 500 4% 106 300 3 545 235 1.63
Rates 6 700 13% 7 600 253 17 0.12
Water rates 2 700 11% 3 000 100 7 0.05
General insurance 3 800 3% 3 900 130 9 0.06Crop insurance 0 0 0 0 0.00
ACC - owners 6 100 -13% 5 300 177 12 0.08Communication 1 400 14% 1 600 53 4 0.02
Accountancy 3 700 11% 4 100 137 9 0.06
Legal & consultancy 1 900 32% 2 500 83 6 0.04
Levies & subscriptions 4 500 40% 6 300 210 14 0.10
Other administration 2 000 15% 2 300 77 5 0.04Total overhead expenses 32 800 12% 36 600 1 220 81 0.56
Total vineyard working expenses 291 600 7% 313 300 10 445 694 4.79
Wages of management 75 000 0% 75 000 2 500 166 1.15
Interest 65 000 -6% 65 000 2 040 136 0.94
Rent &/or leases 8 200 0% 8 200 275 18 0.13
Depreciation 44 000 -6% 41 400 1 380 92 0.63
192 200 -3% 185 800 6 195 411 2.84
Total vineyard operating expenses 483 800 3% 499 100 16 635 1 105 7.63
Calculated ratios
Economic Vineyard Surplus (EVS)1 181 400 439 100 14 635 972 6.72
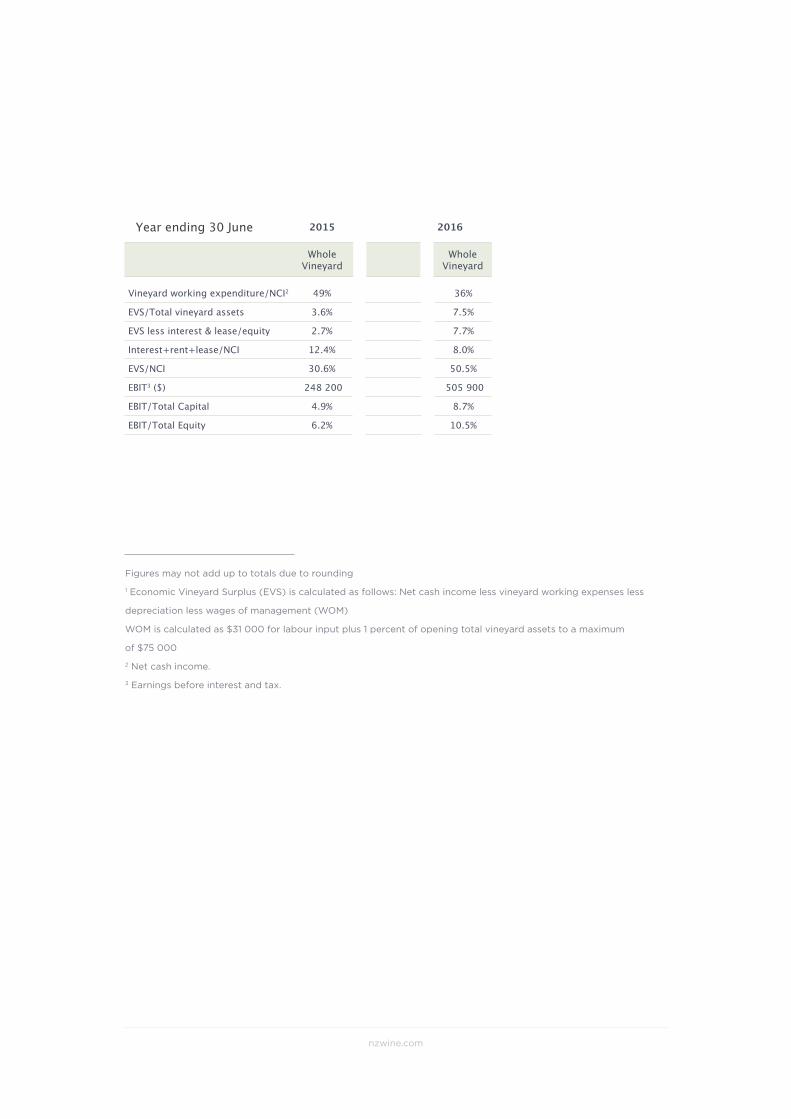
nzwine.com
Vineyard working expenditure/NCI2 49% 36%
EVS/Total vineyard assets 3.6% 7.5%
EVS less interest & lease/equity 2.7% 7.7%
Interest+rent+lease/NCI 12.4% 8.0%
EVS/NCI 30.6% 50.5%
EBIT3 ($) 248 200 505 900
EBIT/Total Capital 4.9% 8.7%
EBIT/Total Equity 6.2% 10.5%
Figures may not add up to totals due to rounding
1 Economic Vineyard Surplus (EVS) is calculated as follows: Net cash income less vineyard working expenses less
depreciation less wages of management (WOM)
WOM is calculated as $31 000 for labour input plus 1 percent of opening total vineyard assets to a maximum
of $75 000
2 Net cash income.
3 Earnings before interest and tax.
Year ending 30 June 2015 2016
Whole Vineyard
Whole Vineyard
2016 Viticulture Monitoring Report Marlborough
If you have any questions relating
to or for further information on
the model please contact :
Philip Gregan, CEO, NZ Winegrowers
[email protected] I 09 306 5555
Or Nick Dalgety, Policy & Trade, MPI
[email protected] I 03 545 9472
Disclaimer
The information in this report by the Ministry for Primary Industries is based on the best information available to the
Ministry at the time it was drawn up and all due care was exercised in its preparation. As it is not possible to foresee
all uses of this information or to predict all future developments and trends, any subsequent action that relies on the
accuracy of the information in this report is the sole commercial decision of the user and is taken at his/her own risk.
Accordingly, the Ministry for Primary Industries disclaims any liability whatsoever for any losses or damages arising
out of the use of this information, or in respect of any actions taken.

nzwine.com
2016 Viticulture Monitoring Report Marlborough
nzwine.com