Embed Size (px)
Citation preview
UNIVERSITY ok N-!RORi l ib r a r y
VITAMIN A DEFICIENCY AND ITS RISK FACTORS AMONG CHILDREN AGED 6 MONTHS TO 15 YEARS IN ARSSl ZONE, ETHIOPIA (f
£18 lHESfS m s Df f v a
D B O B fp a m iU c e (J P T B D EOSlN li a CO v\ X * £ PLaCED * * S
ByYonas Taffesse Asrat BSc. Bi^ogy
A thesis submitted in partial fulfillment of the requirements for the award of a Masters of Science Degree in Applied Human Nutriti°n. in the Applied Nutrition Program, Department of Food Technology and Nutrition, College of Agriculture
and Veterinary Sciences, University Nairobi
May,2000

DECLARATION
I, Yonas Taffesse Asrat hereby declare that this thesis is my original work and has not
been presented for a degree in any other university.
___ jt J L _________Yonas Taffesse Asrat
Date M ” *—
This thesis has been submitted with our approval as university supervisors.
Senior Lecturer, DFT & N
Date
Senior Lecturer, DFT & N
Date ^7 b j Woo_____

11
DEDICATION
This work is dedicated to my parents, the late Mr. Taffesse Asrat and Mrs. Shewaye
Alemayhu for sacrificing so much for my education.

Ill
ACKNOWLEDGEMENTS
I wish to express my special gratitude and appreciation to the United Nation University
(UNU) for funding this study and for my scholarship.
I am sincerely indebted to my supervisors Dr. A.M. Omwega and Dr J.W. Muita, for their
guidance, helpful suggestions and valuable comments throughout the preparation of this
thesis. I wish to thank Dr. Omwega, further for spending a lot of his time reviewing this
work and for coming to Ethiopia to evaluate the field work.
During the field work in Ethiopia, I received a lot of assistance from different people and
places. I would like to thank the Ethiopian Health and Nutrition Research Institute
(EHNRI), first for giving me study leave to undertake this course, and for providing me
with all the required support throughout the period of the field work. I am very much
indebted to the Head of Dera Health Center and his staff for the remarkable cooperation
and assistance I received from them. Of course, the study would have not been possible
without the participation and cooperation of the children in the study area and their
parents to whom I am very grateful.
Finally, I wish to express my deep appreciation to my beloved mother, brothers and
sisters who never ceased to encourage me throughout my study. My family Alemzewed
and Mesegana accepted the difficulties of life without me to comfort them. On top of my
wife's job commitments and care for our son, she always found the moral resources to
encourage and support me. I appreciate your determination and may God bless you.

ABSTRACTIV
A cross sectional study which was descriptive and analytical in nature was carried out
between February and April 1999 among children aged 6 months to 15 years in Dodotana
Sire district of Arssi zone, Ethiopia. The main objectives of this study was to determine
the vitamin A status of pre-school and school aged children and, determine the risk
factors of vitamin A deficiency in the study area. The methodologies used in data
collection included administration of questionnaire, anthropometric measurements,
clinical examination and serum retinol measurement and stool examination. A total of
402 children were included in the study. Food frequency data was collected from 350
randomly selected children. Serum retinol concentration was measured in 49 children,
including those with xerophthalmia and every twentieth of the remaining children.
Night blindness, Bitots spot, comeal xerosis, comeal ulceration and comeal scar were
observed in 7.2%, 2.2 %, 0.2%, 0.5%, and 0.5% of the children respectively, based on the
most severe eye signs. The prevalence of xerophthalmia was higher in school aged
children than preschool children (P< 0.0001). Based on the WHO recommended cut-off
level, serum retinol levels were in the "low" range (<20pl/dl) in 51% of the children. The
mean frequency of consumption of animal sources of vitamin A was 1.5 days/week and
weighted total of animal and plant sources of vitamin A was 1.9 days/week. Low
frequency of consumption of vitamin A rich food was significantly associated with ocular
signs of xerophthalmia (P<0.01).
Of the under 10 years old children (305) 35.7% were stunted, 6.8% wasted and 5.6%
both stunted and wasted. Intestinal parasites were observed in 16.6% of the children.
The prevalence of diarrhea, respiratory tract infection and measles in the last one month
was 10.2%, 4.7% and 0.25% respectively. The prevalence of diarrhea was twice as high
in children with xerophthalmia than children without (P<0.05). No statistically
significant association was observed between respiratory tract infection or measles or
intestinal parasite and occurrence of sign of xerophthalmia. Anthropometric
measurements did not show significant association with clinical sings of vitamin A
deficiency.
The results therefore, indicate that vitamin A deficiency is a public health problem in the
area with higher prevalence among school aged children than preschool children.
Inadequate intake of vitamin A rich foods and diarrheal diseases were the most important
risk factors for vitamin A deficiency in the study area.
It is recommended that the on-going vitamin A capsule distribution program among the
under six be strengthened and widened to include school children (up to 15 year olds) as
a short-term intervention measure. However, increasing the availability and consumption
of vitamin A rich foods through promotion of horticulture and nutrition education, and
public health measures such as the control of diarrheal diseases, are the recommended as
long-term control measures.

TABLE OF CONTENTSVI
Page
Declaration i
Dedication ii
Acknowledgement iii
Abstract iv
Table of Contents vi
List of Tables X
List of Figures xi
List of Appendices xii
Definitions xiii
Abbreviations xvi
CHAPTER I INTRODUCTION
1.1 Background 1
1.2 Statement of the Problem 4
1.3 Justification 5
1.4 Aim of the Study 6
1.5 Objectives 6
1.5.1 Specific Objectives 7
1.6 Study Questions 7
1.7 Expected Benefits 8
CHAPTER II LITERATURE REVIEW
2.1 Historical Background
2.2 Food Sources of Vitamin A
9
13

VH
2.3 Functions of Vitamin A 14
2.3.1 Vision 15
2.3.2 Reproduction 15
2.3.3 Maintenance of Epithelial Cells 162.3.4 Immunity 162.3.5 Growth 172.4 Epidemiology of Vitamin A Deficiency 18
2.4.1 Age 18
2.4.2 Sex 202.4.3 Season 212.4.4 Clustering 212.5 Risk Factors of Vitamin A Deficiency 222.5.1 Dietary Intake 222.5.2 Morbidity 242.5.2.1 Measles 252.5.2.2 Diarrhea 262.5.2.3 Respiratory Infection 272.5.2.4 Intestinal Worms 282.5.3 Protein Energy Malnutrition 282.6 Assessment of Vitamin A Status 292.6.1 Clinical Indicators 302.6.2 Biochemical Indicators 312.6.3 Dietary Assessment 32
CHAPTER III METHODOLOGY
3.1 Background of Study Area 353.1.1 Country Profile 353.1.2 Study Site 37

Vlll3.2 Study Design 40
3.3 Sampling 42
3.3.1 Sampling Procedure 42
3.3.2 Sample Size Determination 44
3.4 Consumption Frequency of Vitamin A Rich Foods 45
3.5 Breastfeeding and Weaning Practice 46
3.6 Morbidity 46
3.7 Anthropometric Measurements 46
3.7.1 Weight-for-Height & Height-for-Age 47
3.7.2 Body Mass Index 48
3.8 Ophthalmological Examination 49
3.9 Stool Examination 51
3.9.1 Stool Specimen Collection & Preparation 51
3.9.2 Stool Examination using "The Kato Thick Smear Technique" 52
3.10 Serum Retinol Measurement 53
3.10.1 Determination of Serum Retinol Level by HPLC 53
3.11 Ethical Consideration 56
3.12 Data Quality Control 56
3.13 Data Analysis 56
CHAPTER IV RESULTS
4.1 Demographic Characteristics 58
4.2 Prevalence of Vitamin A Deficiency 59
4.2.1 Clinical Examination 59
4.2.2 Biochemical Assessment 61
4.3 Risk Factors of Vitamin A Deficiency 64
4.3.1 Consumption of Vitamin A Rich Foods 64
4.3.1.1 Breastfeeding & Weaning Practice 67

IX
4.3.2 Anthropometry 68
4.3.2.1 Weight-for-Height & Height-for-Age 68
4.3.2.2 Body Mass Index 70
4.3.3 Morbidity 71
4.3.4 Stool Examination 72
CHAPTER V DISCUSSION
5.1 Prevalence of Vitamin A Deficiency 74
5.2 Risk Factors of Vitamin A Deficiency 79
CHAPTER VI CONCLUSION & RECOMMENDATIONS
6.1 Conclusion 88
6.2 Recommendations 89
References r 92
Appendices 98
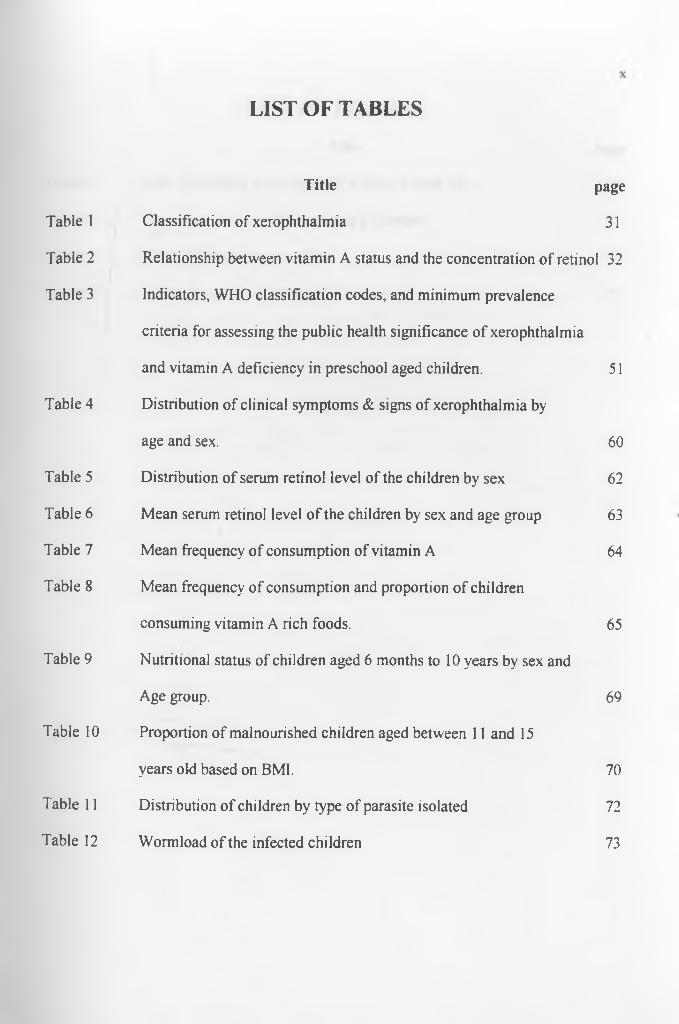
LIST OF TABLES
Table 1 Classification of xerophthalmia 31
Table 2 Relationship between vitamin A status and the concentration of retinol 32
Table 3 Indicators, WHO classification codes, and minimum prevalence
criteria for assessing the public health significance of xerophthalmia
and vitamin A deficiency in preschool aged children. 51
Table 4 Distribution of clinical symptoms & signs of xerophthalmia by
age and sex. 60
Table 5 Distribution of serum retinol level of the children by sex 62
Table 6 Mean serum retinol level of the children by sex and age group 63
Table 7 Mean frequency of consumption of vitamin A 64
Table 8 Mean frequency of consumption and proportion of children
consuming vitamin A rich foods. 65
Table 9 Nutritional status of children aged 6 months to 10 years by sex and
Age group. 69
Table 10 Proportion of malnourished children aged between 11 and 15
years old based on BMI. 70
Table 11 Distribution of children by type of parasite isolated 72
Table 12 Wormload of the infected children 73
Title page

Title Page
Figure 1 Map of Ethiopia showing Arssi zone and study site 38
Figure 2 Flow chart showing the sampling procedure 43
Figure 3 Study subjects by age and sex 58
Figure 4 Morbidity patterns in the study population 71
xi
LIST OF FIGURES

XII
A1 Countries categorized by degree of public health importance of
vitamin A deficiency 98
A2 The food supply of vitamin A for the period 1978-81 in the world
as a whole and in six regions. 99
A3 Distribution of xerophthalmia by religion 100
A4 Definition of intensity of infections used in this study 101
A5 Questionnaire 102
Demographic characteristics questionnaire 102
HKI Food Frequency questionnaire 103
Breast feeding and weaning questionnaire 104
Morbidity, sanitation and hygiene questionnaire 105
Anthropometric measurement 106
Ophthalmological examination 107
Laboratory examination 109
LIST OF APPENDICES
Title Page

Xerophthalmia
Night blindness
Conjunctival xerosis
Bitot's spots
Corneal xerosis
XlllDEFINITIONS
The general term applied to all ocular manifestation of impaired
vitamin A metabolism, from night blindness to xerophthalmic scar.
Maladaptation to dim light due to early stage of vitamin A
deficiency.
The earliest, clinically detectable, structural changes on the surface
of eye due to vitamin A deficiency. It consists of one or more
patches of dry, non-wettable conjunctiva.
A white foamy or cheesy like substance appeared on the
conjunctiva due to vitamin A deficiency. It is no more than an
extension of conjunctival xerosis.
Xerosis of the cornea due to hypovitaminosis A. The corneal
surface has a rough, line "pebbly' appearance and lacks luster. At
the later stage the cornea may become hazy with a bluish, milky
appearance present in the lower central part.
XIV
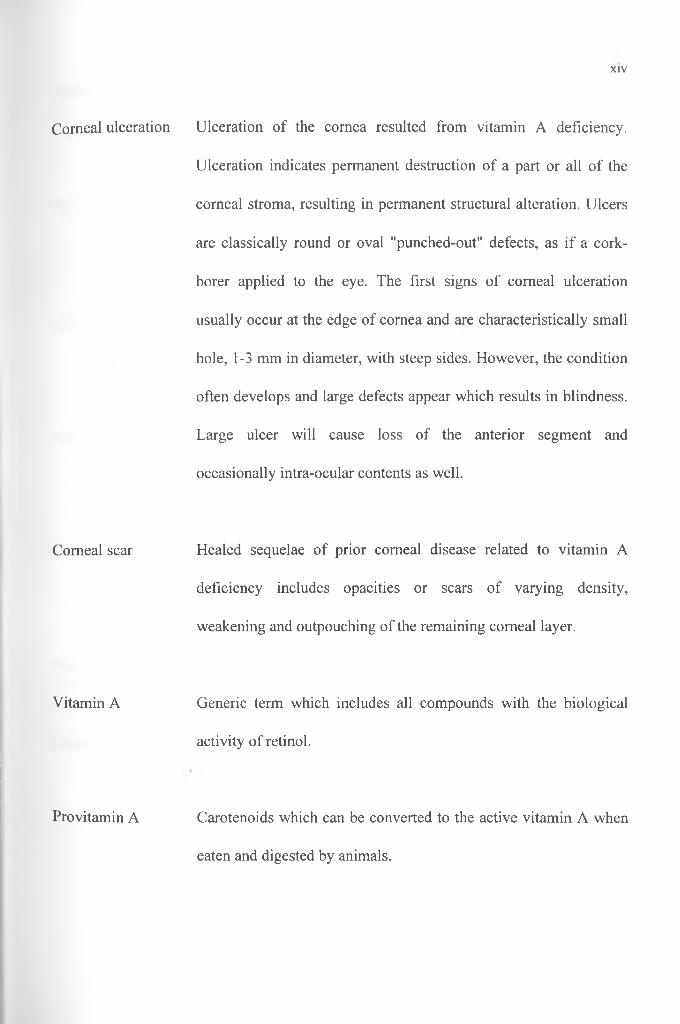
Corneal ulceration Ulceration of the cornea resulted from vitamin A deficiency.
Ulceration indicates permanent destruction of a part or all of the
corneal stroma, resulting in permanent structural alteration. Ulcers
are classically round or oval "punched-out" defects, as if a cork-
borer applied to the eye. The first signs of corneal ulceration
usually occur at the edge of cornea and are characteristically small
hole, 1 -3 mm in diameter, with steep sides. However, the condition
often develops and large defects appear which results in blindness.
Large ulcer will cause loss of the anterior segment and
occasionally intra-ocular contents as well.
Corneal scar Healed sequelae of prior corneal disease related to vitamin A
deficiency includes opacities or scars of varying density,
weakening and outpouching of the remaining corneal layer.
Vitamin A Generic term which includes all compounds with the biological
activity of retinol.
Provitamin A Carotenoids which can be converted to the active vitamin A when
eaten and digested by animals.

XV
Household size The total number of people living in a household during the study
period.
Teff (Eragrosis abyssinica) A tiny grain related to millet from which the staple food in
Ophthalmology
Ethiopia, 'Injera' is made which is indigenous to Ethiopia.
The branch of medical science which deals with the diseases and
refractive errors of the eye.
Diarrhea This term was defined as three or more lose or watery stool passed
in a day for at least five days.
Respiratory infection This term was defined by the presence of fever and cough for at
least five days.
Measles This term was defined by the presence of fever and a blotchy rash.
Household All the people who live together and operate as a unit, including
such members as unrelated servants, lodgers etc.
XVI
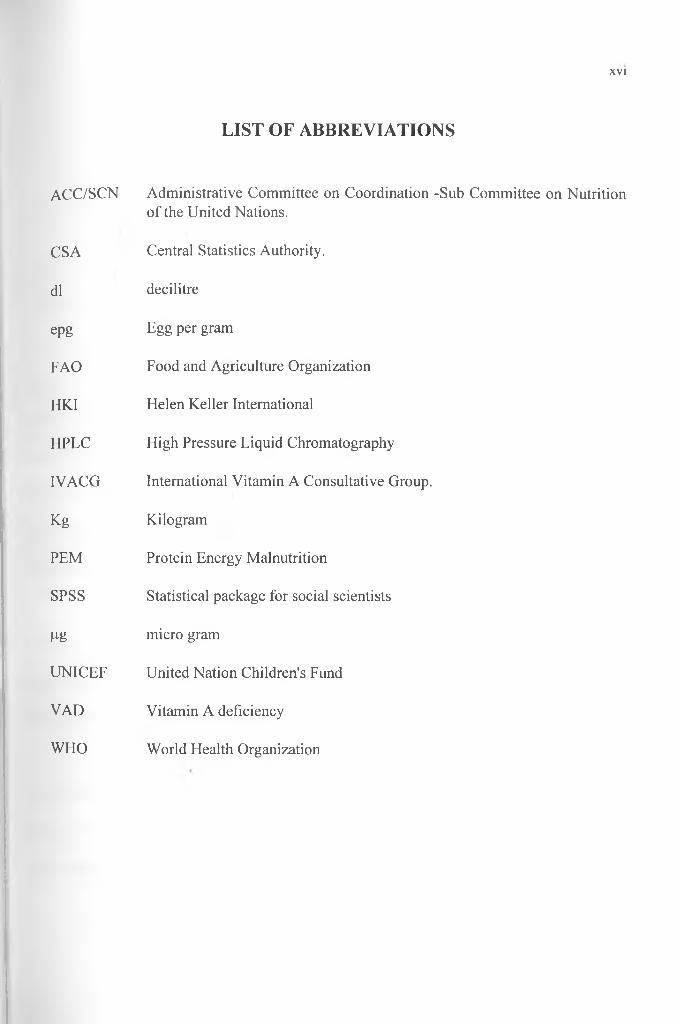
LIST OF ABBREVIATIONS
a c c /sc n Administrative Committee on Coordination -Sub Committee on Nutrition of the United Nations.
CSA Central Statistics Authority.
dl decilitre
epg Egg per gram
FAO Food and Agriculture Organization
HKI Helen Keller International
HPLC High Pressure Liquid Chromatography
IVACG International Vitamin A Consultative Group.
Kg Kilogram
PEM Protein Energy Malnutrition
SPSS Statistical package for social scientists
Pg micro gram
UNICEF United Nation Children's Fund
VAD Vitamin A deficiency
WHO World Health Organization

CHAPTER I
INTRODUCTION
l l Background
Vitamin A is a generic term for all retinoids that qualitatively exhibit the biological
activity of all trans retinol. Vitamin A is found in food in two forms, as preformed
vitamin A and provitamin A. Certain carotenoids have provitamin A activity, of these P-
carotene is the most biologically active. Provitamin A carotenoids are found in both plant
and animal products. The most important sources are yellow, yellow-red, and dark green
leafy vegetables and fruits. Preformed vitamin A is found only in foods of animal origin
such as fish, liver, butterfat and eggs. Preformed vitamin A is a better source of vitamin
A compared to provitamin A.
The best-defined physiological role of vitamin A is in vision. But it is also involved in
the immune system, reproduction, maintenance of differentiated epithelia, and in the
formation of specific glycoproteins.
The most obvious consequence of vitamin A deficiency (VAD) is progressive damage to
the eye. The general term for this is xerophthalmia, which ranges from the mildest form,
night blindness to ulceration and destruction of the cornea and blindness. VAD occurs
2
when the dietary intake of vitamin A is insufficient to meet the bodies requirement or
impairment of the absorption and utilization of vitamin A due to disease conditions. In
addition, vitamin A deficiency is exacerbated by low intake of protein and fat.
There is a synergetic relationship between vitamin A deficiency and infections. Poor
vitamin A status is likely to prolong or exacerbate the course of illness by impairing the
immune system. Infections, on the other hand, reduce the intestinal absorption of
carotenoids and vitamin A, increase the metabolic demand or reduce the efficiency of
retinol transport and utilization. Infectious diseases that have an association with vitamin
A deficiency include diarrhea, respiratory infection, measles and helminthiasis. A study
conducted in Indonesia demonstrated that children with diarrhea or respiratory tract
infection are twice likely to develop xerophthalmia than children who are free of
infection (Sommer et al., 1987). It is also stated that serious infection can precipitate
episodes of xerophthalmia (Reddy et al., 1986). Evidence from Africa and other part of
the world indicate that about one quarter to one half of all cases of corneal blindness in
young children are associated with measles (cited in Mclaren D. and Frigg M., 1997).
An association of severe vitamin A deficiency with child mortality had been established
long ago (IVACG, 1981) when the deficiency was seen as least a contributory cause of
death. Recent studies, however, demonstrated that even mild vitamin A deficiency
increases the rate of mortality. Sommer and his colleagues in their study in Indonesia
showed that mortality rate among children with mild xerophthalmia (night blindness and

3
Bitot's spot) was on the average, four times higher than that of children without
xerophthalmia (Sommer etal., 1983).
World wide, over 100 million preschool children suffer from vitamin A deficiency
(UNICEF, 1998). Each year, it is estimated that between 250,000 to 500,000 preschool
children go blind from vitamin A deficiency with about two-third of these children dying
within months of going blind (Suhamo D., 1994).
The World Health Organization classifies countries according to evidence of subclinical
as well as clinical vitamin A deficiency in all or part of the territory (see appendix Al).
Accordingly, there are 60 countries in which VAD is a clinically or subclinically
significant public health problem (WHO, 1995). Ethiopia falls in this category. A
national VAD survey conducted in 1981 revealed a Bitot's spot rate of one percent
among preschool children, which is well above the criteria of 0.5 % laid down by WHO
(1982). Since then, a number of localized studies have been carried out on vitamin A
deficiency. The findings of these studies confirm that VAD is a public health problem in
some parts of the country (De sole et al., 1987; Wolde-Gebriel et al., 1992; Yonas et al.,
1996,97).

1.2 Statement o f the Problem4
The cause of vitamin A deficiency is complex. It depends on the type and the amount of
vitamin A and provitamin A ingested, absorbed, transported and in the storage capacities
and metabolic needs of the individual. Disease, more particularly measles and
gastrointestinal, respiratory and urinary tract infection, can dramatically alter each of
these factors, and in turn, the individuals vitamin A balance. For instance, episodes of
acute infection are thought to deplete body hepatic reserves of vitamin A; gastroenteritis
will decrease appetite and the absorption of any vitamin A that is ingested (Sommer,
1995). The contributions of these risk factors to vitamin A deficiency, however, vary
from one community to another. In some communities availability and accessibility to
vitamin A and provitamin A might be the major risk factors for vitamin A deficiency. In
others where the prevalence of diarrhea or respiratory tract infection or both, is high, the
contribution of these diseases to vitamin A deficiency might be profound. Still, in other
protein energy malnutrition and low intake of fat can be precipitating factors. Thus, it is
of paramount importance to know the risk factors of vitamin A deficiency in a given
community to design an effective intervention program. Such information is in fact very
crucial for a country like Ethiopia where the VAD problem is of public health significant.
Preschool children are the most susceptible group to vitamin A deficiency (IVACG 1981,
WHO, 1982). However, some studies indicated that school age children are also
vulnerable to vitamin A deficiency due to increased requirement to growth, especially

5
during the adolescent growth spurt (Mclaren D. and Frigg M.,1997). Although mortality
rate in school age children is low compared to preschool children, frequent morbidity
occurs among school-aged children, such as upper respiratory tract and febrile illnesses,
parasitism, and diarrhea. Studies conducted in two Africa countries showed that VAD is
a public health significant problem in school age children (WHO, 1993). Studies
conducted in Ethiopia on preschool children demonstrated that the prevalence of
xerophthalmia increases with age (De sole et al., 1987; Wolde-Gebriel et al., 1991).
Furthermore, other studies have shown that corneal ulceration reaches its maximum in
the fifth and sixth year of life (Wolde-Gebriel et al., 1993) while xerophthalmia reaches
its peak in children aged 60 to 72 months (Yonas et al., 1996). These findings suggest
that vitamin A deficiency may will be a public health problem among the school age
children in Ethiopia. Yet, information on vitamin A status of school age in Ethiopia is
rather scarce.
1.3 Justification
Vitamin A deficiency continues to be a major public health problem in Ethiopia. Over
the last four decades, a number of studies on vitamin A deficiency were carried out in
Ethiopia on under six years of age children. Few of these studies investigated the risk
factors of vitamin A deficiency. No study investigated the vitamin A status of school
, aged children in spite of the fact that there is evidence that the prevalence of VAD
increase with age. Presumably, the lack of this information is the basis for which the on-

6
going VAD control program in the country has focused much on vitamin A capsule
distribution only to under six children. This study was designed to investigate the
vitamin A status of both preschool and school age children and the associated risk factors
for vitamin A deficiency, in order to provide the lacking information.
14 Aim o f the Study
The risk factors of vitamin A deficiency in Ethiopia in general and in Arssi zone in
particular are not documented. Information on the vitamin A status of school age
children is also very limited. Thus, the aim of this study is to provide information on risk
factors of VAD and vitamin A status of school age children in Arssi zone, Ethiopia, in
order to contribute to the localized and national VAD control programs.
1.5 Objectives
The study is intended, particularly to investigate the risk factors of vitamin A deficiency
and vitamin A status of children aged 6 months to 15 years in Arssi, Ethiopia.
Eventually, it tries to draw up viable generalization based on the findings about the risk
factors of vitamin A deficiency and vitamin A status of preschool and school age children
in similar areas.

7
/. 5.1 Specific Objectives
1. To determine the prevalence of VAD among children age 6 months to 15
years in the study area.
2. To determine vitamin A and provitamin A intake of subjects by food
frequency.
3. To determine the prevalence of diarrhea, measles, respiratory tract
infection, intestinal helminthiasis and protein energy malnutrition among
the study subjects.
4. To describe the relationship between VAD and the risk factors (vitamin A
intake, diarrhea, measles, respiratory tract infection, intestinal
helminthiasis and protein energy malnutrition) in the study population.
1-6 Study Questions
T What is the prevalence of vitamin A deficiency in the study area by
clinical examination and laboratory assay?
8
2 Which of these risk factors (dietary intake, diarrhea, measles, respiratory
tract infection, intestinal helmithiasis and PEM) has contributed to VAD
in the study area.
/ 7 Expected Benefits
In Ethiopia, the risk factors of vitamin A deficiency and vitamin A status of
school age children are not well known. As a result, the national vitamin A
deficiency control program and other localized control programs have not been
designed to tackle the cause of the deficiency effectively. Moreover, they have
been targeted only on preschool children. The findings of the present study will
provide a good insight on the causes of VAD and the vitamin A status of school
age children in the study area. It will enable health planners and policy makers at
regional and national levels to design and implement short-term and long-term
VAD control programs based on solid scientific data.
CHAPTER II
LITERATURE REVIEW
2 1 Historical Background
Night blindness was recognized as early as 1500 BC and different ways of treating cases
were reported in ancient Egypt. The Ebers papyrus, written about 1600 BC in Egypt
prescribed liver for those who suffered from night blindness (International Children
Center, 1986). In ancient Greece the consumption of cooked liver was practiced
following the experience in Egypt (Wolf G., 1978).
With increasing attention on the part of physicians to careful description of the disease
and more precise consideration of the circumstance, the concept of xerophthalmia began
to emerge. The French physician Jacque Gillemea gave a good description of
xerophthalmia in 1585 (International Children Center, 1986). Later on, in 1800s the
modem concept of xerophthalmia was established, when dogs that were “starved” on
sugar and distilled water developed perforating comeal ulcer resembling those in “ill
nourished infants” (Sommer A., 1995). Hubbent (1860) described the occurrence of
epithelial dryness and scaling of conjunctiva and corneal in night blind and malnourished
subjects who respond positively to ingestion of beef liver (cited in Sommer A., 1982).
Later in 1863 Bitot described the foamy patches in the conjunctiva that bear his name. To
date, Bitot’s spots are the most important clinical signs of vitamin A deficiency.
9

10At about the same time, the relationship of poor general health and infectious diseases to
xerophthalmia was noted in relation to intestinal disease and liver disease (cited in
Mclaren, 1999). Later in 1923, Werkman observed that rat fed vitamin A deficient diet
were less resistant to infection with typhoid or anthrax bacilli (cited in Beaton G. et al.,
1993). In 1925, Wolbach and Howe gave a classic account of the epithelial metaplasia
and keratinization of the respiratory tract and other organs in vitamin A deficient animals
(quoted in Sommer A., 1992). Despite these early findings, only in the 1980s did the
present-day intense interest in the relationship of vitamin A and infectious diseases
emerge.
Although the cure for night blindness had been known since time immemorial, it was not
realized by scholars until the beginning of the 1900s that the condition was caused by
lack of a specific nutrient. In 1913, Osborne and Mendel, and McCollum and Davis
independently identified a fat-soluble growth factor, which later on proved to be vitamin
A. In 1917, McCollum and Simmonds demonstrated that lack of vitamin A caused
xerophthalmia in rats. Moore (1920) established a chemical relationship between a
substance found in plant tissue called (3-carotene and vitamin A (cited in Beaton G. et al.,
1993). In 1936, Fuson and Christ, and Kuhn and Morris synthesized vitamin A. About a
decade later, commercially feasible process for the synthesis of vitamin A from P-ionone
was developed by Otto Isler and his team. Later on, Pommoer developed another
excellent commercial process for the synthesis of vitamin A (cited in MacLaren, 1999).
Currently, the synthesis of vitamin A is a very simple process, which makes the cost of
11the vitamin very low. The cost of the UNICEF 200,000 IU vitamin A capsule is less than
2 lis cents (Eastman, 1987; West K and Sommer A, 1993).
Night blindness was widespread in Europe in the medieval times. However, as the
education level and income increases and diet becomes more diversified the disease
dwindled. In the 1900s, the disease was observed in developed countries rather
sporadically and under special circumstances. It occurred in Japan and Denmark in 1904
and 1917, respectively, due to the scarcity of food. According to FAO, the supply of
vitamin A in industrialized countries is generally high and most derived from the readily
available retinyl esters (cited in Beaton G. et al., 1993).
On the contrary, vitamin A deficiency continues to be the single most important cause of
childhood blindness in developing countries. Recently, WHO reported that clinical and
sub-clinical vitamin A deficiency are public health problems in 60 countries, and it is
likely to be a problem in at least an additional 13 countries. An estimated 2.8 to 3
million preschool-age children are clinically affected, and 251 million are sub-clinically
affected at a severe and moderate level based on serum retinol distribution (WHO, 1995).
Most countries with clinical VAD are found in south and Southeast Asia and sub-Saharan
Africa. However, due to high population density, the largest numbers of persons affected
by VAD are in south and Southeast Asia.

12In Ethiopia, vitamin A deficiency has long been recognized as public health problem.
Back in 1958-59 a survey conducted by the United States Interdepartmental Committee
on Nutntion For National Defense revealed a Bitot’s spots rate of 1.5% (ICNND, 1959).
Demeke et al (1982) reviewed the medical records of 188,737 outpatients that had been
seen in two Addis Ababa hospitals with pediatric and ophthalmic services. A total of 685
(0 36 %) patients were identified as cases of hypovitaminosis A. Another study
conducted in Gidole Hospital in Gamo Gofa administrative region, showed that out of
116 children admitted with measles, one case had corneal ulcer and two cases had
keratomalcia (Lindtjom, 1983). A Population based study carried out in a district
bordering Arssi and Bale administrative region demonstrated a Bitot’s spot rate of 5%
(De Sole et al., 1987). The national VAD prevalence survey, which was conducted
between 1980 and 1981 showed that 1% of preschool children, had Bitot’s spot (Wolde-
Gebriel et al., 1991). A number of other localized studies that have been carried out in
different part of the country also indicated that VAD is a public health problem at least
some part of the country (Wolde-Gebrile et al., 1993; Yonas et al., 1996; Yonas et al.,
1997). Moreover, there are terms in the major languages of Ethiopia for night blindness:
‘dafent” in Amharic, “gahmi” in Tigrigna and “bebereti” in oromegana. These imply
that the deficiency has been a well-recognized problem in the country. Although the
existence of the problem among preschool children was established long ago, more than
three decades elapsed before any type of control program was launched. Recently, a
control measure mainly focused on vitamin A capsule distribution among the preschool
children has commenced.

2 2 Food Sources o f Vitamin A13
In developed countries, the predominant source of vitamin A in the diet is pre-formed
vitamin A, which is derived from animal products such as milk, butter, cheese, egg yolk
and liver. In most developing countries, provitamin A carotenoids are the main source of
vitamin A. Of all provitamin A carotenoids, (3-carotene, which has a structure identical
with retinol in both halves of the molecule, has the highest vitamin A activity. Provitamin
A carotenoids are mostly present in fruits and vegetables. Some of these are particularly
rich, especially yellow or red vegetables (carrots, pumpkins), dark green leaves such as
spinach and amaranth leaves, and yellow fruit such as mango and papaya. Some grains,
such as yellow maize and tubers such as sweet potatoes also contain notable amounts of
provitamin A carotenoids. Red palm oil has the highest carotenoid concentration in the
vegetable kingdom.
Due to the differential in efficiency between the retinol and carotenoids, distinction
should be made between the vitamin from animal source and plant source. To express
the biological activities of preformed and provitamin A in common unit, scholars
developed a unit called retinol equivalent (RE).
IRE = 6pg p - carotene = 12 pg other provitamin A carotenoids
Hence, preformed vitamin A has 6 times higher biological activity than P- carotene, and
12 times than other provitamins.

FAO (1993) indicated that poor people obtain most of their nutrients from plant foods,
which are cheaper and more accessible than animal foods. In Africa, for example, 81
percent of the vitamin A supply is derived from plant sources (McLaren D. & Frigg
M 1997)- In Ethiopia as in other African countries, the dietary supply of vitamin A is
predominantly from plant sources.
General economic development may increase the supply of food rich in vitamin A,
improve their distribution as markets expand, and improve the purchasing power of the
at-risk population. As indicated earlier, gradual disappearance of vitamin A deficiency
was observed in the developed country with economic development. Moreover, analysis
of food balance sheet showed that the supply of vitamin A substantially increased in
previously deficient South East Asia and South Asia. In contrast, the supply is low and
probably not improving in Eastern and Southern Africa (Gillespie S. and Mason J.,
1994).
2.3 Functions o f Vitamin A
Although vitamin A was chemically identified in 1931, the exact mechanisms of vitamin
A function in the body are not well understood except on eyes (McLaren, 1999). This
might be due to the difficulty to study its function, since it is needed only by complex
organisms. However, a number of metabolic roles of the vitamin have been identified.
14
2.3.1 W o n
15
The most completely understood function of vitamin A at molecular level, to date, is the
role of retinyl aldehyde (retinal) in forming visual pigment in the photoreceptor cells
(rods) of the retina of the eye. Rod cells contain many stacked, disk-like membrane
vesicles, which serve as light receptors. The membrane of the vesicles contains the light
absorbing protein, rhodopsin and the vitamin A derivative, 11-cis-retinal. When
rhodopsin is exposed to light, the 11-cis-retinal is transformed to all-trans-retinal, and
this is accompanied by change in the conformation of the protein. In the process of
returning to the original conformation in the dark, there is a release of energy which
result ultimately in the generation of electrical impulse that travel along the optic nerve
to the brain to create a visual image. Thus, when vitamin A is deficient, the rhodopsin
level decreases in the eye and night blindness ensues.
2.3.2 Reproduction
The role of retinol in reproduction is possibly mediated through its involvement as
cofactor for the enzymes 11-p steroid hydroxylase and 5, 3p*hydroxysteroid
dehydrogenase. The latter enzyme converts pregnenolone to progesterone, which is a key
intermediate in the synthesis of variety of steroid hormones including the glucocorticoids,
androgens and oestrogen. Thus VAD gives rise to the production of abnormal sperm in
males and, low rates of conception and increased rates of still births in females.

16
2.3.3 Maintenance o f epithelial cells
Vitamin A helps to develop and maintain moist and healthy epithelial tissue, the tissue
that lines the body’s external and internal surfaces. Deficiency of vitamin A lead to
keratinization of the epithelium tissue, such as conjunctival and corneal epithelium of the
eye, and all mucus membranes of the digestive, urinary and respiratory tract.
Furthermore, it affects the integrity of the epithelium barrier and makes the cells to lack
normal secretions, with loss of cilia to keep the surface clean. Vitamin A deficiency, has
been associated with diarrhea and respiratory tract infection, presumably related to a
weakened condition of the respective intestinal or pulmonary lining (Eastman, 1987).
2.3.4 Immunity
Vitamin A status influences the ability of the immune system to respond.
Hypovitaminosis A impairs the integrity of the epithelium layers by permitting
keratinization, which could lead to increased penetration of bacteria, viruses and
parasites through altered epithelial barriers (Eastman, 1987). In the intestine, a
reduction in the number of goblet cells and in mucus production disrupts non-specific
defence mechanisms of the gastrointestinal tract. VAD also decreases immune system in
other several ways including changes in lymphoid cell maturation, abnormal production
°f cytokines and lymphokines that regulate the immune response, and alters the

membrane structures that could affect the cell's receptors antigens and regulatory
molecules (Beaton G. et al., 1993).
A number of studies have shown the role of vitamin A in the immune system. Lysoyzme
activity in leucocytes from Indian children with VAD was observed to be decreased,
returning to normal after treatment (Mohanram M. et al., 1974). Reduction in infection
when vitamin A or P-carotene is given before or shortly after exposure to a bacterium is
also documented (Somer E., 1992).
2.3.5 Growth
Vitamin A is essential for normal bone growth and the formation of soft tissue. The
function of vitamin A in bone growth may involve the conversion of immature cells to
osteoblasts, which are responsible for increase in the number of cells. In experimental
animal where other variables can be controlled, dietary restriction of vitamin A showed a
decrease in the velocity of growth (Eastman, 1987; Beaton G. et al., 1993). However, it
is very difficult to observe such an effect on young children due to various reasons:
specific restrictions can not be applied as in the case of experimental animals and VAD
frequently accompanies infections and this influences nutritional status in several ways.
17

18
McLaren And Frigg (1997) noted that periodic mega dose vitamin A supplementation
seems to have a significant impact on growth of xerophthalmic children but not in
children with sub-clinical deficiency.
2.4 Epidemiology o f Vitamin A Deficiency
The occurrence of xerophthalmia and vitamin A deficiency follows recognized patterns
with respect to place, time and person. Those factors that have prominent association of
xerophthalmia include age, sex, season and clustering.
2.4.1 Age
Preschool children: Both the clinical and sub-clinical vitamin A deficiency can occur
at any age (WHO, 1995). However, VAD is most frequently encountered in preschool
children in many areas of the world (IVACG, 1981). This is not surprising, since the
requirement of children per kg of body weight is about three times higher than that of
adults. Furthermore, preschool children are at increased risk of VAD due to higher
incidence of intestinal infestations and respiratory tract infections, which impair vitamin
A absorption, storage, transport and utilization. PEM incidence, which is high in this age
group also, interferes with the transportation of the vitamin. Measles on the other hand
increases these children's metabolic demand of the vitamin.
19School aged Children: Vitamin A deficiency is a major public health problem
among preschool children in much of the developing world. However, it has recently
been recognized that its impact goes well beyond this age group. A publication from
India showed that nearly 80% of school-aged children (5-15 years) had low serum retinol
(<20pg/dl) accompanied by significant low intake of preformed vitamin A and
provitamin A compared to Recommended Dietary Allowance (Pant I. and Gopaldas T.,
1986). A study carried out on children aged 6-10 years in Burkina Faso demonstrated a
Bitot's spots rate as high as 2.15% (WHO, 1993). These findings suggest that VAD is a
major nutritional problem among school age and pre-adolescent children. For these age
groups visual impairment caused by vitamin A deficiency has deleterious effect on their
education, which impacts upon family, community and national development. Hence,
there is a need to provide adequate vitamin A for these children. While a clear priority
exists to prevent VAD in preschool children, increased attention needs to be given to the
extent and severity of VAD and its risk factors among school-aged and pre-adolescent
children which has been focused in this study. This information will particularly be
important for health planners of the Ministry of Health, Arssi zone and Dodottan Serie
woreda health departments who are currently in charge of the vitamin A deficiency
control program in the study area.
2.4.2 Sex
Investigations on the experimental animals and humans in general point toward the
i:reater susceptibility of male to the effect of VAD ( McLaren D. and Frigg M., 1997). In
healthy human adults plasma retinol and retinol binding protein (RBP) are both higher in
men than female (IVACG, 1981). Gender difference in risk of VAD has mostly been
observed at milder stages. Higher risks of night blindness and Bitot’s spots are frequently
observed in boys than girls (Sommer A., 1995). This greater vulnerability of boys to mild
Xerophthalmia has also been reported from Ethiopia and elsewhere (De sole et al., 1987;
Wolde-Gebriel et al., 1991; Yonas et al., 1997; Bushra et al., 1987; cited in IVACG,
1981).
Conversely, a detailed longitudinal study by Sinha and Bang did not show any sex
difference in the prevalence of mild xerophthalmia (cited in McLaren D. and Frigg M.
1997). Studies conducted on supplementary trials also demonstrated no major difference
in the relative effectiveness of vitamin A between the sexes (Beaton G. et al., 1993).
This indicates that study findings on the association between sex and xerophthalmia are
not consistent. Corneal ulceration equally affects both sexes in most societies or culture
(Sommer A., 1995). IVACG noted that male preponderance to mild VAD is more likely
to be related with cultural factors rather physiological (IVACG, 1981).
20
2.4.3 Season21
The occurrence of xerophthalmia follows certain seasonal patterns, which correspond to
periodic availability of food and disease. Xerophthalmia is more prevalent during the hot
dry season when, vegetables which are an important source of dietary vitamin A, are in
short supply and measles and diarrhea are common (Sommer A, 1995). In South Asia
xerophthalmia normally reaches peak in the late, dry season (Hennig A. et al., 1991).
This peak is also associated with the “measles season” (Reddy V. et al., 1986).
Xerophthalmia declines in summer with increase in availability and intake of provitamin
A-rich food (Zeitlin M, et al., 1992).
2.4.4 Clustering
Vitamin A deficiency is usually found in clusters, i.e., children that are immediate
neighbor of an active case of xerophthalmia are more likely to be deficient in vitamin A,
and at higher risk of xerophthalmia than children of the same age, sex, and
socioeconomic status residing in different parts of the same village or town (Sommer A.,
1995).
It is also well documented that VAD clusters in the household and is more likely to occur
■n siblings. Children in the same household exhibit similar vitamin A status. Findings
from four countries ( Nepal, Smarta, Malawi and Zambia) demonstrated that if one child

jn a household had xerophthalmia, another child in same household was 7.3 to 13.2 times
more likely to develop xerophthalmia than if the index child did not have xerophthalmia
(cited in IVACG, 1996). Furthermore, the clustering effect might extend to other
vulnerable family members. A study conducted in Bangladesh showed that risk of
mothers of xerophthalmic children having night blindness were between 5 and 10 times
higher than mothers of children without xerophthalmia (Bloem M. et al., 1994).
2.5 Risk Factors o f Vitamin A Deficiency
Vitamin A status of an individual principally depends on three factors: the intake,
absorption and utilization of vitamin A. Interference at any of these processes can lead to
the deficiency.
2.5.1 Dietary Intake
One of the major causes of vitamin A deficiency in developing countries is inadequate
intake of foods rich in vitamin A. There is a wealth of evidence in the literature that
indicates the inverse relationship of dietary intake of food rich in vitamin A and risk of
xerophthalmia. For example, study done in the Sudan demonstrated that the risk of
xerophthalmia was inversely associated with dietary intake of vitamin A among children
(Fawzi W. et al., 1993). Xerophthalmic children in Indonesia were less likely than non-
xerophthalmic children to consume green leafy vegetables and fruits (Tarwotjo et al.,
22

1982). In Bangladesh households with a small garden had fewer children who were night
blind. Households with no garden had children 10 times more likely to have corneal
lesions than household with a garden (Cohen et al., 1985). Other related studies also
demonstrated similar beneficial relationship between dietary vitamin A intake and risk of
xerophthalmia (Wilma et al., 1991; Ramana et al., 1991).
Recent findings, however, indicated that the bioavailability of plant source of vitamin A,
especially from dark green leaf vegetable and to some extent also from fruits and tubers
is much lower than what has been assumed. Controlled studies carried out in Indonesia
demonstrated no improvement in vitamin A status of lactating women consuming
additional daily portions of dark green leafy vegetables, though a similar amount of pure
P-carotene from simpler matrix produced a significant increase in both P-carotene and
retinol (De pee et al., 1995).
Although a number of studies have been conducted on VAD in Ethiopia, only few of
these studies have documented the dietary intake of vitamin A. Gebre-Medhin (1975)
studied the dietary intake of 10 privileged and 20 non-privileged Ethiopian women
selected from two institutions in Addis Ababa. The result of this study indicated that
non-privileged women consumed a diet that was, on the average, inadequate in all
nutrients except iron and thiamin. Six of the women were found to have a level of
vitamin A intake below 80 % and seven below 40% of the recommended intake. A
survey done in southern Ethiopia where mono-crop (cereals) cultivation was practiced
23
revealed a Bitot’s spots rate of 5%. One of the major reasons suggested by the authors
for the high prevalence of the deficiency in the area was monoculture practice (De sole et
al., 1987). Another study carried out in the area where enset (Ensete vertncous) is the
staple diet demonstrated that the consumption of protein, vitamin A, iron and calcium
were between 107 and 175 % of the requirement (Pijls L. et al., 1989). This finding is
well in agreement with the result of the national clinical and biochemical survey of
xerophthalmia. No cases of Bitot’s spots and corneal lesion were found in this area
during the national VAD prevalence survey.
Vitamin A does not work in isolation. Dietary fat is also necessary for metabolism and
absorption of carotenoid and vitamin A in the intestine. Adequate protein and zinc status
assists maintenance of vitamin A status. Vitamin E by the virtue of its anti-oxidant
property may protect vitamin A and carotenoids from being oxidized (IVACG, 1979).
2.5.2 Morbidity
Diseases influence vitamin A by altering its absorption, storage, tissue utilization and
conservation or recycling. Diseases such as measles, diarrhea, respiratory tract infection
and protein energy malnutrition are the most important diseases that influence the
vitamin A status of an individual. However, studies on the association between these
diseases and vitamin A deficiency have given differing results (cited in Blome M. et al,
1998). Many factors such as under and over reporting, difference in the definition, stage
24
of infection and degree of VAD and difference in the underlying factors might be
responsible for the inconsistent outcomes.
2.5.2.1 Measles
Measles precipitates vitamin A deficiency both by reducing dietary intake and
absorption, and by increasing the demands for the repair of epithelial tissues including
the cornea and conjunctiva. Previously marginal vitamin A store in the liver of
malnourished children is rapidly exhausted during measles infection.
Evidence show that measles is an important risk factor for the development of VAD and
blindness in Africa, as well as in some of the most densely populated countries of Asia.
Study conducted in Bangladesh showed that 10 percent of the children with active
comeal lesion had a history of measles within the previous four weeks (Eastman, 1987).
In Indonesia, children who had a history of recent measles were eleven times more likely
to get comeal xerophthalmia than children who had not had measles (Sommer A., 1992).
Fifty percent of children in schools of the blind in the United Republic of Tanzania and
Malawi, gave a history of measles immediately preceding the blinding episode (UNICEF,
1987). In undernourished children measles takes its severe form but it affects the cornea
even in the well nourished child (IVACG, 1981).
25

1 5 .2 .2 D ia rrh ea26
Diarrheal disease is one of the leading causes of childhood mortality and morbidity in
developing countries and a major contributor to malnutrition. Diarrheal diseases claim
four million deaths per year, or accounting for 28% of all under five deaths. In
developing countries preschool children on the average have 2 to 5 episodes of diarrhea
per year accounting for 10 to 25 days of illness (Northrup and Rohde, 1992). An analysis
of fifteen studies on the incidence of diarrheal diseases in Ethiopia indicates that a child
has five episodes of diarrhea per year on the average, which means he is sick at least
twenty to thirty five days a year from this illness alone (Ministry of Health, 1986).
Gastroenteritis changes the type and amount of food offered to a child and his appetite.
Furthermore, it decreases absorption of whatever amount of vitamin A that is ingested by
shortening the transit time. Population based studies have not, however, demonstrated
consistent findings with regard to the association between diarrheal diseases and
xerophthalmia probably for the reasons mentioned earlier.
A number of studies that were carried out, especially in Asia showed that low level of
vitamin A is associated with diarrheal diseases. The national survey of Bangladesh
demonstrated that all children with either multiple corneal ulcers or keratomalacia had
diarrhea, in the preceding four weeks (Cohen et al., 1985). In another study carried out
m Bangladesh by Khan et al. (1984) it was revealed that 86 percent of cases of

xerophthalmia in the study gave a history of diarrhea in the month preceding the onset of
the eye lesion. In a prospective study in west Java, children with diarrhea or respiratory
infections were twice likely to develop Bitot’s spots or night blindness than children who
were free of infection (Sommer A. et al., 1987). De sole et al. (1987) also found in
Ethiopia that the prevalence of diarrhea was twice as high in children with xerophthalmia
than children without.
In contrast to the above findings, there are also studies where no association was
demonstrated between xerophthalmia and diarrhea. Milton et al. (1987) in their study in
India noted that mild xerophthalmia did not associate with the incidence of diarrhea. A
study conducted in Philippines, by Salon et al. (1978) couldn’t show any correlation
between diarrhea and xerophthalmia. In a cross-sectional study carried out in Tigrai
region, northern Ethiopia, no association was observed between incidence of diarrhea
and occurrence of signs of xerophthalmia (Yonas et al., 1997).
2 .5 .2 .3 R esp ira to ry infection
Animal studies and observational studies in human population have demonstrated that
respiratory infections worsen vitamin A status at all levels. A longitudinal study carried
out in Indonesia showed an increased risk of respiratory disease (RR=1.8) in children
with mild VAD (Sommer A. et al., 1983). The prevalence survey conducted in Cebu,
27

Philippines revealed that active xerophthalmia was positively correlated with having had
pulmonary tuberculosis or recent whooping cough (Salon S. et al., 1978).
A meta-analysis of intervention trials on vitamin A and morbidity, however, indicated
that supplementation in general does not decrease incidence, duration and/or prevalence
of acute lower respiratory infection (ALRI). Evidences from some studies suggested that
supplementation of vitamin A might reduce severity of respiratory infection (McLaren D.
and Frigg M., 1997).
2.5.2.4 In testin a l w orm s
Intestinal worms cause the lining of the intestine to change, which reduces the surface
membrane available for digestion and absorption. Studies have suggested intestinal
helminthic infections impair the absorption of vitamin A. Children and adults suffering
from ascariasis or giardiasis showed an impaired absorption of vitamin A (Machilin,
1991). Fat absorption, which is necessary for vitamin A metabolism can also be impaired
by parasitic infection of the intestine (Mahalanabis et al., 1979).
2-5-3 Protein Energy Malnutrition
Vitamin A is mobilized from the liver stores and delivered to peripheral tissue by a
highly regulated transport system. This system involves two plasma proteins: retinol
28
binding protein (RBP) and prealbumin (PA). For normal synthesis and function of these
carrier proteins, adequate intake of good quality protein is necessary (IVACG, 1981).
Both experimental and clinical studies suggest that low protein status can impair RBP
synthesis and its release from the liver (McLaren D. and Frigg M., 1997).
Incidence of xerophthalmia in PEM varies greatly in different areas, however, PEM
almost invariably accompanies xerophthalmia in the young children (IVACG, 1981).
Moreover, high death rate among PEM children parallels their vitamin A status. In India,
175 children with kwashiorkor were admitted, all having low serum vitamin A levels.
Eighteen (10.3%) of the 175 children died. Of the 18 deaths, five had keratomalacia, one
had Bitot’s spots and five other had vitamin A serum level below lOpg/lOOml (Eastman,
1987).
2.6 Assessment o f Vitamin A Status
Methods available to date for assessing vitamin A status can be grouped into clinical,
biochemical and dietary intake. The clinical signs are the most important method of
assessing vitamin A status. However, techniques that detect marginal vitamin A status
before the onset of clinical signs are of significant value. In this regard, several
techniques for assessment of vitamin A status have been developed. Of course, the most
accurate indicator is analysis of liver sample obtained as autopsy or by surgical and
needles biopsies. This method can only be applied in special, justifiable situations but is
29

30
n0t appropriate in a field situation. Other methods that have been developed to
determine the vitamin A status of an individual includes relative dose response (RDR),
Modified relative dose response (MRDR), isotope dilution and serum retinol. However,
the only indicators so far approved by the World Health Organization are clinical signs of
xerophthalmia, night blindness and plasma retinol level (IVACG, 1993). In this study
clinical signs of xerophthalmia, plasma retinol level and dietary survey were employed to
assess the vitamin A status of the study population. These methods are discussed in
detail below.
2.6.1 Clinical Indicators
Xerophthalmia is the most readily recognized clinical manifestation of VAD and the
most widely used indicator. A gradual depletion of vitamin A store results in
xerophthalmia of increasing severity, manifest as night blindness (XN), Conjunctival
xerosis (X1A), Bitot’s spot’s (X1B), corneal xerosis (X2), corneal
ulceration/Keratomalacia (X3A & X3B) and corneal scar (XS).
Criteria for diagnosis of xerophthalmia and assessing the public health significance of
vitamin A deficiency in the community has been laid by WHO (1982). The major signs
and symptoms of xerophthalmia are classified in Table 1.

Table 1 Classification of xerophthalmia31
WHO code Description
XN Night blindness
X1A Conjunctival xerosis
X1B Bitot’s spot
X2 Corneal xerosis
X3A Corneal ulceration,Keratomalacia < 1/3 corneal surface
X3B Corneal ulceration,Keratomalacia > 1/3 corneal surface
XS Corneal scar due toXerophthalmia
Source: WffQ, 1982
2.6.2 Biochemical Indicators
Measurement of circulating retinol level represents the most common biochemical
measure o f vitamin A status. Interpretation of individual values is limited by
homeostatic controls that maintain serum retinol within normal ranges, except the
extremes o f the continuum, which represent either toxicity or hepatic depletion of
vitamin A stores. Thus, serum levels of vitamin A are not considered as reliable index of
subclinical vitamin A status of an individual. However, serum vitamin A the status of
32population in terms of mean (±SD) and the proportions of individuals who are likely to
be deficient (or in state of toxicity) is very important (IVACG, 1993). Conventional
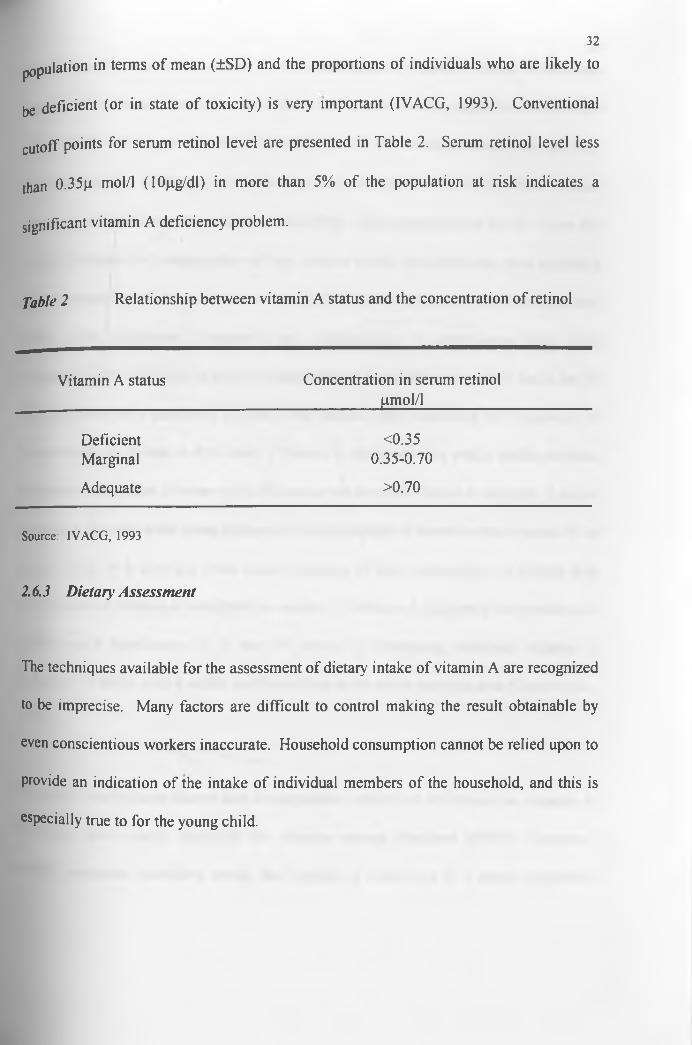
cutoff points for serum retinol level are presented in Table 2. Serum retinol level less
than 0.35p mol/l (lOpg/dl) in more than 5% of the population at risk indicates a
significant vitamin A deficiency problem.
Table 2 Relationship between vitamin A status and the concentration of retinol
Vitamin A status Concentration in serum retinol pmol/1
Deficient <0.35Marginal 0.35-0.70
Adequate >0.70
Source: IVACG, 1993
2.6.3 Dietary Assessment
The techniques available for the assessment of dietary intake of vitamin A are recognized
to be imprecise. Many factors are difficult to control making the result obtainable by
even conscientious workers inaccurate. Household consumption cannot be relied upon to
provide an indication of the intake of individual members of the household, and this is
especially true to for the young child.

gven though dietary intake survey is not an indicator of vitamin A status in the same
sense that biochemical and clinical methods do, it can be used as supportive evidence to
point out the inadequacy of vitamin A intake. One of the existing methods that can help
in assessing the inadequacy of vitamin A and P-carotinoieds is the Helen Keller
International Food Frequency Method (HKI-FFM). This method uses a cut off values for
weekly frequency of consumption of key vitamin A-rich foods that has been validated
against serum retinol as an indicator of risk of vitamin A deficiency in 15 communities
drawn from Philippines, Guatemala and Tanzania (i.e 5 communities from each
countries). The HKI-FFM is done by administering a questionnaire, which has a list of
28 food items to a randomly selected child mother, and evaluating the frequency of
consumption of vitamin A-rich foods. Vitamin A deficiency is a public health problem
in a given community if either of the following two threshold values is satisfied. Less or
equal to 4 days per week mean frequency of consumption of animal source vitamin A or
less or equal to 6 days per week mean frequency of total consumption of animal and
plant source of vitamin A (weighted by source). If vitamin A deficiency is a problem of
public health significance in at least 70 percent of community surveyed, vitamin A
deficiency is likely to be a public health problem in the entire surveyed area (Rosen et al.,
1993).
The above studies have shown that investigations carried out in Ethiopia on vitamin A
deficiency have mainly described the situation among preschool children. However,
studies conducted elsewhere reveal that vitamin A deficiency is a major nutritional
33

problem even among school age children in underprivileged population. These studies
suggest that while investigations and control measures directed towards alleviation of
vitamin A deficiency in a population should give priority to preschool children, a greater
attention should also be given to school age children.
The studies described in this paper also point to various risk factors of vitamin A
deficiency. However, the question regarding which of the risk factors significantly
contributes to the vitamin A deficiency problem in any given community needs to be
assessed in order to suggest an effective means of alleviating the problem. This study
investigated the risk factors of vitamin A deficiency in Arssi zone, central Ethiopia.
34

OW EBSind o f W W "' l i b r a e
35
CHAPTER III
METHODOLOGY
j / Background o f the Study A rea
3.1.1 Country Profile
Ethiopia is a country with an area of 1.14 million square kilometers (444,000 square
miles). The diverse topography of the country generally features rugged mountains, flat-
topped plateaus, deep river canopy, rolling plains and low lands. Ethiopia is bordered by
Kenya on the south, Eritrea on the north, Somalia and Djibouti on the east and the Sudan
on the west.
According to the 1994 census, the population of the country as of October 1994 was
39,947,533. The annual population growth rate is about 3 percent, and the economically
active segment, between ages 14 and 60 is about 50 percent of the population.
Approximately 85 percent of the population live in rural areas with agriculture being the
main activity.
Although Ethiopia lies within 15 degrees north of the equator, owing to the moderating
•nfluence of high altitude, the central highlands, where the vast majority of Ethiopian

people live, generally enjoy temperate climate, with average temperature rarely
exceeding 20°C (68°F). The average annual rainfall for the whole country is
approximately 850 mm (34 inches).
Ethiopia has three seasons: The ‘Belg’ season (short rains) from February to May, the
‘Keremet’ season from June to September (long rains), and the ‘Bega’ season (dry
period) from October to January. With the two rainy seasons, many regions are able to
produce two harvests a year. Although approximately two-thirds of Ethiopia’s landmass
is arable, only 15 percent of its area is presently under cultivation. Only about 3 percent
of the 3.5 million hectares of potentially irrigeble land are being irrigated.
The main staples, cereals, pulses, oil crops and enset (Enset Ventricosum ) pre dominate
the diet of the Ethiopian people accounting on the average for about 75 percent of total
calories during the 1980s. Among cereals, by far the most important are teff (Eragrostis
lef), sorghum, maize, followed by barely and wheat. Ethiopia has the largest livestock
population in Africa. Estimated per capita consumption of meat is 13 kg per annum, and
this is reasonably high by the standard of developing countries.
The principal health problems in Ethiopia are communicable diseases and nutritional
deficiencies. Available data indicated that 8 per cent of children under 5 years of age are
wasted, 64 per cent are stunted and 47 per cent are under weight (CSA, 1992). Next to
36

protein-energy malnutrition, deficiency of iodine and vitamin A and nutritional anemia
are the commonest nutritional problems in Ethiopia.
37
3.1.2 Study Site
This study was conducted in Dodotana Sire wereda (district) of Arssi zone, central
Ethiopia (figure 1). According to 1994 population and housing census, the population of
Arssi zone as of October 1994 was 2,217,245 of which 1,105,439 (49.9%) were males.
Administratively the zone is divided into 20 weredas. The overwhelming majority (90%)
of the population of Arssi lives in rural areas and only 10% of the population of the zone
live in urban center. The major ethnic groups of Arssi zone residents are 85 percent
Oromo, 9.1 percent Amhara and 1.3 percent Guragie. Other ethnic groups constitute the
remaining 4.6 percent. Since more than 85 percent of the rural part of Arssi zone
inhabited by the Oromo ethnic group the feeding habit of the rural Arssi is similar. Over
half (55.5%) of the Arssi population are Muslims and about 44 percent are orthodox
Christian (CSA, 1996).
Dodotana Sire wereda is organized in three towns and 43 farmers associations. The
population of the wereda as of October 1994 was 88,463, of which 45,316 (51.2%) were
males. An asphalt road that connects Assela (the capital of Arssi zone) with Addis
Ababa cuts across the Awash Melkasa and Diera Towns of the woreda. The third town of
the wereda is located 25 kilometers off the asphalt road but is connected by all -weather
road.

38
figure 1 Map of Ethiopia showing Arssi zone and study site.

The actual study sites Tedecha Guracha and Badosa Betela farmers associations are
found about 8 to 16 Km south of Diera town (the worda capital). They are located in the
“kola” (lowland zone) featuring an arid hot land type of climate.
Concerning materials of construction of housing units, all huts have wall made up of
wood and mud. Recently wood become the scarcest resource in the area to construct the
traditional type of hut. The investigator observed that farmers are trying to cope up with
the crisis by building a wall made up of mud blockets. Since it is very interesting coping
mechanism, the practice has to be encourage and farms should be assisted with
appropriate technology. The roof is thatched and there are no windows in the hut or any
ventilation system.
Major agricultural products include wheat, barley, teff, millet, chickpea, lentils, broad
beans and peas. The practice of keeping vegetables farm at individual backyards exists
to certain extent, however, it is exclusively seasonal. Agriculture in this area is entirely
rain dependent. The main rainy season is between June and September.
Animal product contributes little to most family diets, mainly for reason of lack of access
than otherwise. Cattle are raised mainly for milk and milk products for sale for income
generation rather than for meat. Eggs are found in some of the households, however,
they are rarely included in the family diet. They are used rather for sale to earn some
money in order to buy items such as salt and kerosene from the nearest market.
39
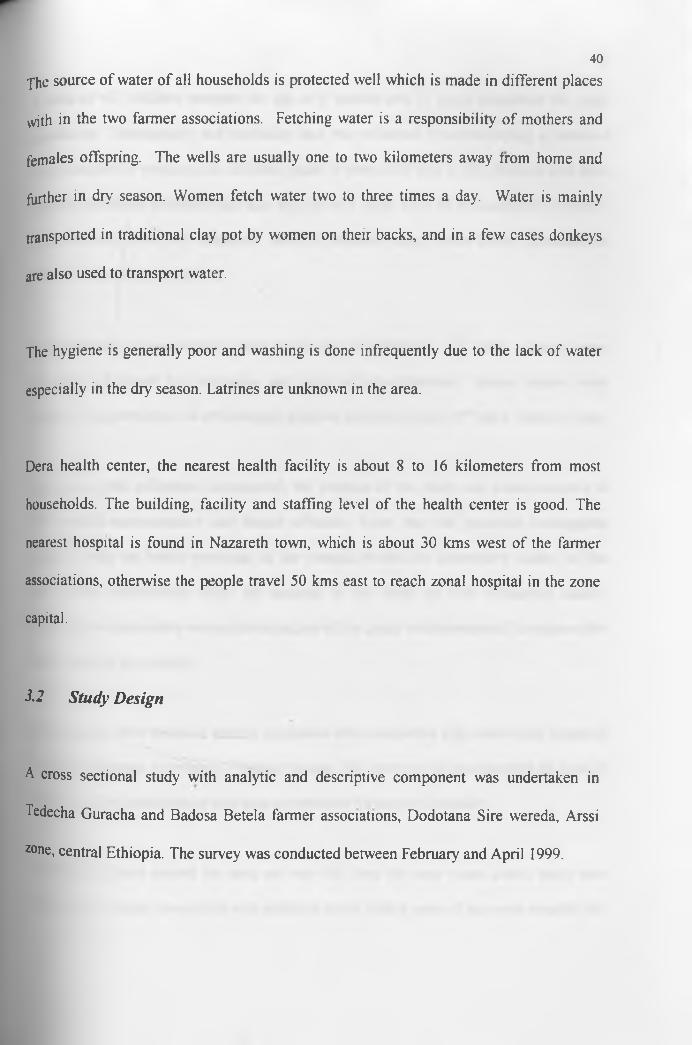
fhe source of water of all households is protected well which is made in different places
with in the two farmer associations. Fetching water is a responsibility of mothers and
females offspring. The wells are usually one to two kilometers away from home and
further in dry season. Women fetch water two to three times a day. Water is mainly
transported in traditional clay pot by women on their backs, and in a few cases donkeys
are also used to transport water.
The hygiene is generally poor and washing is done infrequently due to the lack of water
especially in the dry season. Latrines are unknown in the area.
Dera health center, the nearest health facility is about 8 to 16 kilometers from most
households. The building, facility and staffing level of the health center is good. The
nearest hospital is found in Nazareth town, which is about 30 kms west of the farmer
associations, otherwise the people travel 50 kms east to reach zonal hospital in the zone
capital.
3.2 Study Design
A cross sectional study with analytic and descriptive component was undertaken in
Tedecha Guracha and Badosa Betela farmer associations, Dodotana Sire wereda, Arssi
z°ne, central Ethiopia. The survey was conducted between February and April 1999.
40

41
A total of 402 children between the age of 6 months and 15 years comprised the study
population. Demography and morbidity data was collected by administering a pretested
questionnaire to mothers (for children under 6 years old) and to the children and their
mothers in case of children older than the age of 6 years. Data on consumption frequency
was collected from 350 randomly selected children using Helen Keller International
(HKI) food frequency method.
Anthropometry measurements were taken for all children. All study subjects were
clinically examined for symptoms and signs of xerophthalmia. Serum retinol level
analysis was performed on all clinically positive cases and every 20th child with out signs.
Before the data collection commenced, the purpose of the study was communicated to
the wereda administrative and health officials. After that the principal investigator
together with the health personnel of the wereda briefed the community leaders of the
two farmer associations about the purpose of the study on their respective places.
Through the community leaders the objective of the study was transmitted throughout the
households in the villages.
Enumerators were recruited among candidates who completed high school and fluent in
the local language, Oromegan. Further training was given to the enumerators on how to
administer the questionnaire and how to approach the target respondent.
Piloting was done around the area not very far from the area where actual study was earned out. Twenty households with children under fifteen years of age were sampled for

piloting. The result was discussed with health officials in the study area and minor
change on the questionnaire was made.
3.3 Sampling
3.3.1 Sampling Procedure
Multistage, cluster sampling technique was used in selecting the study sample. Of 20
districts of Arssi zone Dodotana Sire district was selected at random for this study. The
district has three towns and 43 farmer associations. The three towns of the district were
purposely excluded from the sampling frame in order to get homogeneous group. Of the
43 farmers associations two farmer association were selected randomly. Census was
carried out in the selected two farmer associations. Households with at least one under
fifteen years old child were identified and grouped into clusters based on their
geographical proximity. A total of 15 clusters were formed. Of these 7 clusters were
randomly selected and used to collect information on consumption frequency. Each
cluster had 50 randomly selected households. From the selected 7 clusters 4 clusters
were selected at random and a maximum of three children age between 6 months to
fifteen years per household were included in the study until the required sample size was
achieved. The multistage, cluster sampling procedure was employed in this study
because it is the most practical and popular means of sampling the population at risk of
VAD (Sommer A., 1995). The details of the sampling procedure used are presented
^grammatically in figure 2.
42

Figure 2 Flow chart showing the sampling procedure43
Arssi Zone
Random selection
Farmer Association I Tedecha Guracha
Fanner association II Badosa Beleta
Rcindom selection
r i
C - Cluster

3.3.2 Sample Size Determination44
The sample size was calculated using the formula shown below. Since the proportion of
vitamin A deficient children in the area is not known, it is estimated that the extent of the
problem in the area to be 46 percent based on the information obtained from the studies
done in the zone (Tezera and Yonas, 1993; Yonas, et al.,1996).
n =z2 (do)
Where n=
P=
q =
d=
The desired sample size
Standard normal deviation, set at 1.96 which correspond to 95%
confidence.
The given prevalence rate of vitamin A = 46%
1-p estimate of proportion of non vitamin A deficient children in
the study area for this study q=l-.46 = .54
degree of accuracy desired is set at, d= 5%
Hence, n=
n=
z (pq)
d2
n.96)2 (.46* 541
(0.05)2
3.8416* 2484
0.0025
383
5% allowance = 19
383+19= 402

Consumption Frequency o f Vitamin A Rich Foods45
For assessment of consumption of vitamin A rich foods 7 community clusters were
randomly selected. In each of these communities, 50 mothers or primary caretakers of
children from 1 through 15 years of age (12 through 179 months) were interviewed.
Before administering the HKI food frequency, food items that are rich in vitamin A
content and those that were available in the locality were identified through qualitative
market survey and group discussion. All food items in the preliminarily food list of HKI
food frequency method were included in the food frequency questionnaire even if some
these foods were not available locally. Only few food items were replaced based on the
criteria suggested by HKI food frequency method. The final food frequency
questionnaire had 28 food items (see appendix). Mother’s of the selected child was
asked “ How many days, in the past seven days, did (the name of child) eat (a specific
food item)?” The question was repeated for 28 food items exactly as written each time.
The questionnaire was exercised in a total 350 randomly selected mothers in the chosen 7
clusters. For each community the mean frequency of consumption of animal sources of
vitamin A and the mean frequency of total consumption of animal and plant source of
vitamin A (weighted) was calculated. The cut off points of HKI for inadequate
consumption of vitamin A was employed in the analysis of food frequency data.

j,5 Breastfeeding and W eaning Practice46
Information on breastfeeding and weaning practice was collected from each under three years of age child mother in the sampled households through a structured questionnaire. This task was done by the investigator. The trained enumerators recruited from the area were involved as translators.
3.6 M orbidity
The morbidity history of each child was assessed based on information from the mother.
The mother was questioned about the history of illnesses that could have affected the
vitamin A status of the child during the last one month. The diseases that the mother was
asked included measles, diarrhea, cough, and fever. Respiratory tract infection in this
study was defined by the presence of cough and fever for at least five days. Diarrhea was
defined as three or more loose or watery stools per day for at least five days. Measles in
this study was defined by the presence of fever and a blotchy rash.
7 Anthropom etric measurements
Anthropometric measurements taken included weight and height of the children. All
anthropometric measurements were taken by the investigator in order to minimize inter-
'ndividual variation in the measurement techniques. Weight for height and height for age

Z-score values were calculated for every child, using ANTHRO computer program (CDC, 1990).
3.7.1 Weight-for-Height and Height-for Age
Body weight was measured to the nearest 100 grams using UNICEF digital balance
placed on a flat surface. The children wore light clothing, no shoe, and stood upright
with the head in a horizontal plane. Children who resisted weighing were weighed in
their mother’s arms by twice weighing processes. A mother weighted and step down
from the scale after her weight was taring to zero. She steps on the scale again carrying
her child on her arm. The scale was checked at the beginning of each weighing session.
Weight was recorded to the nearest lOOgm.
Height measurement was done using a locally made graduated height/length board with
movable headpiece and flat wooden base. Height was measured to the nearest 0.5 cm
with barefoot and standing upright on a wooden board placed on a horizontal surface
with heels together. The subject heels, buttocks and upper back were in contact with a
graduated board and a sliding headpiece touched the crown of the head.
For children less than 24 months length was measured in recumbent position using length
board. Maximum attention was give to maintain the subject’s head in an upright
47

u n WER!C b b a r VOK
position, with legs stretched to full extent and feet at right angle with the legs. Length
measurements were recorded to the nearest .5 cm.
48
Child documentation such as clinic card was used to record the exact age of the subject
especially in the case small children. In the absence of this and in the case of older
children effort was made to record the age in months as exactly as possible through
exhaustive interviews of mothers with reference to a calendar of national and local
events.
Weight-for-height and height-for-age as well as their corresponding standard deviation
scores (Z-scores) were calculated with reference to National Center for Health Statistics
(NCHS) population, using Anthro computer program (CDC, 1990). A ZWH score of 2 or
-2 means that the child is 2 SD above or below the median weight-for-height
respectively. Similarly a ZHA refers to the Z-score for height-for-age. Based on these
scores, children were classified according to Waterlow (1973) as normal (ZWH > -2.00
and ZHA > -2.00), wasted (ZWH < -2.00 and ZHA > -2.00), stunted (ZWH > -2.00 and
ZHA < -2.00) or wasted and stunted (ZWH < -2.00 and ZHA < -2.00).
7.2 Body Mass Index
WHO (1983) does not recommend to use of NCHS reference data for comparing the
nutritional status of children greater than ten years of age because of the marked

49
difference in the age of onset of puberty among populations. For this reason the above
indices were calculated only for children up to the age of ten years old. For those
children between the age of 11 and 15 years body mass index (BMI) was calculated as
the ratio of body weight (kg) and height in meters (Kg/m2). The cut off values used in
this study to classifying children as malnourished were <15.0 BMI for children between
the age of 11 and 13 years, and <16.5 for children between the age of 14 and 15 years
(Lee R. and Nieman D., 1996).
3.8 Ophthalmological examinations
House to house ophthalmological examination for signs and symptoms of xerohthlmia
was conducted on all the sampled (402) children The assessment was earned out using
different stages of xerophthalmia. For night blindness, mothers (for children under 6
years of age) were carefully asked about whether the child has maladaptation to dim light
or not. For child above the age of 6 years, each child himself or herself and his/her
mother were asked whether he/she has a problem of maladaptation to dim light. The
local term for night blindness was employed in interviewing all questions on night
blindness. Conjunctival xerosis was identified by the dryness of the conjunctiva, Bitot's
spot by an extension of foamy or cheesy patches forming on the conjunctiva, corneal
xerosis by a hazy or granular surface and pebbly dryness apparent on the cornea, corneal
ulceration when the ulceration is observed in the corneal surface and corneal scar by

observing a scaring on the cornea that associated with the previous xerophthalmia
condition (Sommer A., 1995).
A ll clinical examination was done by the investigator (though not an ophthalmologist, he
has been trained in the use of standard diagnostic criteria of xerophthalmia and has got
extensive field experience in diagnosis of xerophthalmia through working with
ophthalmologist and conducting field survey for a number of years) and a medical doctor
who is experienced in diagnosis of xerophthalmia.
The prevalence criteria listed on Table 3 which is endorsed by the world health
organization was used (WHO, 1982). The prevalence of xerophthalmia in the study
population was determined by the proportion of individuals in the sample with clinical
signs and symptoms of vitamin A deficiency at the time of examination. After the
completion of the study therapeutic dose of vitamin A capsules were given to all
clinically positive children.
50

Table 3 Indicators, WHO classification codes, and minimum prevalence criteria
for assessing the public health significance of xerophthalmia and vitamin
A deficiency in preschool aged children.
51
Indicator/WHO code Description Minimum WHO prevalence
Criteria %XN Night blindness 1.0X1B Bitot’s spot 0.5X2 Corneal xerosis 0.01
X3A Corneal ulceration, Keratomalacia < 1/3 corneal surface
0.01
X3B Corneal ulceration, Keratomalacia >1/3 corneal surface
0.01
XS Corneal scar due to xerophthalmia 0.05
Source WHO, 1982
3.9 Stool Examination
3.9.1 Stool Specimen Collection and Preparation
All stool specimens were collected between 7.15 am and 10.00 am. Enumerators went to
each child house early in the morning and briefed mother in the case of children under
the age 6 years and each child (in case of older children) on how to collect stool samples.
Each child was provided with a label half meter square sheet of paper, a wooden
aPplicator stick, a labeled plastic screw-top stool container and toilet tissue papers then
released for the exercise of stool collection. Each child would defecate on the half meter

square sheet of paper then transfer a small portion of stool into the plastic stool container
using the applicator stick. The used applicator stick and the remaining stool portion were
wrapped in the square sheet of paper and discarded. The stool container with its contents
would then submitted and immediately transported by car to the laboratory. The samples
were prepared within three hours of collection for Kato technique examination.
3.9.2 Stool examination using “The KatoThick smear technique”
Stool examination for intestinal helminthiasis was carried out using kato’s smear
technique (Cheesbrough M., 1981). This technique involves examination of 50
micrograms of fresh stool specimen by clearing the direct fecal and smearing pressed out
thinly under glycerine impregnated cellophane.
A sample of fresh stool was pressed through a fine wire gauze sieve (#25) to remove
fibrous tissues. A template hole of 50-microgram capacity was placed on a microscope
slide A portion of sieved stool was transferred to a microscope slide using a wooden
applicator stick to carefully fill the template hole resting on the slide. The template was
removed and a strip of cellophane impregnated with glycerine and a tincture of malachite
green was pressed over the faces on the slide until it was evenly spread. The prepared
slide was left to stand until the fecal background cleared. The preparation was examined
after 30 minute. Helminthes eggs were identified, counted using a digital telecounter and
then recorded.
52
Although the Kato technique is slightly less sensitive compared to the concentration
method of stool examination, it is quantitative, simple and rapid. This technique was
chosen in this study mainly for its quantitative nature, which is vital in this study.
At the end of the study all children who had parasitic infestation received appropriate
treatment.
3.10 Serum Retinol Measurement
The serum retinol determination was performed on all children with clinical signs of
VAD and in every 20lh children. The serum retinol was determined by high pressure
liquid chromatography (HPLC).
3.10.1 Determination o f Serum Retinol by HPLC
Principle
53
A given volume (loo^il) of serum or plasma is diluted with ethanol or methanol, which
denature plasma protein, and the vitamin is extracted with a suitable organic solvent.
After centrifugation, an aliquot of the organic phase is injected onto a normal or reversed
P»*se HPLC column, followed by an eluting solvent of suitable polarity. Retinol, which
1S e*uted as a sharp peak within 1-6 minutes, is detected by a sensitive UV detector set at

325-328 nm. Retinol is quantitated by use of peak height ratios or peak area ratios
relative to an internal standard (retinyl acetate or other appropriate analogs). This
method is specific, owning to chromatographic step, and sensitive and fast owning to the
own line ultraviolet detection at 328 nm.
A pparatus
Analytical microbalance, ultraviolet visible spectrophotometer, centrifuge, vortex mixer,
rotary evaporator, high-performance liquid chromatography system equipped with a
variable wavelength detector or suitable filters, nitrogen gas, water bath (40 - 50°C
constant temperature), micropipettes 10pl, 15pl, 50pl, lOOpl, conical centrifuge tubes
with polyethylene screw caps, pasture pipettes, hamilton 710 syringe.
Reagents
• Retinyl acetate, all-trans (highest purity)
• Retinol, all-trans (highest purity)
• Hexane (HPLC grade)
' Absolute methanol (analytical grade)
• Absolute ethanol (analytical grade)
54

55
Samples collection
Venous blood (5-10ml) was collected by venous puncture without anticoagulant using
vacutainer system (venoject; Terumo, Belgium). The blood sample collected in a
venoject wrapped in aluminum foil (to protect vitamin A from light) and stored in cool
box and transported to the field laboratory established at Dera Health Center and
centrifuged with in 3 hours. The serum samples were collected into cryo vials covered
with aluminum foil and frozen using the refrigerator at the Health Center and transported
to the Ethiopian Health and Nutrition Research Institute (EHNRI) in cool box containing
dry ice. The serum samples were stored in the dark at -20°c until analysis.
Procedure
100 pi serum was transferred to lOx 75 mm glass test tubes. A known concentration of
internal standard (retinyl acetate) and 90pl of absolute ethanol were added to each
sample and mixed gently on vortex mixer. After that, about 500pl hexane (HPLC grade)
was added and mixed with vortex mixer for one minute. It was then centrifuged for 5 min
at 3000 rpm to separate the phases. The hexane layer was taken out very carefully and
transferred into another tubes and evaporated under a gentle stream of nitrogen gas. It
was then reconstituted in 55pl of MeOH (HPLC grade) and 50 pi was injected on HPLC.
The mobile phase was MeHO: H2o (95:5), flow rate 1.5 ml/minute and the column was
reverse phase C l8. After each injection of samples or standards the loop was cleaned
three or more times with MeOH. A series of retinol standards (prepared by serial
dilution) and a known concentration of internal standard (which was constant) were

56
prepared and 50 pi of each were injected three times. Retinol, which was eluted as a
sharp peak with in one to six minutes, was detected by a sensitive UV detector set at 325-
328nm. Retinol was quantified by use of a peak area ration relative to an internal
standard (Bieri G. et al, 1979).
3.11 E thical Consideration
The study protocol was approved by Ethiopian Health and Nutrition Research Institute
Ethical committee and by the National Ethical and Research committee of Ethiopia.
Written informed consent was also obtained from each child's parent.
3.12 Data Quality Control
As indicated in the methodology section all the necessary quality control measures were
taken for blood sample, anthropometry measurements and stool specimens. The data on
the questionnaire was checked every day after work for completeness of information,
consistency of answers and for proper filling of the forms by the enumerators. The
enumerators were closely supervised through out the data collection.
2.13 Data Analysis
The Spss for Windows version 7.5 was used for all data entery and analysis except the
anthropometric data. Before the analysis, the data was thoroughly cleaned with the help

57
of the same soft wear program. The Z-score value of the anthropometic data was
calculated using Anthro soft wear program (CDC, 1990).
The statistical methods used in the analysis includes:
♦ Descriptive statistics
♦ Chi-square with cross tabulation was employed to assess level of significance
between proportion.
♦ Unpaired t-test was used to compare mean serum retinol values between boys and
girls, and preschool and school age children.

CHAPTER IV58
RESULTS
4.1 Demographic Characteristics
A total of 402 children were investigated in the study. Age and sex distribution of the
study population is presented in figure 3. The ratio of male to female was about 1:1. The
mean age of male and female children were 6.3 ± 4 and 6.8 ± 4 years respectively
Further break down of the data showed that the mean age of the under six male children
were 2.9 ± 1.5 years while 3± 1.5 years for females. The mean age of school children
were 9.7 ± 2.5 years. The average household size for the study village was 5.7 persons
which is higher than the average Oromia region household size of 4.9 persons (CSA,
1995). The proportion of mothers who can not read and write was 59.8 percent.
Fig 3 Study subjects by age and sex
Age in months
4.2 Prevalence o f Vitamin A Deficiency59
4.2.1 Clinical Examination
A total of 188 (46.8%) preschool children and 214 (53.2%) school age children were
examined for ocular manifestations of vitamin A deficiency. Of the children examined
for clinical signs and symptoms of xerophthalmia 51.2 percent were boys and 48.8
percent were female. The over all prevalence of xerophthalmia was 10.7 percent. The
occurrence of acute and long-standing xerophthalmia in relation to age and sex is
presented in Table 4, which presents the most severe signs.
Night blindness (XN) was reported in 7.3 % of the boys and 7.14 % of the girls without
other signs of xerophthalmia and in 1.9 % of boys and 1.5 % of the girls with more
severe signs of xerophthalmia. The prevalence of Bitot’s spot (X1B) was 2.4 % in males
and 2.04 % in girls. The Bitot’s spot was bilateral in eight children and unilateral in one
child. Although not specific for xerophthalmia, conjunctival xerosis (XI A) was observed
in 3.2 % of the children. (X1A, data not shown in the Table and not included in the
analysis because this sign are non specific, poorly reproducible and highly variable.
Moreover WHO (1982) suggests not to use conjunctival xerosis in prevalence field
survey in order to avoid over diagnosis).

Table 4
, T / .. <G31u1- ' ^ u b k w y
Distribution of clinical symptoms and signs of xerophthalmia by age and
sex
Symptom Sex ______________________ Age (months)s/Signs <24 24-47 48-71 72-95 96-119 120-143 144-180 Total
Night M 0 2 2 2 1 5 15blindness F 0 1 1 1 4 4 3 14
M+F 0 3 3 4 6 5 8 29
Bitot’s M 0/0“ 0/0 0/1 0/1 0/1 0/0 1/1 1/4Spot F 0/0 0/0 0/0 0/1 0/1 0/0 0/2 0/4
M-F 0/0 0/0 0/1 0/2 0/2 0/0 1/3 1/8
Corneal M 0/0 0/0 0/0 0/0 0/0 0/1 0/0 0/1xerosis F 0/0 0/0 0/0 0/0 0/0 0/0 0/0 0/0
M^F 0/0 0/0 0/0 0/0 0/0 0/1 0/0 0/1
Comeal M 0/0 0/0 0/0 1/0 0/0 0/0 0/0 1/0ulceration F 0/0 0/0 0/0 0/0 0/0 0/0 0/1 0/1
M-F 0/0 0/0 0/0 1/0 0/0 0/0 0/1 1/1
Comeal M 0/0 0/0 0/0 0/0 0/0 0/1 0/0 0/1Scar F 0/0 0/0 0/0 0/1 0/0 0/0 0/0 0/1
M+F 0/0 0/0 0/0 0/1 0/0 0/1 0/0 0/2
Total eye M 0 2 3 5 3 3 7 23symptom F 0 1 1 3 5 4 6 20s & signs M+F 0 3 4 8 8 7 13 43
Total M 32 38 32 28 26 25 25 206examined F 22 30 34 24 39 17 30 196
M+F 54 68 66 52 65 42 55 402
Monocular/binocular respectively

When the two severe signs of active xerophthalmia (corneal xerosis and corneal
ulceration) were present together, 0.9 % of the boys and 0.5 % of girls exhibited these
signs. The corneal ulceration was unilateral in the boy and bilateral in the girl while the
ulceration in both cases covering less than one third of the corneal surface (X3A).
Corneal scar (XS) was seen in 0.48 % in boys and 0.51 % in girls. Both of the children
with the scar was reported not to have a history of trauma or any other events which
could have contributed to the scaring of the cornea. The corneal scaring was observed in
one eye in the girl while it occurred in both eyes in the boy and involved more than one-
third of the corneal, which meant the boy, was blind. A higher prevalence rate of
xerophthalmia was observed in boys (11.1 %) than girls (10.2 %), however, this
difference was not significant. Of the children who had the ocular symptoms and/or
signs, only 16 % were below the age of six while the remaining were above six. This
difference is statistically significant (p< 0.0001). In addition all the severe form of
xerophthalmia were observed in school age children. No xerophthalmic child was
observed below the age of two. Children between the age of 11 and 15 years were the
most affected.
4.2.1 Biochem ical Assessment
Effort was made to perform blood analysis on 63 children which includes all children
with clinical signs of vitamin A deficiency (43) and one in every 20th of the remaining
children (20). However, the analysis was not possible on 14 subjects due to refusal to
61

give blood, haemolysis or recovery of inadequate quantities of serum. Vitamin A status
of the study children based on serum retinol concentration is shown on Table 5. Serum
retinol level was deficient (<10pg/dl) in 8.2 %, low (10pg/dl-20pg/dl) in 42% and
normal (>20fj.g/dl) in 49%.
Table 5 Distribution of serum retinol level of the children by sex
62
Serum retinol SexM F M+F
< 10pg 2 (7.4%) 2(9.1%) 4 (8.2%)
10pg-20pg 11 (40.7%) 10(45.4%) 21 (42.8%)
>20pg 14(51.8%) 10(45.4%) 24 (49.0%)
Total 27 22 49
Recent WHO report recommended that a cut-off level of <20pg/dl be used and that the
prevalence value below the cut-off be ranked to indicate the degree of public health
significance (WHO, 1995). According to this cut-off value 51% of the children had low
serum retinol level.
The mean serum retinol level of the children was 22.15 (SD 10.7). There was no
statistically significant difference between the sexes in the mean serum retinol levels

(p>0.05). However, the mean serum retinol level of preschool children was found to be
significantly higher than school age children (p<0.05) (Table 6).
63
Table 6 Mean serum retinol level of the children by sex and age group
Serum retinol level
Sex Mean SD t df PM 22.11 (11.19) -0.31 47 0.97
F 22.20 (10.50)
Aee e r o u DPreschool 29.34 (11.53) 2.51 47 0.016
School age 20.31 (9.80)
SD= Standard deviation t= t-valuedf = degrees of freedom p = 2-tailed probability

4.3 Risk Factors o f Vitamin A Deficiency64
4.3.1 Consumption o f Vitamin A Rich Foods
4.3.1.1 Food Frequency
As indicated in Table 7, the consumption of vitamin A rich food in all community
clusters was considerably lower than the HKI Food Frequency Method threshold values.
According to HKI Food Frequency Method a community has a public health significance
problem of VAD, if either the mean frequency of consumption of animal source of
vitamin A is < 4 days per week or the mean frequency of total consumption of animal
and plant source of vitamin A (weighted by source) is < 6 days per week.
Table 7 Mean frequency of consumption of vitamin A (n=350)
Community ClusterMean Frequency of Consumption (days per week)
Animal Source____________ Weighted Total
A 2.6400 2.9135B 1.6400 1.8833C 2.3600 2.6367D 1.8600 2.2300E 0.6000 0.9699F 0.9400 1.3301G 0.6600 1.0867

65
Dark green leafy vegetables (DGLVs) as a food group was consumed by 48.3 % of the
children at least once in the past seven days. The mean frequency of consumption of
DGLVs was as low as 0.8 days per week. The mean frequency of consumption and
proportion of children eating vitamin A rich foods at least once per week for selected
vitamin A-rich foods is presented in Table 8.
Table 8 Mean frequency of consumption and proportion of children consuming vitamin A rich foods.
Food ItemMean Frequency of
Consumption (day per week)Proportion (%) of Children Eating at least once in week
Egg 0.44 22.0Carrot 0.16 7.7Amaranth leaves 0.12 6.0Liver 0.03 2.6Mango 0.03 2.8Pumpkin 0.37 21.1Small fish with liver 0.02 0.9Butter 1.03 37.4Sweet potato 0.03 2.9Cod liver oil 0.00 0.0Red palm oil 0.00 0.0
As depicted on the Table, some particular food items were consumed more frequently
compared to others, while others were not consumed at all by the children. The most
frequently consumed vitamin A-rich foods were butter, egg and pumpkin which were
consumed at least once in the past seven days by 37.4 %, 22 % and 21.1% of the
surveyed children, respectively. The average frequency of consumption recorded even in
these food items, however, was found to be low. None of these food items, on average,

66were consumed even once in previous week except butter, which was eaten about one
day per week. The mean frequency consumption of fish and liver were also extremely
low, at 0.02 days and 0.03 days per week respectively. No child ate cod liver oil and red
palm oil. Frequency of consumption of vitamin A-rich foods demonstrated statistically
significant association with clinical signs of xerophthalmia (p<0.01).
The major sources of fat and oil in the study population were vegetable oil and butter.
Foods containing fat or oil was consumed by about 98 percent of children at least once in
the last seven days. Mean frequency of consumption of foods containing oil and fat were
5.7 days and 1 day respectively. Foods cooked in oil were consumed at least one day in
the past week by 9.6 percent of the surveyed children. The average frequency of
consumption of fried foods was found to be 0.2 day per week.
Lentils, pea, and bean were the principal source of protein. It was observed that these
plant source of protein-rich foods were consumed by 97.7 percent of the children at least
once in the past seven days. The mean weekly intake of plant source protein-rich foods
was high, 5.9 day per week. The mean frequency of consumption of animal source
protein-rich foods such as meat, milk and eggs was, however, found to be low, at 0.2 day,
1.8 days and 0.4 day per week respectively.

67
4 .3 .1 .2 B reastfeed in g a n d W eaning P ra c tice
Data on breastfeeding and weaning practice were collected from all under 3 years of age
children. Of the mother’s of these children 68.5 percent were breastfeeding their
children. Further break down of the data by age group showed that all children below the
age of one year and 91.7 percent of children between the age of 12 and 24 months were
found to be breastfed at the time of this study. Even amongst the older children 28.6
percent of them were being breastfed. Of the mothers who were breastfeeding their
children, 98.4 percent started giving their breast to the baby immediately after birth while
the remaining 1.6 percent started one to three days later. No clinical symptoms and signs
of xerophthalmia were recorded among breastfed children.
Mothers (28) who had stopped breastfeeding their babies before the study team arrived in
the study area gave various reason for stopping. Eight mothers (28.6 %) said due to
another pregnancy, five (17.9%) due to birth of next child and five (17.9 %) due to their
illness. Insufficient breast milk and the child was too old was also given as a reason for
stopping breastfeeding by 14.2 % and 7.1% of the mothers respectively. The remaining
four mothers had different reasons for stopping breastfeeding including divorce.
Of all the mothers interviewed, 20.2 percent believed that children should be exclusively
breastfed until 4 months, 66.3 % for up to between 4 to 6 months while the remaining
13.5 said it could be done over 6 months. Regarding the period over which breastfeeding
could be continued along with weaning foods, 68.5 % suggested 1 to 2 years while 30.3

68
% reported that the practice should continue above the age of two. Only one mother
(1.1%) said it should be limited to below one year.
The average age at which foods other than breast milk were introduced was 6.1 months.
The main weaning foods were cows milk and porridge made from wheat or barley floor.
4.3.2 Anthropometry
4.3.2.1 W eigh t-for-H eigh t a n d H eigh t-for-A ge
About 48 % of children between the age of 6 months and 10 years were observed to be
malnourished with more stunting alone (35.7%) than stunting and wasting together
(5.6%) and wasting alone (6.8%) (Table 9).
The preschool children (under 6 children) were most affected than the school age
children (6 to 10 years old children). Only less than one-third of malnourished children
were found to be school aged children. Moreover the highest wasting rate was recorded
in children aged between one and three years old while the highest rate of stunting was
observed in four to five years old children. The proportion of wasted alone, stunted alone
and wasted and stunted together in school age children was 5.1%, 33.3% and 1.7%
respectively. In preschool children the degree of stunting alone (37.2 %) was found to be
higher than wasting and stunting (8.0%) and wasting alone (8.0%) (Table 9).

69
Table 9 Nutritional status of children aged 6 months to 10 years by sex and age group.
Age group Sex Normal Wasted Stunted Wasted & Stunted
Total
Preschool
M 42(41.2)*
10(9.8)
41(40.2)
9(8.8) 102
(Under 6) F 46(53.5)
5(5.8)
29(33.7)
6(7.0) 86
M+F 88(46.8)
15(8-0)
70(37.2)
15(8^0)____
188
School age (6-10 years)
M 32(59.2)
4(7.4)
17(31.5)
1(1.9)
54
F 38(60.3)
2(3.2)
22(34.9)
1(1.6)
63
M+F 70 6 39 2 117(59.8) (5.1) (33.3) (1-7)
M 74 14 58 10 156
All(47.4) (9.0) (37.1) (6.4)
84 7 51 7 149F (56.4) (4.7) (34.2) (4.7)
158 21 109 17 305M+F (51.8) (6.8) (35.7) (5.6)
Figures in parenthesis are percentage
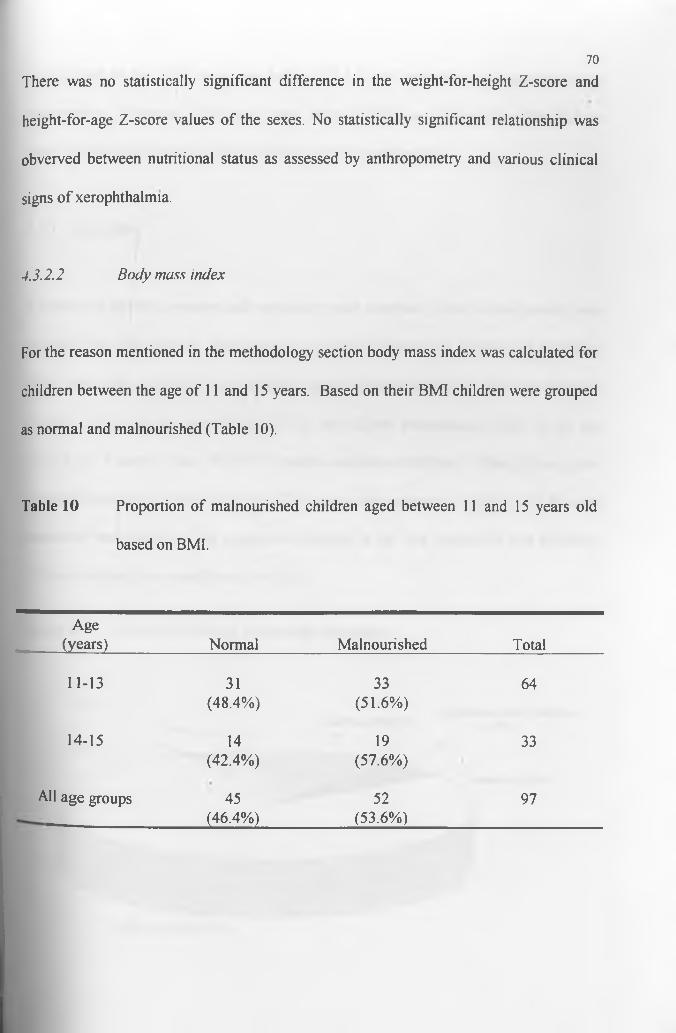
70
There was no statistically significant difference in the weight-for-height Z-score and
height-for-age Z-score values of the sexes. No statistically significant relationship was
obverved between nutritional status as assessed by anthropometry and various clinical
signs of xerophthalmia.
4.3 .2 .2 B o d y m ass index
For the reason mentioned in the methodology section body mass index was calculated for
children between the age of 11 and 15 years. Based on their BMI children were grouped
as normal and malnourished (Table 10).
Table 10 Proportion of malnourished children aged between 11 and 15 years old
based on BMI.
Age(years) Normal Malnourished Total
11-13 31 33 64(48.4%) (51.6%)
14-15 14 19 33(42.4%) (57.6%)
All age groups 45 52 97(46.4%) (53.6%)
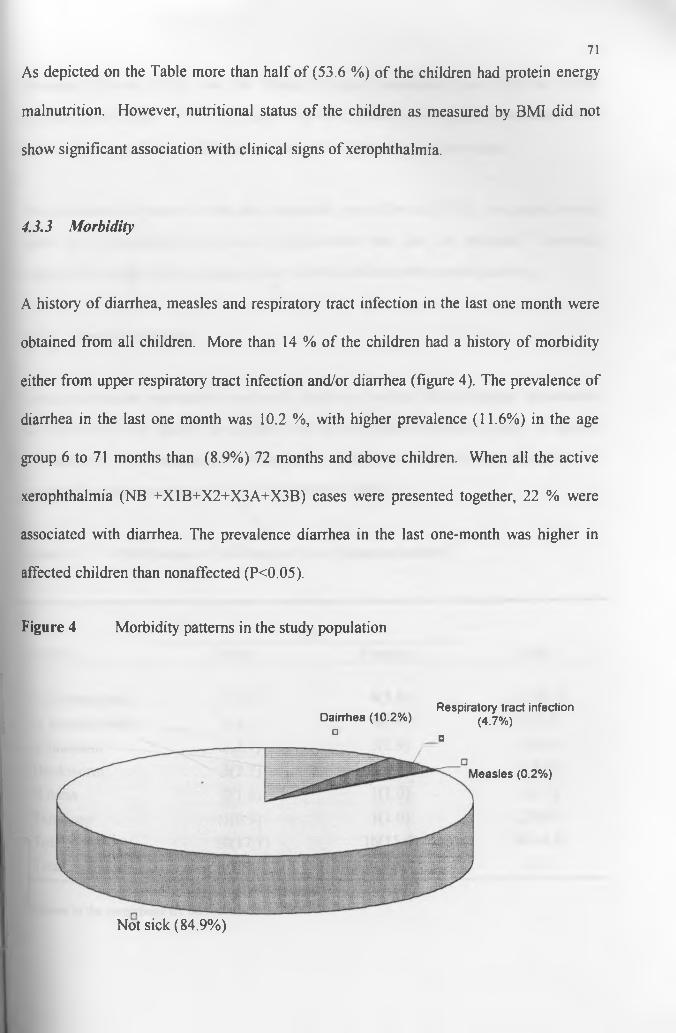
71As depicted on the Table more than half of (53.6 %) of the children had protein energy
malnutrition. However, nutritional status of the children as measured by BMI did not
show significant association with clinical signs of xerophthalmia.
4.3.3 Morbidity
A history of diarrhea, measles and respiratory tract infection in the last one month were
obtained from all children. More than 14 % of the children had a history of morbidity
either from upper respiratory tract infection and/or diarrhea (figure 4). The prevalence of
diarrhea in the last one month was 10.2 %, with higher prevalence (11.6%) in the age
group 6 to 71 months than (8.9%) 72 months and above children. When all the active
xerophthalmia (NB +X1B+X2+X3A+X3B) cases were presented together, 22 % were
associated with diarrhea. The prevalence diarrhea in the last one-month was higher in
affected children than nonaffected (P<0.05).
Figure 4 Morbidity patterns in the study population
Dairrtiea (10.2%) Respiratory tract infection(4.7%)
□□
Not sick (84.9%)
Measles (0.2%)

72
Nineteen children (4.7%) had the history of upper respiratory tract infection in the
preceding one month. However, upper respiratory tract infection in the last one month
did not show significance difference in xerophthalimic cases and non-cases.
The prevalence of measles in the last one month was as low as 0.25%. An active corneal
lesion as a consequence of measles complication was also not reported. However,
measles was responsible for corneal scars of both children with corneal scaring.
4.3.4 Stool Examination
Stool examination was carried out for all children of whom food frequency information
was collected in the sample households and for all clinically positive cases. A total of
217 children were examined for intestinal helminthiasis. The overall prevalence of
intestinal parasites was found to be 16.6 percent (Table 11).
Table 11 Distribution of children by type of parasite isolated
SexTotalParasites Male Female
E. vermicularis 5(4.4)* 6(5.8) 11(5.1)A. Lumbricoides 6(5.3) 4(3.8) 10(4.6)S. mansoni 3(2.7) 3(2.9) 6(2.8)Hookworm . 3(2.7) 1(1.0) 4(1.8)H.nana 2(1.8) 1(1.0) 3(1.4)Tania ssp 1(0.9) 1(1.0) 2(0.9)Total positives 20(17.7) 16(15.4) 36(16.6)Total examined 113 104 217
Figures in the parenthesis are percentage

As depicted on the table the prevalence rate by type of infection was 5.1% for E n terobiu s
verm icu la n s, 4.6% for A sca ris lum bricoides, 2.8 % for Schistosoma mansoni, 1.8% for
hookworm, 1.4% for H ym en opsis nana and 0.9 % for Taenia species.
73
The wormload of the four most commonly encountered parasites is presented in Table
12. The detail criteria used in the classification of the intensity of infection are presented
in the appendix. No child had heavy infection and more than 93% of the infected
children had light infection.
Table 12 Worm load of the infected children
Parasite Intensity of infection TotalLight Moderate Heavy
E. vermicularis 9(81.8)* 2(18.8) 0(0) 11A. Lumbricoides 10(100) 0(0) 0(0) 10S. mansoni 6(100) 0(0) 0(0) 6Hookworm 4(100) 0(0) 0(0) 4
Figures in the parenthesis are percentage
No significant difference was demonstrated in the prevalence of the parasites between
the sexes. Helmintic infection together or individually did not show statistically
significant relationship with vitamin A deficiency as assessed by clinical signs.
CHAPTER V
DISCUSSION
5.1 Prevalence o f Vitamin A Deficiency
This study looked at the prevalence of vitamin A deficiency among preschool and school
age children in the study area using clinical and biochemical indicators. The threshold
criteria developed by WHO (1982) and IVACG (1993) for determining vitamin A
deficiency as a problem of public health significance are a prevalence of night blindness
(XN), Bitot’s spots (X1B), active corneal lesion (X2/X3A/X3B), and corneal scar (XS)
exceeding 1%, 0.5%, 0.01% and 0.05%, respectively. The findings of the present study
compared to the criteria is 7.2-fold for night blindness, 4-fold for Bitot’s spots, 25- fold
for corneal xerosis, 50-fold for corneal ulceration and 10-fold for corneal scar. These
proportions signify the problem as being of public health significance in the area.
Studies conducted among preschool children in Arssi zone in general and Dodotana Sire
district in particular (the district where this study was carried out) reported considerably
high prevalence rate of xerophthalmia. In a community survey in Arssi zone, Bitot’s
spots were seen in 5% of children aged between 6 months and 6 years, corneal xerosis
and ulceration with keratomalacia in 0.8% and corneal scar in 0.5% (De sole et al.,
1987). Tezera and Yonas (1993) found out an overall xerophthalmia prevalence of 9.2 %
among under six years of age children in Dodota district. In the same period an
74

alarmingly high prevalence rate of xerophthalmia was recorded among the same age
group in one of the village of the same district. The prevalence of night blindness,
Bitot’s spots, corneal ulceration and corneal scar were 17%, 26.5%, 2.7% and 0.7%
respectively (Yonas et al., 1996). Unlike the previous studies considerably lower
prevalence rates of xerophthalmia were found in the present study among children aged
between 6 months and 6 years. Night blindness was reported by only six children (3.2%)
and Bitot’s spot was observed only in one child (0.5%). No child was found with active
comeal lesion (X2/X3A/X3B), and comeal scar (XS). Thus the present study shows that
VAD problem has substantially decreased in the area.
In the literature it is stated that mega dose vitamin A capsule (200,000 IU) has at least
90% prophylactic efficacy for 4-6 months among recipient children against developing
mild xerophthalmia and comeal disease (West K. and Sommer A., 1993). Impact
evaluation study on universal vitamin A capsule distribution carried out in India
demonstrated more than four fold reduction in the prevalence of Bitot's spot in two
distribution cycle (West K. and Sommer A., 1993). A study conducted in Ethiopia noted
a reduction of prevalence of xerophthalmia from 11% to 2% in one round mega dose of
vitamin A capsule distribution (Yonas and Tezera, 1994). Hence, the observed
encouraging result in decreasing VAD in the area could be attributed primarily to
universal vitamin A capsule distribution that has been carried out in the area in
conjunction with polio eradication campaign.
75

76
Although studies conducted on VAD in Ethiopia and elsewhere concentrated on
preschool children there is evidence that revealed vitamin A deficiency is also a public
health significance problem among school aged children. Pant and Gopalas (1986) found
out a prevalence rate of xerophthalmia between 9% and 12% among underprivileged
schoolboys in India. Similarly, in the present study, a public health significant level of
VAD was observed among school aged children in the study area. Of the total number of
school age children (214) examined, 36 (16.8%) had at least one ocular manifestation of
xerophthalmia. Thus, night blindness was reported in 10.7%, Bitot’s spots was observed
in 3.7%, corneal xerosis in 0.5%, corneal lesion in 0.9% and corneal scar in 0.9% of the
children. These findings confirm a speculation made by a previous study, which
suggested that VAD could also be a problem of public health significant in school age
children in Dodota district (Yonas et al., 1996). The high prevalence rate of
xerophthalmia reported in the present study might be due to a chronic shortage of vitamin
A rich foods in the area and to the fact that school age children do not receive vitamin A
supplementation.
In the literature, it has been indicated that the availability of dark green leafy vegetables
and fruits is low during dry seasons (Fawzi W. et al., 1997; IVACG, 1981). Since the
study was conducted in the dry season, may be poor dietary intake might partly account
for the recorded high prevalence.
Of the children who manifested clinical symptoms and/or signs, only 16% were below
fte age of six years while the remaining were above six. The difference is statistically

77
significance (P< 0.0001). This indicates that vitamin A deficiency is a more serious
problem among school age children than preschool children in the area. This can be a
result of the on-going vitamin A capsule distribution targeting preschool children.
The prevalence of night blindness and Bitot’s spots is almost equal in the two sexes,
which is in accordance with the observations reported earlier in Ethiopia and elsewhere
(Yonas et al., 1996 and Wolde-Gebrile et al., 1993; Sinha and Bang, 1973). No major
difference in the relative effectiveness of vitamin A between the sexes was also
demonstrated in supplementary trials (Beaton G. et al., 1993). These observation are in
direct contrast to reports which suggest greater vulnerability of boys to mild
xerophthalmia than girls (De sole et al., 1987; Wolde-Gebriel et al., 1991; Yonas et al.,
1997; Bushra et al., 1987; cited in IVACG, 1981). However, there is no readily available
explanation for the contrast, since the issue of male preponderance to mild xerophthalmia
is not yet well understood and study findings on this line are inconsistent. In the
literature, it has been indicated that in most societies children of both sexes are equally
affected by active xerophthalmia (X2/X3A/X3B) (Sommer A., 1995). Although a similar
finding was recorded in the current study, the numbers of children in the present study
with these severe signs of vitamin A deficiency was too small for a definite conclusion to
be made.
The extent of vitamin A deficiency in the study area is confirmed by the finding that 8.2
percent of the children had serum retinol levels less than lO^g/dl which is higher than the
threshold value (5% with less than lOpg/dl) set by WHO (1982) in determining the
78
public health significance of vitamin A deficiency. Recently WHO (1995) recommended
that when the proportion of the population with low serum retinol levels (< 20jag/dl) is >
20 %, vitamin A deficiency can be regarded as a severe public health problem.
According to this criteria the study population is severely vitamin A deficient, since 51%
of the children had serum vitamin A concentration below 20^g/dl.
No statistically significant difference was observed in the mean serum retinol level of the
sexes, which is well in agreement with the clinical findings. Comparison of mean serum
retinol level by age groups, however, revealed that preschool children had a significantly
higher mean serum retinol level than that of school aged children (p< 0.05). This is not
surprising, since preschool children have been periodically supplemented with a mega
dose of vitamin A capsules and they had received the capsule four months before the
survey.
In summary, both clinical and biochemical findings revealed that vitamin A deficiency
is a public health problem in the area. Furthermore, the results indicate that school aged
children are more affected than preschool children. As mentioned earlier the observed
difference in the vitamin A status of the two age groups was mainly attributable to the
vitamin A capsules supplementation to preschool children. It is quite true that preschool
children are the most at risk group to VAD and deserve priority in vitamin A intervention
program but it does not follow that school age children are immune to VAD as shown in
the present study. The findings of this study, therefore, suggest that the on-going vitamin
A intervention program in the study area should also give due attention to school aged
children.
79
5.2 Risk Factors o f Vitamin A Deficiency
Inadequate intake of vitamin A rich food, low intake of fat, PEM, respiratory tract
infection, diarrheal diseases, measles and intestinal helmenthiasis are important risk
factors for vitamin A deficiency. However, the contribution made by these factors may
vary from one community to another. This study investigated which of these risk factors
had significant contribution to vitamin A deficiency in the study area.
Food frequency: The frequency of consumption of vitamin A rich foods was found
to be well below the threshold values of the HKI Food Frequency Method. According to
this method vitamin A deficiency is a public health problem in a given community if
either of the following threshold values is satisfied. Less or equal to 4 days per week
mean frequency of consumption of animal source vitamin A, or, less or equal to 6 days
per week mean frequency of total consumption of animal and plant source of vitamin A
(weighted by source). The food frequency results suggest that all community clusters
studied had very infrequent consumption of vitamin A rich foods. The community cluster
with highest mean frequency of consumption of animal source vitamin A consumed 2.6
days per week which is still very low compared to the HKIFFM cut off point of greater
than 4 days per week. Also the mean frequency of total consumption of animal and plant
source of vitamin A by the community clusters, which ranges from 0.9 to 2.9 days per
week is far below the threshold value of HKIFFM which is greater than 6 day per week.
This indicates that low intake of vitamin A rich foods might be the major risk factor of
Vltamin A deficiency in the area.
80
Dark green leafy vegetable as a food group consumed at least once in a week by about
half (48.3%) of the children, however, the mean frequency of consumption was low at
0.8 days per week. The finding seems to be in agreement with other investigations,
which have reported that the frequency of consumption of dark green leafy vegetables in
Arssi zone is low. De sole et al. (1987) reported once in a week average frequency of
consumption of dark green vegetables. Another study in the same zone, indicated that
only 13.1% of households consumed dark green leafy vegetables three times a week
(Tefera, 1994).
The result of an earlier community survey in Arssi zone showed that carrot is consumed
irregularly (De sole et al., 1987). Similarly, in the present study, carrot is consumed at
least once in a week only by 7.7% of the children and the average frequency of
consumption was as low as 0.16 days per week. The mean frequency of consumption of
other plant sources vitamin A rich foods are also very low. Exclusively seasonal
vegetables backyard gardens and reduction of availability of cash for the purchase of
these food items during dry seasons might be the possible explanations for this low-level
of intake of plant source vitamin A rich foods the area.
Only 37.4% and 22% of the studied population consume butter and eggs at least once in a
week. Furthermore the average frequency of consumption of eggs and butter was low at
0 44 and 1.03 days per week respectively. The consumption of other animal source of
vitamin A rich foods was also found to be extremely low. The mean frequency

81consumption of fish and liver were 0.02 and 0.03 day per week. This finding seems
consistent with the results of earlier studies in the zone (Tefera, 1994).
In the literature, it is stated that dietary fat and oil are important for the absorption of
vitamin A (IVACG, 1979). Especially dietary fat is necessary for the absorption of
vegetable sources of provitamin A (WHO, 1995). To ensure adequate intake of fat and
oil that is required for the absorption of vitamin A and provitamin A, food containing fat
and oil should be consumed daily. It is interesting to note that majority (98%) of the
children in the present study consumed food containing fats or oil at least once in the last
seven days. Mean frequency of consumption of foods containing oil or fat was 6.7 days
pier week. The frequency of consumption of food containing fat and oil and food cooked
in oil suggests that consumption seems sufficient to ensure adequate absorption of
vitamin A in most of the children. Hence, it seems very unlikely that low intake of fat
significantly contribute to the problem of vitamin A deficiency in the area.
Dietary intake of food rich in vitamin A and risk of xerophthalmia are inversely
associated. In a cross sectional study carried out in Aris zone, an inverse association was
observed between the frequency of consumption of foods rich in vitamin A and
xerophthalmia (Tefera, 1994). Similarly, this study has demonstrated an inverse
association between the frequency of consumption of foods rich in vitamin A and
xerophthalmia (P<0.01). This also strongly suggest that inadequate intake of food rich in
vitamin A might be the important risk factor of vitamin A deficiency in the area.

82
Breastfeeding. Studies have shown that breastfed infants are protected from vitamin A
deficiency (Tarwotijo et al., 1982). This might be partly due to the regular supply of
preformed vitamin A in the milk. It may also be due to lower rate of infection compared
with artificial fed children. Breast milk provides sufficient vitamin A to prevent clinical
manifestation of vitamin A deficiency throughout the first year of life even in poorly-
nourished population in developing countries (Sommer A., 1995). Such protection of
breast milk against vitamin A deficiency in under-one children was also reported from
Ethiopia (Yonas et al., 1996; De Sole et al., 1987) and the Sudan (Bushra et al., 1987).
Similarly, in the present study, no xerophthalmic child was found below the age of two.
The data shows that more than 94% of the under-two children were breastfed at the time
of the study. This suggests that breastfeeding is protective against vitamin A deficiency.
Of the children who manifested clinical symptoms and/or signs, only 2.3% were below
the age of three years while the remaining were above three. The difference is
statistically significant (P< 0.001) which is in accordance with the observations reported
earlier in Ethiopia (Wolde Gebreil et al., 1993; Yonas et al., 1996). However, this
proportion is much lower than the observation in Asia (Brink et al., 1979; Solon et al.,
1978). The contrast may possibly be explained by the extended breastfeeding practice of
the rural Ethiopian women. Interestingly, prolonged breast-feeding is generally a norm
and considered as a natural phenomenon in the study area. As mentioned earlier, more
than 94% under two children were found to be breastfed. Furthermore, amongst the
older children almost 29 % of them were breastfed. Presumably breast-milk is a major
source of vitamin A which grants considerable protection against vitamin A deficiency
for children of this age group in the study area.
Protein energy malnutrition About 48 % of the under 10 years old children were
found to be malnourished with 12.4% wasting and 41.3% stunting. The problem is more
severe amongst preschool children of whom 16% and 45.2% were found to be wasted
and stunted respectively. The prevalence of wasting in the under six years old children is
considerably higher than the national figure which is 8% (CSA, 1992). This disparity in
the prevalence of wasting suggests that the study area could be a pocket of higher
prevalence of acute malnutrition than most part of the country. The highest prevalence of
wasting is recorded between the age of 12 and 23 months which is in accordance with the
literature (Gibson, 1990). This may be explained by the improper weaning practice of
mothers of the study area. The data shows that the mean weaning age in the study
population was 6.2 months which is consistent with earlier report from the same zone
that showed the average weaning age of 6.6 months (De sole et al., 1987). This implies
that children in this area seem to be at risk of late weaning. Moreover, the quality and
inadequacy of the weaning food might also be important factors for the observed high
rate of wasting in this age group.
There are interesting although inconsistent observations in the literature on the
association between PEM and incidence of xerophthalmia. IVACG (1981) has stated
that PEM almost invariably accompanies xerophthalmia in young children. A study
conducted in Sri Lanka revealed that the prevalence of xerophthalmia was higher in
children with stunting alone and stunting and wasting together than their normal
counterparts (Brink et al., 1979). In India, 175 children with kwashiorkor were admitted.
83

all having low serum vitamin A levels. Eighteen (10.3%) of the 175 children died. Of
the 18 deaths, five had keratomalacia, one had Bitot’s spots and five other had vitamin A
serum level below lOpg/lOOml (Eastman, 1987). In contrast, McLaren and Frigg (1997)
indicated that clinical manifestation of severe PEM, (marasmus, marasmic-kwashiorkor,
or kwashiorkor) are not necessarily associated with ocular signs of vitamin A deficiency.
Publications from Ethiopia also have shown no association between anthropometric
values of the children and clinical signs of xerophthalmia (Wolde- Gebrile et al.,1993;
Yonas et al., 1997). In the present study, there was no significant association between
nutritional status as assessed by anthropometric measurement and ocular manifestation of
vitamin A deficiency. This indicates that protein energy malnutrition might not be the
risk factor to vitamin A deficiency in the study area.
Morbidity. More than 10% of the children had a history of diarrhea in the last one
month. In the literature, it has been stated that diarrhea, especially repeated and
prolonged diarrhea, is one of the risk factors for vitamin A deficiency in children whose
liver store are low (WHO, 1988). Several studies from Ethiopia (De sole et al., 1987;
Yonas et al., 1996) and elsewhere (Sommer A. et al., 1987) have shown association
between vitamin A deficiency and diarrhea. This study seems to be in agreement with
these findings, in that diarrhea is significantly (P<0.05) associated with signs of
xerophthalmia. This indicates that diarrheal diseases might partly be accountable for
vitamin A deficiency in the study area.
84
The prevalence of respiratory tract infection in the last one month was 4.7%. However,
no statistically significant association was observed between the incidence of respiratory
tract infection and xerophthalmia. This is consistent with the observation reported earlier
from Ethiopia (Yonas et al., 1997). This suggests that respiratory tract infections might
not be risk factor for vitamin A deficiency in this area.
Measles is an important risk factor for the development of severe vitamin A deficiency
because it depletes vitamin A reserves by markedly increasing the utilization at a time
when dietary intake and absorption are reduced. Secondly, measles plays an important
role in corneal blindness. In Indonesia, children who had a history of recent measles
were eleven times more likely to get corneal lesion than children who had not had
measles (Sommer A., 1982). In the present study, however, it was not possible to
perform any statistical analysis regarding the association between xerophthalmia and
measles due to a very low number of children with measles. The very low prevalence of
measles (0.25%) in the study area, however, may suggest that the observed active
xerophthalmia might not be linked to measles in the study population.
Evidence mounts that post-measles blindness in Africa is considerable. In Malawi and
Tanzania about a half of the number of children in school of the blind had a history of
measles immediately preceding the blind episode (UNICEF, 1987). In Ethiopia, measles
was reported to be responsible at least for 40% of bilateral blindness cases in schools of
the blind (Wolde-Gebreil et al., 1992). Similarly, the data of this study show that a
85
history of measles preceded the onset of the corneal scaring in both children with corneal
scar. Although the numbers of children (2) with corneal scar in this study were so small,
the finding seems to support aforementioned observations.
Intestinal helminthiasis: The over all prevalence of intestinal helminthiasis in the
present study was 16.6 percent, which shows that intestinal worms does not seems to be a
serious problem in the area. Furthermore clinical recored of Dera health center (the
nearest health facilities of the study population) also indicates that helminthiasis was not
among the ten top disease that had been diagnosed by the health center.
No statistically significant association was found between helmintic infestation and
clinical signs of xerophthalmia. This might be explained by the fact that the prevalence
of helmenthiasis, especially those parasites known to have an association with VAD,
such as ascaris is low in the area. Secondly, the intensity of infection was generally light.
The finding indicates that intestinal helminthiasis does not seems to be one of the risk
factors of VAD in the area.
To sum up, the study has showed that the consumption of vitamin A rich foods in the
area was very low and significantly associated with xerophthalmia. It also demonstrated
a significant association between diarrhea and VAD. This suggests that, low consumption
of vitamin A rich food and diarrheal diseases were the most important risk factors for
vitamin A deficiency in the study area. This was further supported by the lack of any
86

significant association between the remaining risk factors (PEM, respiratory tract
infection, measles and intestinal helminthiasis) and VAD in the area.

CHAPTER VI
CONCLUSION AND RECOMMENDATIONS
6.1 Conclusion
This study has investigated the prevalence of vitamin A deficiency among children aged
six months to 15 years and the risk factors of vitamin A deficiency in Arssi zone, central
Ethiopia. Both the clinical and biochemical findings indicate that vitamin A deficiency
is a public health problem in the area. Furthermore, it was observed that the problem of
vitamin A deficiency among preschool children decreased markedly. However, it still
continues to be marginally a public health problem in the area (Bitot’s spots rate of
0.53%). The findings have also shown that VAD is a very serious public health problem
among school age children than preschool children. The difference in the prevalence of
xerophthalmia between school age and preschool was significant. This might be due to
the on going universal vitamin A capsule distribution program, which targets only
preschool children.
Infrequent consumption of vitamin A rich food is the most important risk factor of
vitamin A deficiency in the area. The frequency of consumption of foods rich in vitamin
A by the children is far below the cut-off point set by HKI. This confirms that vitamin A
deficiency, which is presumably due to infrequent consumption of vitamin A rich foods,
is a public health problem in the area. Moreover there is strong association between
signs of xerophthalmia and frequency of consumption of foods rich in vitamin A.
88

89
Diarrheal diseases also appear to be another risk factor to vitamin A deficiency in the
area. Although the strength of the association between diarrheal disease and
xerophthalmia is not as strong as the association between consumption of vitamin A rich
foods and xerophthalmia, it was found to be significant.
The lack of significant relationship between xerophthalmia and respiratory infections or
measles or PEM or intestinal helminthiasis also suggest that infrequent consumption of
vitamin A rich foods and diarrhea are the most important risk factors of vitamin A
deficiency in the area.
6.2 Recommendations
1. Although the prevalence of xerophthalmia among preschool children decreased in
the area, it still continues to be marginally a public health problem. The observed
remarkable result in decreasing the prevalence of xerophthalmia in the study area
is mainly attributed to the on-going universal vitamin A capsule distribution. It is,
therefore, recommended that the vitamin A capsule distribution should continue
to be distributed to preschool children as a short-term intervention until the
deficiency decreases below the public health significant level and the long-term
prevention program is launched.

2. There is no doubt that VAD is a public health problem among school age children
in the area. The seriousness of the problem among these age group children
dictates the expansion of the already initiated vitamin A capsule distribution
program to school age children. Since the current vitamin A capsule distribution
program in the area seems well placed, widening the target age to 15 years would
ensure effective distribution of vitamin A capsule to school age children.
Moreover, expansion of the target age group of the on-going distribution program
does not incur significant additional running costs on the program. It is,
therefore, highly recommended to widen the target age group of the current
vitamin A capsule distribution program from 6 months to six years, to 6 months to
15 years as a short-term strategy of controlling the problem in the area.
3. Although few recent studies indicate that provitamin A carotenoids may not be an
effective strategy for the control of VAD as previously assumed, there is ample
epidemiological evidence that suggests adequate intake of dark green leafy
vegetable protects individuals from xerophthalmia. For poor communities, such
as this community, only plant foods are widely accessible forms of vitamin A.
Secondly, for a poor agricultural country like Ethiopia, agriculture-based
interventions are more likely to be sustainable than industry-based strategy such
as fortification. Hence, increasing the availability and consumption of vitamin A
rich food through promotion of horticulture and nutrition education remains the
most feasible long-term strategy towards solving the problem.
90

91
4. Public health measures such as control of diarrheal diseases should be taken as
one of the possible ways of decreasing vitamin A deficiency in the area.
5. Since inadequate intake of vitamin A rich foods and disease conditions are the
immediate cause of vitamin A deficiency, further investigations should be earned
out in order to determine the basic causes of the problem in this and similar areas.
Moreover the current study demonstrated that VAD is public health significance
problem among school age children. This indicates that the deficiency might also
be a public health problem among school age children in other parts of the
country. Hence, the vitamin A status of school children in other parts of the
country should also be studied.
References92
1. Beaton G., Martorell R., Aronson K., Edmonston B., McCabe G., Ross AC and Harvey B. (1993). Effectiveness of vitamin A supplementation in the control of young child morbidity and mortality in developing countries. ACC/SCN Nutrition Policy Discussion Paper No. 13. Geneva.
2. Bloem MW, Matzger H., Huq N. (1994). Vitamin A deficiency among women in reproductive years: an ignored problem. Report of the XVI International Vitamin A Consultative Group meeting, Chiang Rai, Thailand, pp. 78 (abstract). Washington DC.
3. Bloem MW, de pee S. and Damton-Hill I. (1998). New issues in developing effective approaches for the prevention and control of vitamin A deficiency. Food and Nutrition Bulletin, 19(2): 137-147.
4. Bier G., Tolliver T. and Catignani G. (1979). Simultaneous determination of tocopherol and retinol in plasma or red cells by high pressure liquid chromatography. American Journal of Clinical Nutrition, 32:2143-2146.
5. Brink EW, Perera WD, Broske S., Cash R., Smith J., Sauberlich H. and Bashar M. (1979). Vitamin A status of children in Sri Lanka. American Journal of Clinical Nutrition, 32: 84-91.
6. Bushra HE and Tom AR (1987). Vitamin A deficiency: A public health problem in eastern Sudan. East African Medical Journal, 64: 782-789.
7. CDC (1990). Anthro: Software for calculating pediatric Anthropometry. Ver. 1.01. US Department of Health and Human Services and the World Health Organization. Geneva.
8. Cheesbrough M. (1981). Medical laboratory manual for tropical countries. 1st edition. Vol. 1. Stephen Austin and son Ltd, Hertford, pp 141-2.
9. Cohen N., Rahman H., Sprague J., Jalil MA, Leemhuis de Regt E. and Mitra M. (1985). Prevalence and determinants of nutritional blindness in Bangladesh children. World Health Statistics Quarterly, 38: 317-330.
10. CSA (1992). The national rural nutrition survey. Core module. Addis Ababa, Ethiopia.
11. CSA (1995). The 1994 population and housing census of Ethiopia. Oromiya Region summary report. Addis Ababa, Ethiopia.

12. CSA (1996). The 1994 population and housing census of Ethiopia. Oromiya Region volume I, part IV. Addis Ababa, Ethiopia.
13. Demeke T, Gebru H. (1982). Xerophthalmia: a review of hospital out-patient records. Ethiopian Medical Journal 20: 15-20.
14. De pee S, West CE, Muhilal, Karradi D, Hautvast JGAJ (1995). Lack of improvement in vitamin A status with increased consumption of dark green leafy vegetables. Lancet 346: 75-81.
15. De Sole G. Belay Y. and zegaye B. (1985). Vitamin A deficiency in Southern Ethiopia. American Journal of clinical nutrition, 45:780-784
16. Eastman S. (1987). Vitamin A deficiency and xerophthalmia: Recent findings and some program implication, Assignment children. UNICEF, New York.
17. Fawize WW, Herrera MG, Willett WC, Lipstiz S., Spiegelman D. and Mohamed KA (1993). Vitamin A supplementation and dietary vitamin A in relation to the risk of xerophthalmia . American Journal of Clinical Nutrition, 58: (3) 385-391.
18. Food and Agriculture Organization (1993). Preventing micronutrient deficiency: food abundance and diversitv are fundamental. Food, Nutrition and Agriculture, 7: 8-17.
19. Gebre-Medhin M. and Ababa G. (1975). Dietary intake in the third trimester of pregnancy and birth weight of offspring among non-privileged and privileged women. American Journal of Clinical Nutrition, 28(11): 1322-1329.
20. Gibson R.S (1990). Principles of nutritional assessment. Oxford University Press, New York.
21. Gillespie S. and Mason J. (1994). Controlling vitamin A deficiency. ACC/SCN State-of-The-Art-series. Nutrition Policy Discussion Paper No. 14. Ottawa, Canada.
22. Henning A., Foster A., Sherta S. and Pokhrel R. (1991). Vitamin A deficiency and comeal ulceration in southeast Nepal: Implication for preventing blindness in children. Bulletin of the World Health Organization, 69 (2): 235-239.
23. Interdepartmenmental Committee on Nutrition for National Defence (1959). Ethiopian nutrition survey. Publication 1961 0-598935. US Government Printing Office. Washington DC.
24. International children center (1986). Children in the tropics No.65, pp. 5. Paris.
93

2 5 . IVACG (1993). A brief guide to current methods of assessing vitamin A status. Monograph, IVACG, Washington DC.
26. IVACG (1979). Guidelines for the eradication of vitamin A deficiency and xerophthalmia. Recent advance in the metabolism and function of vitamin A and their relationship to applied nutrition. Monograph, IVACG, Washington DC.
27. IVACG (1996). IVACG Statement on clustering of xerophthalmia and vitamin A deficiency within communities and families. Washington DC.
28. IVACG (1981). The symptoms and signs of vitamin A deficiency and their relationship to applied nutrition. Monograph, IVACG, Washington DC.
29. Khan MU, Haque E., Khan MR (1984). Nutritional ocular diseases and their association with diarrhea in Matlab Bangladesh. British Journal of Nutrition, 53: 1-9.
30. Lee R. and Nieman D. (1996). Nutritional assessment. 2nd edition. Mosby-Year Book Inc. Missouri, USA.
31. Lindtj0m B (1983). Xerophthalmia in the Gardula area of southwest Ethiopia. Ethiopian Medical Journal, 21: 169-74.
32. Machlin L. J (1991). Hand book of vitamins. 2nd edition revised and expanded.
33. Mahalanabis DS, Simpson TW, Chakraborty ML, Ganguli C., Bhattachaijee AK and Mukherjec KL (1979). Malabsorption of water miscible vitamin A in children with giardiasis and ascariasis. American Journal of Clinical Nutrition, 32:313-318.
34. McLaren DS (1999). Towards the conquest of vitamin A deficiency disorder. Task Force Sight and Life. Basel, Switzerland.
35. McLaren DS, and Frigg M. (1997). Sight and life manual on vitamin A deficiency disorder (VADD). Task Force Sight and Life. Basel, Switzerland.
36. Milton RC, Reddy V. and Naidu AN (1987). Mild vitamin A deficiency and childhood mortality: an Indian experience. American Journal of Clinical Nutrition, 46: 827-29.
37. Ministry of health (1986). Family health project beneficiaries assessment (social survey). Addis Ababa, Ethiopia.
38. Mohanram M., Reddy V., and Mishar S. (1974). Lysozome activity in plasma and leukocytes in malnourished children. British Journal of Nutrition, 32: 313-16.
94
)

95
39. Northrup R. and Rohde J. (1992). The state of child health: The context in which vitamin A deficiency occurs. In Bellagio meeting on vitamin A deficiency and child-hood mortality. K.P. West Jr. (ed), Helen Keller International. New York, pp. 13-17.
40. Pant I. and Gopaldas T. (1986). Is vitamin A deficiency a public health problem in underprivileged school boys (5-15 years)? Nutrition Review 6: 1051-1061.
41. Pijls L., Timmer A., Wolde-Gebriel Z., and West CE (1989). Preparation, food value and consumption of ensete (Ensete ventricosum) in Ethiopia. In Micronutrient deficiencies in Ethiopia and their inter-relationship. PhD thesis. (Annex) pp. 151-160. Wageningen Agricultural University, The Netherlands.
42. Ramana G., Ghavan V., Mahtab B. and Reddy (1991). Horticulture intervention for improving vitamin A status. Proceeding of XIV IVACG meeting, pp. 62 Guayaquil, Ecuador. (Abstract). Washington DC.
43. Reddy V., Bhaskaram P., Raqhuramulu N., Milton R., Rao V.(1986). Relationship between measles, malnutrition and blindness: a prospective study in India children. American Journal of Clinical Nutrition, 44: 924-930.
44. Rosen D., Haselow N. and Sloan N (1993). How to use the HKI food frequency method to assess community risk of vitamin A deficiency. Helen Keller International. Vitamin A technical assistance program. New York.
45. Salon S., Popkin M., Fernandez L. and Lotham C., (1978). Vitamin A deficiency in Philippines: A study of xerophthalmia in Cebu. American Journal of Clinical Nutrition, 31: 360-368.
46. Sinha DP and Bang FB (1973). Seasonal variations in signs of vitamin A deficiency in rural west Bengal children. Lancet, ii 228-231.
47. Somer E. (1992). The essential guides to vitamins and minerals. Harpercollins Publisher.
48. Sommer A (1992), Clinical and observational studies. In Bellagio meeting on vitamin A deficiency and child-hood mortality. K.P. West Jr. (ed.), Helen Keller International. New York. pp. 40-41.
49. Sommer A. (1982). Nutritional blindness, xerophthalmia and keratomalacia. Oxford University Press, New York.
50. Sommer A. (1995). Vitamin A deficiency and its consequences: A field guide to detection and control. Monograph, WHO, Geneva.

96
51. Sommer A. Tarwotijo I., Hussaini G., Susanto D. (1983). Increased mortality in children with mild vitamin A deficiency. Lancet: 585-588.
52. Sommer A., Tarwotijo I., Hussaini G., Susanto D. and Soegiharto T. (1981). Incidence, prevalence, and scale of blinding malnutrition, Lancet i: 1407-1408.
53. Sommer A., Tarwotijo I., Katz J. (1987). Increased risk of xerophthalmia following diarrhea and respiratory diseases. American Journal of Clinical Nutrition, 45: 977-980.
54. Suhamo Djoko (1994), The role of vitamin A in nutritional anaemia: A study in pregnant women in west Java, Indonesia. PhD thesis. Wageningen Agricultural University. The Netherlands.
55. Tarwotjo I., Sommer A., Soegiharto T., Susanto D. and Muhila (1982). Dietary practice and xerophthalmia among Indonesian children. American Journal of Clinical Nutrition, 35: 574-581.
56. Tefera A. (1994). Vitamin A deficiency and its dietary' associations: The case of preschool children in Arssi Region, Ethiopia. MSc. Thesis, University of Nairobi, Kenya.
57. Tezera F. and Yonas T. (1993). The fight against nutritional blindness. A report on a mass vitamin A capsule distribution campaign in four woredas of Arsi zone- central Ethiopia. Ethiopian nutrition Institute, Addis Ababa, Ethiopia.
58. UNICEF (1998). The state of the world's children. Oxford University Press. New York.
59. UNICEF (1987). Vitamin A for measles. A joint WHO/UNICEF statement. New York.
60. Waterlow JC (1973). Note on the assessment and classification of protein-energy malnutrition in children. Lancet, ii: 87-89.
61. West K.P. and Sommer A (1993). Delivery of oral dose of vitamin A to prevent vitamin A deficiency and nutritional blindness: A state-of-the-art review. ACC/SCN Nutrition Policy Discussion Paper No. 2. Rome.
62. Wilma B.F (1991). The vitamin A situation in Ecuador. Proceeding of XIV International Vitamin A Consultative Group meeting, Guayaquil, Ecuador, pp 51 (abstract).

63. WHO/UNICEF/IVACG Task Force (1988). Vitamin A supplements. A guide to their use in the treatment and prevention of vitamin A deficiency and xerophthalmia. World Health Organization, Geneva.
64. WHO/UNICEF/USAID/HKI/IVACG (1982). Control of vitamin A deficiency and xerophthalmia. No. 672, pp. 13-16. WHO Technical Report Series. Geneva.
65. World Health Organization (1993). Databank: vitamin A deficiency in countries of the African region. Working paper.
66. World Health Organization (1995). Global prevalence of vitamin A deficiency. Micronutrient Deficiency Information System working paper No. 2. Geneva.
67. World Health Organization (1983). Measuring change in nutritional status. Geneva.
68. Wolde-Gebrile Z., Demeke T, West CE (1991). Xerophthalmia in Ethiopia: A nationwide ophthalmological, biochemical and anthropometric survey. European Journal of Clinical Nutrition, 45: 469-78.
69. Wolde-Gebrile Z., Gebru H., Fisshea T. and West CE. (1993). Vitamin A, iron and iodine status in children with severe vitamin A deficiency in the rural village in Hararghe region of Ethiopia. European Journal of Clinical Nutrition, 47: 104-114.
70. Wolde Gebrile Z., Gebru K , and West CE. (1992). Causes of blindness in the schools for the blind in Ethiopia. In Micronutrient deficiencies in Ethiopia and their inter-relationship. PhD thesis, pp. 31-39. Wageningen Agricultural University. The Netherlands.
71. Wolf G. (1978). Historical note on mode of administration of vitamin A for the cure of night blindness. American Journal of Clinical Nutrition, 31: 290-2.
72. Yonas T., Abera A. and Wolde Gebrile Z. (1997). Nutritional blindness in Tigrai region, northern Ethiopia. Ethiopian Journal of Health Development, 11 (2): 157- 162.
73. Yonas T. and Tezera F., (1994). Blinding malnutrition: A serious threat in A district of Arsi zone, central Ethiopia. Report of the XVI International Vitamin A Consultative Group meeting, Chiang Rai, Thailand, pp.81 (abstract). Washington DC.
74. Yonas T., Tezera F., Melaku U., Jemal H. and Wondemu T., (1996). Vitamin A deficiency: A serious threat in Dodota district in central Ethiopia. East African Medical Journal, 73 (5): 303-307.
75. Zeitlin M. Megawanja R., Kramer M., and Armotrong H. (1992). Mothers’ and children intakes of vitamin A in rural Bangladesh. American Journal of Clinical Nutrition, 56:136-147.
97

000
Appendix A1. Countries categorized by degree of public health importance of vitamin A deficiency
Tlie designations em p loyed ar.a tin: p o s o n ta ic n ct ir.jitn .a i on iix s m ao do no; iro i^ .r-e tx p ie s& o n .>i v»«aj.i;;:.non c c/k em ir.n Hi. u s j i .js u i i n - u,im ju . .... a . . . . . . . . . ________ c-fiir.'y' v.r a^ocvc< or. ;r*» pan wi ir.g v.-pno Heaun
98
000
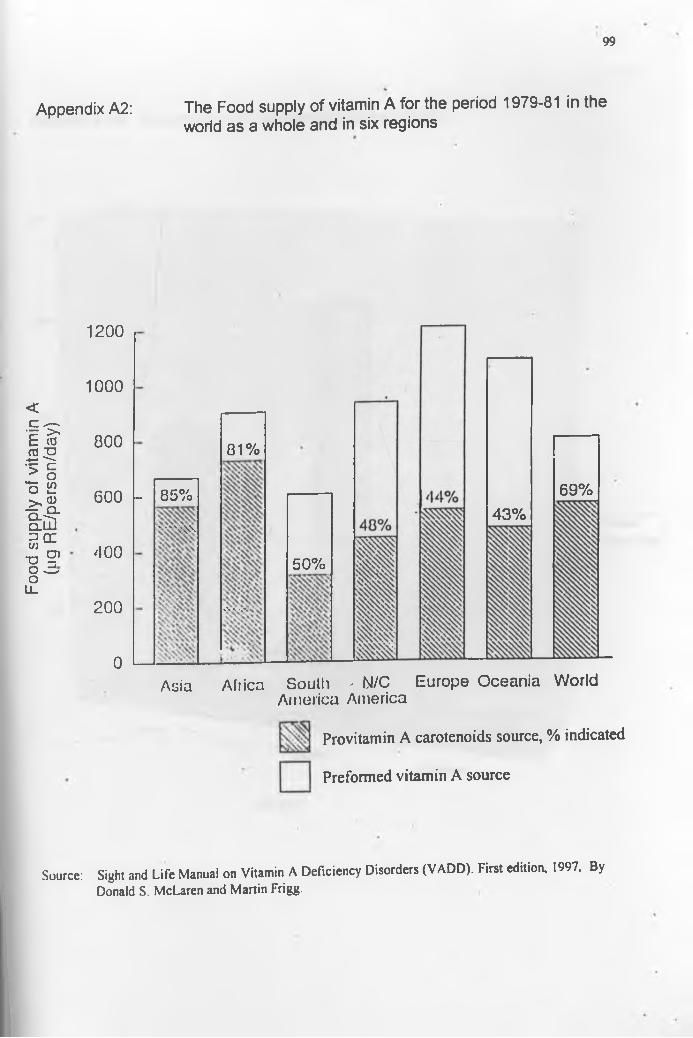
Food
sup
ply of
vitam
in A
(ug
RE/pe
rson/d
ay)
99
Appendix A2: The Food supply of vitamin A for the period 1979-81 in theworld as a whole and in six regions
1200
1000
800
600 l-
400
200
0
85%' ■ “ \ w
81%
%\ Vvv
50%
43%69%
Asia Africa South - N/C America America
Europe Oceania World
Provitamin A carotenoids source, % indicated
Preformed vitamin A source
Source: Sight and Life Manual on Vitamin A Deficiency Disorders (VADD). First edition, 1997. ByDonald S. McLaren and Martin Frigg.

100
Appendix A3 Distribution of xerophthalmia by religion
Religion

101
Appendix A4 Definitions of intensity of infections used in this study
Parasite Intensity of infection Egg countLight Under 7000 epg
A. lumbricoides Moderate 7000- 35000Heavy Over 35000
Light Under 5000 epgHookworm Moderate 5000- 20000
Heavy Over 20000
Light Under 100 epgE. vermicularis Moderate 101- 400
Heavy Over- 400
Light 1-400 epgS.mansoni Moderate 101-400
Heavy 400
The impact of helminth infection on human nutrition, by Stephenson, L.S. and Holland ,C.

Appendix A5 Questionnaire102
SECTION A: DEMOGRAPHIC CHARACTERISTICS
1. Zone 2. Woreda (district) 3. Villaae
4. H H No 5. ID No. 6 Date o f interview
7. Name ofHHH 8. Name o f respondent
9. Name o f interviewer
|SerNo.
Name Sex age Relation to HHH
Marital status Ethnic Religion Educ II
Codes
Relation to M arital Sex Ethnic Religion EducationHHH status male=l Amhara=l Orthodox=l llliterate=0Husband=l single=l female=2 Oromo=2 Muslim=2 preschool=99Wife=2 married=2 Tigre=3 Catholic=3 write schoolDaughter=3 divorced=3 Gurage=4 Protestant=4 years forSon=4 widowed=4 Dorzie=5 Other= 5 literateGrand child=5Parent=6Maid=7Sister=8Brother=9Not related=10
separated=5 not applicable=6
Wolaita=6 Kembata=7 Hararie=8 Other (specify)

Note to interviewer: Proceed to interview the mother/caretaker about the selected child only.
SECTION B 1IKI FOOD FREQUENCY QUESTIONNAIRE103
I. Zone ________________ 2. Woreda ______________ 3. Village ____________4. H.H No.___________ 3. ID No. _______ 4. Date of interview ___________6. Name of selected child _________________ 7. Sex.— 8. Age ____9. Name of mother/
caretaker of the selected child _____________ 10. Name of interviewer _____
Note to interviewer: For each food listed in the table below, ask the following question in the order that the food items are listed.
11. How many days, in the past seven days, did ____________ (name of selected child)eat______________ (Specific food item)?
Name of food item Number of days eaten per weekMain staple (such a s wheat, m illet, m aize, i e f etc: se lec t o n ly one)Spicy, hot peppersDark green leafy vegetables ( IX iL V s a s a fo o d group) _________ Q_MilkCarrots h i -----------------------Ripe mango □Dark yellow or orange squash (includes pum pkin) □SpinachRipe papaya _________ Q_Pasta and macaroni (o r o th er s ta p le food) »Eggs with yolk ~ G ~Small fish (liver in ta c t) OPeanuts (o r o ther legum e)Yellow or orange sweet potato or yam □Chicken or other fowl (o r o th er m ea t)Amaranth leaves (o r o th er D G L V )Any kind of liverSweet potato leaves (o r o th er D G L V )Beef (o r cow, sheep o r g o a t m ea t)Butter OLentils (o r o ther legum e)Red palm oil □ -------------------------Cod liver oil OFood cooked in oilApricot (o ther p lan t source r ich in v itam in A ) □Coconuts (o ther fa t oil) 'Weaning food fortified with vitamin A (o r o th er fo o d fo r ti fie d with vitam in A ) such as, FAFA, Berta, Famix, Donation food, etc
0
Margarine fortified with vitamin A (o r o th er f o o d fo r ti fie d w ith vitam in A ) 0
O Animal source of vitamin A D Plant source vitamin A

104
Date of survey___ :____:____: Name of interviewer______________Name of respondent__________________ ID No._____________
Question to be answered by mothers o f the child under 3 years o f age.
1. Name of the child______________________ 2. Sex M _F_ 3.Age(mos).
4. Are you still breastfeeding your child?1. Yes 2. No if no, go to question 6.
5. If yes, when did you start breast-feeding?1. Immediately after birth 3. Later, specify'__2. One to three days after birth
6. When did you stop breast feeding___ (mos)?
SECTION C: BREAST FEEDING AND WEANING
7. Why did you stop breast-feeding?1. Pregnancy2. Birth of next-in-line child3. Illness of mother/child4. Insufficient breast milk5. Child too old6. Other specify
8. Is your child exclusively breastfed?1. yes 2. no
9. For how long will babies feed breast milk only01. Less than four months2 greater than 4 months and less than 6 months3. Other, specify.
10. For how long should mothers’ breast-feed their babies?1. 4 months 2. 4 to 6 months3. 6 to 12 months 4. 1 to 2 years5. Above 2 years
1. Are you giving to your child any food or drink other than breast milk? 1 .yes 2.no
2. If yes, what and at what age did you start?Types of food Age

SECTION D: MORBIDITY SANITATION AND HYGIENEQuestion to be answered by mothers or caretaker o f the child
Date of survey____:____:____: Name of interviewer__________Name of respondent ________________ ID No.______________
l.Name of the child_______ 2.Sex M _F_ 3.Age(mos)___4. Has the child had diarrhea in the last four weeks?
1. Yes 2. No
5. If yes, for how long did the child has diarrhea (in days)
6. Has the child had cough in the last four weeks?1. Yes 2. No
7. If yes, for how long did the child has cough (in days)
8. Has the child had fever in the last four weeks01. Yes 2. No
9. If yes, for how long did the child has fever (in days)
10. Has the child had measles in the last four weeks01. Yes 2. No
11. If yes, for how long did the child has measles (in days)
12. What is the source(s) of water used in the household01. Piped water in the house2. Piped water outside the house3. River4. Bore-hole5. Protected wells6. Others: specify________
13. Distance from the house to the water source (in Km).
14 Do you use a latrine?1. Yes 2. No
15. Type of latrine used?1. Pit latrine 3. Septic2. VIP latrine 4. Other, specify

1 0 6
Date of survey _______________ ID No. ________
1. Name of child___________ 2. Sex M_ F_
3. Age months 4. Date of birth___________
5. Age verification: 1. Child health card2. Birth certificate3. Oral
6. Take the following anthropometric measurement and fill in the table below.
SECTION E: ANTHROPOMETRIC MEASUREMENT
Measurement First Second Average
Weight! kg) 0.1kg
Height(cm)0.5cm
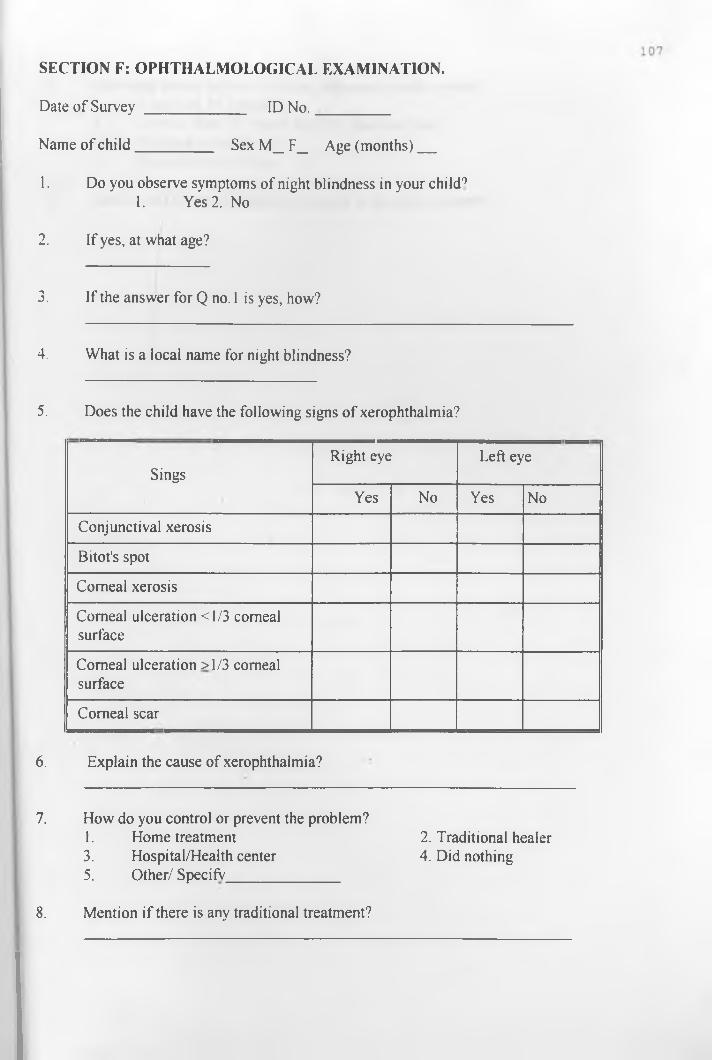
SECTION F: OPHTHALMOLOGICAL EXAMINATION.
Date of Survey _____________ ID No._________
Name of child__________ Sex M_ F_ Age (months)
1. Do you observe symptoms of night blindness in your child91. Yes 2. No
2. If yes, at what age?
3. If the answer for Q no. 1 is yes, how?
4. What is a local name for night blindness?
5. Does the child have the following signs of xerophthalmia?
SingsRight eye Left eye
Yes No Yes No
Conjunctival xerosis
Bitot's spot
Corneal xerosis
Corneal ulceration <1/3 corneal surface
Corneal ulceration >1/3 corneal surface
Corneal scar
6. Explain the cause of xerophthalmia?
7. How do you control or prevent the problem?1. Home treatment 2. Traditional healer3. Hospital/Health center 4. Did nothing5. Other/ SpecifV
8. Mention if there is any traditional treatment?

1 0 8
9 .
10.
How long does it takes to reach to the nearest health service?1. Less than 15 minute2. Greater than 15 minute and less than one hour.3. An hour or two hours.4. More than two hours.
Has the child revived vitamin A capsule in the last six months?

I. BLOOD
Date _________
Zone_________ 2. Woreda (district)_____
3. Village___________ ______
4. Name of child_____________
5. ID No.___________ __
6. Sex M _____ F ______
7. Age (months)___________
8. Serum retinol level________
II. STOOL
Date
1. Zone_________2. Woreda(district)______
3. Village_______________
4. Name of child__________
5. ID No._____________
6. Sex M___ F ____
7. Age (months)________ __
8. Ova or parasite_________
SECTION G: LABORATORY EXAMINATION
9. Wormload


![Vitamin-A deficiency and its determinants among preschool ... · of 49–59 months [AOR 3.00, 95 % CI (1.49,6.02)] were significantly associated with vitamin-A deficiency. Conclusions:](https://img.pdfslide.us/doc/110x75/5f3c80f17e4ceb34f67a168a/vitamin-a-deficiency-and-its-determinants-among-preschool-of-49a59-months.jpg)