Embed Size (px)
Citation preview
--
pL,J:,! ,,,,:.: .. —..,,- _
U.S. DEPARTMENT OF
—k-+ HEALTH, EDUCATION, AND WELFARE
PUBLIC HEALTH SERVICE
WASHINGTON , D.C. 20201
VITAL STATISTICS REPORT
IProvifiofiaZStatistkf
VOL. 17, NO.8 FROM THE
SUPPLEMENT NATIONAL CENTER FOR HEALTH STATISTICS OCTOBER 25, 1968
—- ..=
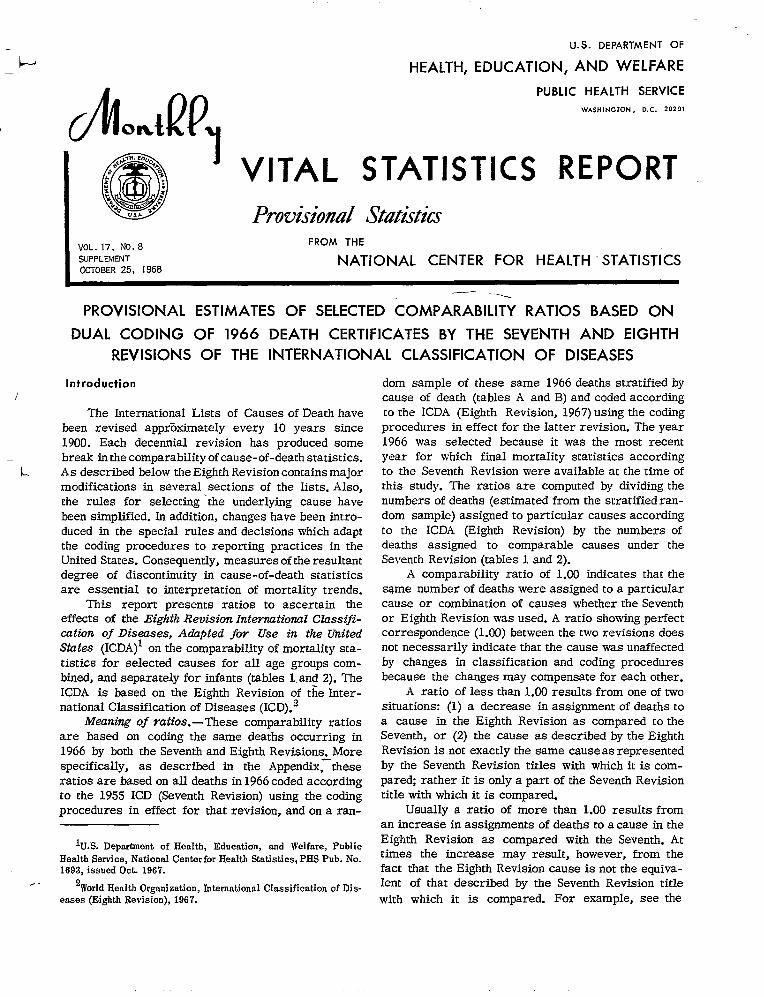
PROVISIONAL ESTIMATES OF SELECTED COMPARABILITY RATIOS BASED ON
DUAL CODING OF 1966 DEATH CERTIFICATES BY THE SEVENTH AND EIGHTH
.
1-
REVISIONS OF THE INTERNATIONAL
Introduction
The International Lists of Causes of Death have been revised approximately every 10 years since 1900. Each decennial revision has produced some break in the comparability of cause-of-death statistics. As described below the Eighth Revision contains major modifications in several sections of the lists. Also, the rules for selecting ‘the underlying cause have been simplified. In addition, changes have been introduced in the special rules and decisions which adapt the coding procedures to reporting practices in the United States. Consequently, measures of the resultant degree of discontinuity in cause-of-death statistics are essential to interpretation of mortality trends.
This report presents ratios to ascertain the effects of the Eighth Revision International Cfussij$cation of Diseases, Ad@ted fov Use in the United States (ICDA)l on the comparability of mortality statistics for selected causes for all age groups combined, and separately for infants (tables Land 2). The ICDA is based on the Eighth Revision of tie Inter-national Classification of Diseases (ICD).2
Meaning of ratios. -These comparability ratios are based on coding the same deaths occurring in 1966 by both the Seventh and Eighth Revisions. More specifically, as described in the Appendix~these ratios are based on all deaths in 1966 coded according to the 1955 ICD (Seventh Revision) using the coding procedures in effect for that revision, and on a ran
lu.s. l)ep~rt.mentof Health, Education, end Welfare, public
Health Service, National Center for Health Statistics, PHS Pub. No. 1693, issued Oct. 1967.
2World Health Organization, International Classification of Dis
eases (Eighth Revision), 1967.
CLASSIFICATION OF DISEASES
dom sample of these same 1966 deaths stratified by cause of death (tables A and B) and coded according to the ICDA (Eighth Revision, 1967) using the coding procedures in effect for the latter revision. The year 1966 was selected because it was the most recent year for which finaI mortaIity statistics according to the Seventh Revision were available at the time of this study. The ratios are computed by dividing the numbers of deaths (estimated from the stratified random sample) assigned to particular causes according to the ICDA (Eighth Revision) by the numbers of deaths assigned to comparable causes under the Seventh Revision (tables 1 and 2).
A comparability ratio of 1.00 indicates that the s~me number of deaths were assigned to a particular cause or combination of causes whether the Seventh or Eighth Revision was used. A ratio showing perfect correspondence (1.00) between the two revisions does not necessarily indicate that the cause was unaffected by changes in classification and coding procedures because the changes may compensate for each other.
A ratio of less than 1.00 results from one of two situations: (1) a decrease in assignment of deaths to a cause in the Eighth Revision as compared to the Seventh, or (2) the cause as described by the Eighth Revision is not exactly the same cause as represented by the Seventh Revision titles with which it is compared; rather it is only a part of the Seventh Revision title with which it is compared.
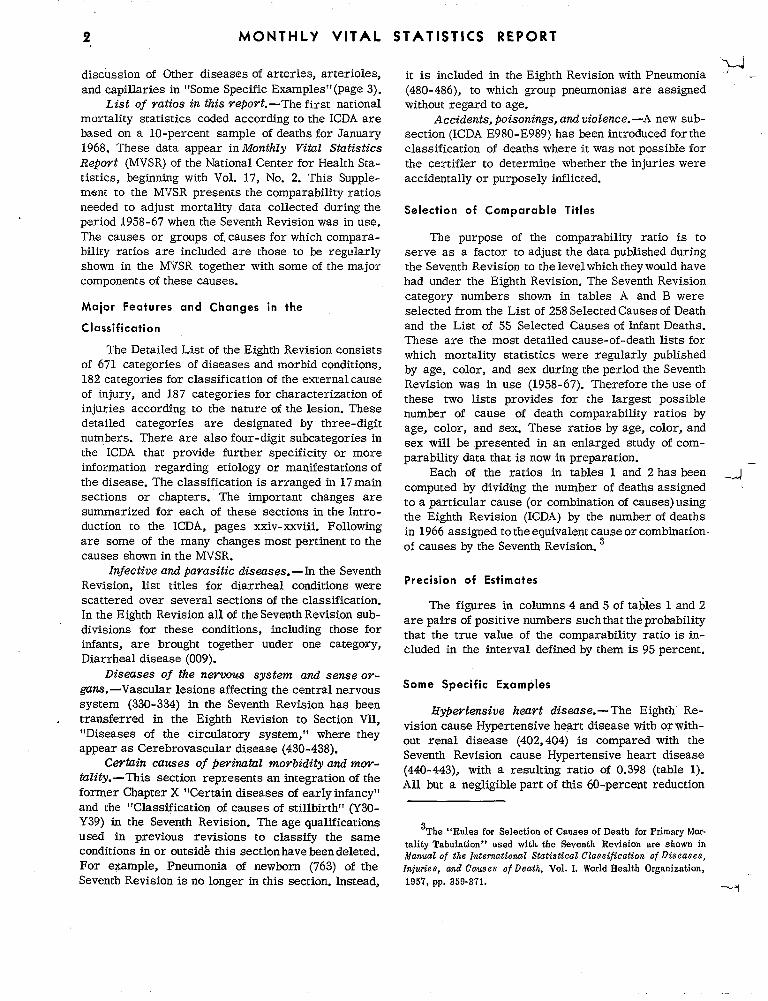
Usually a ratio of more than 1.00 results from an increase in assignments of deaths to a cause in the Eighth Revision as compared with the Seventh. At times the increase may result, however, from the fact that the Eighth Revision cause is not the equivalent of that described by the Seventh Revision title with which it is compared. For example, see the
2 MONTHLY VITAL STATISTICS REPORT
discussion of Other diseases of arteries, arterioles, and capillaries in “Some Specific Examples” (page 3).
List of vatios in this reflovt. —The f irst national mortality statistics coded according to the ICDA are based on a 10-percent sample of deaths for January 1968. These data appear in Monthly Vitul Statistics Report (MVSR) of the National Center for Health Statistics, beginning with Vol. 17, No. 2. This Supplement to the MVSR presents the comparability ratios needed to adjust mortality data collected during the period 1958-67 when the Seventh Revision was in use. The causes or groups of. causes for which comparability ratios are included are those to be regularly shown in the MiLSR together with some of the major components of these causes.
Maior Features and Changes in the
Classification
The Detailed List of the Eighth Revision consists of 671 categories of diseases and morbid conditions, 182 categories for classification of the external cause of injury, and 187 categories for characterization of injuries according to the nature of the lesion. These detailed categories are designated by three-digit num,bers. There are also four-digit subcategories in the ICDA that provide further specificity or more information regarding etiology or manifestations of the disease. The classification is arranged in 17 main sections or chapters. The important changes are summarized for each of these sections in the Introduction to the ICDA, pages xxiv-xxviii. Following are some of the many changes most pertinent to the causes shown in the MVSR.
Infective and pavasitic diseases.— In the Seventh Revision, list titles for diarrheal conditions were scattered over several sections of the classification. In the Eighth Revision all of the Seventh Revision sub-divisions for these conditions, including those for infants, are brought together under one category, Diarrheal disease (009).
Diseases of the nervous system and sense oY-WZS. —Vascular lesions affecting the central nervous System (330-334) in the Seventh Revision has been transferred in the Eighth Revision to Section VII, rrDiseases of the circulatory system, ” where they
appear as Cerebrovascular disease (430-438). Cwtain causes of perinatal morbidity and mov
tality.-l%is section represents an integration of the former Chapter X “Certain diseases of early infancy” and the “Classification of causes of stillbirth” (Y30-Y39) in the Seventh Revision. The age qualifications used in previous revisions to classify the same conditions in or outsid& this section have been deleted. For example, Pneumonia of newborn (763) of the Seventh Revision is no longer in this section. instead,
-j-i it is included in the Eighth Revision with Pneumonia —
(480-486), to which group pneumonias are assigned without regard to age.
Accidents, poisonings, and violence. —A new sub-section (ICDA E980-E989) has been introduced for the ,
classification of deaths where it was not possible for the certifier to determine whether the injuries were accidentally or purposely inflicted.
Selection of Comparable Titles
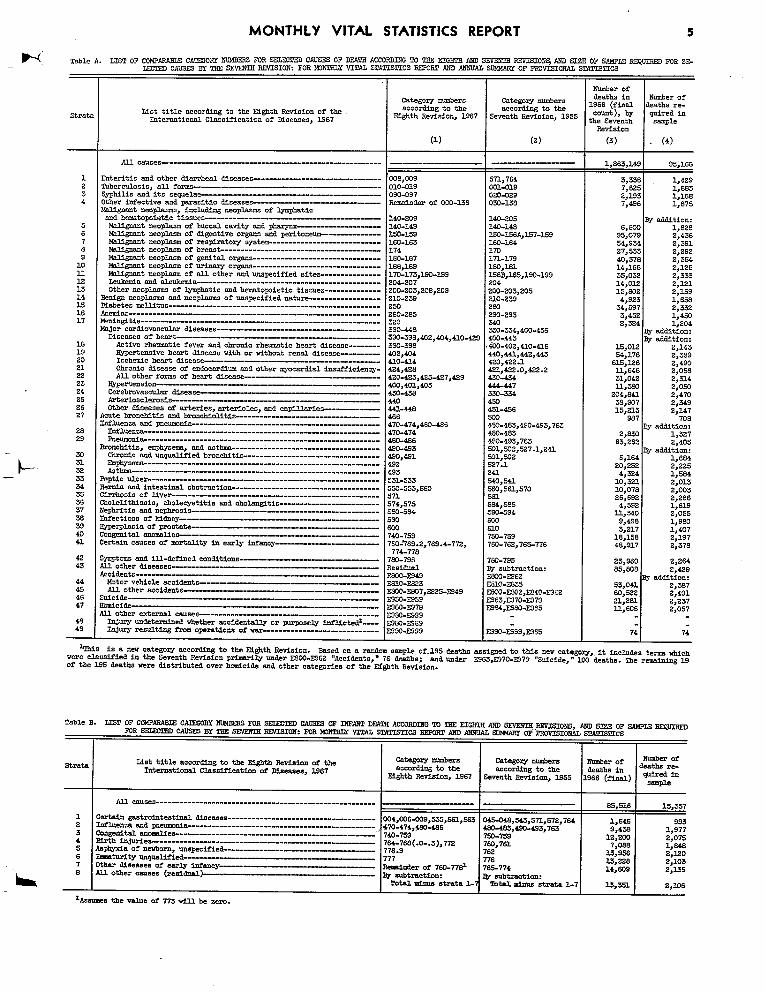
The purpose of the comparability ratio is to serve as a factor to adjust the data published during the Seventh Revision to the level which they would have had under the Eighth Revision. The Seventh Revision category numbers shown in tables A and B were selected from the List of 258 Selected Causes of Death and the List of 55 Selected Causes of Infant Deaths. These are the most detailed cause-of-death lists for which mortality statistics were regularly published by age, color, and sex during the period the Seventh Revision was in use (1958-67). Therefore the use of these two lists provides for the largest possible number of cause of death comparability ratios by age, color, and sex. These ratios by age, color, and sex will be presented in an enlarged study of comparability data that is now in preparation.
Each of the ratios in tables 1 and 2 has been 4-computed by dividing the number of deaths assigned to a particular cause (or combination of causes) using the Eighth Revision (ICDA) by the number of deaths in 1966 assigned to the equivalent c~use or combination. of causes by the Seventh Revision.
Precision of Estimates
The figures in columns 4 and 5 of tables 1 and 2 are pairs of positive numbers such that the probability that the true value of the comparability ratio is included in the interval defined by them is 95 percent.
Some Specific Examples
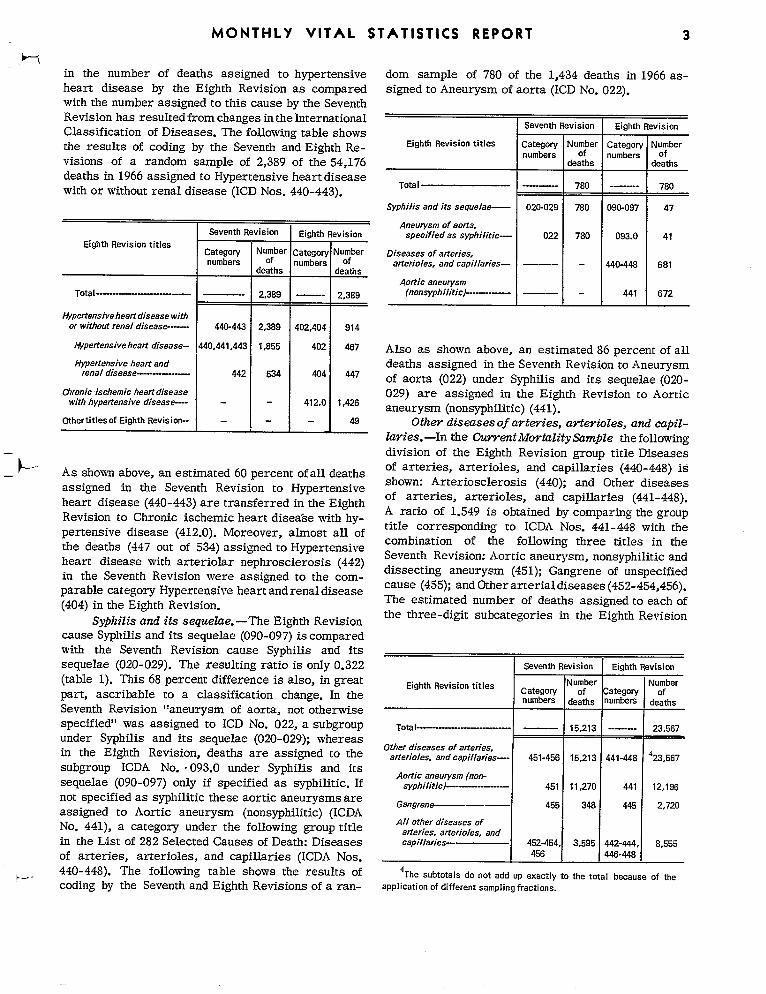
Hypertensive heart disease. - The Eighth Re-vision cause Hypertensive heart disease with or with-out renal disease (402, 404) is compared with the Seventh Revision cause Hypertensive heart disease (440-443), with a resulting ratio of 0.398 (table 1). All but a negligible part of this 60-percent reduction
3The “Rules for Selection of Causes of Death for Primary Mor
tality Tabulation” used with tbe S%enth Revision are shown in Manual of the International Statistical Class +ficatian of Diseases, Fnjuries, and Caus ee of Death, Vol. I. World Health Organization,
1957, pp.859-371. *
-----
MONTHLY VITAL STATISTICS REPORT 3 —
b-, in the number of deaths assigned to hypertensive dom sample of 780 of the 1,434 deaths in 1966 as-heart disease by the Eighth Revision as compared signed to Aneurysm of aorta (ICD No. 022).with the number assigned to this cause by the SeventhRevision has resulted from changes in the International
Seventh IWision Eighth RevisionClassification of Diseases. The following table showsthe
numbers of numbers of visions of a random sample of 2,389 of the 54,176 Ieaths
deaths in 1966 assigned to Hypertensive with or without renal disease (ICD Nos.
heart disease 440-443).
Total — 780 _ 780
Syphilis and its sequela- 020-029 780 090-097 47
Seventh Revision Eighth Revision Aneurysm of aorta,
specified as syphilitic— 022 780 093.0 41
results of coding by the Seventh and Eighth Re- Eighth Revision titles Category Iumbe[ Category Wmber
Eighth Revision titles Category Numbel dumber Diseases of arteries, numbers of lumbers of arterioles, and capillaries— — 440-448 681
deaths deaths Aortic aneurysm
Total -————--- 2,389 2,388 (nonsyphilitic)— 441 672
/+pertensiveheart disease with or without renal disease—— 440-443 2,389 102,404 914
t&pertensiveheart disease- 140,441,443 1,855 402 4s7 Also as shown above, an estimated 86 percent of all Hypertensive heart and deaths assigned in the Seventh Revision-to Aneurysm
renal disease--—---— 442 534 404 447 of aorta (022) under Syphilis and its sequelae (020-CYuonicischemic heart disease 029) are assigned in the Eighth Revision to Aortic
with hypertensive disease-— 412.0 1,428 aneurysm (nonsyphilitic) (441). other titles of Eighth Revision-- — 49 Othw diseases of artwies, artas”oles, and capil-
kzyies. —In the CwYent Mo$zkzlitySample the following — division of the Eighth Revision group title Diseases
_ 1-’- As shown above, an estimated 60 percent of all deaths of arteries, arterioles, and capillaries (440-448) is
assigned in the Seventh Revision to Hypertensive shown: Arteriosclerosis (440); and Other diseases of arteries, arterioles, and capillaries (441-448).
heart disease (440-443) are transferred in the Eighth A ratio of 1,549 is obtained by comparing the group
Revision to Chronic ischemic heart disea~e with hy-title corresponding to ICDA Nos. 441-448 with the
pertensive disease (412.0). Moreover, almost all of combination of the following three titles in the
the deaths (447 out of 534) assigned to Hypertensive Seventh Revision: Aortic aneurysm, nonsyphilitic and
heart disease with arteriolar nephrosclerosis (442) dissecting aneurysm (451); Gangrene of unspecified
in the Seventh Revision were assigned to the comparable category Hypertensive heart and renal disease
cause (455); and Other arterial diseases (452-454,456).
(404) in the Eighth Revision. The estimated number of deaths assigned to each of the three-digit subcategories in the Eighth Revision
Syphilis and its sequeZae.-The Eighth Revision cause Syphilis and its sequelae (090-097) is compared with the Seventh Revision cause Syphilis and its
Revision Eighth Revisionsequelae (020-029). The resulting ratio is only 0.322 1SeventhNumber Number(table 1). This 68 percent difference is also, in great Eighth Revision titles Category of Category IJfpart, ascribable to a classification change. In the
numbers deaths numbers deaths Seventh Revision “aneurysm of aorta, not otherwise specified” was assigned to ICD No. 022, a subgroup TotaI — 15,213 -—— 23,567
under Syphilis and its sequelae (020-029); whereas Other diseases of arteries,
in the Eighth Revision, deaths are assigned to the arterioles. and capilla/ies.- 451-456 15,213 1 441-448 423,567
subgroup ICDA No. .093.0 under Syphilis and its Aortic aneurysm (non
sequelae (090-097) only if specified as syphilitic. If syphiIifiic)—— 451 11,270 441 12,196
not specified as syphilitic these aortic aneurysms are Gangrena—--———— 455 346 445 2,izo
assigned to Aortic aneurysm (nonsyphilitic) (ICDA All other diseases of
No. 441), a category under the following group title arteries, arterioles, and in the List of 282 Selected Causes of Death: Diseases capillaries 452-454, 3.595 442-444, 8,555
of arteries, arterioles, and capillaries (ICDA Nos. / 456 [ 446-448
440-448). The following table shows the results of 4The subtotals do not add up exectl y to the tota I because of the~- -coding by the Seventh and Eighth Revisions of a ran- application of different sampling fractions.
4 MONTHLY VITAL STATISTICS REPORT
under 441-448 together with the estimated number of Use of Ratios as Revision Factors
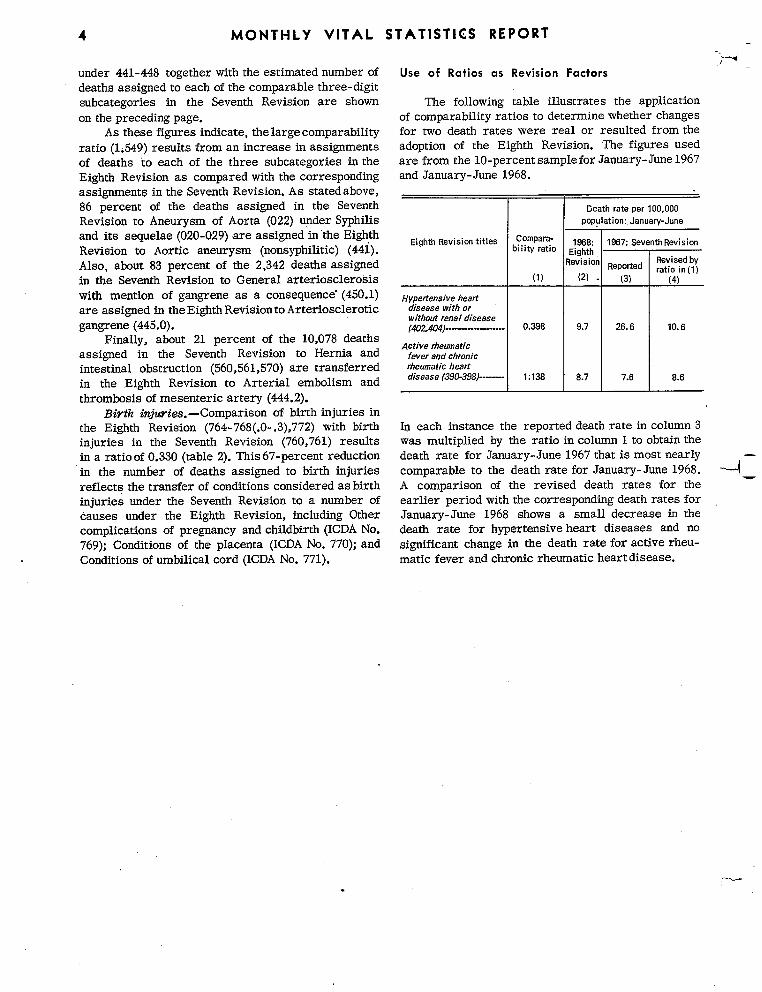
deaths assigned to each of the comparable three-digit subcategories in the Seventh Revision are shown The following table illustrates the application on the preceding page. of comparability ratios to determine whether changes
As these figures indicate, the large comparability for two death rates were real or resulted from the
ratio (1.549) results from an increase in assignments adoption of the Eighth Revision. The figures used
of deaths to each of the three subcategories in the are from the 10-percent sample for January- June 1967 Eighth Revision as compared with the corresponding and January- June 1968.
assignments in the Seventh Revision. -I% stated above, 86 percent of the deaths assigned in the Seventh Death rate per 100,000
Revision to Aneurysm of Aorta (022) under Syphilis popuIation:. January-June
and its sequelae (020-029) are assigned in ‘tie Eighth Eighth Revision titles Compara- 1868 1967: SeventhReviaion
Revision to Aortic aneurysm (nonsyphilitic) (441). bility ratio iighth Revised byAlso,
in the Seventh Revision to General arteriosclerosis (1) (2) . (3) (4)
with mention of gangrene as a consequence” (450.1) Hypertensive heart are assigned in the Eighth Revision to Arteriosclerotic gangrene (445.0).
disease with or without renal disease (402,404)------------ 0.398 +9.7 26.6 10.6
Finally, about 21 percent of the 10,078 deaths Active rheumatic
assigned in the Seventh Revision to Hernia and fever aod chronic
about 83 percent of the 2,342 deaths assigned evision Reported ratio in(l)
intestinal obstruction (560,561 ,570) are transferred rheumatic heart 8.7in the Eighth Revision to Arterial embolism and
disease [390-398)----- 1:138 1 7.6 8.6
thrombosis of mesenteric artery (444.2). Birth [email protected] of birth injuries in
the Eighth Revision (764- 768(.0- .3),772) with birth In each instance the reported death rate in column 3 injuries in the Seventh Revision (760,761) results was multiplied by the ratio in column 1 to obtain the in a ratio of 0.330 (table 2). This 67-percent reduction death rate for January-June 1967 that is most nearly in the number of deaths assigned to birth injuries comparable to the death rate for January-June 1968. 4: reflect: the transfer of conditions considered as birth A comparison of the revised death rates for the injuries under the Seventh Revision to a number of ear~er periodwith the corresponding death rates for
causes under the Eighth Revision, including Other January- June 1968 shows a small decrease irt the complications of pregnancy and childbirth (ICDA No. death rate for hypertensive heart diseases and no 769); Conditions of the placenta (ICDA No. 770); and significant change in the death rate for active rheu-Conditions of umbilical cord (ICDA No. 771). matic fever and chronic rheumatic heart disease.
------------------------------------------------------
--------------------------------------------
-------------------------------
----------------------------
--------------------------------------------------------------------
---------------------------------------------
--------------------------------------------------
------------------------------------------------------------------------------------------------
------------------
------------------------------------------
-----------------------------------------------------------------------------------
-----------------------------------------------------------------------------------------------
-------------------------
--------------------------------------------
---------------------------------------------------------
----------------
-------- ----
----------------------------------------------------------------------
-------------------------------------------------
-----------------------------------------------------------------
---------------------------------------------------------------------------
-----------------------------------------------------
-----------------------------------------------------
-------------------
------------------------------------------------
1 --------------------------------2345 -----------------------------------67 -------8
MONTHLY VITAL STATISTICS REPORT
H Table A. HL3T OF COMFARASIE CA7!SOOSY NUWB2& “ FOR SELECTED CAUSES OF DSATS ACCORD~G ‘iOTBE SISET3 AND E YENTS KSVZSI02i$AND SIZ3 OF SAMPLS REQU.IRSOFOP,S2-
L8CTE0 CASSES BY m GEWNTB REVISION: FOR 2.212iTBJXWTAL S-29 Y22CS REFURT AND ANRUAL :LhSMRYOF PR3VL?ZONAI,STATISTICS
Z62mMr of 6eaths in Number ofCategwynumber= Category numhem .966 (final ieaths re-
accor6ing to the 13cColwng to tie count), by quired inLict title according to the Eighth Revision of the Eighth Retision, 3.967 seventh Re.zklion, 1955 ~heSeventh sampleStrat
International Classification of mseases, 1.S67Revision
(1) (2) (3) (4)
-—----------------All cauces 1,S63,14S 95,16a
1 nteritfs and other 05.arrhealdiseases------------------------------ 108,009 571,764 3,33E 1,429 2 uberculosis, all fore-------------------------—------------------- ,10-019 CQ1-019 7,625 1,863 3 @ilis and its Gequeke 190-097 020-02s 2,195 1,168 4 ther infective and parasitic diseases Iemimler of OCO-156 0?0-138 7,496 1,875
~mmt neop~=m, 3nclu6ing neoplww of Iympbatic WI hemtopeietic tismcs ------------------------------------------- ,40-209 140-205 & aaoiti.
5 NlaW3mmt neoplasm of buccal ca-cwy mnd ~------------.-----... ,40-149 140-14s 6,WC 1,62S 6 hk.lignantneoplmm of digestive organs and peritoneum-------------- ,W-13S 130-156A,257-159 95,079 2,436
M2-@mat neopkm of re8ptrat0ry Wstem ,60-163 160-164 54,934 2,391 ; 24di@ent neoplam of bre=t.- ....-------------------.--..--— ,74 170 27,533 2.292 9 3@2iwt neop~sm of genital ohms RO-187 171-179 40,37E 2;334
10 mmt neoplasm of urinary orbs )38.1s9 180,12J. 14,166 2,125 3.I. M312gmnt neoplzzm or all other F@ unspecified sites--------------- ,70:173,160.2s3 156B,165,1%199 35,032 2,333 2.s Leukemia and ti_a 04-207 204 14,012 2,121 13 Other neoplasm of lymphatic and hematopietic tiscuos-------------- 00-203,209,209 220-203,205 15,202 2,159 14 nrizD neoplasm and neoplams or unsmcif led nature----------------- 10-239 210-239 4,923 1.658 2.3 kbetes m~Ws w 220 34.597 2;332 16 17 ?ti@tis
80-285 -20
260-293 340
3;432 2,324
1,45C 1,204
ijorcartiovasculnr Msea5es 90-448 3SJJ-334,4m.436 y addition:
ml,
DiGease3 of heti ------------------------------------------------ 2Q-398,402,404,410.429 420443 y addition: 1s Active rheumatic tever and chromic rheumatic heart Disease 90-39s 6%402, 410-416 13,01s 2,143
heart 6fcease with or wlthoxt renal disease 02,404 440>442+42,443 34,176 2,389 20 Icchemic heart tiGease 1o-414 420,422.1 S23,1S6 2,490 21 Cbrmic disease of enbcertium 8M other w0car6f.sl insufficiemy- 24,4S8 121,422.0,422.2 32,646 2,056 22 A21 other fom of hmrt Unease— 204S3,42S-427, 4S9 2?0-434 31,042 2,314 23 wtien5i.n 02,401,403 444-447 U,Sal 2;0S0 24 Cerebmvasculfm Useane 30-43s 330-334 204.&l 2,470 25 M*OsclerOsis 40 EO 59;907 2,349 26 Other Siceases of arteries,arteriolm, 8u6 capi-es 41-446 ELI-436 15,213 2,147 27 !utebroncbitis and bruncbiolltis--------..----------— 66 m 987 708
Lflwnza mdmewtia 70-474,4204e6 m.423,490493, 7s3 y addition: 28 Mluaz*---------------------------------------------------------- 70-474 L20-4S3 2,2S3 1,327 29 We-b 60-486 L90-493,763 63,262 2,405
emphysem, and maw-------------------------------------S-Cl,54E,527.1,241 y ad62tim:
19 Z&rp.2rtensive
Wnchitis, 90-49332 L?hlVtiC mdm~tibmnatis-. --—-----...-— 90,491 331,302 5,164 1.6S4
.------------------------------------------------------ 92 527.1 S9,232 2;22532. 2mPhlwen!a1--- 32 93 242 4,324 1,524 33 !ptic tice>----------------------------------------------------- X-333 MO.541 10,3s1 2,0L3 34 xnfa and intestinal obstmction. .....----------...----— S9-553,560 560;5El,570 10,078 2,003 33 miwsis of Mwr------------------------------------------------- n ML 26,fi92 2,286 55 iolelitbiasis,cholecystiti~ and ti~tis 74,575 564,5S5 4,592 1,619 37 c+britisend n_si 30-584 SS-534 21,540 2,055 3a tections of Htiw---...---------._ ....--------..---— 60 100 9,49s 1,9S0
W?pz.asmof pmatate m S.o 3,s17 1.407 : I?lsmitalmMMes Z-759 154-759 18,158 2;187 41 xtain cawes of rm-tality In mrzy tidy--— 50-’769.2,769.4-772, EO-762,765-776 4s,917 2,378
774.778 42 43
Yq2toms and CLhWined contitlom U other tiseases
WL796 Iesimal
760-795 Ey subtraction:
23,9EC 23,838
2,264 2,429
cci6entc XO.E349 E3X!-E362 lyaAd2tion: 44 Mctor vehicle *ci@t8-----—...--- .......__-----.-..--—_ 2Llo-2e23 Z810-lms 65,042 2,3S7 43 AU other wcitit~------------------------------------------- ZWJ-IX37,EZ25-2349 2xa.3?3C2,2240-Pm S0,522 2,401 46 ulcMe——— SSQ-E359 SS63,E370-3S79 sl,2sl 2.237 47 omiciAe-..---------------------------------------------------- %o-m7a 23S4,E362J-E3M 22,606 2;057
Z.1other external CWe8------------------------------------------- 980-2365 49 ~w~tite-edwhcth=acclmnu or _sely inflict.@-.. %2-2989 49 ZmrY 1’csllMJn6fr0!nOPsr ations Oh m----— 9S0-E399 E3W.ES99,3965 74 74
%ls is a new categmy according to the 3ighth RmLsion. Sased on a random eample of.195 deaths assigned to UI16 new Categoxy, It Inclutis term vMchwere classified in the Seventh Rcwkion pr2mri2y vinier26W-3S62 “AcciAents,” 76 kaths; and under W63,E370-2P73 “suicide,’,120 deaths. me rmmining Eof the 195 &athn were 6istribute6 over hmidie and other categories or the S@th R.wision.
‘lhbleB. LIST OF CCM7’AR482ECATE30RY ~ 4tlRSSIWTEO CAOSESOF INPASTDIW!71ACC09DISG ‘R3~STOBTSAND ~, .RWISI02ii,A2UIS2SS OF SA24WiSREQ-RIRB3LBXBS CAUS2SBYTE2 SSVEWFS R3USI02i: FOR 24mrEUvImL sTAmSmcs REmRT Am A7muALm#L4RY OF FROK2SICWAL SL4TISTISS
Strata List title accorstng to the 3Zghth Revision of the Cate@zy numbers Category numbers Number of Number of
tiaths re-Intermtioml C2.8ssific.ationof Mseases, 1.967
according ta the acmrdiilg to the deaths In wired inEi@tth Rev7Lsicm,1.967 Seventh Revision, 2S55 1666 (final)==@e
All cwsen . . . . . . . . . . . . . . . . . . . 85,526 15,357_______________
Cert4n gastroj.utestinaltisemes oQ4,wS-Ca9,535, 5s2,363 043-04s,543,5n,572,7s4 1,64S 993 Influenza end pnmmonlm -------------------------------------------., 470-474,@0466 4247463,4%493,7s5 9,43s 1,977 COngmitd encnmlies------------------------------------------ 740-736 730-759 ls,zw 2,075 31rth IML-Ies -------------------—------------------———- 7S47E8(.O-.3),772 7so,761 1,0s% 1>64s ~--@f newborn, uMpccifiea 776.9 762 23,832 2,120
~e4--------------------------------------- 777 776 X5,228 2,103 Other 4imases of earzy maw. -.....----.-_.--—-— All other causes (resfm)-------------------------------
Remb6er 0.?7SJJ-77P 7S5-774 @ &*==*ion: m subtraction,
14,W8 2,233
Tutal ti strata 1-7 !WkL minus strata l-l 23,331 2,206
‘Assumes the v82ue of 773 wUI be zero.
--------------------------------------
------------------------------------------------
-----------------------------------------------------------
------------------------------------------------------------------------------------ ------------- --------
-----------------------------------------------------
6 MONTHLY VITAL STATISTICS REPORT
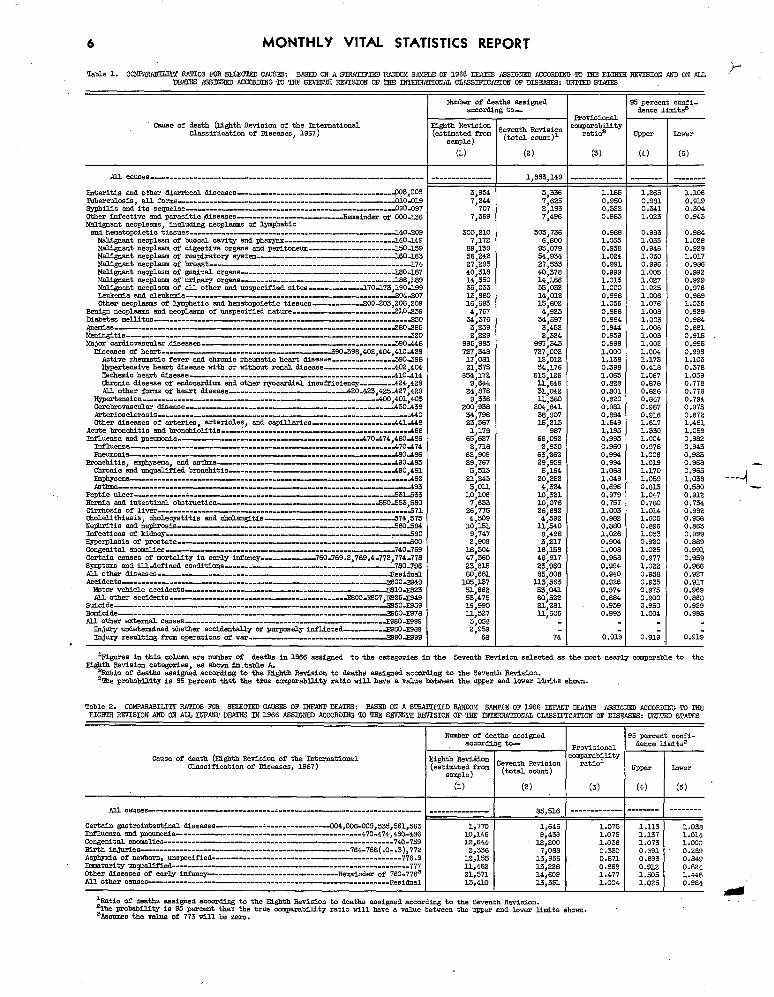
!Iable 1. COl@APMIZIIW FATIOS lWR SFLWX!RD CAU3F.S: BAWD ON A STRA’K2WED RAiWCM S&?lLE OF 19S6 D12Al?lS ,Y-
A2SIGNSD ACCORO~G lW ZEE EIGSTd F32V2SIW NOI ON &LDEAllSSASSIGIEO ACC~~ TO THE SEWNTS -Ioil OE TEE INl!EfWATIONALCLA?33FICAlTON OF D16SA%9 : ~~ ST-
Numb6r of deaths assigaed )5percent confiaccording to-- dence limitss
PrOvim.onal
Cm=e Of death (I?QhthRevision of the Intem8ti0n93 Q&A Revision ,eventh Ra%3i0n,mparability ication of 33.sew7es,1967) [est$=) from (totil Countp ratio= upper LowerC3.easif
(1) (2) (3) (4) (5)
1,8s3,149
~*efit~s =a D~= ~=rhe~ ~eeaSes-------------------------------------W8.oo9 3,934 3.336 1.1s5 1.265 1 .10sTuberculosis, fOm.----.-------_---. ---------_ --..------.----.----.-.-dlOOl9 7,244 7;625 0.s50 0.s’61 0.919dl Syphilis end its sequ~ae-------.------.-----..-----.------------------.O9O097 707 2,193 0.322 0.341 0.304 Other infective and parasitic !tisewes-.—----. -------—-----a-iner of 000-3.36 7,3s9 7,496 0.9s3 1.023 0.943Malignant neoplasms, including neoplczmnsof lymphaticand hematopoietic tissues.------------.-.-----.------.-------------...-----J4O=O9 300,210 303,736 0.988 0.993 0.924 Malignant neoplasm of buccel cavity and Ph_.--.-_--..-----------.---J4OJ49 7,172 6,S00 1.055 1.053 1.02s ~W~* neOPlmm Of digestive organs and peritoneum--..-----------..---fioas s9,139 S5, 079 0.938 0.94s 0.SZ9 [email protected] of respiratory eptm-——------.-------.---------.d6Od63 56,242 34,934 1.024 1.030 1.017 t@i&2EUlt l190phlSMof breast---.------..----.--.----.-.---.-..------.-.---...-a74 27,293 27,533 0.991 0.996 0.986 Naliwent neoplasm of setitd orgens.-..------..------.------.------.-----J80~7 40,318 40,378 0.9s9 1.005 0.99Z Ma7.Wmnt neoplwm of”urinary Org=...----.------.--. -----.----_ .---_-. J28,lsg 14,350 14,166 1.03.3 1.027 0.999 Melignent neoplasm of @Jl other and unspecified sites--—-. -.---..A70J73,1soA99 35,033 35,032 1.000 1.025 0.97s Leukni. end ~*da-----.._----..----- ....--_. -.----..-------.--_...&O4 ..207 13,9Bo 14,012 0.9ss 1.006 0.9s9 Other neopl.amrmof lymphatic and hematopoietic ti8sues------------LOO2O3,2O8,2O9 1S,683 13,aoz 1 .05s 1.076 1.035
Senign neoplasma ml neoplasw of unspecified natwe..----.----------...--2lOz3s 4,767 4,S23 0.966 1.00s 0.s2s Diabetes _tm---.-------. -.----.------. -.----..------------. ---------..a5o 34,376 34,5s7 0.s94 1,003 0.924
3,25S 3,452 0.944 1.008 0.881
3$330S cerdiowsd.ex .tiseww..-----..--------------...---.-.------------.39O&6 2.229
SS5;9J35 2.324
997;343 0.939 o.sa9
1.003 1.002
0.93.3 0.995
Diseasee of he*---.-----.----. -..-----..----..--- ....49OS98.4OZ.4W,4lOAZ9 7z7,34a 727,002 1.000 1.004 0.9S6 Active rheumatic fever aud chronic rheumatic heart 6i8ea8e.___-__.-SSO3J96 17joal 15,01s 1.13s 1.173 1.103 Hypertensive heart disease with or wtthcmt reml tisexe----------.-.---.4oz,4w Z1,375 54,17a o.39a 0 .41s 0 .37a Ischemic heart Use=e..._----.---------..-----.-.-_--------------..-.-4lOAl4 654,172 616,1ZS 1.063 1.067 1.05s C3rvnic dieezse of endocer6ium and other mymcard.id. imWicienq__--.A24,4Z8 9,644 ll,s46 o.aza 0.s78 0.776 U other form of heart tisease----.-------...--...----..-..AZOAZ3,4z5AZ7,429 Z4,876 31,04Z o.aol O.SZ6 0.77s
[email protected]_-..-.-_-..-_-.---_--.--------------.--.AW,4Ol,4O3 9,33a n,3ao o.azo 0.647 0.794 Cerebrova8culzrti8eme-.-----.------.. -.-----..----.-..---._---_. -A3O&3S 200.938 ZO.4,S41 0.961 o.9a7 0.s75
34;7a6 3s,s07 0.894 0.916 o.a7z Other diseases of m’teriea, Cc’tetioles,and capUtiee--.------------.--&la6 23,367 1.5,z13 1.549 1.617 1.4al
Acute bronchitis 8n6 bromchfolitis--...:------.-..--.-----...----------.. -..-..4ss 1,179 9a7 1.193 1.330 1.05a Inf3.ueniaaridpne-tia----..------.------..-_---.-.---.--..---.-.470A74,4a0486 65,6Z7 6S,09Z 0.993 1.004 0.9S2 Influenza-------------------------------------------------------------- A70A74 2,718 z,a30 0.960 o.97a 0.s43 mewnia .---....----.-.----...---..40 -4as 62,906 63,z62 0.994 1,006 0.923
LTondlitis, ‘?mphY2%na,8na as---—. -----_------... --_.. --_-...---.. A9o493 29,767 Z9,959 0.994 l.ola 0.960chronic =dwqWified bron&itis...----_.------_.-----....-_--..---..49O.49l 5,513 5,164 1.06S 1.170 0.963
Z1,243 20,z5z 1.04s 1.059 1,038 - ----4 3,011 4,324 0.696 0.613 o.5ao
peptic fiber...-----....-.--...._-- .....----...-_--..._---...----_.---...S3lS3 10,106 10,3Z1 0.s79 1.047 o. a12 Hernfa and intestinal obstmdion--_.--_ --.....---....-_--..----_.--SOA33 .56O 7,633 10,07s 0.757 0.760 0.734 Sirrhcmis 0? liver--------.------..-----_ -----.-.---_.. ----.------..--- ....37l 2a,775 Z6,69Z 1.003 1.014 0.S92 Oholelithiasis,cholecystitie and &Olwitie_.-...---...--. --.-.-.--...-...374,573 4,509 4,39Z 0 .9az 1.005 o .95a Ne@ri’ciB =dnewsie.-.------ ....---....------..-.-..-.._ --..-_--. -..3W3W 10J61 IL,340 o .a60 o.aa6 o .a63 Infections 02 u&ey.----...---.-...---..-..---..-.--_-.._---...----...-_,...3ao 9,747 9,498 1.0Z6 1.053 0.999 R3wwluia Ofpnetate.------ ....---.--------....--.-.----.-.-----_----..._-.Aoo Z,909 3,z17 0.904 0.s20 0 .as9 COngenitel anomeliee --....740-759 L5>304 la,3.3s 1.006 1.0Z3 o .a91 Certain causeB of mortelity in early in28my.--_ ...._.7690.769. Z47772.17427784.778 47.360 46,S17 0.9ss 0.977 0.959 Symptom and WLdefik?d contitim-..--L- ....---.....---...---...----..7SO.796 23jJ16 23,960 0.994 1.OZZ 0.966 All oth.a-tiBe=es---...------.---- ....------------.-..-----..------.--.ae8idti So,ssl e5,aoa 0.s40 O ,s56 0.9Z7 .kcidente Jlsoo*9 105,I.37 lL3,563 o.az6 0.935 0.917 I&or vehicle accidents--.-----... ----...----. ------_--... ---...~lO~3 51,6az 33,041 0.974 0.975 0.969 U other acci&nts----------------_-----..-----_-----..a00mO7,~Z5SS 53,475 ao)3zz o.as4 0.900 o.a6a
stici&-----------. ------.-.-----..-..---.-----.-------..----.-----.-...a5o .Z959 19,990 21.,ZS1 0.939 0.950 0.s29 [email protected]._...-..._-.--..-.-S6Oa7a 11,527 3.l,ao6 o.a93 1.G04 0.963 Ql other external cau8es-------------..-----.--.------.-------.------.---m6OSsa 3,05s . -
InWrYund=’cemined vhether accidentally or purposely infl.ioted-_-_-_J?S60 JiSa9 2.959 -In@ryresulting frOm OperatiO~ Of.m---- ....---....--—-..-- .....~9oasa ‘ 66 74 0.919 0.91; 0 .91; . +igures in this colwnn exe nranberof deaths in laaa assigaed to the Categories in the Seventh Sevisior,eaectd as the nmtnearly Compwable to the
12@th R~Bion categories, w ehmm In,t&ble A.‘Ratio of dea~s assisne6 accOr’6ingto tie 21gbth Revision to deaths amisn~ acwr6ing to the Swenth Rwkion.35e probability iB S5 Cercent that the Wue comparabilityr8ti0 - have a Va7.Uebetween the uPPer and lower tits shown.
Table 2. COl&AYJSILriYRATIOS FOR SELECTED CAcmS OF INF.4tTlDEA3312: S.49EDON A STRATIFIES RAND3M SMIU OF 1966 ZNFANT DEATS2 AWIGN7AC ACCORDING TO ‘TIDEIGRTS R7XL510N ANO ON Am 17SWdiTD!L41!RSIN 1968 .43S1- ACCOSDING TO ‘TE3SSWN!CZ RSVISION OF ~ INTSRNA~ONAL CLWSIFICA’7110NOF DISSASES: UNITED STATES
Number of deaths assigned 95 percent mnfiaccordins tO- &nce lmlitez
Provisional
Cause of 6.eath(Eighth Revision of the International Ei&*h Refi.4i0n $ev=t~ Re,/jBi~~comparability
raticJClaBrIiflcatiOnof DiEeaseB, 1S67) (“ty:l:)fr”” (total count) uPP@r Lower
I (1) I (2) I (3) I (4) (5) “
All caseB 85,51s t
Certain s8stmtitest~l ~8eases..----------L----.------.----OO4,OO64O9,535,36l,563 1,770 1,646 1.075 1.113 1.03a Influmlz8 =d WmWtia---.-------------..----..-.-------------------47O.474,48O-486 10,146 S,438 1.073 1.137 1.014 Congenital m0mlies.--------.---------------------------.-----------.------.7@-75a 12,644 12,Zoo 1.036 1.073 1.000 Birth tijties 784-766(.0-.3),772 Z,336 7,08a 0.330 0.391 o.2a9 Asphyxia of newboxm, mnwcWied-.-----. -------------...------...-----..-.---.-.77S.9 1Z,155 13,956 0.s71 o.a93 o.a49 Immaturity w@fied-----------------. -------------.-------------.------.-..----777 IJ.,462 13,22a 0.668 0 .91Z 0.624Other 6fS.5L7SC?Bof early itim~---..-----.----. -----.-.---.---..Rti&r of 760.77Ss Z1,S71 3.4,60a 1.477 1.503 1.44aAll other CaUnes----------------------------------------------.----------.---Resiti8l 13,410 13,351 1.004 1.035 0.984
d — ‘Ratio of deaths assi~ed acmrUnS to the Eighth Revision to dm.ths ami~ed according to the SkVenth Revision.%e probability in 95 percent that the true cmperability ratio till have a value between the upper and lower limits mhmm.‘Assures the value of 773 till be zero.
MONTHLY VITAL STATISTICS REPORT 7
APPENDIX
BRIEF SUMMA OF STATISTICAL DESIGN 11
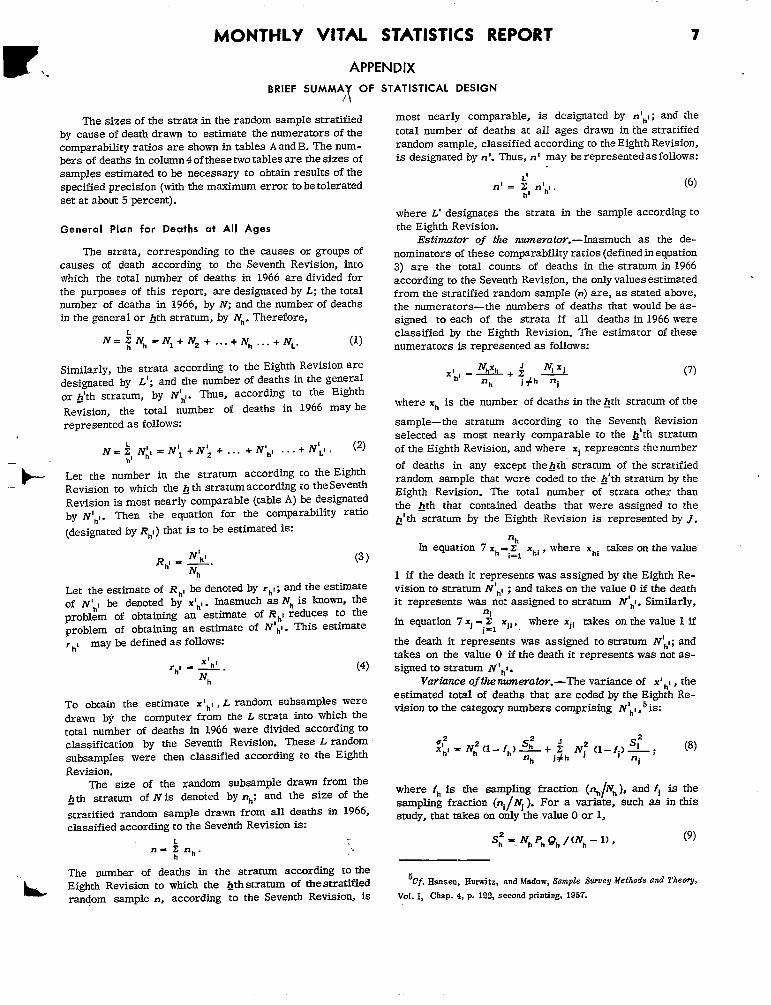
The sizes of the strata in the random sample stratified by cause of death drawn to estimate the numerators of the comparability ratios are shown in tables A and B. The numbers of deaths in column 4 of these two tables are the sizes of
samples estimated to be necessary to obtain results of the specified precision (with the maximum error to be tolerated set at about 5 percent).
General Plan far Deaths at All Ages
The strata, corresponding to the causes or groups of causes of death according to the Seventh Revision, into which the total number of deaths in 1966 are divided for the purposes of this report, are designated by L; the total number of deaths in 1966, by W, and the number of deaths in the general or &th stratum, by N~. Therefore,
N=~Nh=Nl +N2+... +N+ ...+ N~. (I)
Similarly, the strata according to the Eighth Revision are designated by L’; and tbe number of deaths in the general or h’th stratum, by N’h,. Thus, according to the Eighth
Re~ision, the total number of ‘eaths ‘n 1966 ‘nay be represented as follows:
N=:, N:,=N; +N; +... +hIhI.-.+N’L’, (2)
- ~ Let the number in the stratum according to the Eighth — Revision to which the ~ th stratum according to the Seventh
Revision is most nearly comparable (table A) be designated by N’hi. Then the equation for the comparability ratio
(designated by R,I) that is to be estimated is:
R,, =$. (3)
h
Let the estimate of Rh, be denoted by rh,; end the estimate of N’h, be denoted by X’h,. Inasmuch as Nh is known, the
problem of obtaining an estimate of I?hI reduces to the problem of obtaining an estimate of N ~1. This estimate r hI may be defined as follows:
X’h, (4)rht. —. Nh
To obtain the estimate x ‘h,, L random subsamples were drawn by the computer from the L strata into which the total number of deaths in 1966 were divided according to classification by the Seventh Revision. These L random subsamples were then classified according m the Eighth Revision.
The size of the random subsample drawn from the ~ tb stratum of N is denoted by nh; and the size of the
stratified random sample drawn from all deaths in 1966, classified according to the Seventh Revision is:
L n-~nh.
The number of deaths in the stratum according to the ~ Eighth Revision to which the @hstratum of fiesmafied
random sample n, according to the Seventh Revision, is
most nearly comparable, is designated by n ‘hI; and tie total number of deaths at all ages drawn in the stratified random sample, classified according to the Eighth Revision, is designated by n‘. Thus, n‘ may be represented as follows:
L’ nl = 2~] n!hl. (6)
where L’ designates the strata in the sample according to the Eighth Revision.
Estimatur of the numevati.-Inasmuch as the de-nominators of these comparability ratios (defined in equation 3) are the total counts of deaths in the stratum in 1966 according to the Seventh Revision, the only values estimated from the stratified random sample (n) are, as stated above, the numerators—the numbers of deaths that would be as-signed to each of the strata if all deaths in 1966 were classified by the Eighth Revision. The estimator of these numerators is represented as follows:
~lh, =4’ilztL+i N, Xl (7)
‘h j#h n,
where Xh is tlte number of deaths in the @h stratum of the
sample—the stratum according to the Seventh Revision selected as most nearly comparable to the h’th stratum of the Eighth Revision, and where Xi represents the number
of deaths in any except the ~th” stratum of the stratified random sample that were coded to the &’th stratum by the Eighth Revision. The total number of strata other than the @h that contained deaths that were assigned to the ~’ th stratum by the Eighth Revision is represented by J.
In equation 7 Xh -~1 Xhi, where Xhi takes on the value
1 if the death it represents was assigned by the Eighth Re-vision to stratum N’ht ; and takes on the value O if the death it represents was not assigned to stratum N’hI. Similarly,
nJin equation 7 XJ= Z~=1 ‘ii ~ where Xjl takes on the value 1 if
the death it represents was assigned to stratum N\I; and takes on the value O if the death it represents was not as-signed to stratum N’hI.
Varhce of the numeratw.-The variance of X’ hi, the estimated total of deaths that are coded by the Eighth Re-vision to the category numbers comprising N\I, 5 is:
2 ~hI = N: (1- fh) _‘: +Jjh N; (l- fj)~;
s; (8) ‘h
where fh is the sampling fraction (nh/Nh ), ~d f] is the Samphg fraction (n,/Ni ). For a variate, such aS in this
study, that takes on only the value O or 1,
S; = NhPh Qh/(Nh– l), (9)
5i?f. Hansen, Hurwitz, and Madow, Sample Surrey Method~ and Theo%
VOI. I, Chap. 4, p. 122, second printing, 1957.
. . .
1 8 MONTHLY VITAL S“~ATISTICS REPORT 1<
I . . { .,,.i
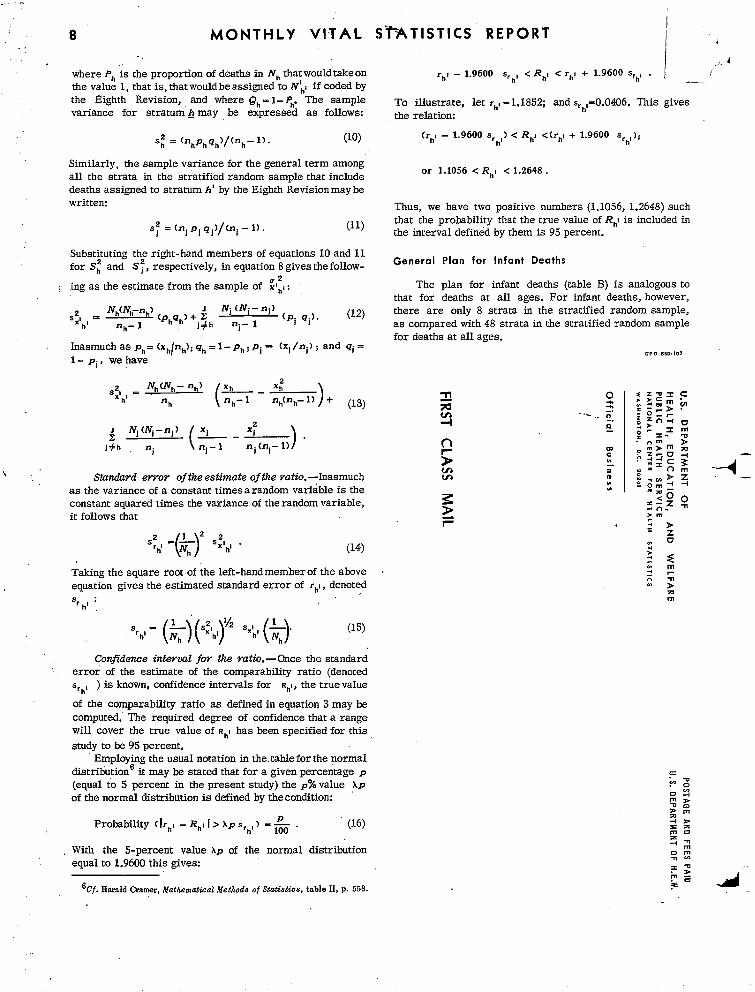
where P, is the proportion of deaths in N~ that would take on rhl - 1.9600 Srhl < RhI c rh! + 1.9600 s,ht . 1___ the value 1, that is, that would he assigned to N\i if coded by the Eighth Revision, and where Qh= 1– Ph. The sample To illustrate, let rh, = 1.1852; and s,b,-0.0406. This gives variance for stratum’ ~ may he expressed as follows: the relation:
s: = (rshphqh)/(rsh (lo) (rhI – 1.9600 s, ,) c RhI <(rh, + 1.9600 srhl);- 1) . h
Similarly, the sample variance for the general term among or 1.1056 < RhI <1.2648.
all the strata in the stratified random sample that include deaths assigned to stratum h’ by the Eighth Revision may be writ teru Thus, we have two positive numbers (1.1056, 1.2648) such
s; = (n, p, q//(n,– 1) . (11) that the probability that the true value of RhI is included in the interval defined by them is 95 percent.
Substituting the right-hand members of equations 10 and 11 General Plan for Infant Deathsfor S: and S;, respectively, in equation 8 gives the follow
#z : ing as the estimate from the sample of XIhI: The plan for infant deaths (table B) is analogous to
that for deaths at all ages. For infant deaths, however,
5:1 , 5 ‘JNh-nh) (phqh) +j~ J
~ Ni(Ni-nj)
(pi q;). (12) there are only 8 strata in the stratified random sample, h nh— 1 ni - 1 as compared with 48 strata in the stratified random sample
for deaths at all ages.Inasmuch as p~= (xJnh); qh = l–ph; Pi = (xl/n,) ; and ~j =
GPO 880.107
1- pi, we have
S:l , = Nh(Nh– rrh) Xh %?
h ‘h (nh-l nh(rsh- 1) ) + @3)
Nj (Nj-ni ) x, x:—-i I+h r?
( ni-l nl %- 1)
)
\.” Standard errov of the estimate of the ratio. —Inasmuch -4:
as the variance of a constant times a random variable is the constant squared times the variance of the random variable, it follows that
2 122 s rhl - ~ %+hl o (14)() h
Taking the square root of the left-hand mem”ber of the above equation gives the estimated standard error of r~l, denoted
.’ ‘r ~1
“,’- (i)(s:’h’r (15)“’da’ Confidence intend for the s’atio. - Once the standard
error of the estimate of the comparability ratio (denoted s ,h, ) is known, confidence intervals for RhI, the true value
of the comparability ratio as defined in equation 3 may be computed. The required degree of confidence that a range will’ cover the true value of RhI has been specified for this
study to be 95 percent. Employing the usual notation in the table for the normal
distribution it may be stated that for a given percentage p (equal to S percent in the present study) the p% value AP
of the normal distribution is defined by the conditiom
Probability cIrht - RhI I > Ap S,hl ) - & . (16)
With the 5-percent value Xp of the normal distribution equal to 1.9600 this gives:
6Cf4H=ald c~a~~~,Mathematical Methods of st~~s~c.% table’~ p. 558-