Embed Size (px)
Citation preview
TECHNICAL APPENDIX FROM
VITAL STATISTICS OF THE UNITED STATES
2003
NATALITY
U.S. DEPARTMENT OF HEALTH AND HUMAN SERVICES
CENTERS FOR DISEASE CONTROL AND PREVENTION NATIONAL CENTER FOR HEALTH STATISTICS
Hyattsville, Maryland: September 2005
ACKNOWLEDGMENTS
The technical appendix preparation was coordinated by Sharon Kirmeyer in the Division of Vital Statistics (DVS) under the general direction of Joyce A. Martin, Lead Statistician, Reproductive Statistics Branch (RSB), DVS, and Stephanie J. Ventura, Chief of the Reproductive Statistics Branch. The vital statistics computer file on which it is based was prepared by DVS staff.
The Division of Vital Statistics, Charles J. Rothwell, Director, and James A. Weed, Deputy Director, managed the Vital Statistics Cooperative Program, through which the vital registration offices of all States, the District of Columbia, New York City, Puerto Rico, Virgin Islands, Guam, American Samoa, and the Commonwealth of the Northern Mariana Islands provided the data to the National Center for Health Statistics (NCHS). This Division also processed computer edits, designed and programmed the tabulations, reviewed the data, prepared documentation for this publication, and was responsible for receipt and processing of the basic data file. The following management staff provided overall direction: Rajesh Virkar, and Nicholas F. Pace. Important contributors were Judy M. Barnes, Faye Cavalchire, Candace Cosgrove, Linda P. Currin, Connie M. Gentry, Brenda A. Green, Bonita Gross, Brady E. Hamilton, Kathy B. Holiday, Christina K. Jarman, Millie B. Johnson, David W. Justice, Virginia J. Justice, Julia L. Kowaleski, Kryn Krautheim, Annie Liu, Marian MacDorman, T.J. Mathews, Susan L. McBroom, Fay Menacker, Jaleh Mousavi, Martha Munson, Gail Parr, Yashu Patel, Phyllis Powell-Hobgood, Adrienne L. Rouse, Jordan Sacks, Manju Sharma, Steven Steimel, Pam Stephenson, Paul Sutton, George C. Tolson, James G. Williams, and Jiaquan Xu. Thomas D. Dunn reviewed and verified the report.
The Division of Information Services, Margot Palmer, Director and Acting Chief of the Information Design and Publishing Branch, was responsible for publication management and editorial review. Senior Editor was Demarius Miller.
NCHS acknowledges the essential role of the vital registration offices of all States and territories in maintaining the system through which vital statistics data are obtained and their cooperation in providing the information on which this publication is based.
2

For a list of reports published by the National Center for Health Statistics, contact:
Information Dissemination Branch National Center for Health Statistics Centers for Disease Control and Prevention 3311 Toledo Road, Room 5420
Hyattsville, MD 20782 (301) 458–4636 Internet: www.cdc.gov/nchs
3
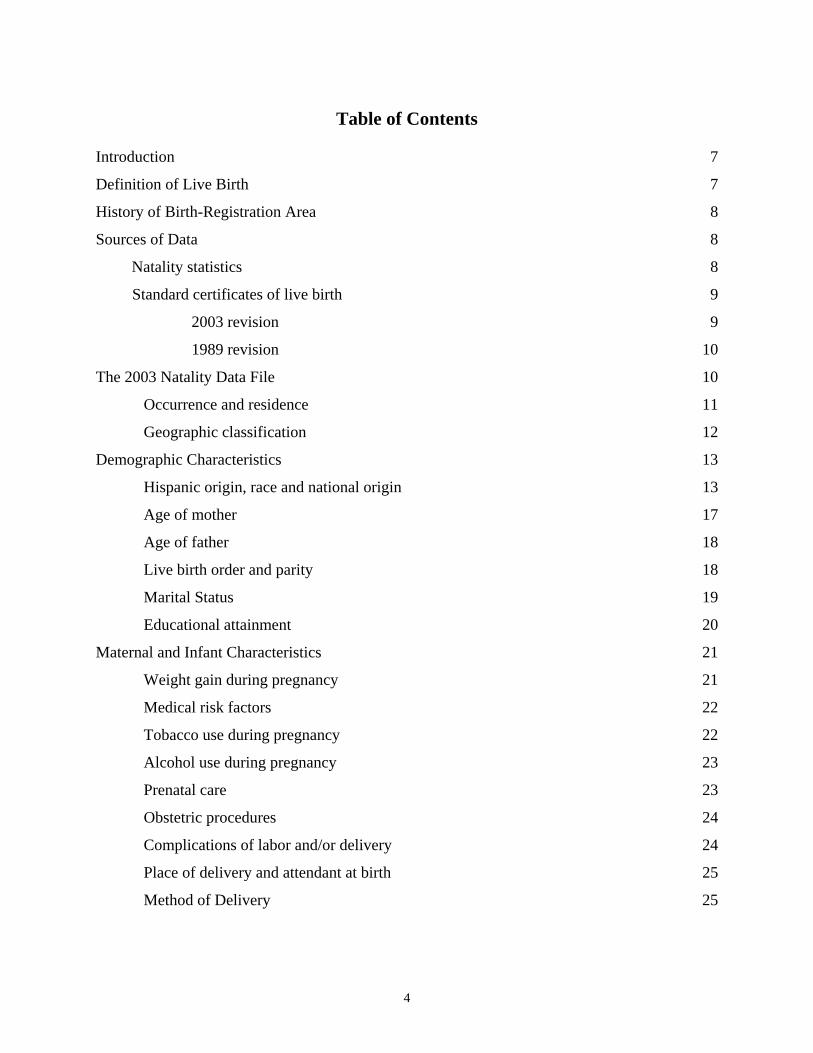
Table of Contents
Introduction 7
Definition of Live Birth 7
History of Birth-Registration Area 8
Sources of Data 8
Natality statistics 8
Standard certificates of live birth 9
2003 revision 9
1989 revision 10
The 2003 Natality Data File 10
Occurrence and residence 11
Geographic classification 12
Demographic Characteristics 13
Hispanic origin, race and national origin 13
Age of mother 17
Age of father 18
Live birth order and parity 18
Marital Status 19
Educational attainment 20
Maternal and Infant Characteristics 21
Weight gain during pregnancy 21
Medical risk factors 22
Tobacco use during pregnancy 22
Alcohol use during pregnancy 23
Prenatal care 23
Obstetric procedures 24
Complications of labor and/or delivery 24
Place of delivery and attendant at birth 25
Method of Delivery 25
4
Period of gestation 26
Birthweight 28
Apgar score 29
Plurality 29
Abnormal conditions of the newborn 29
Congenital anomalies of child 30
Quality of Data 30
Completeness of registration 31
Completeness of reporting 31
Quality control procedures 31
Computation of Rates and Other Measures 32
Population bases 32
Net census undercounts and overcounts 34
Cohort fertility tables 34
Total fertility rates 35
Seasonal adjustment of rates 35
Computation of percentages, percentage distributions, and medians 36
Computation of measures of variability 36
Random variation and significance testing for natality data 36
Random variation and significance testing for population subgroups 46
References 50
5
Figure
4-A. U.S. Standard Certificate of Live Birth: 1989 Revision
Text Tables
A. Percentage of birth records on which specified items were not stated: United States and each State and territory, 2003
B. Births by place of occurrence and residence for births occurring in the 50 States, the District of Columbia, U.S. territories, and other countries, 2003
C. Lower and upper 95 percent and 96 percent confidence limit factors for a birth rate based on a Poisson variable of 1 through 99 births, B
D. Sources for the resident population and population including Armed Forces abroad: Birth-and death-registration States, 1900–1932, and United States, 1900–2003
E. Percentage net undercount, by age, sex, and race/Hispanic origin: United States, April 1, 2000
Population Tables
4-1. Population of birth-and death-registration States, 1900–1932, and United States, 1900–2003
4-2. Estimated total population by race and estimated female population by age and race: United States, 2003
4-3. Estimated total population by specified Hispanic origin and estimated female population by age and specified Hispanic origin and by race for women of non-Hispanic origin: United States, 2003
4-4. Estimated total population and female population aged 15–44 years: United States, each State, and territory, July 1, 2003
6
Introduction
This Technical Appendix, published by the Centers for Disease Control and
Prevention’s National Center for Health Statistics (NCHS), is reprinted from “Vital
Statistics of the United States, 2003, Volume I, Natality” [1]. Reference will be made to
the “1999 Technical Appendix” for historical context and a more lengthy discussion of
some variables, and the quality and completeness of the birth data [2]. This report
supplements the “Technical Notes” section of “Births: Final data for 2003” [3] and is
recommended for use with the public-use file for 2003 births, available on CD-ROM
from NCHS [4], and the tabulated data of “Vital Statistics of the United States, 2003
Volume I , Natality” [1].
Definition of Live Birth
Every product of conception that gives a sign of life after birth, regardless of the
length of the pregnancy, is considered a live birth. This concept is included in the
definition set forth by the World Health Organization in 1950 [5]. A slightly expanded
definition of live birth was recommended by the 1992 revision of the Model State Vital
Statistics Act and Regulations [6], based on recommendations of a 1988 working group
formed by the American Academy of Pediatrics and the American College of
Obstetricians and Gynecologists [7] and is consistent with that currently used by the
WHO in the ICD-10 [8] and the United Nations:
“Live birth” means the complete expulsion or extraction from its mother of a
product of human conception, irrespective of the duration of pregnancy, which,
after such expulsion or extraction, breathes, or shows any other evidence of life,
such as beating of the heart, pulsation of the umbilical cord, or definite movement
of voluntary muscles, whether or not the umbilical cord has been cut or the
placenta is attached. Heartbeats are to be distinguished from transient cardiac
contractions; respirations are to be distinguished from fleeting respiratory efforts
or gasps.
7
This definition distinguishes in precise terms a live birth from a fetal death [9].
Forty-eight registration areas use definitions of live births similar to this definition; five
areas use a shortened definition; four have no formal definition of live birth. [10]. All
States require the reporting of live births regardless of length of gestation or birth weight.
History of Birth-Registration Area
Currently the birth-registration system of the United States covers the 50 States,
the District of Columbia, the independent registration area of New York City, and Puerto
Rico, the U.S. Virgin Islands, Guam, American Samoa, and the Commonwealth of the
Northern Mariana Islands (referred to as Northern Marianas). However, in the statistical
tabulations, “United States” refers only to the aggregate of the 50 States (including New
York City) and the District of Columbia. Information on the history and development of
the birth-registration area is available elsewhere [2].
Sources of Data
Natality statistics
Since 1985, natality statistics for all States and the District of Columbia have been
based on information from the total file of records. The information is received on
electronic files consisting of individual records processed by the States, the District of
Columbia, New York City, Puerto Rico, the Virgin Islands, American Samoa, and the
Northern Marianas. NCHS receives these files from the registration offices of all States,
the two cities and four territories through the Vital Statistics Cooperative Program.
Information for Guam is obtained from paper copies of original birth certificates which is
coded and keyed by NCHS. Data from American Samoa first became available in 1997;
data from the Northern Marianas in 1998.
U.S. natality data are limited to births occurring within the United States,
including those occurring to U.S. residents and nonresidents. Births to nonresidents of the
United States have been excluded from all tabulations by place of residence beginning in
1970 (for further discussion see “Classification by occurrence and residence”). Births
occurring to U.S. citizens outside the United States are not included in any tabulation in
this report. Data for Puerto Rico, the Virgin Islands, Guam, American Samoa, and the
8
Northern Marianas are limited to births registered in these areas.
Standard certificates of live birth
The U.S. Standard Certificate of Live Birth, issued by the U.S. Department of
Health and Human Services, has served for many years as the principal means for
attaining uniformity in the content of the documents used to collect information on births
in the United States. Every 10-15 years, the basic process of collecting birth and death
information is revised. It has been modified in each State to the extent required by the
particular State's needs or by special provisions of the State's vital statistics law.
However, most State certificates conform closely in content to the standard certificate.
2003 revision — In 2003, a revised U.S. Standard Certificate of Live Birth was
adopted, with initial implementation in two states (Pennsylvania and Washington). Full
implementation in all States will be phased in over several years. The 2003 revision is
described in detail in documents available on the Internet. [11,12].
There are numerous new items on the 2003 certificate (receipt of WIC food,
receipt of fertility therapy, infections during pregnancy, maternal morbidity, breast
feeding, etc.) and modifications of old items (ability to capture multiple race, levels of
smoking, history of prenatal care, components of the Body Mass Index, onset of labor,
etc.). A forthcoming report will present information on the new data items.
A key aspect of the 2003 Revision of the United States Standard Certificate has
been the re-engineering in the data collection and transmission system. The intent of the
re-engineering is to improve data quality, speed of data collection and transmission, and
to enhance standardization of the 2003 Revision. This effort is described in a document
[13] available on the Internet. Data will be obtained from two sources: the Mother’s
Worksheet and the Facility Worksheet. In the Mother’s Worksheet, data are directly
obtained from the mother and include such data as race, Hispanic origin, educational
attainment, WIC participation, etc. In the Facility Worksheet, data are obtained directly
from medical records of the mother and infant with items such as date of last menstrual
period, risk factors, method of delivery, etc. To assist hospital staff in completing the
Facility Worksheet, a comprehensive instruction manual was developed: Guide to
Completing the Facility Worksheets for the Certificate of Live Birth and Report of Fetal
Death (2003 Revision) [14].
9
It is expected that each state will employ software to conform to national
standards in order to record, in electronic media, data gathered in either electronic or
paper worksheets. A number of features are integral to this software. There are automatic
edits at the time of data entry to permit immediate modification of data and tracking of
modifications.
1989 revision—Effective January 1, 1989, a revised U.S. Standard Certificate of
Live Birth (figure 4-A) replaced the 1978 revision. This revision provided a wide variety
of new information on maternal and infant health characteristics, representing a
significant departure from previous versions in both content and format. The most
significant format change was the use of checkboxes to obtain detailed medical and
health information about the mother and child. Details of the nature and content of the
1989 revision are available in the Technical Appendix to the Natality file [2].
The medical and health check boxes -- Both the 1989 and 2003 Standard
Certificates of Live Birth use a checkbox format for collecting much of the medical and
health information available on the birth certificate. This information includes items on
medical risk factors, obstetric procedures, complications of labor and/or delivery,
abnormal conditions of the newborn, and congenital anomalies of the child. However, a
number of individual checkbox items included on the 1989 certificate were dropped from
the revised certificate in 2003. In addition, definitions for some items were modified for
the 2003 revision resulting in data which are not comparable across revisions. Tables in
the 2003 final natality report [3] are footnoted to identify reporting areas for the specific
checkboxes: see tables 26-28, 36-37, 42, and 48-49.
The 2003 Natality Data File The 2003 data file consists of data items from the 1989 Revision of the U.S.
Standard Certificate of Live Birth used by 48 states and the District of Columbia. It also
includes considerable data from two States, Pennsylvania and Washington, which
implemented the 2003 revision of the U.S. Standard Certificate of Live Birth. Where
comparable, data from Pennsylvania and Washington are combined with data from the
remaining 48 states and the District of Columbia. Where data for the 1989 and 2003
certificate revisions are not comparable (e.g., educational attainment of the mother), data
10
for Pennsylvania and Washington are excluded from the national totals for 2003.
One of the principal values of vital statistics data is realized through the
presentation of rates that are computed by relating the vital events of a class to the
population of a similarly defined class. Vital statistics and population statistics, therefore,
must be tabulated in comparable groups. Even when the variables common to both, such
as geographic area, age, race, and sex, have been similarly classified and tabulated,
significant discrepancies may result from differences between the enumeration method of
obtaining population data and the registration method of obtaining vital statistics data.
The general rules used to classify live births by parental characteristics are set
forth in “Vital Statistics Classification and Coding Instructions for Live Birth Records,
1999–2001,” NCHS Instruction Manual, Part 3a [15]. (Information in this manual is
applicable to the 2003 data). This material is incorporated in the basic file layout on the
CD-ROM [4]. The instruction materials are for States to use in coding the data items;
they do not include any NCHS recodes. Therefore, the file layout is a better source of
information on the code structure because it provides the exact codes and recodes that are
available. Classification of certain important items is discussed in the following pages.
Information on the completeness of reporting of birth certificate data is shown in table A,
which presents a listing of items and the percentage of records that were not stated for
each State, Puerto Rico, the Virgin Islands, Guam, American Samoa, and the Northern
Marianas.
Occurrence and residence
In tabulations by place of residence, births occurring within the United States to
U.S. citizens and to resident aliens are allocated to the usual place of residence of the
mother in the United States, as reported on the birth certificate. Beginning in 1970, births
to nonresidents of the United States occurring in the United States are excluded from
these tabulations. Births to U.S. residents occurring outside this country are not included
in tabulations by place of residence.
The total count of births for the United States by place of residence and by place
of occurrence will not be identical. Births to nonresidents of the United States are
included in data by place of occurrence but excluded from data by place of residence, as
previously indicated. See table B for the number of births by residence and occurrence
11
for the 50 States and the District of Columbia for 2003.
Residence error—A nationwide test of birth-registration completeness in 1950
provided measures of residence error for natality statistics. According to the 1950 test
(which has not been repeated), errors in residence reporting for the country as a whole
tend to overstate the number of births to residents of urban areas and to understate the
number of births to residents of other areas [16]. Recent experience demonstrates that this
is still a concern based on anecdotal evidence from the States. This tendency has assumed
special importance because of a concomitant development—the increased utilization of
hospitals in cities by residents of nearby places—with the result that a number of births
are erroneously reported as having occurred to residents of urban areas. Another factor
that contributes to this overstatement of urban births is the customary practice of using
city addresses for persons living outside the city limits. Residence error should be taken
into consideration in interpreting data for small areas and for cities. Both birth and infant
mortality patterns can be affected.
Incomplete residence—Beginning in 1973 where only the State of residence is
reported with no city or county specified and the State named is different from the State
of occurrence, the birth is allocated to the largest city of the State of residence. Before
1973, such births were classified according to the exact place of occurrence.
Geographic classification
The rules followed in the classification of geographic areas for live births are
contained in the instruction manual mentioned previously. The geographic code structure
for the 2003 file is given in two manuals, “Vital Records Geographic Classification,
2003,” and “Vital Records Geographic Classification, 2004. Federal Information
Processing Standards (FIPS).” NCHS Instruction Manual, Part 8, [17] and [18]. The
geographic code structure on the 2003 file is based on results of the 2000 Census of
Population.
United States— In the statistical tabulations, “United States” refers only to the
aggregate of the 50 States and the District of Columbia. Alaska has been included in the
U.S. tabulations since 1959 and Hawaii since 1960.
Details of the classification of births for metropolitan statistical areas,
metropolitan and nonmetropolitan counties, and population size groups for cities and
12
urban places are presented elsewhere [2].
Places with a population of less than 100,000 are not separately identified on the
public-use file because of confidentiality limitations.
Demographic Characteristics Hispanic origin, and race
Hispanic origin—Hispanic origin and race are reported independently on the birth
certificate. Data for Hispanic subgroups are shown in most cases for four specific groups:
Mexican, Puerto Rican, Cuban, Central and South American; and an additional subgroup:
“Other and unknown Hispanic.” More specific Hispanic origin information for the “Other
and unknown Hispanic” category is not available. In tabulations of birth data by race
only, data for persons of Hispanic origin are included in the data for each race group
according to the mother’s reported race. The category “white” comprises births reported
as white and births where race, as distinguished from Hispanic origin, is reported as
Hispanic. In tabulations of birth data by race and Hispanic origin, data for persons of
Hispanic origin are not further classified by race because the vast majority of births to
Hispanic women (97 percent in 2003) are reported as white. In many of our tabulations,
data for non-Hispanic persons are classified according to the race of the mother because
there are substantial differences in fertility and maternal and infant health between
Hispanic and non-Hispanic white women. The percentage of birth records for which
Hispanic origin of either parent was not reported in 2003 is shown by State in table A.
A recode variable is available that provides cross tabulations of race by Hispanic origin.
The 1989 and 2003 revisions of the U.S. Standard Certificate of Live Births
include items to identify the Hispanic origin of the parents. All 50 States, the District of
Columbia, the Virgin Islands, and Guam reported Hispanic origin of the parents for 2003.
In computing birth and fertility rates for the Hispanic population, births with
origin of mother not stated are included with non-Hispanic births rather than being
distributed. Thus, rates for the Hispanic population are underestimates of the true rates to
the extent that the births with Hispanic origin of mother not stated (0.7 percent in 2003)
were actually to Hispanic mothers [19]. The population with origin not stated was
imputed. The effect on the rates is believed to be small. The percentage of birth records
13

for which Hispanic origin of either parent was not reported in 2003 is shown by State in
table A.
Single, Multiple and “Bridged” race of mother and father—In 1997, the Office
of Management and Budget (OMB) issued ‘‘Revisions to the Standards for the
Classification of Federal Data on Race and Ethnicity’’ which revised the ‘‘1977
Statistical Policy Directive 15, Race and Ethnic Standards for Federal Statistics and
Administrative Reporting’’ [20,21,22]. These documents specify guidelines for
collection, tabulation, and presentation of race and ethnicity data within the Federal
statistical system. The 1997 revised standards incorporated two major changes designed
to reflect the changing racial profile of the United States. First, the revision increased
from four to five the minimum set of categories to be used by Federal agencies for
identification of race. The 1977 standards required Federal agencies to report race-
specific tabulations using a minimum set of four single-race categories: American Indian
or Alaska Native (AIAN), Asian or Pacific Islander (API), Black, and White. The five
categories for race specified in the 1997 standards are: American Indian or Alaska
Native, Asian, Black or African American, Native Hawaiian or Other Pacific Islander,
and White. The revised standards called for reporting of Asians separately from Native
Hawaiians or Other Pacific Islanders. Collection of additional detail on race and
ethnicity is permitted, as before, so long as the additional categories can be aggregated
into the minimum categories. The revised standards also require Federal data collection
programs to allow respondents to select one or more race categories.
For the 2000 decennial census, the U.S. Census Bureau collected race and
ethnicity data in accordance with the 1997 revised standards. However, the National
Vital Statistics System, which is based on data collected by the States, will not be fully
compliant with the new standards until all of the States revise their birth certificates to
reflect the new standards. Thus, beginning with the 2000 data year, the numerators
(births) for birth rates are incompatible with the denominators (populations) (see
“Population denominators”). In order to compute rates, it is necessary to ‘‘bridge’’
population data for multiple-race persons to single-race categories. This has been done
for birth rates by race presented in this report. Once all States revise their birth
registration systems to be compliant with the 1997 OMB standards, the use of ‘‘bridged’’
14
populations can be discontinued.
Beginning with 2003 data year, multiple-race was reported by Pennsylvania and
Washington, which used the 2003 revision of the U.S. Standard Certificate of Live Birth,
as well as by California, Hawaii, Ohio (for births occurring in December only), and Utah,
which used the 1989 revision of the U.S. Standard Certificate of Live Birth. These 6
States, which account for 20.7 percent of births in the U.S. in 2003, reported 2.5 percent
of mothers as multiracial, with levels varying from 0.6 percent (Ohio) to 33.4 percent
(Hawaii).
Data from the vital records of the remaining 44 States and the District of
Columbia followed the 1977 OMB standards in which a single race is reported [20,21].
In addition, these areas also report the minimum set of four races as stipulated in the 1977
standards [20], compared with the minimum of five races for the 1997 [21] standards.
In order to provide uniformity and comparability of the data during the transition
period, before multiple-race data are available for all reporting areas, it is necessary to
“bridge” the responses of those who reported more than one race to a single-race. The
bridging procedure for multiple-race mothers and fathers is based on the procedure used
to bridge the multiracial population estimates (see “Population denominators”) [22,23].
Multiple-race is imputed to a single race (one of the following: AIAN, API, Black, or
White) according to the combination of races, Hispanic origin, sex, and age indicated on
the birth certificate of the mother or father. The imputation procedure is described in
detail elsewhere [24,25].
As noted previously, the bridging procedure imputes multiple-race of mothers to
one of the four minimum races stipulated in the 1977 OMB standards, that is, AIAN,
API, Black, or White. Mothers of a specified Asian or Pacific Islander subgroup (that is,
Chinese, Japanese, Hawaiian, or Filipino) in combination with another race (that is,
AIAN, Black, and/or White) or another API subgroup cannot be imputed to a single API
subgroup. API mothers are disproportionately represented in the 6 States reporting
multiple-race (44 percent in 2003.) For the report “Births: Final Data for 2003”, data are
not shown for the specified API subgroups because the bridging technique cannot be
applied in this detail [3, 22, 23]. However, data for the API subgroups, reported alone or
15
in combination with other races and/or API subgroups, are available in the 2003 Natality
public-use data file. In addition, a report on births in 2003 to multiple-race women,
which will include births to single- and multiple-race women of the API subgroups, is
forthcoming.
Race of mother is reported by 44 States and the District of Columbia in at least
eight single-race categories: White, Black, American Indian or Alaska Native, Chinese,
Japanese, Hawaiian, Filipino, and “other Asian or Pacific Islander” (API). Of these, 8
States (Illinois, Minnesota, Missouri, New Jersey, New York, Texas, Virginia, and West
Virginia) report data on the expanded API subgroups included in the “other API
category” (Asian Indian, Korean, Samoan, Vietnamese, Guamanian, and remaining API).
Finally, 6 States which report multiple-race data (California, Hawaii, Ohio, Pennsylvania,
Utah, and Washington) report a minimum of fourteen categories (White, Black,
American Indian or Alaska Native, Asian Indian, Chinese, Filipino, Japanese, Korean,
Vietnamese, other Asian, Hawaiian, Guamanian, Samoan, and other Pacific Islander).
For this report, as discussed above, the multiple-race combinations (for example, White
and AIAN or Black and Chinese) were bridged to one of four broad categories (bridged
White, bridged Black, bridged AIAN, and bridged API). Detailed data on race (single or
multiple) as reported in these six States are available on the 2003 natality public use file.
In 2003, race of mother was not reported for 0.5 percent of births. In these cases,
if the race of the father was known, the race of the father was assigned to the mother.
When information was not available for either parent, the race of the mother was imputed
according to the specific race of the mother on the preceding record with a known race of
mother. This was necessary for just 0.4 percent of births in 2003.
Beginning with the 1989 data year, NCHS started tabulating its birth data
primarily by race of the mother. In 1988 and prior years, births were tabulated by the
race of the child, which was determined from the race of the parents as entered on the
birth certificate. The reasons for this change are summarized in the 1999 Technical
Appendix [2]. Trend data by race shown in this report are by race of mother for all years
beginning with the 1980 data year. Text references to white births and white mothers or
black births and black mothers are used interchangeably for ease in writing.
16
Age of mother Beginning in 1989 a “Date of birth” item on the birth certificate replaced the “Age
(at time of this birth)” item. Not all States revised this item, and, therefore, the age of
mother either is derived from the reported month and year of birth or coded as stated on
the certificate. In 2003 age of mother was reported directly by five States (Kentucky,
Nevada, North Dakota, Virginia, and Wyoming) and American Samoa. From 1964 to
1996, births reported to occur to mothers younger than age 10 or older than age 49 years
had age imputed according to the age of mother from the previous record with the same
race and total birth order (total of live births and fetal deaths). Beginning in 1997, age of
mother is imputed for ages 9 years or under and 55 years and over. A review and
verification of unedited birth data for 1996 showed that the vast majority of births
reported as occurring to women aged 50 years and older were to women aged 50-54
years. The numbers of births to women aged 50-54 years are too small for computing
age-specific birth rates. These births have been included with births to women aged 45-49
years for computing birth rates. [2].
Age–specific birth rates are based on populations of women by age, prepared by
the U.S. Census Bureau. In census years the decennial census counts are used. In
intercensal years, estimates of the population of women by age are published by the U.S.
Census Bureau in Current Population Reports. The 2000 Census of Population derived
age in completed years as of April 1, 2000, from responses to questions on age at last
birthday and month and year of birth, with the latter given preference. In the 1960, 1970,
1980, and 1990 Census of Population, age was also derived from month and year of birth.
Age in completed years was asked in censuses before 1960. This was nearly the
equivalent of the former birth certificate question, which the 1950 test of matched birth
and census records confirms by showing a high degree of consistency in reporting age in
these two sources [26]. More recently, reporting of maternal age on the birth certificate
was compared with reporting of age in a survey of women who had recently given birth.
Reporting of age was very consistent between the two sources [27].
Median age of mother—Median age is the value that divides an age distribution
into two equal parts, one-half of the values being less and one-half being greater. Median
ages of mothers for 1960 to the present have been computed from birth rates for 5–year
17
age groups rather than from birth frequencies. This method eliminates the effects of
changes in the age composition of the childbearing population over time. Changes in the
median ages from year to year can thus be attributed solely to changes in the age–specific
birth rates. Trend data on the median age is shown in table 1-5 of “Vital Statistics of the
United States, 2000, Volume 1, Natality” [28], which is available on the Internet at:
http://www.cdc.gov/nchs/datawh/statab/unpubd/natality/natab2000.htm
Not stated age or date of birth of mother— In 2003 age of mother was not
reported on 0.01 percent of the records. Beginning in 1964 birth records with date of birth
of mother and/or age of mother not stated have had age imputed according to the age of
mother from the previous birth record of the same race and total-birth order (total of fetal
deaths and live births). (See NCHS Instruction Manual, Part 12, page 9) [29]. Editing
procedures for 1963 and earlier years are described elsewhere [2].
Age of father
Age of father is derived from the reported date of birth or coded as stated on the
birth certificate. If the age is under 10 years, it is considered not stated and grouped with
those cases for which age is not stated on the certificate. Information on age of father is
often missing on birth certificates of children born to unmarried mothers, greatly inflating
the number in the “Not stated” category in all tabulations by age of father. In computing
birth rates by age of father, births tabulated as age of father not stated are distributed in
the same proportions as births with known age within each 5–year-age classification of
the mother. This procedure is followed because, while father’s age is missing on 13
percent of the birth certificates in 2003, one-quarter of these were on records where the
mother is a teenager. This distribution procedure is done separately by race. The resulting
distributions are summed to form a composite frequency distribution that is the basis for
computing birth rates by age of father. This procedure avoids the distortion in rates that
would result if the relationship between age of mother and age of father were
disregarded. Births with age of father not stated are distributed only for rates, not for
frequency tabulations [3].
Live-birth order and parity
Live-birth order and parity classifications refer to the total number of live births
the mother has had including the 2003 birth. Fetal deaths are excluded.
18
Live-birth order indicates what number the present birth represents; for example,
a baby born to a mother who has had two previous live births (even if one or both are not
now living) has a live-birth order of three. Parity indicates how many live births a mother
has had. Before delivery a mother having her first baby has a parity of zero, and a mother
having her third baby has a parity of two. After delivery the mother of a baby who is a
first live birth has a parity of one, and the mother of a baby who is a third live birth has a
parity of three.
Live-birth order and parity are determined from two items on the birth certificate,
“Live births now living” and “Live births now dead.” Editing procedures for live birth
order are summarized elsewhere [2, 29].
Not stated birth order—All births tabulated in the “Not stated birth order”
category are excluded from the computation of percentages. In computing birth rates by
live-birth order, births tabulated as birth order not stated are distributed in the same
proportion as births of known live-birth order.
Marital status
National estimates of births to unmarried women are based on two methods of
determining marital status. For 1994 through 1996 birth certificates in 45 States and the
District of Columbia included a question about the mother's marital status. For the other
States, marital status is inferred from information on the birth certificate. Beginning in
1997, the marital status of women giving birth in California and Nevada was determined
by a direct question in the birth registration process. New York City also changed its
procedures for inferring marital status in 1997. Beginning June 15, 1998, Connecticut
discontinued inferring the mother’s marital status and added a direct question on mother’s
marital status to the State’s birth certificate.
In the two States (Michigan and New York) which used inferential procedures to
compile birth statistics by marital status in 2003, a birth is inferred as nonmarital if either
of these factors, listed in priority-of-use order, is present: a paternity acknowledgment
was received or the father’s name is missing. In recent years, a number of States have
extended their efforts to identify the fathers when the parents are not married in order to
enforce child support obligations. The presence of a paternity acknowledgment,
therefore, is the most reliable indicator that the birth is nonmarital in the States not
19
reporting this information directly; this is now the key indicator in the nonreporting
States. Details of the changes in reporting procedures and the impact of the procedures on
the data are described in previous reports [30, 31].
The mother’s marital status was not reported in 2003 on 0.04 percent of the birth
records in the 48 States and the District of Columbia where this information is obtained
by a direct question. Marital status was imputed for these records. If status was unknown
and the father’s age was known, then the mother was considered married. If the status
was unknown, and the father’s age unknown, then the mother was considered unmarried.
This represents a change from the procedures in effect for 2002 and previous years. Prior
to 2003, marital status for records with marital status not reported was imputed as
“married”. Because of the small number of records affected (834 births in 2003), the
change in imputation procedures had essentially no impact on measures of nonmarital
births.
When births to unmarried women are reported as second or higher order births, it
is not known whether the mother was married or unmarried when the previous deliveries
occurred because her marital status at the time of these earlier births is not available from
the birth record.
Educational attainment
National data on educational attainment are currently available only for the
mother [2]. Beginning in 1995, NCHS discontinued collecting information on the
educational attainment of the father.
The educational attainment of the mother is defined as the number of years of
school completed. Only those years completed in regular schools are counted, that is, a
formal educational system of public schools or the equivalent in accredited private or
parochial schools. Business or trade schools, such as beauty and barber schools, are not
considered regular schools for the purposes of this item. No attempt has been made to
convert years of school completed in foreign school systems, ungraded school systems,
and so forth, to equivalent grades in the American school system. Such entries are
included in the “Not stated” category.
Women who have completed only a partial year in high school or college are
20
tabulated as having completed the highest preceding grade. For those certificates on
which a specific degree is stated, years of school completed is coded to the level at which
the degree is most commonly attained; for example, women reporting B.A., A.B., or B.S.
degrees are considered to have completed 16 years of school.
Education not stated—The “Not stated” category includes all records for which
there is no information on years of school completed as well as all records for which the
information provided is not compatible with coding specifications. Births tabulated as
education not stated are excluded from the computations of percentages.
The 2003 data in “Births: Final Data for 2003” [3] exclude information on
mother’s educational attainment for Pennsylvania and Washington. The 1989 and 2003
certificate items on educational attainment are too dissimilar for these data to be reliably
combined. The 1989 certificate item asks for the highest grade completed, whereas the
2003 certificate item asks for the highest degree or level of school completed (e.g., high
school diploma, bachelor degree, etc.). See new educational attainment item in the 2003
US Standard Birth Certification [12]. The data for Pennsylvania and Washington are
included on the public use file [4].
Maternal and Infant Health Characteristics Weight gain during pregnancy
Weight gain is reported in pounds. A loss of weight is reported as zero gain.
Computations of median weight gain were based on ungrouped data. This information is
presented for 49 States and the District of Columbia. California did not report weight
gain information.
The 1989 revision of the birth certificate included a question “weight gained
during pregnancy ____ lbs.” Pennsylvania and Washington employed the new question
from the 2003 Revised Certificate. The 2003 Revised Certificate asked for more detailed
information on weight gain. It asked for both the pre-pregnancy weight of the mother
and her weight at delivery. As well, it recorded her height. Thus the revised certificate
has the information needed (height and pre-pregnancy weight) to calculate the Body
Mass Index. Pennsylvania and Washington’s data from the revised certificate was
combined with the data based on the 1989 revision to produce tabulations on median
21
weight gain and percent distributions of weight gain.
Medical risk factors for this pregnancy
Sixteen medical risks which can affect pregnancy outcome are separately
identified on the 1989 Certificate of Live Birth. The format allows for the designation of
more than one risk factor and includes a choice of “None.” Accordingly, if the item is not
completed, it is classified as not stated. These risks and reporting areas are shown in table
26 of the 2003 natality final report [3].
Definitions adapted and abbreviated from a set of definitions compiled by a
committee of Federal and State health statistics officials for the Association for Vital
Records and Health Statistics are available elsewhere [3]. Definitions of factors included
in the 2003 revision are presented in the detailed guide for use in completing facility
worksheets for the 2003 Revision [14].
Tobacco use during pregnancy
The checkbox format allows for classification of a mother as a smoker or drinker
during pregnancy and for reporting the average number of cigarettes smoked per day or
drinks consumed per week. Procedures for determining the consistency between smoking
and/or drinking status and the quantity of cigarettes or drinks reported are described
elsewhere [2].
Information on whether or not the mother smoked during pregnancy is available
for all reporting areas except California, (figure 4-A). California did not report this item;
Pennsylvania and Washington implemented the revised 2003 birth certificate which asks
for the number of cigarettes smoked at different intervals before and during the
pregnancy. In comparison, the 1989 standard certificate asked for “Tobacco use during
pregnancy,” “yes/no,” and the average number of cigarettes per day with no specificity
on timing during pregnancy. The areas reporting whether or not the mother smoked
during pregnancy based on the 1989 question comprise 81 percent of U.S. births in 2003.
Vermont –– The birth certificate in use in Vermont since 2000 includes the
tobacco use questions that are on the 2003 revision of the birth certificate. The Vermont
Health Department has translated the information collected to a format consistent with
the 1989 question, and therefore Vermont data are included in the reporting area.
Data on the number of cigarettes smoked daily were available in a comparable
22
format for 44 states, the District of Columbia, and New York City. Indiana and New
York State (except for New York City), Pennsylvania, South Dakota, and Washington
reported the number of cigarettes smoked in a format that was not comparable with the
1989 revision of the U.S. Standard Certificate of Live Birth, used by other reporting
areas. California did not collect this information. The areas reporting the number of
cigarettes smoked comprised 76 percent of U.S. births in 2003.
Alcohol use during pregnancy
Alcohol use during pregnancy is a major, independent risk factor and it is
implicated as well in delayed infant and child development [32, 33].
Data on alcohol use are not collected on the birth certificates of California,
Pennsylvania or Washington. The areas reporting alcohol use accounted for 81 percent
of U.S. births in 2003.
Unfortunately, alcohol use is substantially underreported on the birth certificate,
compared with data collected in nationally representative surveys of pregnant women.
Only 0.7 percent of women giving birth in 2003 reported alcohol use during pregnancy,
down from 0.8 percent in 2002 for the same reporting area (data for 2003 shown in the
2003 natality final report [3] tables 24 and 25).
The birth certificate question on alcohol use from the 1989 revision is evidently
not sensitive enough to measure this behavior accurately. The question’s wording as well
as the lack of specific time reference for the birth certificate questions are probable
factors contributing to the underreporting. In addition, the stigma of maternal alcohol use
likely contributes to the underreporting [34, 35].
Prenatal care
Month of pregnancy prenatal care began –– Information on prenatal care is
collected by all reporting areas. However, the questions on the 1989 and 2003 revisions
differ substantially, as do the likely sources of the data. Thus, tabulations of prenatal care
in “Births: Final Data for 2003” [3] exclude data for Pennsylvania and Washington. Data
for the latter two States are available on the public use data file [4]. In the 2003 revision,
the timing of the prenatal care item was modified to “Date of first prenatal visit” from
“Month prenatal care began.” In addition, the 2003 revision process resulted in the
recommendation that information on prenatal care be gathered from the prenatal care or
23
medical records whereas the 1989 revision did not recommend a source for this data. See
tables 24, 25, 33-35 in the 2003 natality final report [3].
If the name of the month is entered for this item, instead of first, second, third,
and so forth, the month of pregnancy in which prenatal care began is determined from the
month named and the month last normal menses began. For these births, if the date last
normal menses began is not stated, the month of pregnancy in which prenatal care began
is tabulated as not stated
Number of prenatal visits –– tabulations of the number of prenatal visits were
presented for the first time in 1972. Beginning in 1989 these data were collected from the
birth certificates of all States. Percentage distributions and the median number of prenatal
visits exclude births to mothers who had no prenatal care. See table 35 in the 2003
natality final report [3].
Obstetric procedures
This item includes six specific obstetric procedures on the 1989 revision of the
birth certificate in use by 48 states and the District of Columbia in 2003. Table 36 of the
2003 natality final report [3] provides data for the six procedures and the reporting areas
for each item. Birth records with “Obstetric procedures” left blank are considered not
stated. Definitions adapted and abbreviated from a set of definitions compiled by a
committee of Federal and State health statistics officials for the National Association for
Public Health Statistics and Information Systems (NAPHSIS), formerly the Association
for Vital Records and Health Statistics, are available elsewhere [3]. Additional
definitions are included in the detailed facility worksheet guide [14].
Complications of labor and of delivery
The checkbox format allows for the selection of 15 specific complications on the
1989 revised certificate, and for the designation of more than one complication where
appropriate. The complication rates for each procedure and the respective reporting area
are given in table 37 in the 2003 natality final report [3]. A choice of “None” is also
included. Accordingly, if the item is not completed, it is classified as not stated.
Definitions adapted and abbreviated from a set of definitions compiled by a committee of
Federal and State health statistics officials are available elsewhere [3]. Here, too, see the
detailed facility worksheet guide [14].
24
Place of delivery and attendant at birth
The 1989 revision of the U.S. Standard Certificate of Live Birth included separate
categories for freestanding birthing centers, the mother's residence, and clinic or doctor's
office as the place of birth. Beginning in 1989 births occurring in clinics and in birthing
centers not attached to a hospital are classified as “Not in hospital.” This change in
classification may account in part for the lower proportion of “In hospital” births
compared with previous years. (The change in classification of clinics should have minor
impact because comparatively few births occur in these facilities, but the effect of any
change in classification of freestanding birthing centers is unknown.)
Beginning in 1975 the attendant at birth and place of delivery items were coded
independently, primarily to permit the identification of the person in attendance at
hospital deliveries. Additional information on these items is presented elsewhere [2].
Babies born on the way to or on arrival at the hospital are classified as having
been born in the hospital. This may account for some of the hospital births not delivered
by physicians or midwives. The “Not in hospital” category includes births for which no
information is reported on place of birth.
In 2000 Illinois started collecting data on certified nurse-midwives (CNM) and
making corrections for “Other midwife” and “Other” categories. Data for earlier years
were incomplete for Illinois births. As a result, the number of CNMs has significantly
increased while the number of “Other midwife” deliveries has sharply decreased
compared to earlier years.
Procedures in some hospitals may require that a physician be listed as the
attendant for every birth and that a physician sign each birth certificate, even if the birth
is attended by a midwife and no physician is physically present. Therefore, the number of
live births attended by midwives may be understated in some areas.
Method of delivery
The 1989 Revision of the Live Birth Certificate contains a checkbox for method
of delivery. Choices include vaginal delivery, with the additional options of forceps,
vacuum, and vaginal birth after previous cesarean section (VBAC), as well as a choice of
primary or repeat cesarean. When only forceps, vacuum, or VBAC is checked, a vaginal
25
birth is assumed. In 2003 this information was collected from the two revisions of birth
certificates of all States and the District of Columbia.
Despite substantive changes between the 1989 and 2003 revisions of the birth
certificate to the method of delivery item, data for revised and unrevised states are
combined for all national figures given. The total numbers and percents of vaginal and
cesarean deliveries appear to be very consistent between revisions. However,
information on whether the delivery is a VBAC, primary cesarean, or repeat cesarean
appears to be less comparable. This is because of wording and formatting changes
designed to collect data on whether the mother had a previous cesarean delivery. The
new format includes a direct question on whether the mother had had a previous cesarean
delivery whereas the old did not. In brief, revised data for Pennsylvania and Washington
show higher- than- expected VBAC and primary cesarean rates, and lower- than-
expected repeat cesarean rates. These slight incongruities for Pennsylvania and
Washington data have no appreciable impact on national rates and are included in
national figures shown for 2003. However, measures which incorporate these data to
compare changes across revisions for individual States should be interpreted with
caution. Several rates are computed for method of delivery. The overall cesarean section
rate or total cesarean rate is computed as the proportion of all births that were delivered
by cesarean section. The primary cesarean rate is a measure that relates the number of
women having a primary cesarean birth to all women giving birth who have never had a
cesarean delivery. The denominator for this rate is the sum of women with a vaginal birth
excluding VBACs and women with a primary cesarean birth. The VBAC delivery rate is
computed by relating all VBAC deliveries to the sum of VBAC and repeat cesarean
deliveries, that is, to women with a previous cesarean section. VBAC rates are computed
for first births because the rates are computed based on previous pregnancies, not just live
births.
Period of gestation
The period of gestation is defined as beginning with the first day of the last
normal menstrual period (LMP) and ending with the day of the birth. The LMP is used as
the initial date because it can be more accurately determined than the date of conception,
26
which usually occurs 2 weeks after the LMP. LMP measurement is subject to error for
several reasons, including imperfect maternal recall or misidentification of the LMP
because of post-conception bleeding, delayed ovulation, or intervening early miscarriage.
Births occurring before 37 completed weeks of gestation are considered to be
preterm or premature for purposes of classification. At 37–41 weeks gestation, births are
considered to be term, and at 42 completed weeks and over, post-term. These distinctions
are according to the ICD–9 and ICD–10 [8] definitions.
Before 1981, the period of gestation was computed only when there was a valid
month, day, and year of LMP. However, length of gestation could not be determined
from a substantial number of live-birth certificates each year because the day of LMP was
missing. Beginning in 1981, weeks of gestation have been imputed for records with
missing day of LMP when there is a valid month and year. The imputation procedure and
its effect on the data are described elsewhere [2,36]. But reporting problems for this item
persist and may occur more frequently among some subpopulations and among births
with shorter gestations. Changes in reporting of this measure over time have apparently
affected trends in preterm birth rates, particularly by race [37].
The 1989 revision of the U.S. Standard Certificate of Live Birth includes an item,
“Clinical estimate of gestation” that is being compared with length of gestation computed
from the LMP date when the latter appears to be inconsistent with birthweight. This is
done for normal weight births of apparently short gestations and very low birthweight
births reported to be full term. The procedures are described in the NCHS Instruction
Manual, Part 12, pp. 33-35 [29]. It is used by all states except California. The clinical
estimate was also used if the LMP date was not reported.
The period of gestation for 4.6 percent of the births in 2003 was based on the
clinical estimate of gestation. For 97 percent of these records, the clinical estimate was
used because the LMP date was not reported. For the remaining 3 percent, the clinical
estimate was used because it was compatible with the reported birthweight, whereas the
LMP-based gestation was not. In cases where the reported birthweight was inconsistent
with both the LMP-computed gestation and the clinical estimate of gestation, the LMP-
computed gestation was used and birthweight was reclassified as "not stated." This was
necessary for 247 births or 0.006 percent of all birth records in 2003. The levels of the
27
adjustments in 2003 data were similar to those for earlier years [38]. Despite these edits,
substantial incongruities in these data persist; research is ongoing to address these data
deficiencies.
Birthweight
In some areas birthweight is reported in pounds and ounces rather than in grams.
However, the metric system has been used in tabulating and presenting the statistics to
facilitate comparison with data published by other groups. The categories for birthweight
were changed in 1979 to be consistent with the recommendations in the International
Classification of Diseases, Ninth Revision (ICD–9) and remain the same for the
International Classification of Diseases, Tenth Revision (ICD–10) [8]. The categories in
gram intervals and their equivalents in pounds and ounces are as follows:
Less than 500 grams = 1 lb 1 oz or less 500–999 grams = 1 lb 2 oz–2 lb 3 oz 1,000–1,499 grams = 2 lb 4 oz–3 lb 4 oz 1,500–1,999 grams = 3 lb 5 oz–4 lb 6 oz 2,000–2,499 grams = 4 lb 7 oz–5 lb 8 oz 2,500–2,999 grams = 5 lb 9 oz–6 lb 9 oz 3,000–3,499 grams = 6 lb 10 oz–7 lb 11 oz 3,500–3,999 grams = 7 lb 12 oz–8 lb 13 oz 4,000–4,499 grams = 8 lb l4 oz–9 lb l4 oz 4,500–4,999 grams = 9 lb 15 oz–11 lb 0 oz 5,000 grams or more = 11 lb l oz or more
ICD–9 and ICD–10 define low birthweight as less than 2,500 grams. This is a
shift of 1 gram from the previous criterion of 2,500 grams or less, which was
recommended by the American Academy of Pediatrics in 1935 and adopted in 1948 by
the World Health Organization in the International Lists of Diseases and Causes of
Death, Sixth Revision.
After data classified by pounds and ounces are converted to grams, median
weights are computed and rounded before publication. To establish the continuity of class
intervals needed to convert pounds and ounces to grams, the end points of these intervals
are assumed to be half an ounce less at the lower end and half an ounce more at the upper
end. For example, 2 lb 4 oz–3 lb 4 oz is interpreted as 2 lb 3 ½ oz–3 lb 4 ½ oz. Births for
which birth weights are not reported are excluded from the computation of percentages
28
and medians.
Apgar score The 1– and 5–minute Apgar scores were added to the U.S. Standard Certificate of
Live Birth in 1978 to evaluate the condition of the newborn infant at 1 and 5 minutes
after birth. The Apgar score is a useful measure of the need for resuscitation and a
predictor of the infant's chances of surviving the first year of life. It is a summary
measure of the infant's condition based on heart rate, respiratory effort, muscle tone,
reflex irritability, and color. Each of these factors is given a score of 0, 1, or 2; the sum of
these 5 values is the Apgar score, which ranges from 0 to 10. A score of 10 is optimum,
and a low score raises some concerns about the potential survival and subsequent health
of the infant. Beginning in 1995, NCHS collected information only on the 5–minute
Apgar score. Since 1991, the reporting area for the 5–minute Apgar score has been
comprised of 48 States and the District of Columbia, accounting for 77.5 percent of all
births in the United States in 2003. California and Texas did not collect information on
Apgar scores on their birth certificates.
Plurality
In this file plurality is classified as single, twin, triplet, quadruplet, and quintuplet
and higher order. Records for which plurality is unknown are imputed as singletons.
This occurred for 0.002 percent of all records for 2003. Each record in the natality file
represents an individual birth. For example, a record coded as a twin represents one birth
in a twin delivery. Pairs or sets of twins or higher order multiple births are not identified
in this file. The Matched Multiple Birth File 1995-2000 includes information on sets of
twin, triplet and quadruplets, thus allowing for the analysis of characteristics of sets of
births and fetal deaths in multiple deliveries.
Abnormal conditions of the newborn
This item provides information on eight specific abnormal conditions included in
the 1989 revised birth certificate. More than one abnormal condition may be reported for
a given birth or “None” may be selected. If the item is not completed it is tabulated as not
stated. Rates for abnormal conditions of the newborn, as well as reporting areas for each
condition, are given in table 48 of the report: “Births: Final Data for 2003” [3].
Definitions adapted and abbreviated from a set of definitions compiled by a
29
committee of Federal and State health statistics are available elsewhere [3]. Again, see
the detailed facility worksheet guide [14].
Congenital anomalies of the child
The data provided in this item relate to 21 specific anomalies or anomaly groups
collected on the 1989 revised birth certificate. The checkbox format allows for the
identification of more than one anomaly including a choice of “None” should no
anomalies be evident. The “not stated” category includes birth records for which the item
is not completed.
It is well documented that congenital anomalies, except for the most visible and
most severe, are incompletely reported on birth certificates [39]. The completeness of
reporting specific anomalies depends on how easily they are recognized in the short time
between birth and birth-registration. Table 49 of the 2003 natality final report [3]
provides rates for each anomaly (or anomaly group) as well as describing the respective
reporting area. Definitions adapted and abbreviated from a set of definitions compiled by
a committee of Federal and State health statistics officials are available elsewhere [3].
Also, see the detailed facility worksheet guide [14].
Quality of Data Although vital statistics data are useful for a variety of administrative and scientific
purposes, they cannot be correctly interpreted unless various qualifying factors and
methods of classification are taken into account. The factors to be considered depend on
the specific purposes for which the data are to be used. It is not feasible to discuss all the
pertinent factors in the use of vital statistics tabulations, but some of the more important
ones should be mentioned.
Most of the factors limiting the use of data arise from imperfections in the original
records or from the impracticability of tabulating these data in very detailed categories.
These limitations should not be ignored, but their existence does not lessen the value of
the data for most general purposes.
Completeness of registration
It is estimated that more than 99 percent of all births occurring in the United
States in 2003 were registered. These estimates are based on the results of a national
30
1964–68 test of birth-registration completeness according to place of delivery (in or out
of hospital) and race (white and non-white). This test has not been conducted more
recently. A detailed discussion of the method and results of the 1964–68
birth-registration test is available [40]. Information on procedures for adjusting births for
underregistration (for cohort fertility tables) is presented elsewhere [2].
Completeness of reporting
Interpretation of these data must include evaluation of item completeness. The
“Not stated” percentage is one measure of the quality of the data. Completeness of
reporting varies among items and States. See table A for the percentage of birth records
on which specified items were not stated. Data users should note that levels of incomplete
or inaccurate reporting for some of the items are quite high in some States. The 2003 data
for Alaska and Rhode Island are of particular concern.
Quality control procedures
As electronic files are received at NCHS, they are automatically checked for
completeness, individual item code validity, and unacceptable inconsistencies between
data items. The registration area is notified of any problems. In addition, NCHS staff
reviews the files on an ongoing basis to detect problems in overall quality such as
inadequate reporting for certain items, failure to follow NCHS coding rules, and systems
and software errors. Traditionally, quality assurance procedures were limited to the
review and analysis of differences between NCHS and registration area code assignments
for a small sample of records. In recent years, as electronic birth registration became
prevalent, this procedure was augmented by analyses of year-to-year and area-to-area
variations in the data. These analyses are based on preliminary tabulations of the data that
are cumulated by State on a year-to-date basis each month. NCHS investigates all
differences that are judged to have consequences for quality and completeness. In the
review process, statistical tests are used to call initial attention to differences for possible
followup. As necessary, registration areas are informed of differences encountered in the
tables and asked to verify the counts or to determine the nature of the differences.
Missing records (except those permanently voided) and other problems detected by
NCHS are resolved, and corrections are transmitted to NCHS in the same manner as for
those corrections identified by the registration area.
31
Computation of Rates and Other Measures Population bases
Estimation by age, sex, race and Hispanic origin—Birth and fertility rates for
2003 shown in tables 1, 3–6, 8, 9, 13, 14, A, B, and C in the report: “Births: Final Data
for 2003” [3] are 2000 census-based post-censal estimates, as of July 1, 2003. These
populations are shown in tables 4-2 and 4-3. The population estimates have been
provided by the U.S. Census Bureau [41] and are based on the 2000 census counts by
age, sex, race, and Hispanic origin, which have been modified to be consistent with
Office of Management and Budget racial categories as of 1977 and historical categories
for birth data. The modification procedures are described in detail elsewhere [22, 23, 42].
Birth and fertility rates by State shown in table 10 of the report: “Births: Final
Data for 2003” [3] use 2000 census-based State-level post-censal population estimates
provided by the U.S. Census Bureau [41]. Rates by State shown in this report may differ
from rates computed on the basis of other population estimates. Birth and fertility rates
by month shown in table 15 of the 2003 natality final report [3] are based on monthly
population estimates also based on the 2003 estimates. Rates for unmarried women
shown in tables 17 and 18 of the 2003 natality final report [3] are based on distributions
of the population by marital status as of March 2003 as reported by the U.S. Census
Bureau in the March Current Population Survey (CPS) [43], which have been adjusted to
July 2003 population levels [41] by the Division of Vital Statistics, NCHS [3,31]. Birth
and fertility rates for the Hispanic population, shown in tables 6, 8, 9, and 14 of the 2003
natality final report [3], are based on estimates of the total Hispanic population as of July
1, 2003 [41]. Rates for Hispanic subgroups are based on special population estimates that
are presented in table 4-3. Information about allocation to Hispanic subgroups is
presented elsewhere [41, 44].
The populations by race used in this report were produced under a collaborative
arrangement with the U.S. Census Bureau and are 2000 census-based post-censual
estimates. Reflecting the new guidelines issued in 1997 by the Office of Management
and Budget (OMB), the 2000 census included an option for individuals to report more
than one race as appropriate for themselves and household members [21]. In addition,
32
the 1997 OMB guidelines called for reporting of Asian persons separately from Native
Hawaiians or other Pacific Islanders. In the earlier 1977 OMB guidelines, data for Asian
or Pacific Islander persons were collected as a single group [20]. Except for six States,
birth certificates currently report only one race for each parent in the categories specified
in the 1977 OMB guidelines (see “Hispanic origin, race and national origin”). In
addition, birth certificate data do not report Asians separately from Native Hawaiians or
other Pacific Islanders. Thus, birth certificate data by race (the numerators for birth and
fertility rates) currently are incompatible with the population data collected in the 2000
census (the denominators for the rates).
To produce birth and fertility rates for 1991 through 2003, it was necessary to
‘‘bridge’’ the population data for multiple race persons back to single race categories. In
addition, the post-censal estimates were modified to be consistent with the 1977 OMB
racial categories, that is, to report the data for Asian persons and Native Hawaiians or
other Pacific Islanders as a combined category Asian or Pacific Islanders [45, 46]. The
procedures used to produce the ‘‘bridged’’ populations are described in separate
publications [22, 23]. Beginning with births occurring in 2003, several States began
reporting multiple race data. Once all States revise their birth certificates to be compliant
with the 1997 OMB standards, the use of ‘‘bridged’’ populations can be discontinued.
Populations used to calculate the rates for 1991–99 are based on population
estimates as of July 1 of each year and were produced by the U.S. Census Bureau, with
support from the National Cancer Institute [22, 41, 46, 47] These intercensal population
estimates for 1991-99 are revised based on the April 1, 2000 Census. The rates for 1990
and 2000 are based on populations from the censuses in those years as of April 1.
Readers should keep in mind that the population data used to compile birth and
fertility rates by race and ethnicity shown in this report are based on special estimation
procedures, and are not actual counts. This is the case even for the 2000 populations that
are based on the 2000 census. As a result, the estimation procedures used to develop
these populations may contain some errors. Smaller populations, for example, American
Indians, are likely to be affected much more than larger populations by potential
measurement error [22]. While the nature and magnitude of error is unknown, the
potential for error should be kept in mind when evaluating trends and differentials.
33
As more accurate information becomes available, further revisions of the
estimates may be necessary. Additional information on the revised populations is
available at: http://www.cdc.gov/nchs/about/major/dvs/popbridge/popbridge.htm .
Residential population base— Birth rates for the United States, individual States,
and metropolitan areas are based on the total resident populations of the respective areas
(table 4-4). Except as noted these populations exclude the Armed Forces abroad but
include the Armed Forces stationed in each area. The residential population of the birth-
and death-registration States for 1900–1932 and for the United States for 1900–2003 is
shown in table 4-1. In addition, the population including Armed Forces abroad is shown
for the United States. Table D shows the sources for these populations. A detailed
discussion of historical population bases is presented elsewhere [2].
Small populations as denominators— An asterisk (*) is shown in place of any
derived rate based on fewer than 20 births in the numerator, or a population denominator
of less than 50 (unweighted) for decennial years and 75,000 (weighted) for all other years
for the Hispanic subgroups. Rates based on populations below these minimum levels lack
sufficient reliability for analytic purposes.
Net census undercounts and overcounts— Studies conducted by the U.S. Census
Bureau indicate that some age, race, and sex groups are more completely enumerated
than others. Census miscounts can have consequences for vital statistics measures. For
example, an adjustment to increase the population denominator would result in a smaller
rate compared to the unadjusted rate. A more detailed discussion of census undercounts
and overcounts can be found in the “1999 Technical Appendix” [2]. Adjusted rates for
2000 can be computed by multiplying the reported rates by ratios from the 2000 census-
level population adjusted for the estimated age-specific census over- and undercounts,
which are shown in table E.
Cohort fertility tables
The various fertility measures shown for cohorts of women are computed from
births adjusted for underregistration and population estimates corrected for under
enumeration and misstatement of age. Data published after 1974 use revised population
estimates prepared by the U.S. Census Bureau and have been expanded to include data
34
for the two major racial groups. Heuser [48] has prepared a detailed description of the
methods used in deriving these measures as well as more detailed data for earlier years.
The series of cohort fertility tables is currently being revised to incorporate rates for black
women and the revised intercensal population estimates of the 1990s. Tables for the most
currently-available years are available at
http://www.cdc.gov/nchs/datawh/statab/unpubd/natality/natab99.htm .
Parity distribution—The percentage distribution of women by parity (number of
children ever born alive to mother) is derived from cumulative birth rates by order of
birth. The percentage of 0-parity women is found by subtracting the cumulative first birth
rate from 1,000 and dividing by 10. The proportions of women at parities one through six
are found from the following formula:
Percent at N parity = ((cum. rate, order N)-(cum. rate, order N + 1))/10
The percentage of women at seventh and higher parities is found by dividing the
cumulative rate for seventh-order births by 10.
Birth probabilities—Birth probabilities indicate the likelihood that a woman of a
certain parity and age at the beginning of the year will have a child during the year. Birth
probabilities differ from central birth rates in that the denominator for birth probabilities
is specific for parity as well as for age.
Total fertility rates
The total fertility rate is the sum of the birth rates by age of mother (in 5–year age
groups) multiplied by 5. It is an age–adjusted rate because it is based on the assumption
that there is the same number of women in each age group. The rate of 2,043 in 2003, for
example, means that if a hypothetical group of 1,000 women were to have the same birth
rates in each age group that were observed in the actual childbearing population in 2003,
they would have a total of 2,043 children by the time they reached the end of the
reproductive period (taken here to be age 50 years), assuming that all of the women
survived to that age.
Seasonal adjustment of rates
The seasonally adjusted birth and fertility rates are computed from the X–11
variant of Census Method II [49]. This method, used since 1964, differs slightly from the
U.S. Bureau of Labor Statistics (BLS) Seasonal Factor Method, which was used for Vital
35
Statistics of the United States, 1964. The fundamental technique is the same in that it is
an adaptation of the ratio-to-moving-average method. Before 1964, the method of
seasonal adjustment was based on the X–9 variant and other variants of Census Method
II. A comparison of the Census Method II with the BLS Seasonal Factor Method shows
the differences in the seasonal patterns of births to be negligible.
Computations of percentages, percentage distributions, and medians
Births for which a particular characteristic is unknown were subtracted from the
figures for total births that were used as denominators before percentages, percentage
distributions, and medians were computed. The percentage of records with missing
information for each item is shown by State in table A. The median number of prenatal
visits also excludes births to mothers who had no prenatal care. Computations of the
median years of school completed and the median number of prenatal visits were based
on ungrouped data. The median age of mother is computed from birth rates in 5–year age
groups, which eliminates the effects of changes in the age composition of the
childbearing population over time. An asterisk is shown in place of any derived statistic
based on fewer than 20 births in the numerator or denominator.
Computation of Measures of Variability Random variation and significance testing for natality data
This detailed discussion of random variation and significance testing for natality
data is similar to that in the “Technical Notes” of “Births: Final data for 2003” [3]. The
number of births reported for an area is essentially a complete count, because more than
99 percent of all births are registered. Although this number is not subject to sampling
error, it may be affected by nonsampling errors such as mistakes in recording the
mother’s residence or age during the registration process.
When the number of births is used for analytic purposes (that is, for the
comparison of numbers, rates, and percents over time, for different areas, or between
different groups), the number of events that actually occurred can be thought of as one
outcome in a large series of possible results that could have occurred under the same (or
similar) circumstances. When considered in this way, the number of births is subject to
random variation and a probable range of values estimated from the actual figures,
36
according to certain statistical assumptions.
The confidence interval is the range of values for the number of births, birth rates,
or percent of births that you could expect in 95 out of 100 cases. The confidence limits
are the end points of this range of values (the highest and lowest values). Confidence
limits tell you how much the number of events or rates could vary under the same (or
similar) circumstances.
Confidence limits for numbers, rates, and percents can be estimated from the
actual number of vital events. Procedures differ for rates and percents and also differ
depending on the number of births on which these statistics are based. Below are detailed
procedures and examples for each type of case.
When the number of vital events is large, the distribution is assumed to follow a
normal distribution (where the relative standard error is small). When the number of
events is small and the probability of the event is small, the distribution is assumed to
follow a Poisson probability distribution. Considerable caution should be observed in
interpreting the occurrence of infrequent events.
95-percent confidence limits for numbers less than 100 -- When the number of
births is less than 100 and the rate is small, the data are assumed to follow a Poisson
probability distribution [50]. Confidence limits are estimated using the following
formulas:
limit Lower = B × L
limit Upper = B ×U
where:
B = number of births
L = the value in table C that corresponds to the number B
U = the value in table C that corresponds to the number B
Example
Suppose that the number of first births to American Indian women 40-44 years of
age was 47. The confidence limits for this number would be:
37
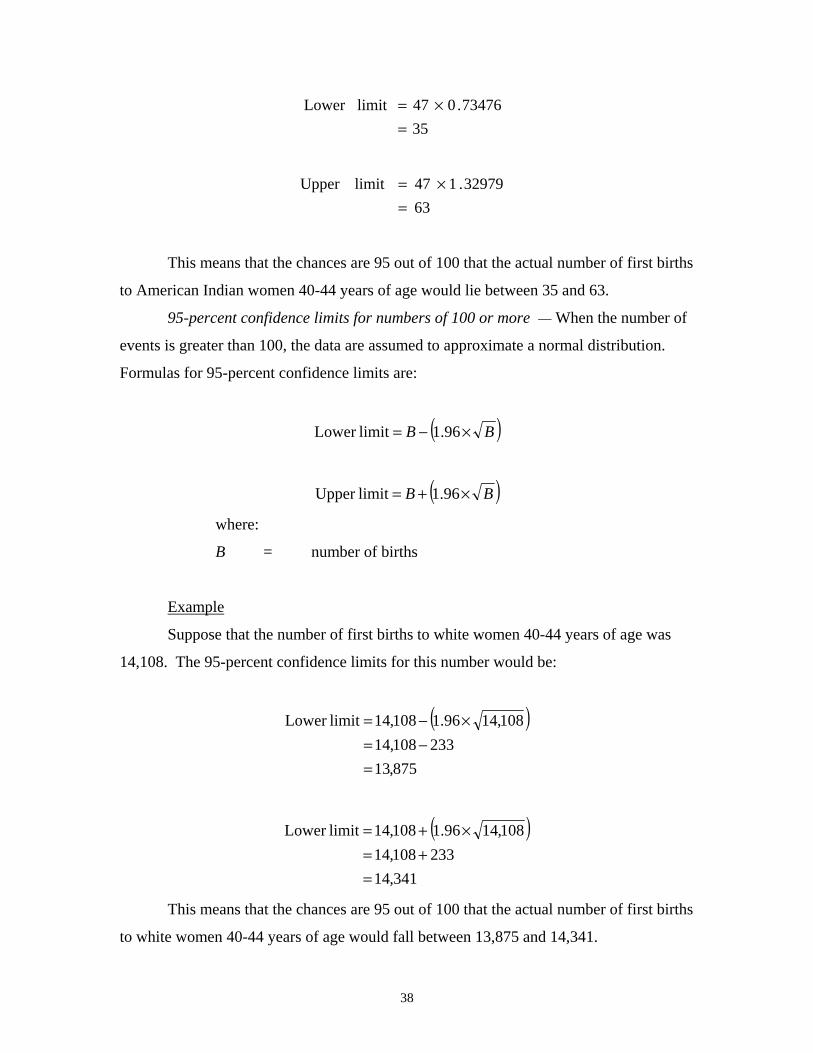
Lower limit = 47 × 73476 . 0 = 35
Upper limit = 47 × 32979 . 1 = 63
This means that the chances are 95 out of 100 that the actual number of first births
to American Indian women 40-44 years of age would lie between 35 and 63.
95-percent confidence limits for numbers of 100 or more –– When the number of
events is greater than 100, the data are assumed to approximate a normal distribution.
Formulas for 95-percent confidence limits are:
limit Lower = B − ( 96.1 × B )
limit Upper = B + ( 96.1 × B )where:
B = number of births
Example
Suppose that the number of first births to white women 40-44 years of age was
14,108. The 95-percent confidence limits for this number would be:
limit Lower = 108,14 − ( 96.1 × 108,14 ) = 108,14 − 233 = 875,13
limit Lower = 108,14 + ( 96.1 × 108,14 ) = 108,14 + 233 = 341,14
This means that the chances are 95 out of 100 that the actual number of first births
to white women 40-44 years of age would fall between 13,875 and 14,341.
38
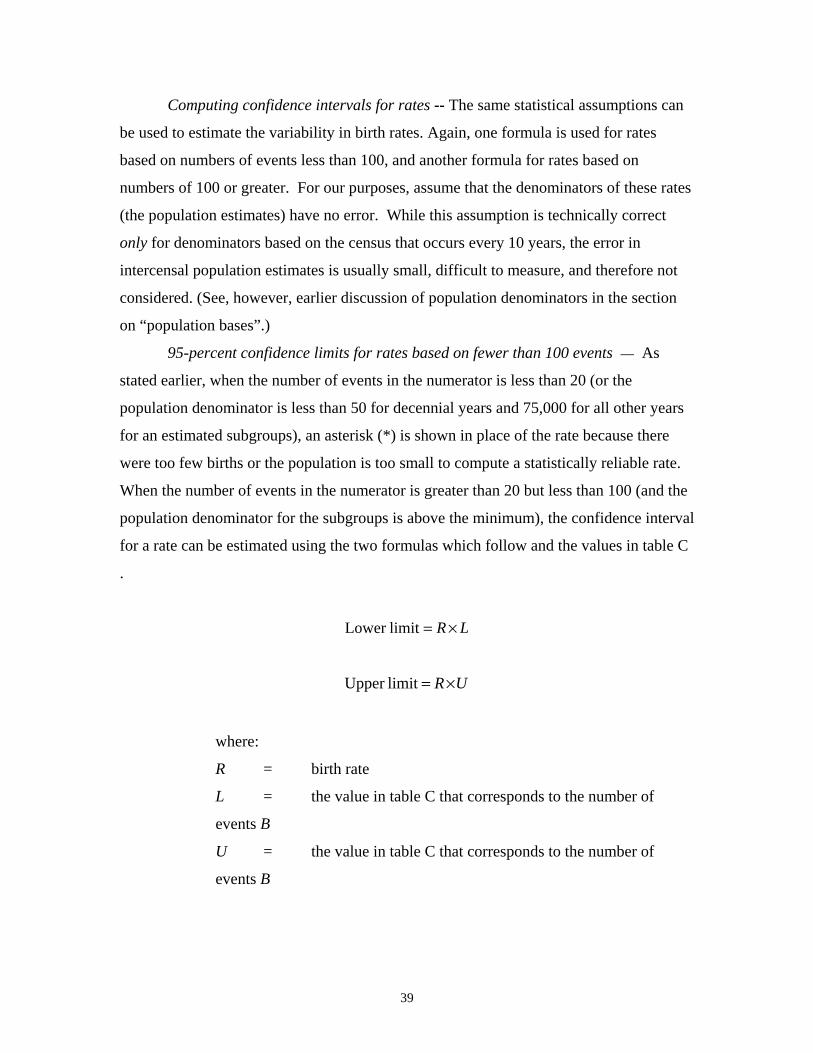
Computing confidence intervals for rates -- The same statistical assumptions can
be used to estimate the variability in birth rates. Again, one formula is used for rates
based on numbers of events less than 100, and another formula for rates based on
numbers of 100 or greater. For our purposes, assume that the denominators of these rates
(the population estimates) have no error. While this assumption is technically correct
only for denominators based on the census that occurs every 10 years, the error in
intercensal population estimates is usually small, difficult to measure, and therefore not
considered. (See, however, earlier discussion of population denominators in the section
on “population bases”.)
95-percent confidence limits for rates based on fewer than 100 events –– As
stated earlier, when the number of events in the numerator is less than 20 (or the
population denominator is less than 50 for decennial years and 75,000 for all other years
for an estimated subgroups), an asterisk (*) is shown in place of the rate because there
were too few births or the population is too small to compute a statistically reliable rate.
When the number of events in the numerator is greater than 20 but less than 100 (and the
population denominator for the subgroups is above the minimum), the confidence interval
for a rate can be estimated using the two formulas which follow and the values in table C
.
limit Lower = R × L
limit Upper = R ×U
where:
R = birth rate
L = the value in table C that corresponds to the number of
events B
U = the value in table C that corresponds to the number of
events B
39

Example
Suppose that the first birth rate for American Indian women 40-44 years of age
was 0.50 per thousand, based on 47 births in the numerator. Using table C:
limit Lower = 50.0 × 73476.0 = 37.0
limit Upper = 50.0 × 32979.1 = 66.0
This means that the chances are 95 out of 100 that the actual first birth rate for
American Indian women 40-44 years of age would be between 0.37 and 0.66.
95-percent confidence limits for rates when the numerator is 100 or more -- In
this case, use the following formula for the birth rate R based on the number of births B:
limit Lower = R − ( 96.1 × (R / B ))
limit Upper = R + ( 96.1 × (R / B ))
where:
R = birth rate
B = number of births
Example
Suppose that the first birth rate for white women 40-44 years of age was 1.55 per
thousand, based on 14,108 births in the numerator. Therefore, the 95-percent confidence
interval would be:
limit Lower = 55.1 − ( 96.1 × ( 55.1 / 108,14 )) = 55.1 − 026.0 = 52.1
40
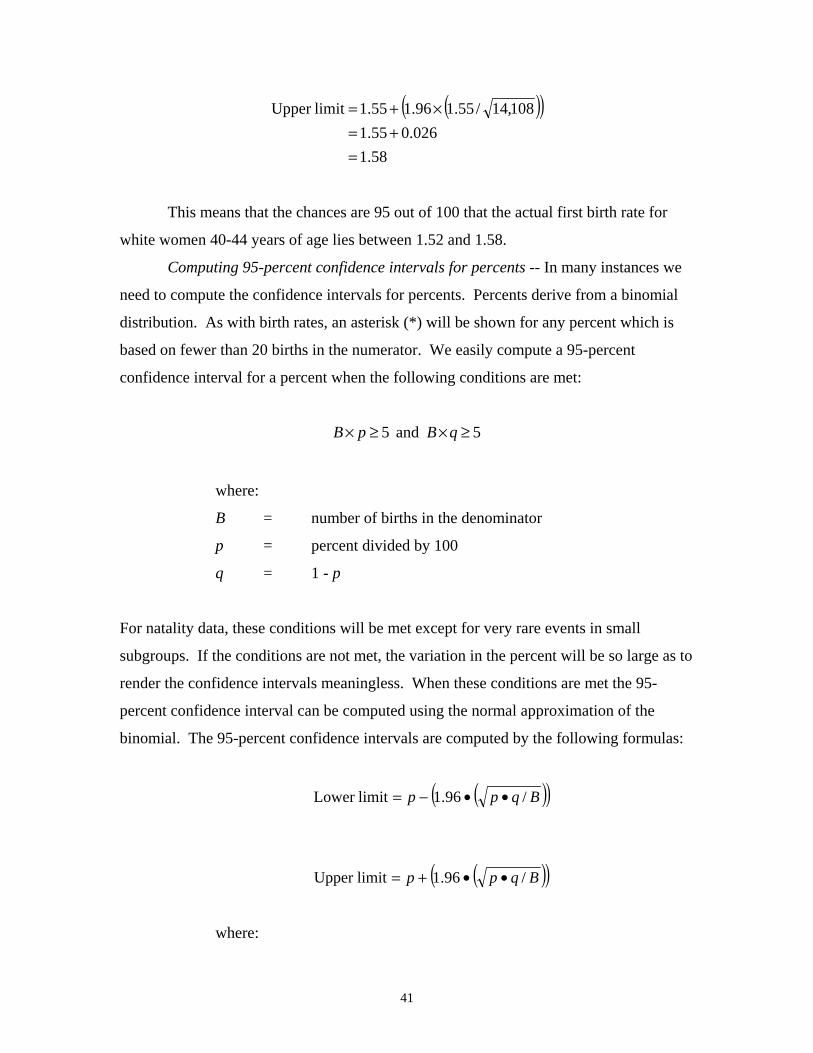
limit Upper = 55.1 + ( 96.1 × ( 55.1 / 108,14 )) = 55.1 + 026.0 = 58.1
This means that the chances are 95 out of 100 that the actual first birth rate for
white women 40-44 years of age lies between 1.52 and 1.58.
Computing 95-percent confidence intervals for percents -- In many instances we
need to compute the confidence intervals for percents. Percents derive from a binomial
distribution. As with birth rates, an asterisk (*) will be shown for any percent which is
based on fewer than 20 births in the numerator. We easily compute a 95-percent
confidence interval for a percent when the following conditions are met:
B × p ≥ and 5 B × q ≥ 5
where:
B = number of births in the denominator
p = percent divided by 100
q = 1 - p
For natality data, these conditions will be met except for very rare events in small
subgroups. If the conditions are not met, the variation in the percent will be so large as to
render the confidence intervals meaningless. When these conditions are met the 95
percent confidence interval can be computed using the normal approximation of the
binomial. The 95-percent confidence intervals are computed by the following formulas:
limit Lower = p − ( 96 . 1 • ( p • q / B ))
limit Upper = p + ( 96. 1 • ( p • q / B ))
where:
41
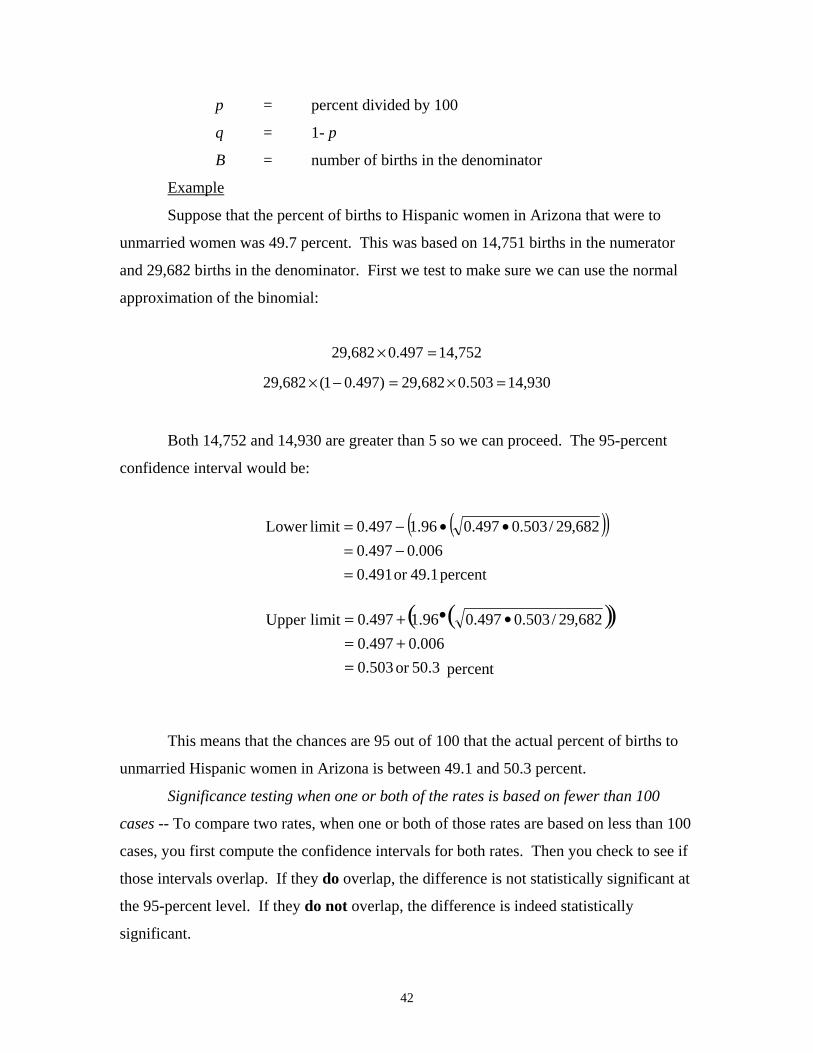
p = percent divided by 100
q = 1- p
B = number of births in the denominator
Example
Suppose that the percent of births to Hispanic women in Arizona that were to
unmarried women was 49.7 percent. This was based on 14,751 births in the numerator
and 29,682 births in the denominator. First we test to make sure we can use the normal
approximation of the binomial:
29,682 × 0.497 = 752,14
29,682 × (1− 0.497) = 682,29 × 503.0 = 930,14
Both 14,752 and 14,930 are greater than 5 so we can proceed. The 95-percent
confidence interval would be:
limitLower = 497.0 − ( 96.1 • ( 497.0 • 503.0 / 682,29 )) = 497.0 − 006.0 = percent49.1or.4910
Upper limit = 497.0 +( 96.1 •( 497.0 • 503.0 / 682,29 ))= 497.0 + 006.0 = .5030 or 50.3 percent
This means that the chances are 95 out of 100 that the actual percent of births to
unmarried Hispanic women in Arizona is between 49.1 and 50.3 percent.
Significance testing when one or both of the rates is based on fewer than 100
cases -- To compare two rates, when one or both of those rates are based on less than 100
cases, you first compute the confidence intervals for both rates. Then you check to see if
those intervals overlap. If they do overlap, the difference is not statistically significant at
the 95-percent level. If they do not overlap, the difference is indeed statistically
significant.
42
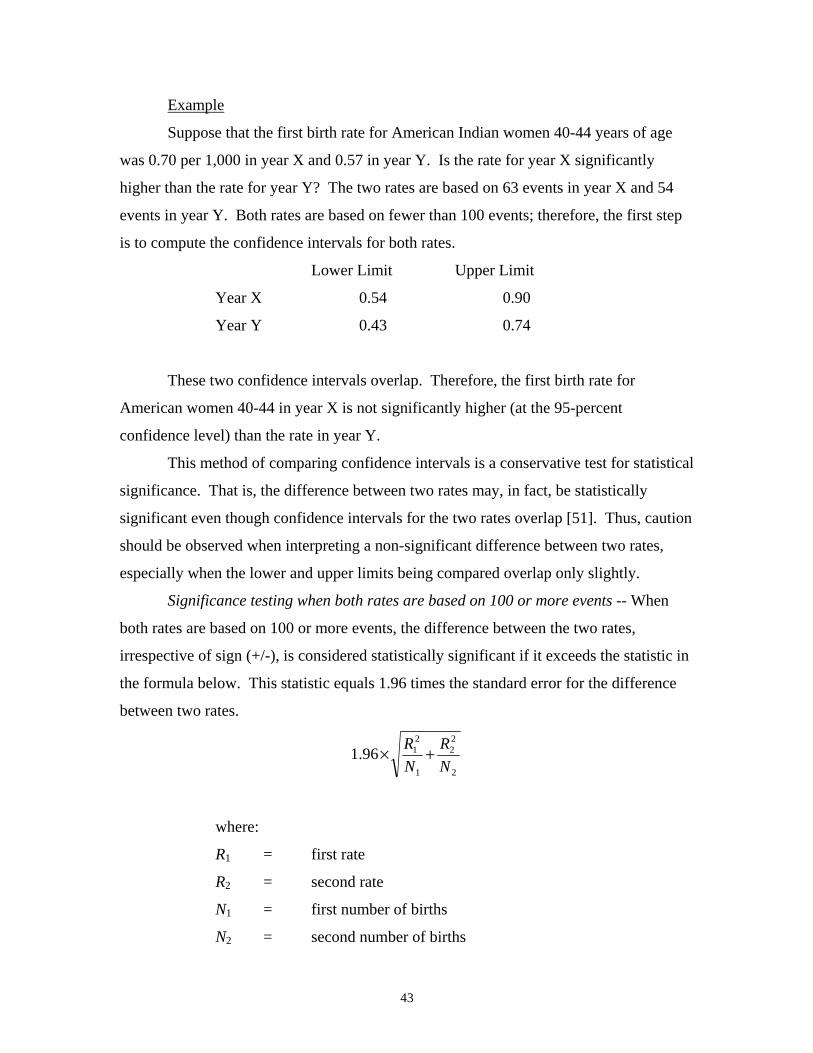
Example
Suppose that the first birth rate for American Indian women 40-44 years of age
was 0.70 per 1,000 in year X and 0.57 in year Y. Is the rate for year X significantly
higher than the rate for year Y? The two rates are based on 63 events in year X and 54
events in year Y. Both rates are based on fewer than 100 events; therefore, the first step
is to compute the confidence intervals for both rates.
Lower Limit Upper Limit
Year X 0.54 0.90
Year Y 0.43 0.74
These two confidence intervals overlap. Therefore, the first birth rate for
American women 40-44 in year X is not significantly higher (at the 95-percent
confidence level) than the rate in year Y.
This method of comparing confidence intervals is a conservative test for statistical
significance. That is, the difference between two rates may, in fact, be statistically
significant even though confidence intervals for the two rates overlap [51]. Thus, caution
should be observed when interpreting a non-significant difference between two rates,
especially when the lower and upper limits being compared overlap only slightly.
Significance testing when both rates are based on 100 or more events -- When
both rates are based on 100 or more events, the difference between the two rates,
irrespective of sign (+/-), is considered statistically significant if it exceeds the statistic in
the formula below. This statistic equals 1.96 times the standard error for the difference
between two rates. 2 2R1 R296.1 × +
N1 N 2
where:
R1 = first rate
R2 = second rate
N1 = first number of births
N2 = second number of births
43
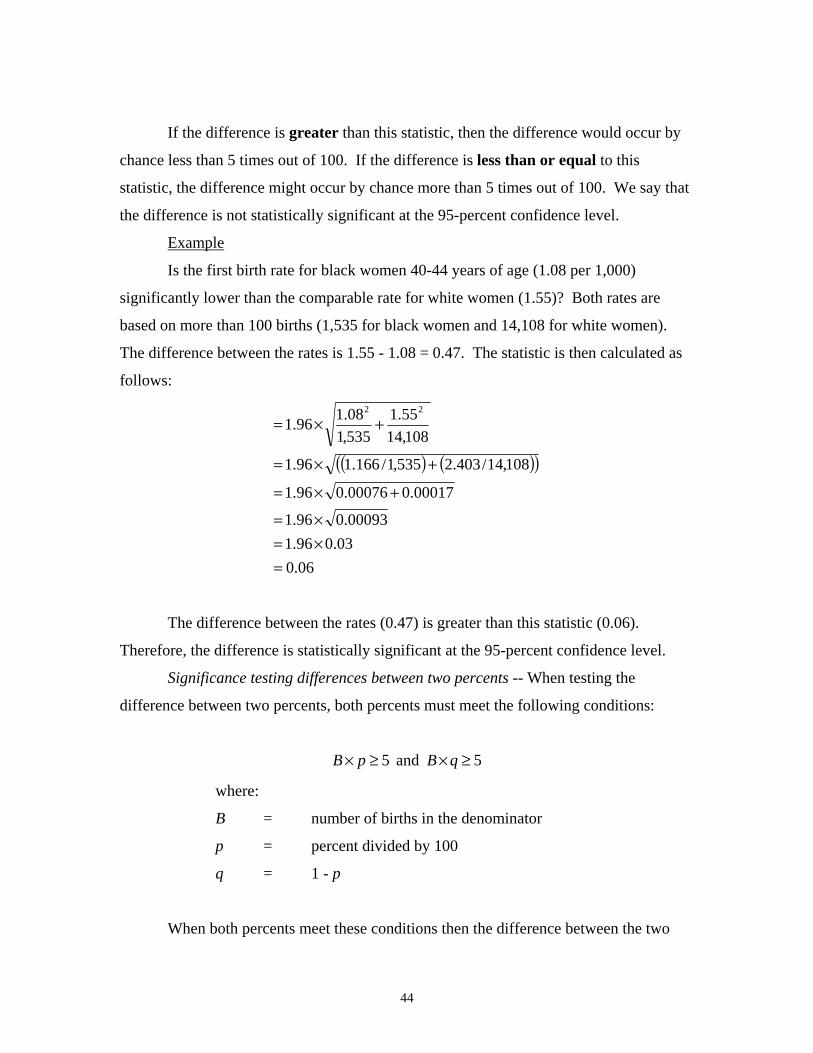
If the difference is greater than this statistic, then the difference would occur by
chance less than 5 times out of 100. If the difference is less than or equal to this
statistic, the difference might occur by chance more than 5 times out of 100. We say that
the difference is not statistically significant at the 95-percent confidence level.
Example
Is the first birth rate for black women 40-44 years of age (1.08 per 1,000)
significantly lower than the comparable rate for white women (1.55)? Both rates are
based on more than 100 births (1,535 for black women and 14,108 for white women).
The difference between the rates is 1.55 - 1.08 = 0.47. The statistic is then calculated as
follows:
( ) ( )( )//
22
×=
+×=
+×=
+×=
00093.0 96. 1
00017.0 00076.0 96.1
108,14 403. 2 535,1 166.1 96.1
108,14 55.1
535,1 08.1 96.1
= 96. 1 × 03.0
= 06.0
The difference between the rates (0.47) is greater than this statistic (0.06).
Therefore, the difference is statistically significant at the 95-percent confidence level.
Significance testing differences between two percents -- When testing the
difference between two percents, both percents must meet the following conditions:
B × p ≥ and 5 B × q ≥ 5
where:
B = number of births in the denominator
p = percent divided by 100
q = 1 - p
When both percents meet these conditions then the difference between the two
44
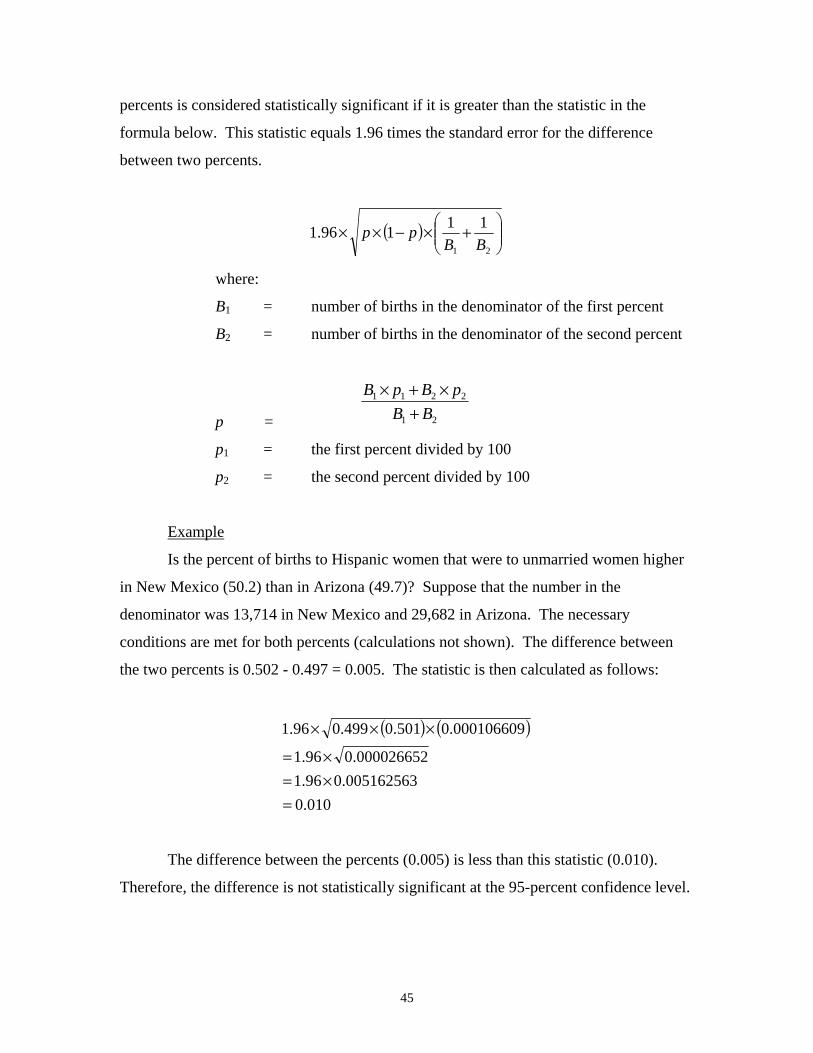
percents is considered statistically significant if it is greater than the statistic in the
formula below. This statistic equals 1.96 times the standard error for the difference
between two percents.
( ) ⎟⎜×−× 1⎛⎜ ⎝
⎞⎟ ⎠
1 196.1 × +p p B1 B2
where:
B1 = number of births in the denominator of the first percent
B2 = number of births in the denominator of the second percent
1B × 1p 2B+ × 2p
p = 1B 2B+
p1 = the first percent divided by 100
p2 = the second percent divided by 100
Example
Is the percent of births to Hispanic women that were to unmarried women higher
in New Mexico (50.2) than in Arizona (49.7)? Suppose that the number in the
denominator was 13,714 in New Mexico and 29,682 in Arizona. The necessary
conditions are met for both percents (calculations not shown). The difference between
the two percents is 0.502 - 0.497 = 0.005. The statistic is then calculated as follows:
96.1 499 . 0 ( 501.0 ) ( 000106609 . 0 ) 000026652 . 0
× × ×
= 96 . 1 × = 96 . 1 × 005162563.0 = 010.0
The difference between the percents (0.005) is less than this statistic (0.010).
Therefore, the difference is not statistically significant at the 95-percent confidence level.
45
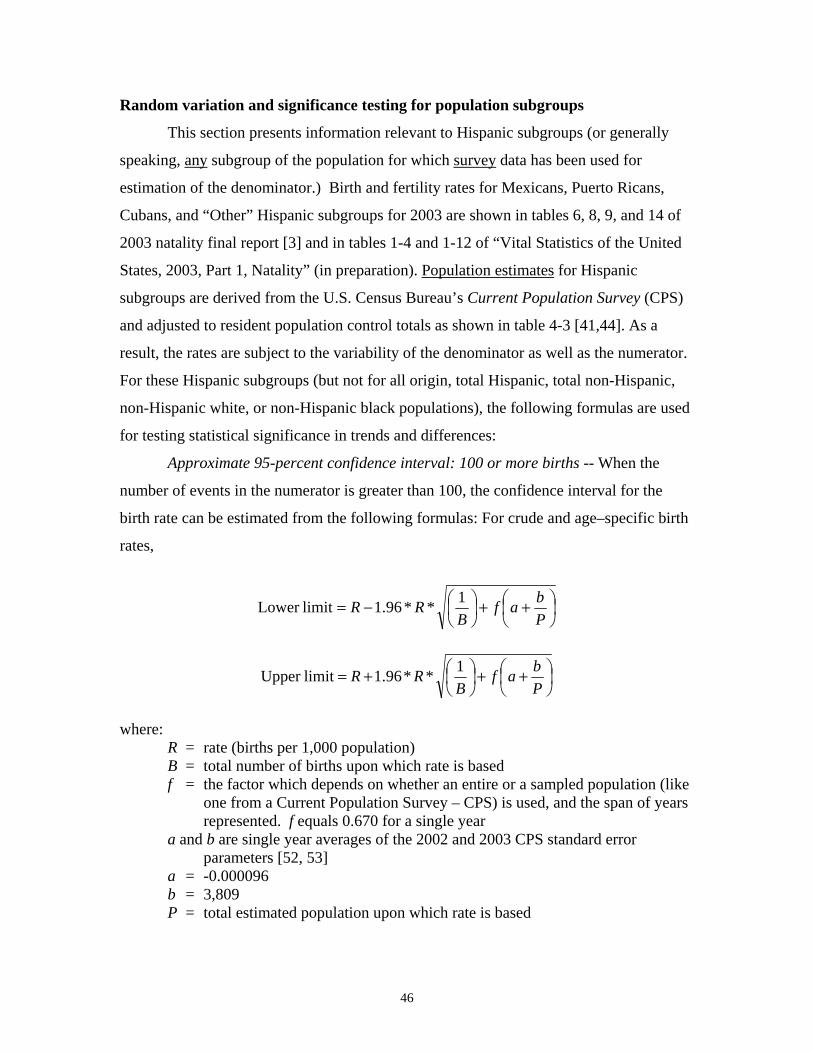
Random variation and significance testing for population subgroups
This section presents information relevant to Hispanic subgroups (or generally
speaking, any subgroup of the population for which survey data has been used for
estimation of the denominator.) Birth and fertility rates for Mexicans, Puerto Ricans,
Cubans, and “Other” Hispanic subgroups for 2003 are shown in tables 6, 8, 9, and 14 of
2003 natality final report [3] and in tables 1-4 and 1-12 of “Vital Statistics of the United
States, 2003, Part 1, Natality” (in preparation). Population estimates for Hispanic
subgroups are derived from the U.S. Census Bureau’s Current Population Survey (CPS)
and adjusted to resident population control totals as shown in table 4-3 [41,44]. As a
result, the rates are subject to the variability of the denominator as well as the numerator.
For these Hispanic subgroups (but not for all origin, total Hispanic, total non-Hispanic,
non-Hispanic white, or non-Hispanic black populations), the following formulas are used
for testing statistical significance in trends and differences:
Approximate 95-percent confidence interval: 100 or more births -- When the
number of events in the numerator is greater than 100, the confidence interval for the
birth rate can be estimated from the following formulas: For crude and age–specific birth
rates,
⎟⎠⎞
⎜⎝⎛ ++⎟
⎠⎞
⎜⎝⎛
P b af
B 1
1 b⎛⎜⎝
⎞⎟⎠
⎛⎜⎝
⎞⎟⎠
limit Lower R R− * 96.1 * f+ a += B P
limit Upper R R* 96 . 1 *+=
where: R = rate (births per 1,000 population) B = total number of births upon which rate is based f = the factor which depends on whether an entire or a sampled population (like
one from a Current Population Survey – CPS) is used, and the span of years represented. f equals 0.670 for a single year
a and b are single year averages of the 2002 and 2003 CPS standard error parameters [52, 53]
a = -0.000096 b = 3,809 P = total estimated population upon which rate is based
46
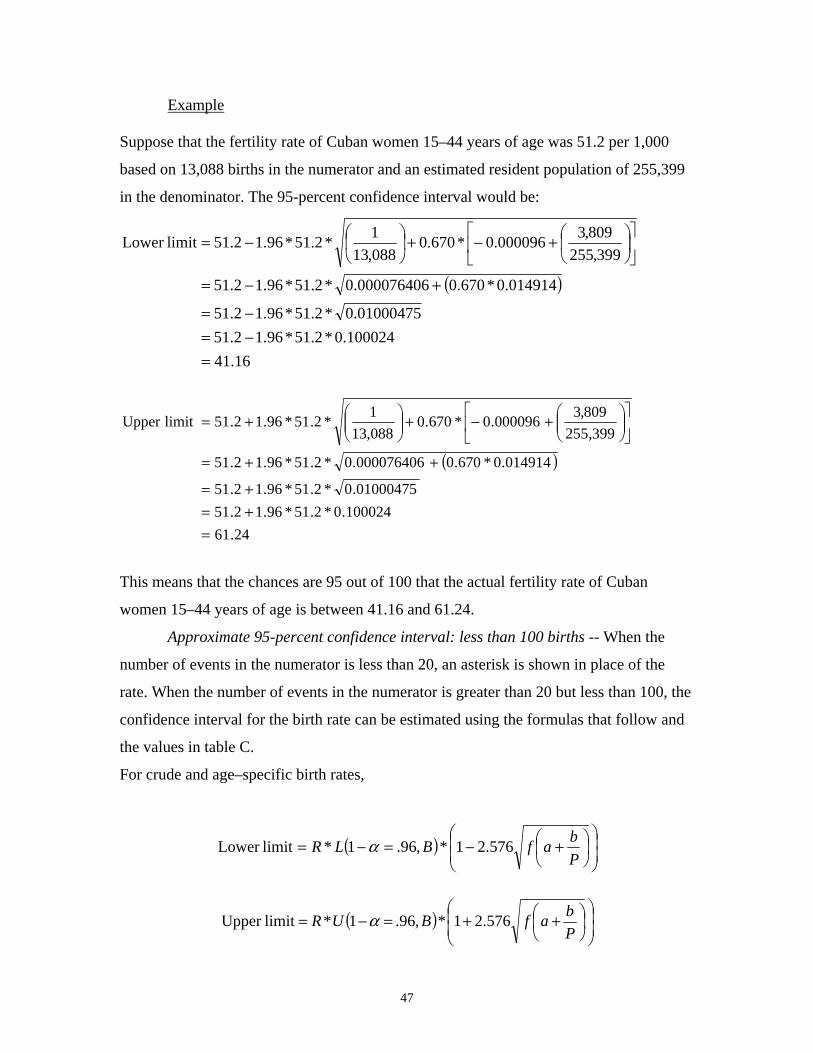
Example
Suppose that the fertility rate of Cuban women 15–44 years of age was 51.2 per 1,000
based on 13,088 births in the numerator and an estimated resident population of 255,399
in the denominator. The 95-percent confidence interval would be:
⎡ ⎤1 809,3⎛⎜⎝
⎞⎟⎠
⎛⎜⎝
⎞⎟⎠
limitLower 2.51 − *2.51*96.1 *670.0 − 000096.0+ += ⎢⎣
⎥⎦088,13 399,255
000076406.0 ( 014914.0*670.0 ) = 2.51 − *2.51*96.1 01000475.0 = 2.51 − 100024.0*2.51*96.1 = 16.41
2.51 − *2.51*96.1 +=
⎡ ⎤1 809,3⎛ ⎞ ⎛ ⎞Upper limit 2.51 *2.51*96.1 *670.0 − 000096.0+ + += ⎢⎣
⎥⎦
⎜⎜⎝
⎟⎟⎠
⎜⎜⎝
⎟⎟⎠088,13 399,255
000076406.0 ( 014914.0*670.0 ) = 2.51 + *2.51*96.1 01000475.0 = 2.51 + 100024.0*2.51*96.1 = 24.61
This means that the chances are 95 out of 100 that the actual fertility rate of Cuban
women 15–44 years of age is between 41.16 and 61.24.
Approximate 95-percent confidence interval: less than 100 births -- When the
number of events in the numerator is less than 20, an asterisk is shown in place of the
rate. When the number of events in the numerator is greater than 20 but less than 100, the
confidence interval for the birth rate can be estimated using the formulas that follow and
the values in table C.
For crude and age–specific birth rates,
2.51 *2.51*96.1+ +=
⎛⎜⎜
⎞⎟⎟
b⎛⎜⎝
⎞⎟⎠
limitLower = R * L(1 −α = ,96. B)* f1 − 576.2 a + P⎝ ⎠
⎛⎜⎜
⎞⎟⎟
b⎛⎜⎝
⎞⎟⎠
UR (1 −α = ,96. B)*limitUpper = * 1+ 576.2 f +a P⎝ ⎠
47
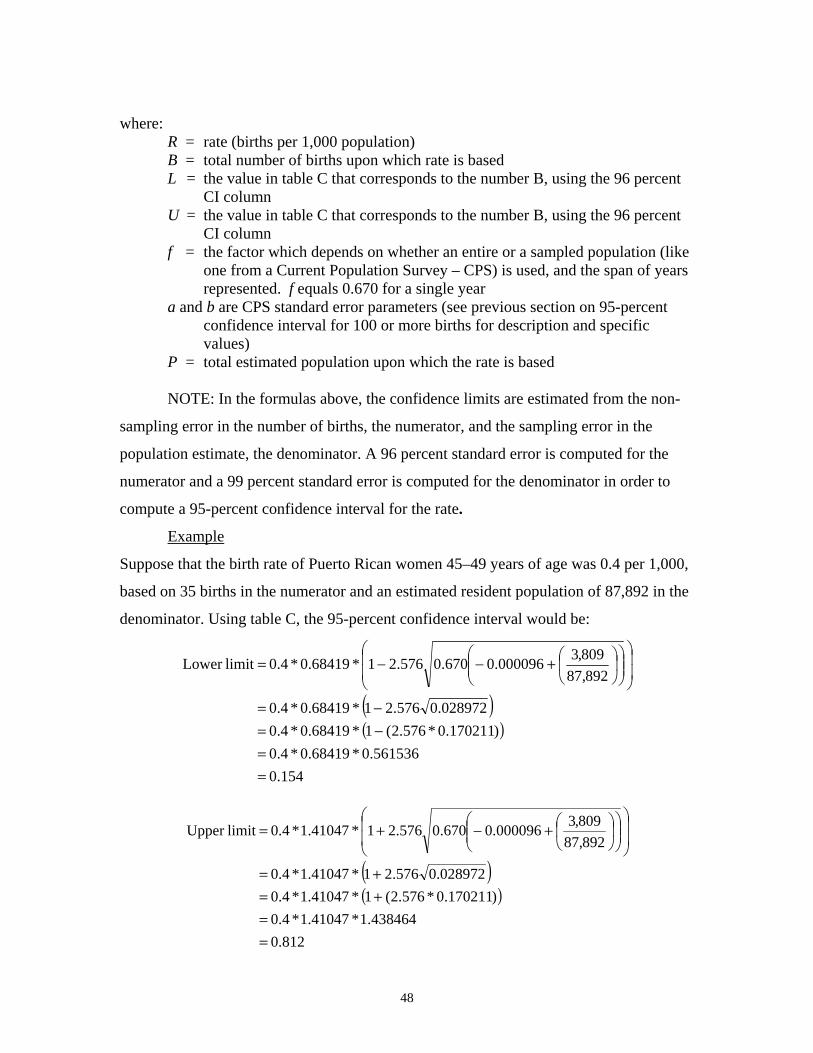
where: R = rate (births per 1,000 population) B = total number of births upon which rate is based L = the value in table C that corresponds to the number B, using the 96 percent
CI column U = the value in table C that corresponds to the number B, using the 96 percent
CI column f = the factor which depends on whether an entire or a sampled population (like
one from a Current Population Survey – CPS) is used, and the span of years represented. f equals 0.670 for a single year
a and b are CPS standard error parameters (see previous section on 95-percent confidence interval for 100 or more births for description and specific values)
P = total estimated population upon which the rate is based
NOTE: In the formulas above, the confidence limits are estimated from the non-
sampling error in the number of births, the numerator, and the sampling error in the
population estimate, the denominator. A 96 percent standard error is computed for the
numerator and a 99 percent standard error is computed for the denominator in order to
compute a 95-percent confidence interval for the rate.
Example
Suppose that the birth rate of Puerto Rican women 45–49 years of age was 0.4 per 1,000,
based on 35 births in the numerator and an estimated resident population of 87,892 in the
denominator. Using table C, the 95-percent confidence interval would be:
) )
⎟⎟
⎠
⎞ ⎟⎟ ⎠
⎞ ⎜⎜ ⎝
⎛⎟ ⎠
⎞⎜ ⎝
⎛+−
028972.0
892,87 809,3 000096.0 670.0 576.2
⎛⎜⎜* 68419.0 * 4.0 1limit Lower −=⎝
(= 1 * 68419.0 * 4.0 − 576.2 (= 1 * 68419.0 * 4.0 − ( 170211.0 * 576.2 )
= 561536. 0 * 68419.0 * 4.0 = 154. 0
) )
⎟⎟
⎠
⎞ ⎟⎟ ⎠
⎞ ⎜⎜ ⎝
⎛⎟ ⎠
⎞⎜ ⎝
⎛+−
028972.0
892,87 809,3 000096.0 670.0 576.2
⎛⎜⎜* 41047.1 * 4 .0 1limit Upper +=⎝
(= 1 * 41047.1 * 4 .0 + 576. 2 (= 1 * 41047.1 * 4 .0 + ( 170211. 0 * 576.2 )
= 438464.1 * 41047.1 * 4 .0 = 812.0
48

This means that the chances are 95 out of 100 that the actual birth rate of Puerto Rican
women 45–49 years of age lies between 0.15 and 0.81.
Significance testing for subgroups -- When both rates are based on 100 or more
events, the difference between the two rates is considered statistically significant if it
exceeds the value given by the formula below. This statistic equals 1.96 times the
standard error for the difference between two rates.
⎢ ⎣
⎟⎜+⎟⎜⎜ ⎝
⎢ ⎣
⎟⎜+⎟⎜⎜ ⎝
⎛⎡ ⎤ ⎛⎡ ⎤⎞⎟ ⎠
⎛⎜ ⎝
⎞⎟ ⎠
⎞⎟ ⎠
⎛⎜ ⎝
⎞⎟ ⎠
b b1 12 2R1 f R fz = * 96.1 * *+ + +⎥⎦
⎥⎦
a a2B1 P1 B P22
If the difference is greater than this statistic, then the difference would occur by chance
less than 5 times out of 100. If the difference is less than this statistic, the difference
might occur by chance more than 5 times out of 100. We would therefore conclude that
the difference is not statistically significant at the 95-percent confidence level.
Example
Suppose the birth rate for Mexican mothers 15–19 years of age (R1) is 94.5, based on
97,744 births and an estimated population of 1,033,878, and the birth rate for Puerto
Rican mothers 15–19 years of age (R2) is 61.4, based on 10,006 births and an estimated
population of 162,899. Using the above formula, the z score is computed as follows:
⎛⎜⎝
⎛⎜⎝
809,3 * 96.1 5.94 670 .0 670.0 ⎡ ⎤ ⎡1 1 809,3 ⎛⎜⎝⎢⎣
⎞⎟⎠
⎞⎟⎠
⎛⎜⎝
⎞⎟⎠
2 2* − 000096 .0 4.61 * − 000096.0 + + + + += ⎥⎦
⎢⎣744,97 878,033,1 006 ,10 899,162
( ) ( )00009994.0 96 . 3769 000010231 . 0 * 25 . 8930 * 96 . 1 003589 . 0 * 670 . 0 023287.0 * 670.0 + + +=
( 0024147 .0 * 25.8930 ) ( 015702.0 * 96. 3769 ) = * 96.1 563.21 + 20.59 = 99.8 * 96.1 = 61.17
Since the difference between the two rates 33.1 is greater than the value above, the two
rates are statistically significantly different at the 0.05 level of significance.
* 96 .1 +=
49
⎤⎥⎦
⎞⎟⎠
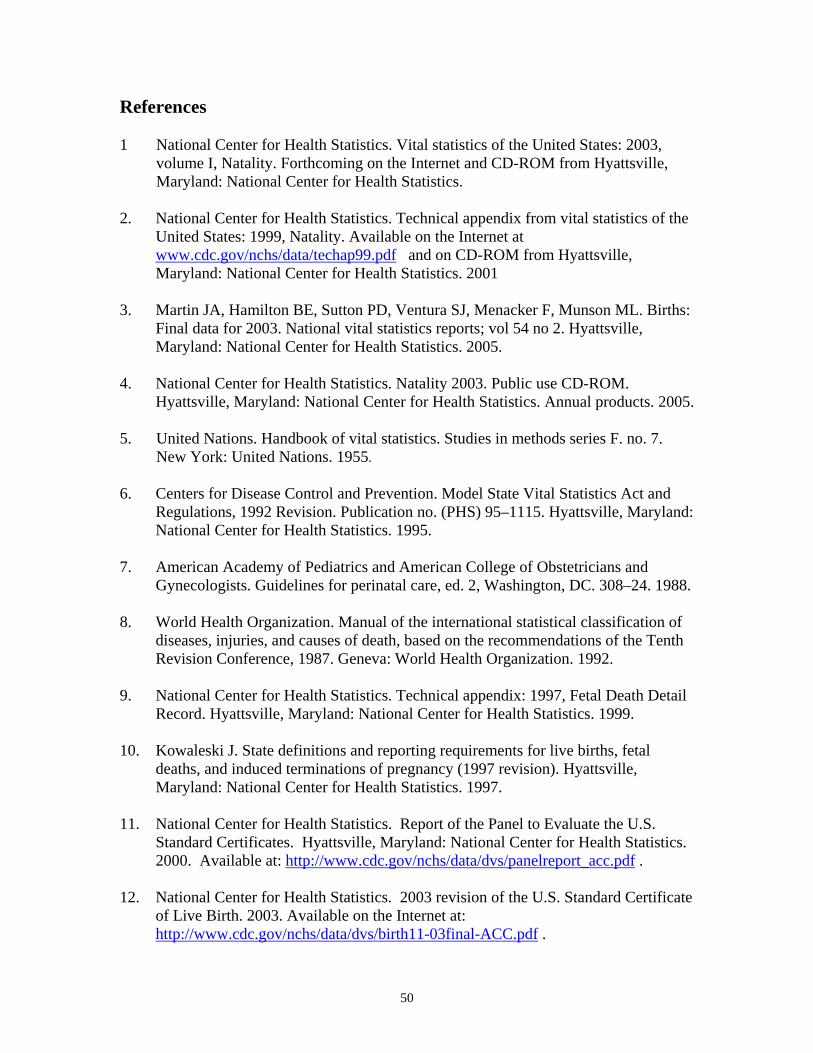
1
References
National Center for Health Statistics. Vital statistics of the United States: 2003, volume I, Natality. Forthcoming on the Internet and CD-ROM from Hyattsville, Maryland: National Center for Health Statistics.
2. National Center for Health Statistics. Technical appendix from vital statistics of the United States: 1999, Natality. Available on the Internet at www.cdc.gov/nchs/data/techap99.pdf and on CD-ROM from Hyattsville, Maryland: National Center for Health Statistics. 2001
3. Martin JA, Hamilton BE, Sutton PD, Ventura SJ, Menacker F, Munson ML. Births: Final data for 2003. National vital statistics reports; vol 54 no 2. Hyattsville, Maryland: National Center for Health Statistics. 2005.
4. National Center for Health Statistics. Natality 2003. Public use CD-ROM. Hyattsville, Maryland: National Center for Health Statistics. Annual products. 2005.
5. United Nations. Handbook of vital statistics. Studies in methods series F. no. 7. New York: United Nations. 1955.
6. Centers for Disease Control and Prevention. Model State Vital Statistics Act and Regulations, 1992 Revision. Publication no. (PHS) 95–1115. Hyattsville, Maryland: National Center for Health Statistics. 1995.
7. American Academy of Pediatrics and American College of Obstetricians and Gynecologists. Guidelines for perinatal care, ed. 2, Washington, DC. 308–24. 1988.
8. World Health Organization. Manual of the international statistical classification of diseases, injuries, and causes of death, based on the recommendations of the Tenth Revision Conference, 1987. Geneva: World Health Organization. 1992.
9. National Center for Health Statistics. Technical appendix: 1997, Fetal Death Detail Record. Hyattsville, Maryland: National Center for Health Statistics. 1999.
10. Kowaleski J. State definitions and reporting requirements for live births, fetal deaths, and induced terminations of pregnancy (1997 revision). Hyattsville, Maryland: National Center for Health Statistics. 1997.
11. National Center for Health Statistics. Report of the Panel to Evaluate the U.S. Standard Certificates. Hyattsville, Maryland: National Center for Health Statistics. 2000. Available at: http://www.cdc.gov/nchs/data/dvs/panelreport_acc.pdf .
12. National Center for Health Statistics. 2003 revision of the U.S. Standard Certificate of Live Birth. 2003. Available on the Internet at: http://www.cdc.gov/nchs/data/dvs/birth11-03final-ACC.pdf .
50

13. National Center for Health Statistics. Birth edit specifications for the 2003 Revision of the U.S. Standard Certificate of Birth. 2005. Available on the Internet at: http://www.cdc.gov/nchs/data/dvs/FinalBirthSpecs3-24-2005.pdf .
14. National Center for Health Statistics. Guide to completing the facility worksheets for the Certificate of Live Birth and Report of Fetal Death (2003 revision). Hyattsville, Maryland: National Center for Health Statistics. Available on the Internet at: http://www.cdc.gov/nchs/data/dvs/GuidetoCompleteFacilityWks.pdf .
15. Division of Vital Statistics. Instruction manual part 3a: Classification and coding instructions for birth records, 1999-2001. Hyattsville, Maryland: National Center for Health Statistics. Available on the Internet at www.cdc.gov/nchs/data/dvs/3amanual.pdf
16. U.S. Department of Health, Education and Welfare, Public Health Service, Office of Vital Statistics. Birth registration completeness in the United States and geographic areas, 1950; vol 39 no 2. 1954.
17. National Center for Health Statistics. Instruction manual, part 8. Vital records, geographic classification, 2003. Vital statistics, data preparation. Hyattsville, Maryland: National Center for Health Statistics. 2002. Available on the Internet at: http://www.cdc.gov/nchs/data/dvs/IMP8_PrintVersion.pdf
18. National Center for Health Statistics. Instruction manual, part 8A. Vital records, geographic codes, 2004. Federal information processing standards (FIPS). Hyattsville, Maryland: National Center for Health Statistics. 2003. Available on the Internet at: http://www.cdc.gov/nchs/data/dvs/IMP8A_PrintVersion.pdf
19. National Center for Health Statistics. Technical appendix. Vital statistics of the United States, 2002, vol I, natality. Available on the Internet at: http://www.cdc.gov/nchs/data/techap02.pdf and on CD-ROM from Hyattsville, Maryland: National Center for Health Statistics. 2004
20. Office of Management and Budget. Race and ethnic standards for Federal statistics and administrative reporting. Statistical Policy Directive 15. 1977.
21. Office of Management and Budget. Revisions to the standards for the classification of Federal data on race and ethnicity. Federal Register 62FR58781-58790. October 30, 1997.
22. Ingram DD, Parker JD, Schenker N, Weed JA, Hamilton B, Arias E, Madans JH. United States Census 2000 with bridged race categories. National Center for Health Statistics. Vital Health Stat 2(135). 2003.
23. Schenker N, Parker JD. From single-race reporting to multiple-race reporting: Using imputation methods to bridge the transition. Stat Med 22(9):1571–87. 2003.
51
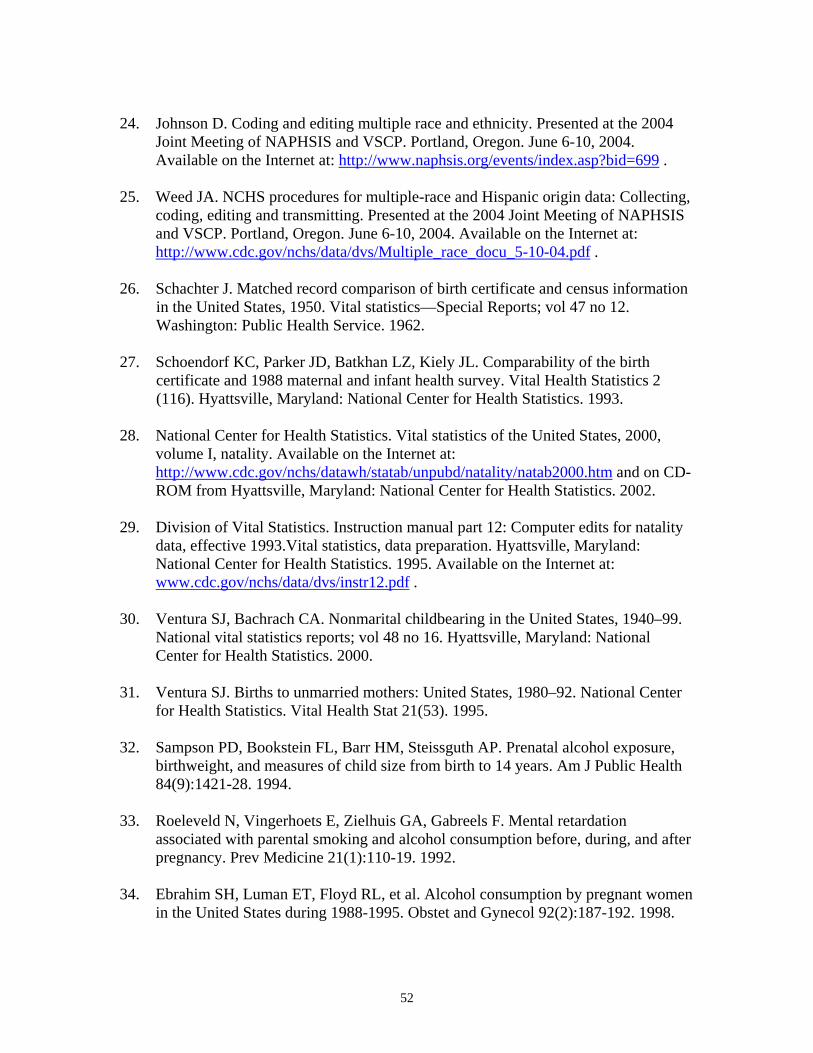
24. Johnson D. Coding and editing multiple race and ethnicity. Presented at the 2004 Joint Meeting of NAPHSIS and VSCP. Portland, Oregon. June 6-10, 2004. Available on the Internet at: http://www.naphsis.org/events/index.asp?bid=699 .
25. Weed JA. NCHS procedures for multiple-race and Hispanic origin data: Collecting, coding, editing and transmitting. Presented at the 2004 Joint Meeting of NAPHSIS and VSCP. Portland, Oregon. June 6-10, 2004. Available on the Internet at: http://www.cdc.gov/nchs/data/dvs/Multiple_race_docu_5-10-04.pdf .
26. Schachter J. Matched record comparison of birth certificate and census information in the United States, 1950. Vital statistics—Special Reports; vol 47 no 12. Washington: Public Health Service. 1962.
27. Schoendorf KC, Parker JD, Batkhan LZ, Kiely JL. Comparability of the birth certificate and 1988 maternal and infant health survey. Vital Health Statistics 2 (116). Hyattsville, Maryland: National Center for Health Statistics. 1993.
28. National Center for Health Statistics. Vital statistics of the United States, 2000, volume I, natality. Available on the Internet at: http://www.cdc.gov/nchs/datawh/statab/unpubd/natality/natab2000.htm and on CDROM from Hyattsville, Maryland: National Center for Health Statistics. 2002.
29. Division of Vital Statistics. Instruction manual part 12: Computer edits for natality data, effective 1993.Vital statistics, data preparation. Hyattsville, Maryland: National Center for Health Statistics. 1995. Available on the Internet at: www.cdc.gov/nchs/data/dvs/instr12.pdf .
30. Ventura SJ, Bachrach CA. Nonmarital childbearing in the United States, 1940–99. National vital statistics reports; vol 48 no 16. Hyattsville, Maryland: National Center for Health Statistics. 2000.
31. Ventura SJ. Births to unmarried mothers: United States, 1980–92. National Center for Health Statistics. Vital Health Stat 21(53). 1995.
32. Sampson PD, Bookstein FL, Barr HM, Steissguth AP. Prenatal alcohol exposure, birthweight, and measures of child size from birth to 14 years. Am J Public Health 84(9):1421-28. 1994.
33. Roeleveld N, Vingerhoets E, Zielhuis GA, Gabreels F. Mental retardation associated with parental smoking and alcohol consumption before, during, and after pregnancy. Prev Medicine 21(1):110-19. 1992.
34. Ebrahim SH, Luman ET, Floyd RL, et al. Alcohol consumption by pregnant women in the United States during 1988-1995. Obstet and Gynecol 92(2):187-192. 1998.
52
35. Chomitz VR, Cheung LWY, Lieberman E. The role of lifestyle in preventing low birth weight. In: The Future of Children: Low Birthweight. Vol 5(1):121-138. Los Altos, California: Center for the Future of Children, The David and Lucile Packard Foundation. 1995.
36. Taffel S, Johnson D, Heuser R. A method for imputing length of gestation on birth certificates. National Center for Health Statistics. Vital Health Stat 2(93). Hyattsville, Maryland: National Center for Health Statistics 1982.
37. Alexander GR, Allen MC. Conceptualization, measurement, and use of gestational age. I. Clinical and Public Health Practice. J Perinatal 16(1):53-59. 1996.
. 38. Ventura SJ, Martin JA, Taffel SM, et al. Advance report of final natality statistics,
1992. Monthly vital statistics report; vol 43 no 5 supp. Hyattsville, Maryland: National Center for Health Statistics. 1994.
. 39. Watkins ML, Edmonds L, McClearn A, et al. The surveillance of birth defects: The
usefulness of the revised U.S. standard birth certificate. Am J Public Health 86(5):731–4. 1996.
40. U.S. Census Bureau. Test of birth-registration completeness, 1964 to 1968. 1970 census of population and housing; PHC (E)–2. Evaluation and Research Program. Washington: U.S. Department of Commerce. 1973.
41. National Center for Health Statistics. Postcensal estimates of the resident population of the United States as of July 1, 2003, by year, State and county, age, bridged race, sex, and Hispanic origin (vintage 2003). File pcen_v2003_y03.txt (ASCII). Released September 14, 2004. Available on the Internet at: http://www.cdc.gov/nchs/about/major/dvs/popbridge/datadoc.htm
42. U.S. Census Bureau. Age, sex, race, and Hispanic origin information from the 1990 census: A comparison of census results with results where age and race have been modified. 1990 CPH–L–74. Washington, DC: U.S. Department of Commerce. 1991. Available on the Internet at : http://www.wnjpin.net/OneStopCareerCenter/LaborMarketInformation/lmi02/cph-l-74.htm .
43. Fields J. Unpublished data from the March 2003 current population survey. U.S. Census Bureau. 2003.
44. U.S. Census Bureau. Unpublished tabulations prepared by the Housing and Household Economic Statistics Division. 2004.
45. U.S. Census Bureau. Census 2000 modified race data summary file. Available on the Internet at: http://www.census.gov/popest/archives/files/MR-CO.txt .
53
46. Hamilton BE, Sutton PD, Ventura SJ. Revised birth and fertility rates for the 1990s and new rates for Hispanic populations, 2000 and 2001: United States. National vital statistics reports; vol 51 no 12. Hyattsville, Maryland. 2003.
47. Ventura SJ, Hamilton BE, Sutton PD. Revised birth and fertility rates for the United States, 2000 and 2001. National vital statistics reports; vol 51 no 4. Hyattsville, Maryland: National Center for Health Statistics. 2003.
48. Heuser R. Fertility tables for birth cohorts by color: United States, 1917–73. Available on the Internet at http://www.cdc.gov/nchs/data/misc/fertiltbacc.pdf and on CD from Hyattsville, Maryland: National Center for Health Statistics. 1976.
49. Shiskin J, Young A, Musgrove J. The X–11 variant of the Census Method II Seasonal Adjustment Program. Technical paper; no 15, 1967 rev. Washington: U.S. Census Bureau. 1967.
50. Bailer JC, Ederer F. Significance factors for the ratio of a Poisson variable to its expectations. Biometrics. 20:639-43. 1964.
51. Schenker N, Gentleman JF. On judging the significance of differences by examining the overlap between confidence intervals. Amer Stat 55:182-86. 2001.
52. U.S. Census Bureau, Demographic Statistical Methods Division. Source and accuracy of the data for the March 2002 Current Population Survey microdata file. Available on the Internet at: http://www.bls.census.gov/cps/ads/2002/S&A_02.pdf .
53. U.S. Census Bureau, Demographic Statistical Methods Division. Source and accuracy of the data for the March 2003 Current Population Survey microdata file.
54
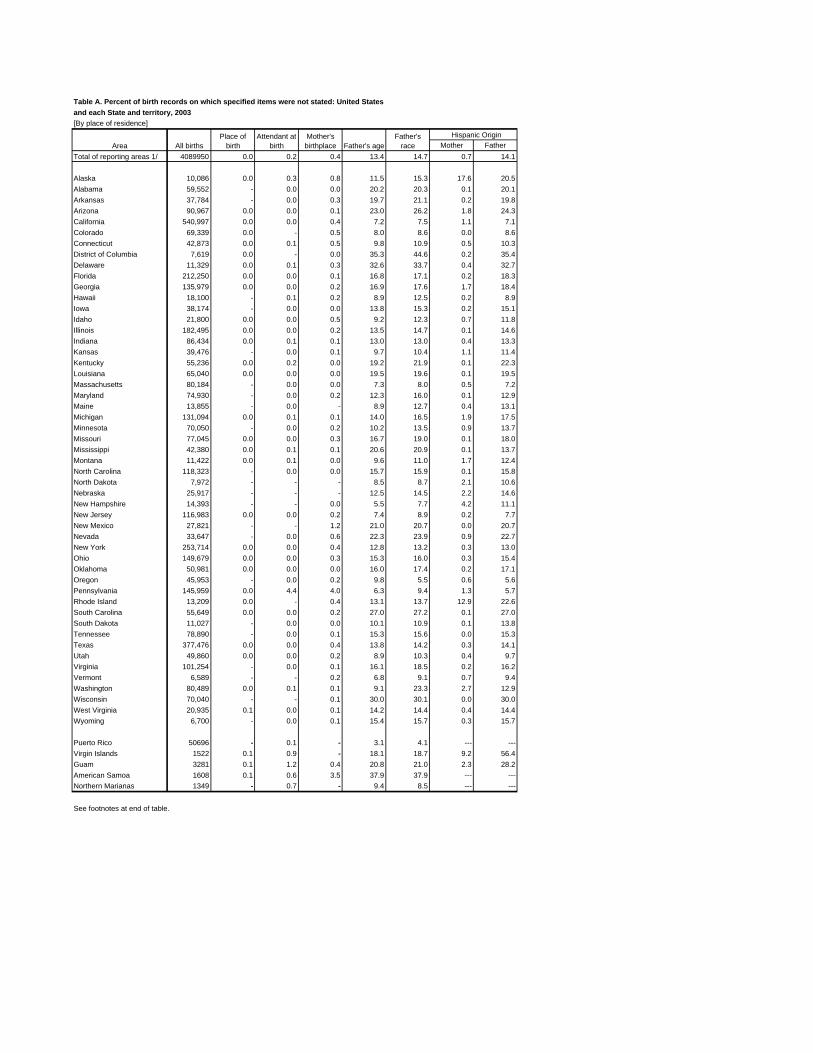
--- ---
--- ------ ---
Table A. Percent of birth records on which specified items were not stated: United States and each State and territory, 2003 [By place of residence]
Area All births Place of
birth Attendant at
birth Mother's
birthplace Father's age Father's
race Hispanic Origin
Mother Father Total of reporting areas 1/ 4089950 0.0 0.2 0.4 13.4 14.7 0.7 14.1
Alaska 10,086 0.0 0.3 0.8 11.5 15.3 17.6 20.5 Alabama 59,552 - 0.0 0.0 20.2 20.3 0.1 20.1 Arkansas 37,784 - 0.0 0.3 19.7 21.1 0.2 19.8 Arizona 90,967 0.0 0.0 0.1 23.0 26.2 1.8 24.3 California 540,997 0.0 0.0 0.4 7.2 7.5 1.1 7.1 Colorado 69,339 0.0 - 0.5 8.0 8.6 0.0 8.6 Connecticut 42,873 0.0 0.1 0.5 9.8 10.9 0.5 10.3 District of Columbia 7,619 0.0 - 0.0 35.3 44.6 0.2 35.4 Delaware 11,329 0.0 0.1 0.3 32.6 33.7 0.4 32.7 Florida 212,250 0.0 0.0 0.1 16.8 17.1 0.2 18.3 Georgia 135,979 0.0 0.0 0.2 16.9 17.6 1.7 18.4 Hawaii 18,100 - 0.1 0.2 8.9 12.5 0.2 8.9 Iowa 38,174 - 0.0 0.0 13.8 15.3 0.2 15.1 Idaho 21,800 0.0 0.0 0.5 9.2 12.3 0.7 11.8 Illinois 182,495 0.0 0.0 0.2 13.5 14.7 0.1 14.6 Indiana 86,434 0.0 0.1 0.1 13.0 13.0 0.4 13.3 Kansas 39,476 - 0.0 0.1 9.7 10.4 1.1 11.4 Kentucky 55,236 0.0 0.2 0.0 19.2 21.9 0.1 22.3 Louisiana 65,040 0.0 0.0 0.0 19.5 19.6 0.1 19.5 Massachusetts 80,184 - 0.0 0.0 7.3 8.0 0.5 7.2 Maryland 74,930 - 0.0 0.2 12.3 16.0 0.1 12.9 Maine 13,855 - 0.0 - 8.9 12.7 0.4 13.1 Michigan 131,094 0.0 0.1 0.1 14.0 16.5 1.9 17.5 Minnesota 70,050 - 0.0 0.2 10.2 13.5 0.9 13.7 Missouri 77,045 0.0 0.0 0.3 16.7 19.0 0.1 18.0 Mississippi 42,380 0.0 0.1 0.1 20.6 20.9 0.1 13.7 Montana 11,422 0.0 0.1 0.0 9.6 11.0 1.7 12.4 North Carolina 118,323 - 0.0 0.0 15.7 15.9 0.1 15.8 North Dakota 7,972 - - - 8.5 8.7 2.1 10.6 Nebraska 25,917 - - - 12.5 14.5 2.2 14.6 New Hampshire 14,393 - - 0.0 5.5 7.7 4.2 11.1 New Jersey 116,983 0.0 0.0 0.2 7.4 8.9 0.2 7.7 New Mexico 27,821 - - 1.2 21.0 20.7 0.0 20.7 Nevada 33,647 - 0.0 0.6 22.3 23.9 0.9 22.7 New York 253,714 0.0 0.0 0.4 12.8 13.2 0.3 13.0 Ohio 149,679 0.0 0.0 0.3 15.3 16.0 0.3 15.4 Oklahoma 50,981 0.0 0.0 0.0 16.0 17.4 0.2 17.1 Oregon 45,953 - 0.0 0.2 9.8 5.5 0.6 5.6 Pennsylvania 145,959 0.0 4.4 4.0 6.3 9.4 1.3 5.7 Rhode Island 13,209 0.0 - 0.4 13.1 13.7 12.9 22.6 South Carolina 55,649 0.0 0.0 0.2 27.0 27.2 0.1 27.0 South Dakota 11,027 - 0.0 0.0 10.1 10.9 0.1 13.8 Tennessee 78,890 - 0.0 0.1 15.3 15.6 0.0 15.3 Texas 377,476 0.0 0.0 0.4 13.8 14.2 0.3 14.1 Utah 49,860 0.0 0.0 0.2 8.9 10.3 0.4 9.7 Virginia 101,254 - 0.0 0.1 16.1 18.5 0.2 16.2 Vermont 6,589 - - 0.2 6.8 9.1 0.7 9.4 Washington 80,489 0.0 0.1 0.1 9.1 23.3 2.7 12.9 Wisconsin 70,040 - - 0.1 30.0 30.1 0.0 30.0 West Virginia 20,935 0.1 0.0 0.1 14.2 14.4 0.4 14.4 Wyoming 6,700 - 0.0 0.1 15.4 15.7 0.3 15.7
Puerto Rico 50696 - 0.1 - 3.1 4.1 Virgin Islands 1522 0.1 0.9 - 18.1 18.7 9.2 56.4 Guam 3281 0.1 1.2 0.4 20.8 21.0 2.3 28.2 American Samoa 1608 0.1 0.6 3.5 37.9 37.9 Northern Marianas 1349 - 0.7 - 9.4 8.5
See footnotes at end of table.
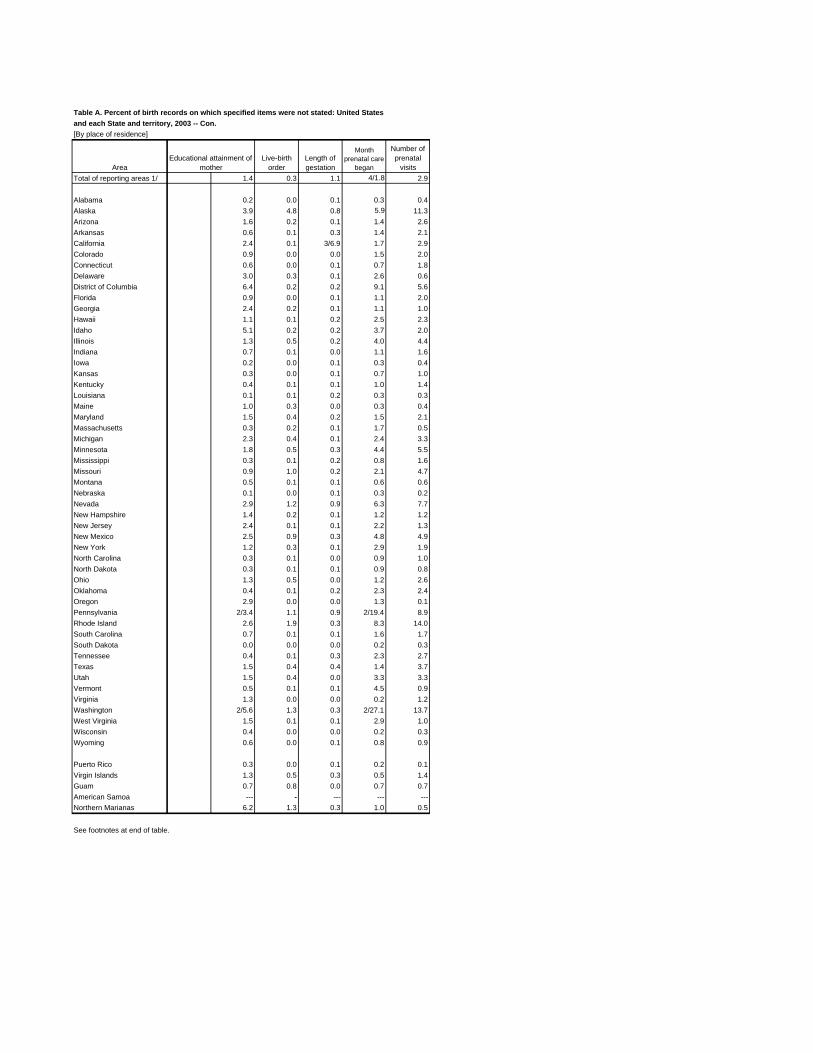
--- --- --- ---
Table A. Percent of birth records on which specified items were not stated: United States and each State and territory, 2003 -- Con. [By place of residence]
Month Number of Educational attainment of Live-birth Length of prenatal care prenatal
Area mother order gestation began visits Total of reporting areas 1/ 1.4 0.3 1.1 4/1.8 2.9
Alabama 0.2 0.0 0.1 0.3 0.4 Alaska 3.9 4.8 0.8 5.9 11.3 Arizona 1.6 0.2 0.1 1.4 2.6 Arkansas 0.6 0.1 0.3 1.4 2.1 California 2.4 0.1 3/6.9 1.7 2.9 Colorado 0.9 0.0 0.0 1.5 2.0 Connecticut 0.6 0.0 0.1 0.7 1.8 Delaware 3.0 0.3 0.1 2.6 0.6 District of Columbia 6.4 0.2 0.2 9.1 5.6 Florida 0.9 0.0 0.1 1.1 2.0 Georgia 2.4 0.2 0.1 1.1 1.0 Hawaii 1.1 0.1 0.2 2.5 2.3 Idaho 5.1 0.2 0.2 3.7 2.0 Illinois 1.3 0.5 0.2 4.0 4.4 Indiana 0.7 0.1 0.0 1.1 1.6 Iowa 0.2 0.0 0.1 0.3 0.4 Kansas 0.3 0.0 0.1 0.7 1.0 Kentucky 0.4 0.1 0.1 1.0 1.4 Louisiana 0.1 0.1 0.2 0.3 0.3 Maine 1.0 0.3 0.0 0.3 0.4 Maryland 1.5 0.4 0.2 1.5 2.1 Massachusetts 0.3 0.2 0.1 1.7 0.5 Michigan 2.3 0.4 0.1 2.4 3.3 Minnesota 1.8 0.5 0.3 4.4 5.5 Mississippi 0.3 0.1 0.2 0.8 1.6 Missouri 0.9 1.0 0.2 2.1 4.7 Montana 0.5 0.1 0.1 0.6 0.6 Nebraska 0.1 0.0 0.1 0.3 0.2 Nevada 2.9 1.2 0.9 6.3 7.7 New Hampshire 1.4 0.2 0.1 1.2 1.2 New Jersey 2.4 0.1 0.1 2.2 1.3 New Mexico 2.5 0.9 0.3 4.8 4.9 New York 1.2 0.3 0.1 2.9 1.9 North Carolina 0.3 0.1 0.0 0.9 1.0 North Dakota 0.3 0.1 0.1 0.9 0.8 Ohio 1.3 0.5 0.0 1.2 2.6 Oklahoma 0.4 0.1 0.2 2.3 2.4 Oregon 2.9 0.0 0.0 1.3 0.1 Pennsylvania 2/3.4 1.1 0.9 2/19.4 8.9 Rhode Island 2.6 1.9 0.3 8.3 14.0 South Carolina 0.7 0.1 0.1 1.6 1.7 South Dakota 0.0 0.0 0.0 0.2 0.3 Tennessee 0.4 0.1 0.3 2.3 2.7 Texas 1.5 0.4 0.4 1.4 3.7 Utah 1.5 0.4 0.0 3.3 3.3 Vermont 0.5 0.1 0.1 4.5 0.9 Virginia 1.3 0.0 0.0 0.2 1.2 Washington 2/5.6 1.3 0.3 2/27.1 13.7 West Virginia 1.5 0.1 0.1 2.9 1.0 Wisconsin 0.4 0.0 0.0 0.2 0.3 Wyoming 0.6 0.0 0.1 0.8 0.9
Puerto Rico 0.3 0.0 0.1 0.2 0.1 Virgin Islands 1.3 0.5 0.3 0.5 1.4 Guam 0.7 0.8 0.0 0.7 0.7 American Samoa -Northern Marianas 6.2 1.3 0.3 1.0 0.5
See footnotes at end of table.
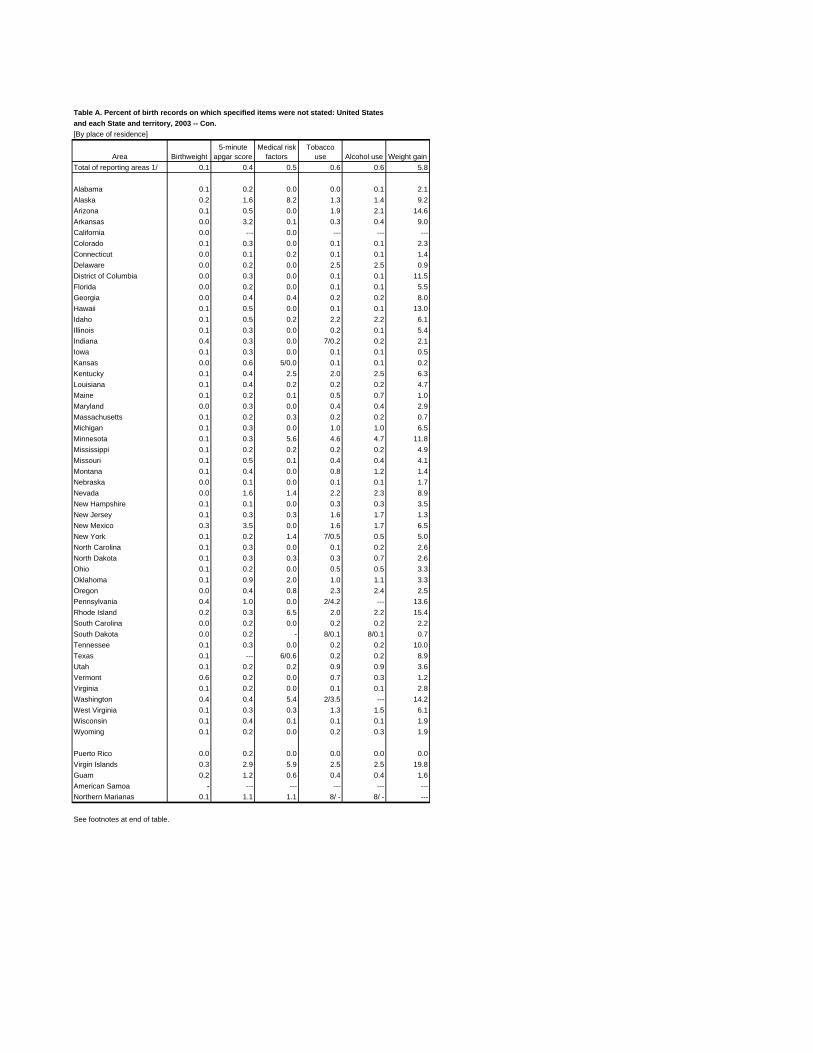
--- --- --- ---
---
---
---
--- --- --- --- ------
Table A. Percent of birth records on which specified items were not stated: United States and each State and territory, 2003 -- Con. [By place of residence]
Area Birthweight 5-minute
apgar score Medical risk
factors Tobacco
use Alcohol use Weight gain Total of reporting areas 1/ 0.1 0.4 0.5 0.6 0.6 5.8
Alabama 0.1 0.2 0.0 0.0 0.1 2.1 Alaska 0.2 1.6 8.2 1.3 1.4 9.2 Arizona 0.1 0.5 0.0 1.9 2.1 14.6 Arkansas 0.0 3.2 0.1 0.3 0.4 9.0 California 0.0 0.0 Colorado 0.1 0.3 0.0 0.1 0.1 2.3 Connecticut 0.0 0.1 0.2 0.1 0.1 1.4 Delaware 0.0 0.2 0.0 2.5 2.5 0.9 District of Columbia 0.0 0.3 0.0 0.1 0.1 11.5 Florida 0.0 0.2 0.0 0.1 0.1 5.5 Georgia 0.0 0.4 0.4 0.2 0.2 8.0 Hawaii 0.1 0.5 0.0 0.1 0.1 13.0 Idaho 0.1 0.5 0.2 2.2 2.2 6.1 Illinois 0.1 0.3 0.0 0.2 0.1 5.4 Indiana 0.4 0.3 0.0 7/0.2 0.2 2.1 Iowa 0.1 0.3 0.0 0.1 0.1 0.5 Kansas 0.0 0.6 5/0.0 0.1 0.1 0.2 Kentucky 0.1 0.4 2.5 2.0 2.5 6.3 Louisiana 0.1 0.4 0.2 0.2 0.2 4.7 Maine 0.1 0.2 0.1 0.5 0.7 1.0 Maryland 0.0 0.3 0.0 0.4 0.4 2.9 Massachusetts 0.1 0.2 0.3 0.2 0.2 0.7 Michigan 0.1 0.3 0.0 1.0 1.0 6.5 Minnesota 0.1 0.3 5.6 4.6 4.7 11.8 Mississippi 0.1 0.2 0.2 0.2 0.2 4.9 Missouri 0.1 0.5 0.1 0.4 0.4 4.1 Montana 0.1 0.4 0.0 0.8 1.2 1.4 Nebraska 0.0 0.1 0.0 0.1 0.1 1.7 Nevada 0.0 1.6 1.4 2.2 2.3 8.9 New Hampshire 0.1 0.1 0.0 0.3 0.3 3.5 New Jersey 0.1 0.3 0.3 1.6 1.7 1.3 New Mexico 0.3 3.5 0.0 1.6 1.7 6.5 New York 0.1 0.2 1.4 7/0.5 0.5 5.0 North Carolina 0.1 0.3 0.0 0.1 0.2 2.6 North Dakota 0.1 0.3 0.3 0.3 0.7 2.6 Ohio 0.1 0.2 0.0 0.5 0.5 3.3 Oklahoma 0.1 0.9 2.0 1.0 1.1 3.3 Oregon 0.0 0.4 0.8 2.3 2.4 2.5 Pennsylvania 0.4 1.0 0.0 2/4.2 13.6 Rhode Island 0.2 0.3 6.5 2.0 2.2 15.4 South Carolina 0.0 0.2 0.0 0.2 0.2 2.2 South Dakota 0.0 0.2 - 8/0.1 8/0.1 0.7 Tennessee 0.1 0.3 0.0 0.2 0.2 10.0 Texas 0.1 6/0.6 0.2 0.2 8.9 Utah 0.1 0.2 0.2 0.9 0.9 3.6 Vermont 0.6 0.2 0.0 0.7 0.3 1.2 Virginia 0.1 0.2 0.0 0.1 0.1 2.8 Washington 0.4 0.4 5.4 2/3.5 14.2 West Virginia 0.1 0.3 0.3 1.3 1.5 6.1 Wisconsin 0.1 0.4 0.1 0.1 0.1 1.9 Wyoming 0.1 0.2 0.0 0.2 0.3 1.9
Puerto Rico 0.0 0.2 0.0 0.0 0.0 0.0 Virgin Islands 0.3 2.9 5.9 2.5 2.5 19.8 Guam 0.2 1.2 0.6 0.4 0.4 1.6 American Samoa -Northern Marianas 0.1 1.1 1.1 8/ 8/
See footnotes at end of table.
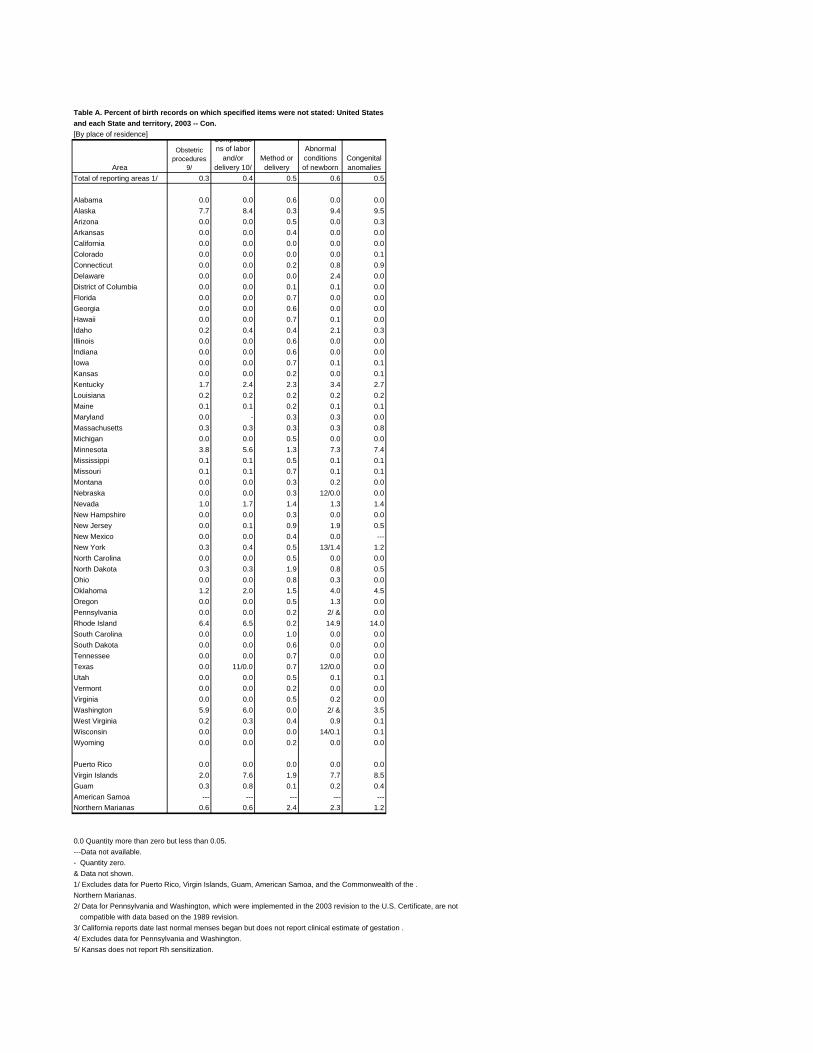
---
--- --- --- --- ---
Table A. Percent of birth records on which specified items were not stated: United States and each State and territory, 2003 -- Con. [By place of residence]
Complicatio Obstetric ns of labor Abnormal
Area procedures
9/ and/or
delivery 10/ Method or delivery
conditions of newborn
Congenital anomalies
Total of reporting areas 1/ 0.3 0.4 0.5 0.6 0.5
Alabama 0.0 0.0 0.6 0.0 0.0 Alaska 7.7 8.4 0.3 9.4 9.5 Arizona 0.0 0.0 0.5 0.0 0.3 Arkansas 0.0 0.0 0.4 0.0 0.0 California 0.0 0.0 0.0 0.0 0.0 Colorado 0.0 0.0 0.0 0.0 0.1 Connecticut 0.0 0.0 0.2 0.8 0.9 Delaware 0.0 0.0 0.0 2.4 0.0 District of Columbia 0.0 0.0 0.1 0.1 0.0 Florida 0.0 0.0 0.7 0.0 0.0 Georgia 0.0 0.0 0.6 0.0 0.0 Hawaii 0.0 0.0 0.7 0.1 0.0 Idaho 0.2 0.4 0.4 2.1 0.3 Illinois 0.0 0.0 0.6 0.0 0.0 Indiana 0.0 0.0 0.6 0.0 0.0 Iowa 0.0 0.0 0.7 0.1 0.1 Kansas 0.0 0.0 0.2 0.0 0.1 Kentucky 1.7 2.4 2.3 3.4 2.7 Louisiana 0.2 0.2 0.2 0.2 0.2 Maine 0.1 0.1 0.2 0.1 0.1 Maryland 0.0 - 0.3 0.3 0.0 Massachusetts 0.3 0.3 0.3 0.3 0.8 Michigan 0.0 0.0 0.5 0.0 0.0 Minnesota 3.8 5.6 1.3 7.3 7.4 Mississippi 0.1 0.1 0.5 0.1 0.1 Missouri 0.1 0.1 0.7 0.1 0.1 Montana 0.0 0.0 0.3 0.2 0.0 Nebraska 0.0 0.0 0.3 12/0.0 0.0 Nevada 1.0 1.7 1.4 1.3 1.4 New Hampshire 0.0 0.0 0.3 0.0 0.0 New Jersey 0.0 0.1 0.9 1.9 0.5 New Mexico 0.0 0.0 0.4 0.0 New York 0.3 0.4 0.5 13/1.4 1.2 North Carolina 0.0 0.0 0.5 0.0 0.0 North Dakota 0.3 0.3 1.9 0.8 0.5 Ohio 0.0 0.0 0.8 0.3 0.0 Oklahoma 1.2 2.0 1.5 4.0 4.5 Oregon 0.0 0.0 0.5 1.3 0.0 Pennsylvania 0.0 0.0 0.2 2/ & 0.0 Rhode Island 6.4 6.5 0.2 14.9 14.0 South Carolina 0.0 0.0 1.0 0.0 0.0 South Dakota 0.0 0.0 0.6 0.0 0.0 Tennessee 0.0 0.0 0.7 0.0 0.0 Texas 0.0 11/0.0 0.7 12/0.0 0.0 Utah 0.0 0.0 0.5 0.1 0.1 Vermont 0.0 0.0 0.2 0.0 0.0 Virginia 0.0 0.0 0.5 0.2 0.0 Washington 5.9 6.0 0.0 2/ & 3.5 West Virginia 0.2 0.3 0.4 0.9 0.1 Wisconsin 0.0 0.0 0.0 14/0.1 0.1 Wyoming 0.0 0.0 0.2 0.0 0.0
Puerto Rico 0.0 0.0 0.0 0.0 0.0 Virgin Islands 2.0 7.6 1.9 7.7 8.5 Guam 0.3 0.8 0.1 0.2 0.4 American Samoa Northern Marianas 0.6 0.6 2.4 2.3 1.2
0.0 Quantity more than zero but less than 0.05.---Data not available.- Quantity zero.& Data not shown.1/ Excludes data for Puerto Rico, Virgin Islands, Guam, American Samoa, and the Commonwealth of the .Northern Marianas.2/ Data for Pennsylvania and Washington, which were implemented in the 2003 revision to the U.S. Certificate, are not
compatible with data based on the 1989 revision. 3/ California reports date last normal menses began but does not report clinical estimate of gestation . 4/ Excludes data for Pennsylvania and Washington. 5/ Kansas does not report Rh sensitization.

6/ Texas does not report genital herpes and uterine bleeding.7/ Indiana and New York State report tobacco use but do not report the average number of cigarettes smoked per day in standard categories; data for New York City are reported in standard categories.8/ South Dakota and the Commonwealth of the Northern Marianas report tobacco and alcohol use but do not report the average number of cigarettes smoked per day or the average number of drinks per week.9/ The percent not stated for induction of labor and tocolysis may differ slightly from levels shown here because of formatting differences between the 1989 and 2003 Revision of the Certificate of Live Birth.10/ The percent not stated for meconium, precipitous labor and malpresentation may differ slightly from levels shown here because of formatting differences between the 1989 and 2003 Revision of the Certificate of Live Birth.11/ Texas does not report anesthetic complications and fetal distress.12/ Nebraska and Texas do not report birth injury.13/ New York City does not report assisted ventilation less than 30 minutes and assisted ventilation of 30 minutes or more .14/ Wisconsin does not report fetal alcohol syndrome.
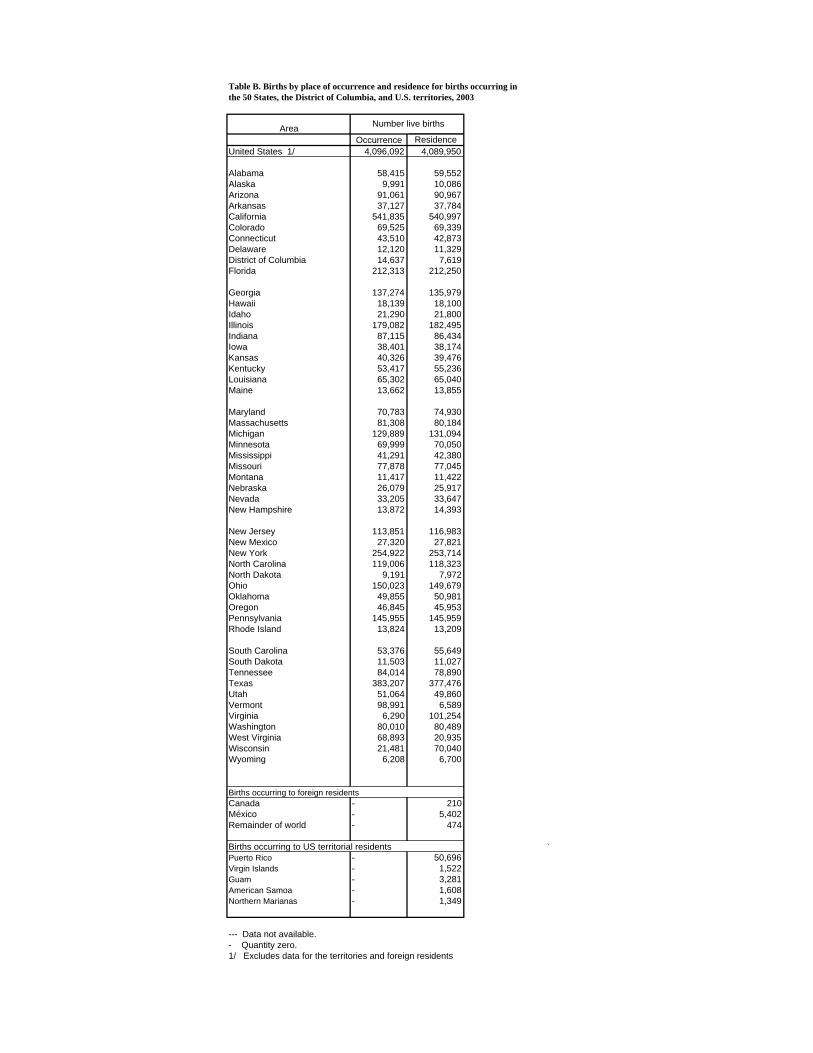
Table B. Births by place of occurrence and residence for births occurring in the 50 States, the District of Columbia, and U.S. territories, 2003
Area Number live births
Occurrence Residence United States 1/ 4,096,092 4,089,950
Alabama Alaska Arizona Arkansas California Colorado Connecticut Delaware District of Columbia Florida
Georgia Hawaii Idaho Illinois Indiana Iowa Kansas Kentucky Louisiana Maine
Maryland Massachusetts Michigan Minnesota Mississippi Missouri Montana Nebraska Nevada New Hampshire
New Jersey New Mexico New York North Carolina North Dakota Ohio Oklahoma Oregon Pennsylvania Rhode Island
South Carolina South Dakota Tennessee Texas Utah Vermont Virginia Washington West Virginia Wisconsin Wyoming
58,415 9,991
91,061 37,127
541,835 69,525 43,510 12,120 14,637
212,313
137,274 18,139 21,290
179,082 87,115 38,401 40,326 53,417 65,302 13,662
70,783 81,308
129,889 69,999 41,291 77,878 11,417 26,079 33,205 13,872
113,851 27,320
254,922 119,006
9,191 150,023
49,855 46,845
145,955 13,824
53,376 11,503 84,014
383,207 51,064 98,991
6,290 80,010 68,893 21,481
6,208
59,552 10,086 90,967 37,784
540,997 69,339 42,873 11,329
7,619 212,250
135,979 18,100 21,800
182,495 86,434 38,174 39,476 55,236 65,040 13,855
74,930 80,184
131,094 70,050 42,380 77,045 11,422 25,917 33,647 14,393
116,983 27,821
253,714 118,323
7,972 149,679
50,981 45,953
145,959 13,209
55,649 11,027 78,890
377,476 49,860
6,589 101,254
80,489 20,935 70,040
6,700
Births occurring to foreign residents Canada México Remainder of world
---
210 5,402
474
Births occurring to US territorial residents Puerto Rico Virgin Islands Guam American Samoa Northern Marianas
-----
50,696 1,522 3,281 1,608 1,349
`
--- Data not available. - Quantity zero.1/ Excludes data for the territories and foreign residents
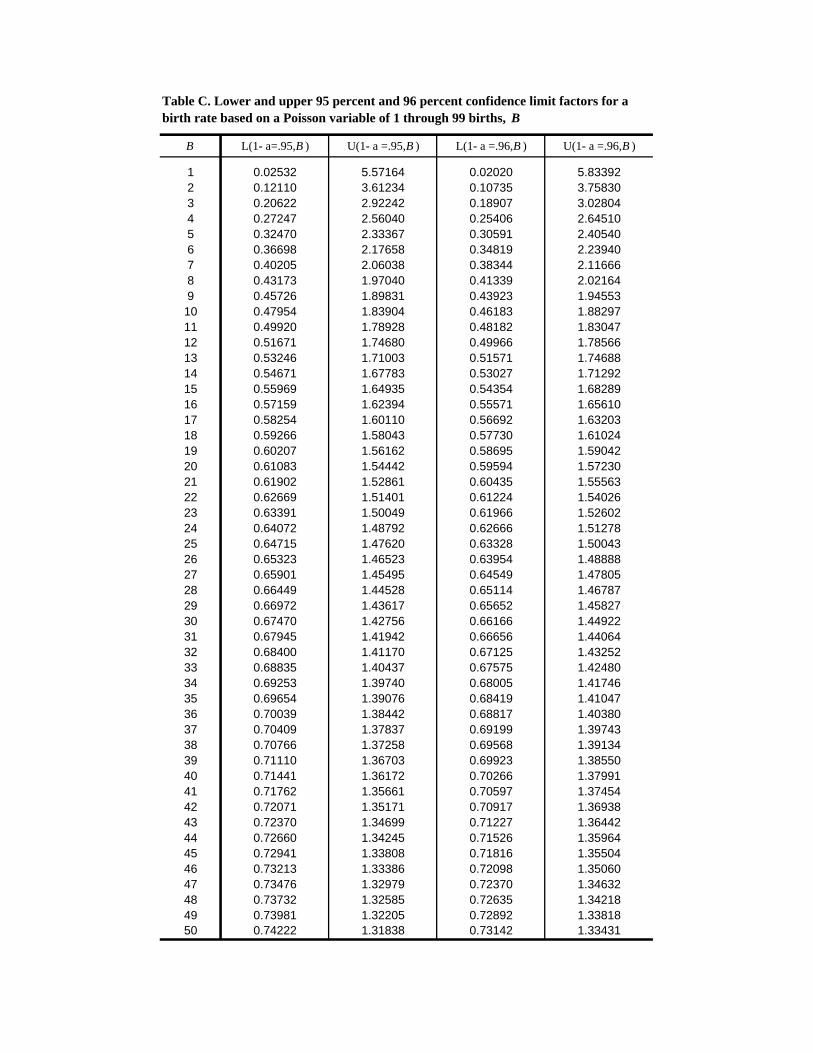
123456789
1011121314151617181920212223242526272829303132333435363738394041424344454647484950
Table C. Lower and upper 95 percent and 96 percent confidence limit factors for a birth rate based on a Poisson variable of 1 through 99 births, B
B L(1- a=.95,B ) U(1- a =.95,B ) L(1- a =.96,B ) U(1- a =.96,B )
0.02532 0.12110 0.20622 0.27247 0.32470 0.36698 0.40205 0.43173 0.45726 0.47954 0.49920 0.51671 0.53246 0.54671 0.55969 0.57159 0.58254 0.59266 0.60207 0.61083 0.61902 0.62669 0.63391 0.64072 0.64715 0.65323 0.65901 0.66449 0.66972 0.67470 0.67945 0.68400 0.68835 0.69253 0.69654 0.70039 0.70409 0.70766 0.71110 0.71441 0.71762 0.72071 0.72370 0.72660 0.72941 0.73213 0.73476 0.73732 0.73981 0.74222
5.57164 3.61234 2.92242 2.56040 2.33367 2.17658 2.06038 1.97040 1.89831 1.83904 1.78928 1.74680 1.71003 1.67783 1.64935 1.62394 1.60110 1.58043 1.56162 1.54442 1.52861 1.51401 1.50049 1.48792 1.47620 1.46523 1.45495 1.44528 1.43617 1.42756 1.41942 1.41170 1.40437 1.39740 1.39076 1.38442 1.37837 1.37258 1.36703 1.36172 1.35661 1.35171 1.34699 1.34245 1.33808 1.33386 1.32979 1.32585 1.32205 1.31838
0.02020 0.10735 0.18907 0.25406 0.30591 0.34819 0.38344 0.41339 0.43923 0.46183 0.48182 0.49966 0.51571 0.53027 0.54354 0.55571 0.56692 0.57730 0.58695 0.59594 0.60435 0.61224 0.61966 0.62666 0.63328 0.63954 0.64549 0.65114 0.65652 0.66166 0.66656 0.67125 0.67575 0.68005 0.68419 0.68817 0.69199 0.69568 0.69923 0.70266 0.70597 0.70917 0.71227 0.71526 0.71816 0.72098 0.72370 0.72635 0.72892 0.73142
5.83392 3.75830 3.02804 2.64510 2.40540 2.23940 2.11666 2.02164 1.94553 1.88297 1.83047 1.78566 1.74688 1.71292 1.68289 1.65610 1.63203 1.61024 1.59042 1.57230 1.55563 1.54026 1.52602 1.51278 1.50043 1.48888 1.47805 1.46787 1.45827 1.44922 1.44064 1.43252 1.42480 1.41746 1.41047 1.40380 1.39743 1.39134 1.38550 1.37991 1.37454 1.36938 1.36442 1.35964 1.35504 1.35060 1.34632 1.34218 1.33818 1.33431
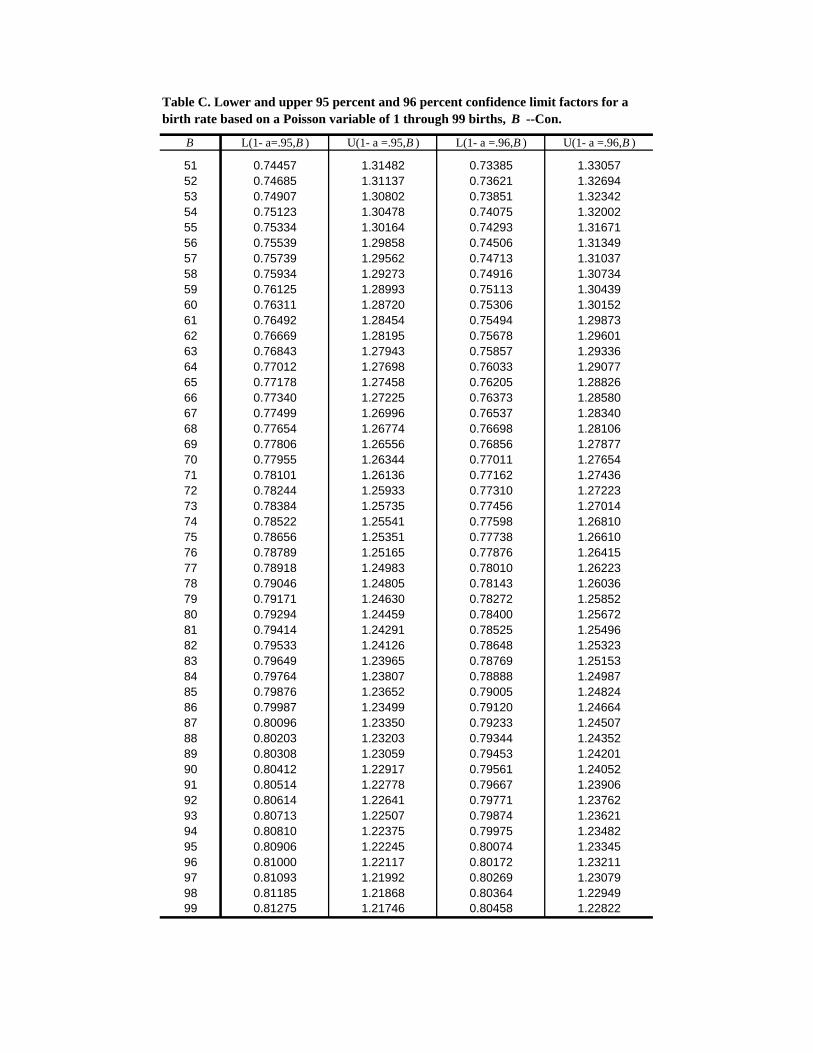
Table C. Lower and upper 95 percent and 96 percent confidence limit factors for a birth rate based on a Poisson variable of 1 through 99 births, B --Con.
B L(1- a=.95,B ) U(1- a =.95,B ) L(1- a =.96,B ) U(1- a =.96,B )
51 0.74457 1.31482 0.73385 1.33057 52 0.74685 1.31137 0.73621 1.32694 53 0.74907 1.30802 0.73851 1.32342 54 0.75123 1.30478 0.74075 1.32002 55 0.75334 1.30164 0.74293 1.31671 56 0.75539 1.29858 0.74506 1.31349 57 0.75739 1.29562 0.74713 1.31037 58 0.75934 1.29273 0.74916 1.30734 59 0.76125 1.28993 0.75113 1.30439 60 0.76311 1.28720 0.75306 1.30152 61 0.76492 1.28454 0.75494 1.29873 62 0.76669 1.28195 0.75678 1.29601 63 0.76843 1.27943 0.75857 1.29336 64 0.77012 1.27698 0.76033 1.29077 65 0.77178 1.27458 0.76205 1.28826 66 0.77340 1.27225 0.76373 1.28580 67 0.77499 1.26996 0.76537 1.28340 68 0.77654 1.26774 0.76698 1.28106 69 0.77806 1.26556 0.76856 1.27877 70 0.77955 1.26344 0.77011 1.27654 71 0.78101 1.26136 0.77162 1.27436 72 0.78244 1.25933 0.77310 1.27223 73 0.78384 1.25735 0.77456 1.27014 74 0.78522 1.25541 0.77598 1.26810 75 0.78656 1.25351 0.77738 1.26610 76 0.78789 1.25165 0.77876 1.26415 77 0.78918 1.24983 0.78010 1.26223 78 0.79046 1.24805 0.78143 1.26036 79 0.79171 1.24630 0.78272 1.25852 80 0.79294 1.24459 0.78400 1.25672 81 0.79414 1.24291 0.78525 1.25496 82 0.79533 1.24126 0.78648 1.25323 83 0.79649 1.23965 0.78769 1.25153 84 0.79764 1.23807 0.78888 1.24987 85 0.79876 1.23652 0.79005 1.24824 86 0.79987 1.23499 0.79120 1.24664 87 0.80096 1.23350 0.79233 1.24507 88 0.80203 1.23203 0.79344 1.24352 89 0.80308 1.23059 0.79453 1.24201 90 0.80412 1.22917 0.79561 1.24052 91 0.80514 1.22778 0.79667 1.23906 92 0.80614 1.22641 0.79771 1.23762 93 0.80713 1.22507 0.79874 1.23621 94 0.80810 1.22375 0.79975 1.23482 95 0.80906 1.22245 0.80074 1.23345 96 0.81000 1.22117 0.80172 1.23211 97 0.81093 1.21992 0.80269 1.23079 98 0.81185 1.21868 0.80364 1.22949 99 0.81275 1.21746 0.80458 1.22822
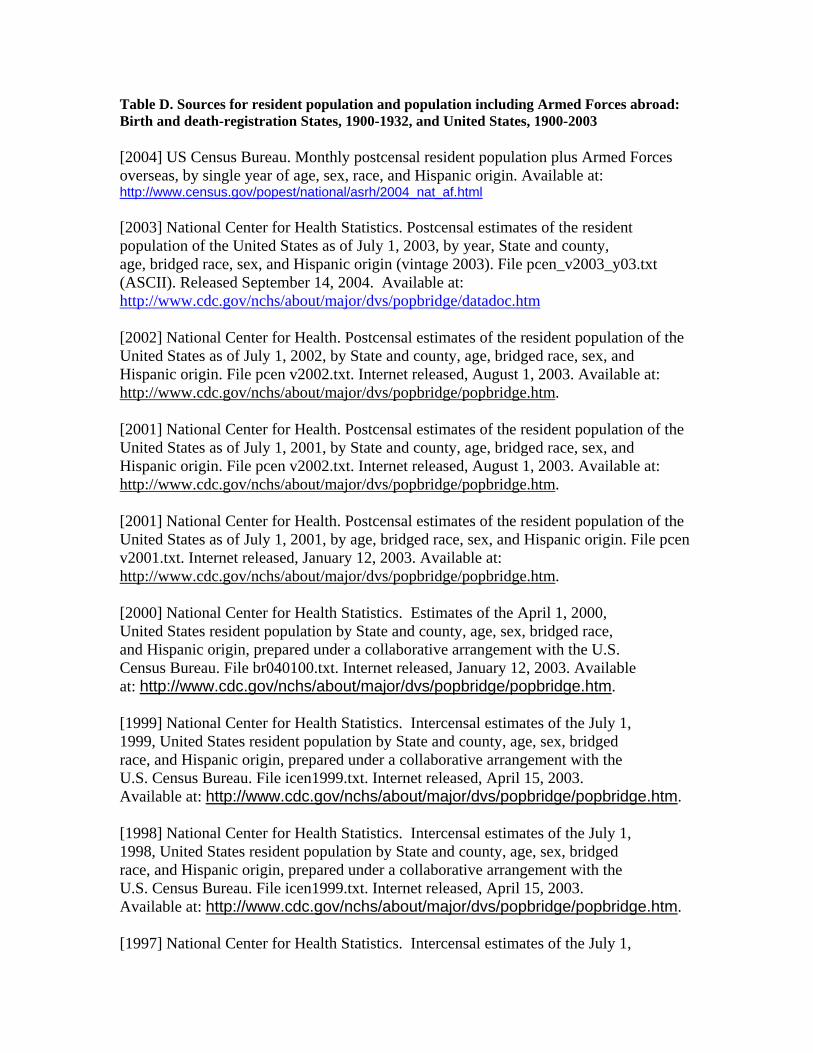
Table D. Sources for resident population and population including Armed Forces abroad: Birth and death-registration States, 1900-1932, and United States, 1900-2003
[2004] US Census Bureau. Monthly postcensal resident population plus Armed Forces overseas, by single year of age, sex, race, and Hispanic origin. Available at: http://www.census.gov/popest/national/asrh/2004_nat_af.html
[2003] National Center for Health Statistics. Postcensal estimates of the resident population of the United States as of July 1, 2003, by year, State and county, age, bridged race, sex, and Hispanic origin (vintage 2003). File pcen_v2003_y03.txt (ASCII). Released September 14, 2004. Available at: http://www.cdc.gov/nchs/about/major/dvs/popbridge/datadoc.htm
[2002] National Center for Health. Postcensal estimates of the resident population of the United States as of July 1, 2002, by State and county, age, bridged race, sex, and Hispanic origin. File pcen v2002.txt. Internet released, August 1, 2003. Available at: http://www.cdc.gov/nchs/about/major/dvs/popbridge/popbridge.htm.
[2001] National Center for Health. Postcensal estimates of the resident population of the United States as of July 1, 2001, by State and county, age, bridged race, sex, and Hispanic origin. File pcen v2002.txt. Internet released, August 1, 2003. Available at: http://www.cdc.gov/nchs/about/major/dvs/popbridge/popbridge.htm.
[2001] National Center for Health. Postcensal estimates of the resident population of the United States as of July 1, 2001, by age, bridged race, sex, and Hispanic origin. File pcen v2001.txt. Internet released, January 12, 2003. Available at: http://www.cdc.gov/nchs/about/major/dvs/popbridge/popbridge.htm.
[2000] National Center for Health Statistics. Estimates of the April 1, 2000, United States resident population by State and county, age, sex, bridged race, and Hispanic origin, prepared under a collaborative arrangement with the U.S. Census Bureau. File br040100.txt. Internet released, January 12, 2003. Available at: http://www.cdc.gov/nchs/about/major/dvs/popbridge/popbridge.htm.
[1999] National Center for Health Statistics. Intercensal estimates of the July 1, 1999, United States resident population by State and county, age, sex, bridged race, and Hispanic origin, prepared under a collaborative arrangement with the U.S. Census Bureau. File icen1999.txt. Internet released, April 15, 2003. Available at: http://www.cdc.gov/nchs/about/major/dvs/popbridge/popbridge.htm.
[1998] National Center for Health Statistics. Intercensal estimates of the July 1, 1998, United States resident population by State and county, age, sex, bridged race, and Hispanic origin, prepared under a collaborative arrangement with the U.S. Census Bureau. File icen1999.txt. Internet released, April 15, 2003. Available at: http://www.cdc.gov/nchs/about/major/dvs/popbridge/popbridge.htm.
[1997] National Center for Health Statistics. Intercensal estimates of the July 1,
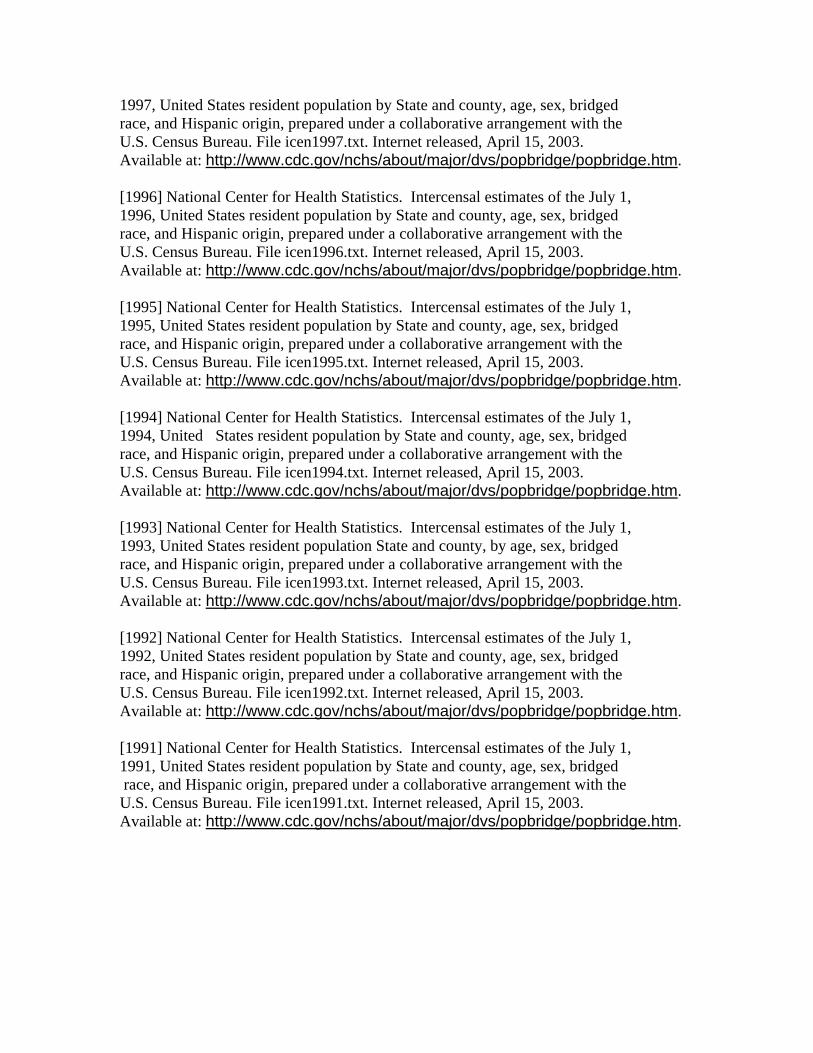
1997, United States resident population by State and county, age, sex, bridged race, and Hispanic origin, prepared under a collaborative arrangement with the U.S. Census Bureau. File icen1997.txt. Internet released, April 15, 2003. Available at: http://www.cdc.gov/nchs/about/major/dvs/popbridge/popbridge.htm.
[1996] National Center for Health Statistics. Intercensal estimates of the July 1, 1996, United States resident population by State and county, age, sex, bridged race, and Hispanic origin, prepared under a collaborative arrangement with the U.S. Census Bureau. File icen1996.txt. Internet released, April 15, 2003. Available at: http://www.cdc.gov/nchs/about/major/dvs/popbridge/popbridge.htm.
[1995] National Center for Health Statistics. Intercensal estimates of the July 1, 1995, United States resident population by State and county, age, sex, bridged race, and Hispanic origin, prepared under a collaborative arrangement with the U.S. Census Bureau. File icen1995.txt. Internet released, April 15, 2003. Available at: http://www.cdc.gov/nchs/about/major/dvs/popbridge/popbridge.htm.
[1994] National Center for Health Statistics. Intercensal estimates of the July 1, 1994, United States resident population by State and county, age, sex, bridged race, and Hispanic origin, prepared under a collaborative arrangement with the U.S. Census Bureau. File icen1994.txt. Internet released, April 15, 2003. Available at: http://www.cdc.gov/nchs/about/major/dvs/popbridge/popbridge.htm.
[1993] National Center for Health Statistics. Intercensal estimates of the July 1, 1993, United States resident population State and county, by age, sex, bridged race, and Hispanic origin, prepared under a collaborative arrangement with the U.S. Census Bureau. File icen1993.txt. Internet released, April 15, 2003. Available at: http://www.cdc.gov/nchs/about/major/dvs/popbridge/popbridge.htm.
[1992] National Center for Health Statistics. Intercensal estimates of the July 1, 1992, United States resident population by State and county, age, sex, bridged race, and Hispanic origin, prepared under a collaborative arrangement with the U.S. Census Bureau. File icen1992.txt. Internet released, April 15, 2003. Available at: http://www.cdc.gov/nchs/about/major/dvs/popbridge/popbridge.htm.
[1991] National Center for Health Statistics. Intercensal estimates of the July 1, 1991, United States resident population by State and county, age, sex, bridged race, and Hispanic origin, prepared under a collaborative arrangement with the U.S. Census Bureau. File icen1991.txt. Internet released, April 15, 2003. Available at: http://www.cdc.gov/nchs/about/major/dvs/popbridge/popbridge.htm.
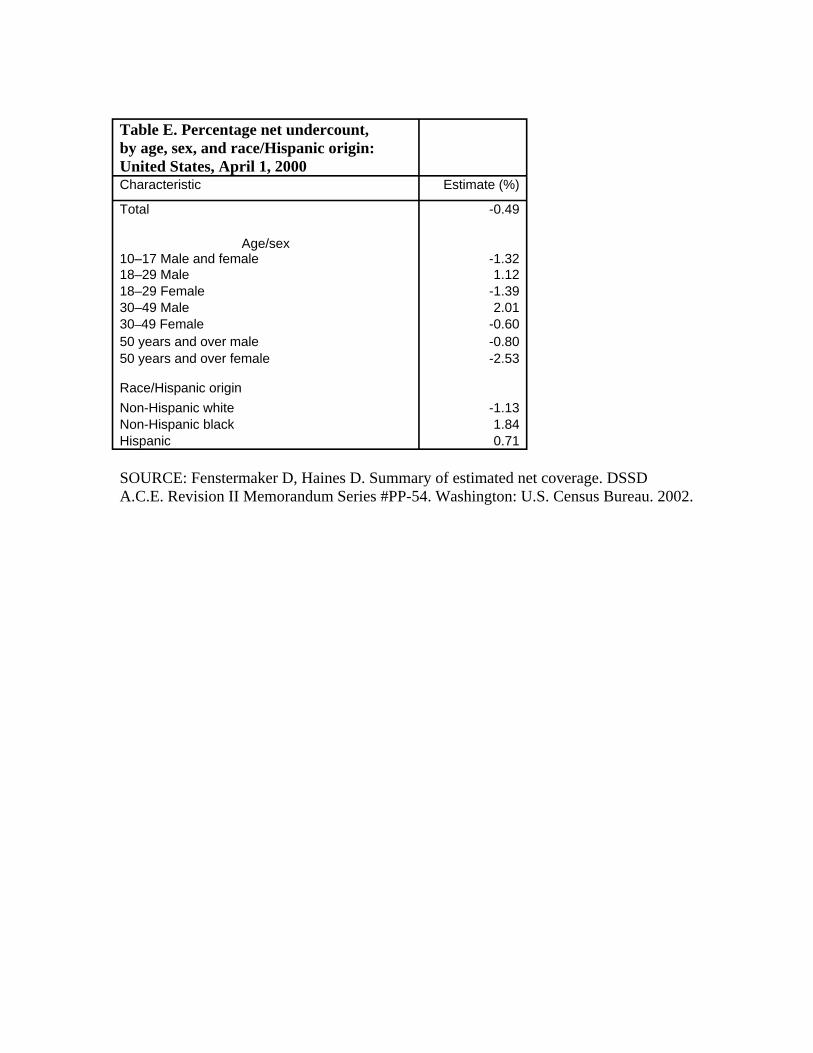
Table E. Percentage net undercount, by age, sex, and race/Hispanic origin: United States, April 1, 2000 Characteristic Estimate (%)
Total -0.49
Age/sex 10–17 Male and female -1.32 18–29 Male 1.12 18–29 Female -1.39 30–49 Male 2.01 30–49 Female -0.60 50 years and over male -0.80 50 years and over female -2.53
Race/Hispanic origin Non-Hispanic white -1.13 Non-Hispanic black 1.84 Hispanic 0.71
SOURCE: Fenstermaker D, Haines D. Summary of estimated net coverage. DSSD A.C.E. Revision II Memorandum Series #PP-54. Washington: U.S. Census Bureau. 2002.
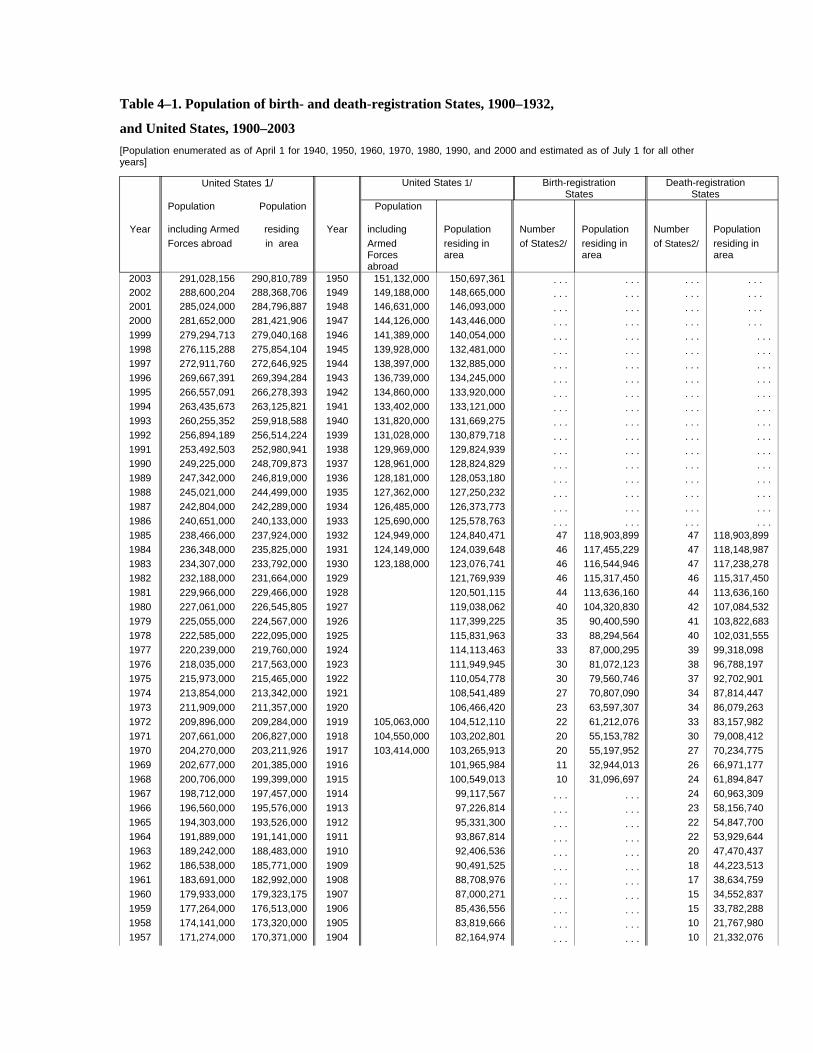
Table 4–1. Population of birth- and death-registration States, 1900–1932,
and United States, 1900–2003 [Population enumerated as of April 1 for 1940, 1950, 1960, 1970, 1980, 1990, and 2000 and estimated as of July 1 for all other years]
United States 1/ United States 1/ Birth-registration States
Death-registration States
Population Population Population
Year including Armed residing Year including Population Number Population Number Population Forces abroad in area Armed residing in of States2/ residing in of States2/ residing in
Forces area area area abroad
2003 291,028,156 290,810,789 1950 151,132,000 150,697,361 . . . . . . . . . . . . 2002 288,600,204 288,368,706 1949 149,188,000 148,665,000 . . . . . . . . . . . . 2001 285,024,000 284,796,887 1948 146,631,000 146,093,000 . . . . . . . . . . . . 2000 281,652,000 281,421,906 1947 144,126,000 143,446,000 . . . . . . . . . . . . 1999 279,294,713 279,040,168 1946 141,389,000 140,054,000 . . . . . . . . . . . . 1998 276,115,288 275,854,104 1945 139,928,000 132,481,000 . . . . . . . . . . . . 1997 272,911,760 272,646,925 1944 138,397,000 132,885,000 . . . . . . . . . . . . 1996 269,667,391 269,394,284 1943 136,739,000 134,245,000 . . . . . . . . . . . . 1995 266,557,091 266,278,393 1942 134,860,000 133,920,000 . . . . . . . . . . . . 1994 263,435,673 263,125,821 1941 133,402,000 133,121,000 . . . . . . . . . . . . 1993 260,255,352 259,918,588 1940 131,820,000 131,669,275 . . . . . . . . . . . . 1992 256,894,189 256,514,224 1939 131,028,000 130,879,718 . . . . . . . . . . . . 1991 253,492,503 252,980,941 1938 129,969,000 129,824,939 . . . . . . . . . . . . 1990 249,225,000 248,709,873 1937 128,961,000 128,824,829 . . . . . . . . . . . . 1989 247,342,000 246,819,000 1936 128,181,000 128,053,180 . . . . . . . . . . . . 1988 245,021,000 244,499,000 1935 127,362,000 127,250,232 . . . . . . . . . . . . 1987 242,804,000 242,289,000 1934 126,485,000 126,373,773 . . . . . . . . . . . . 1986 240,651,000 240,133,000 1933 125,690,000 125,578,763 . . . . . . . . . . . . 1985 238,466,000 237,924,000 1932 124,949,000 124,840,471 47 118,903,899 47 118,903,899 1984 236,348,000 235,825,000 1931 124,149,000 124,039,648 46 117,455,229 47 118,148,987 1983 234,307,000 233,792,000 1930 123,188,000 123,076,741 46 116,544,946 47 117,238,278 1982 232,188,000 231,664,000 1929 121,769,939 46 115,317,450 46 115,317,450 1981 229,966,000 229,466,000 1928 120,501,115 44 113,636,160 44 113,636,160 1980 227,061,000 226,545,805 1927 119,038,062 40 104,320,830 42 107,084,532 1979 225,055,000 224,567,000 1926 117,399,225 35 90,400,590 41 103,822,683 1978 222,585,000 222,095,000 1925 115,831,963 33 88,294,564 40 102,031,555 1977 220,239,000 219,760,000 1924 114,113,463 33 87,000,295 39 99,318,098 1976 218,035,000 217,563,000 1923 111,949,945 30 81,072,123 38 96,788,197 1975 215,973,000 215,465,000 1922 110,054,778 30 79,560,746 37 92,702,901 1974 213,854,000 213,342,000 1921 108,541,489 27 70,807,090 34 87,814,447 1973 211,909,000 211,357,000 1920 106,466,420 23 63,597,307 34 86,079,263 1972 209,896,000 209,284,000 1919 105,063,000 104,512,110 22 61,212,076 33 83,157,982 1971 207,661,000 206,827,000 1918 104,550,000 103,202,801 20 55,153,782 30 79,008,412 1970 204,270,000 203,211,926 1917 103,414,000 103,265,913 20 55,197,952 27 70,234,775 1969 202,677,000 201,385,000 1916 101,965,984 11 32,944,013 26 66,971,177 1968 200,706,000 199,399,000 1915 100,549,013 10 31,096,697 24 61,894,847 1967 198,712,000 197,457,000 1914 99,117,567 . . . . . . 24 60,963,309 1966 196,560,000 195,576,000 1913 97,226,814 . . . . . . 23 58,156,740 1965 194,303,000 193,526,000 1912 95,331,300 . . . . . . 22 54,847,700 1964 191,889,000 191,141,000 1911 93,867,814 . . . . . . 22 53,929,644 1963 189,242,000 188,483,000 1910 92,406,536 . . . . . . 20 47,470,437 1962 186,538,000 185,771,000 1909 90,491,525 . . . . . . 18 44,223,513 1961 183,691,000 182,992,000 1908 88,708,976 . . . . . . 17 38,634,759 1960 179,933,000 179,323,175 1907 87,000,271 . . . . . . 15 34,552,837 1959 177,264,000 176,513,000 1906 85,436,556 . . . . . . 15 33,782,288 1958 174,141,000 173,320,000 1905 83,819,666 . . . . . . 10 21,767,980 1957 171,274,000 170,371,000 1904 82,164,974 . . . . . . 10 21,332,076
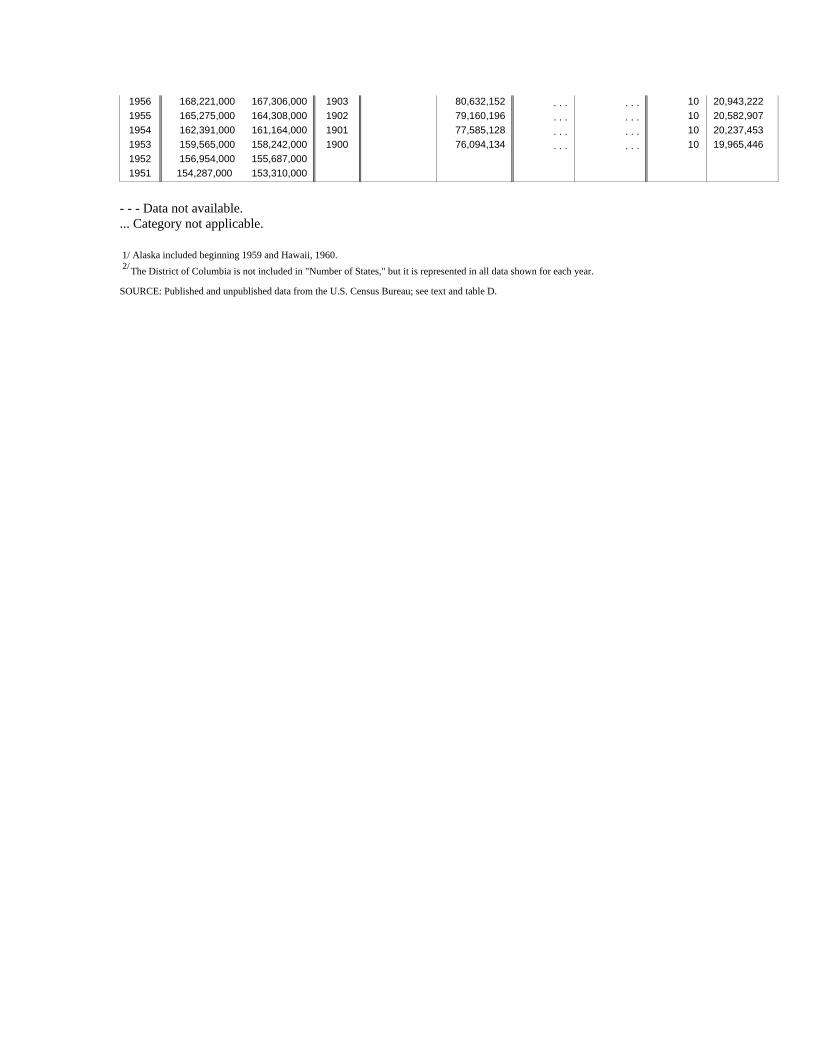
1956 168,221,000 167,306,000 1903 80,632,152 . . . . . . 10 20,943,222 1955 165,275,000 164,308,000 1902 79,160,196 . . . . . . 10 20,582,907 1954 162,391,000 161,164,000 1901 77,585,128 . . . . . . 10 20,237,453 1953 159,565,000 158,242,000 1900 76,094,134 . . . . . . 10 19,965,446 1952 156,954,000 155,687,000 1951 154,287,000 153,310,000
- - - Data not available. ... Category not applicable.
1/ Alaska included beginning 1959 and Hawaii, 1960.2/The District of Columbia is not included in "Number of States," but it is represented in all data shown for each year.
SOURCE: Published and unpublished data from the U.S. Census Bureau; see text and table D.
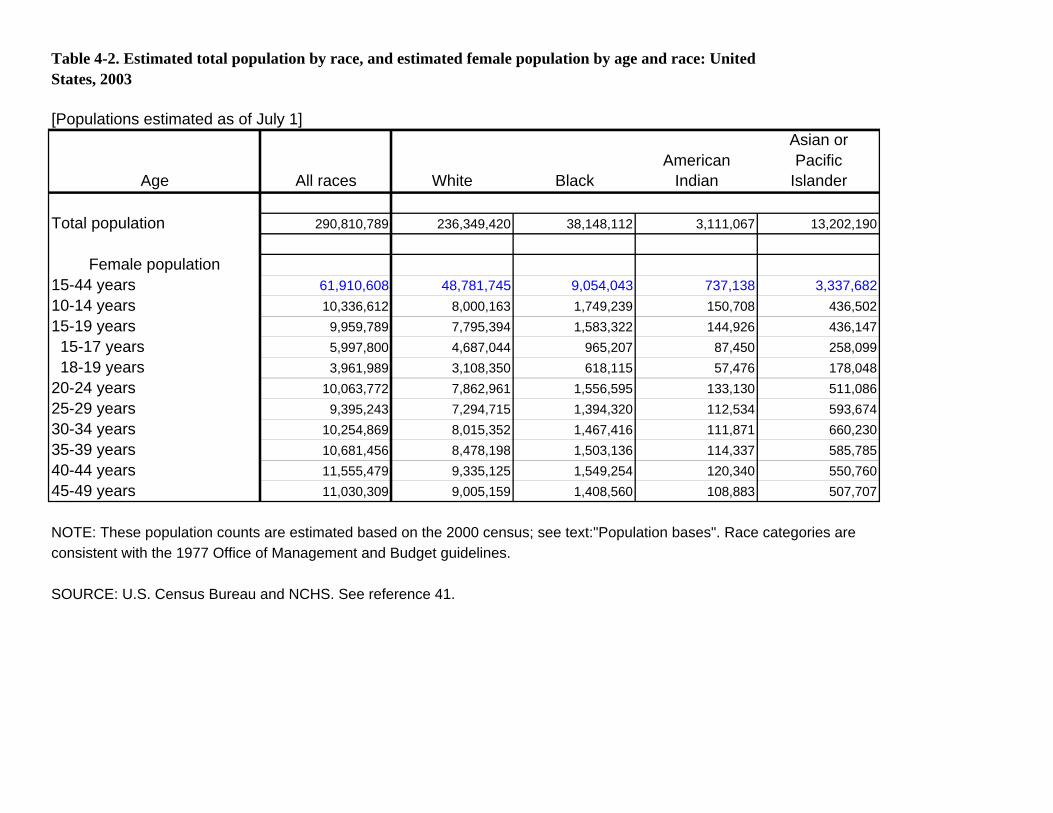
Table 4-2. Estimated total population by race, and estimated female population by age and race: United States, 2003
[Populations estimated as of July 1]
Age All races White Black American
Indian
Asian or Pacific
Islander
Total population 290,810,789 236,349,420 38,148,112 3,111,067 13,202,190
Female population 15-44 years 61,910,608 48,781,745 9,054,043 737,138 3,337,682 10-14 years 10,336,612 8,000,163 1,749,239 150,708 436,502 15-19 years 9,959,789 7,795,394 1,583,322 144,926 436,147 15-17 years 5,997,800 4,687,044 965,207 87,450 258,099 18-19 years 3,961,989 3,108,350 618,115 57,476 178,048
20-24 years 10,063,772 7,862,961 1,556,595 133,130 511,086 25-29 years 9,395,243 7,294,715 1,394,320 112,534 593,674 30-34 years 10,254,869 8,015,352 1,467,416 111,871 660,230 35-39 years 10,681,456 8,478,198 1,503,136 114,337 585,785 40-44 years 11,555,479 9,335,125 1,549,254 120,340 550,760 45-49 years 11,030,309 9,005,159 1,408,560 108,883 507,707
NOTE: These population counts are estimated based on the 2000 census; see text:"Population bases". Race categories are consistent with the 1977 Office of Management and Budget guidelines.
SOURCE: U.S. Census Bureau and NCHS. See reference 41.
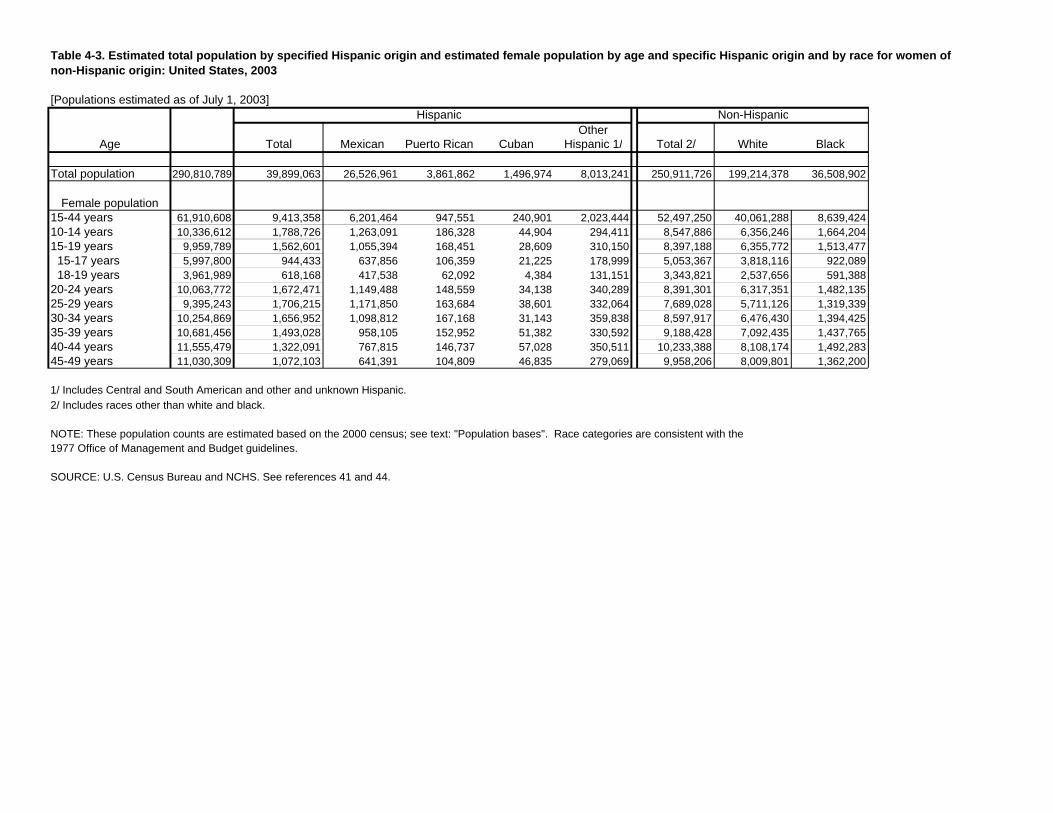
Table 4-3. Estimated total population by specified Hispanic origin and estimated female population by age and specific Hispanic origin and by race for women of non-Hispanic origin: United States, 2003
[Populations estimated as of July 1, 2003]
Age
Total population 290,810,789
Female population 15-44 years 61,910,608 10-14 years 10,336,612 15-19 years 9,959,789
15-17 years 5,997,800 18-19 years 3,961,989
20-24 years 10,063,772 25-29 years 9,395,243 30-34 years 10,254,869 35-39 years 10,681,456 40-44 years 11,555,479 45-49 years 11,030,309
Total
39,899,063
9,413,358 1,788,726 1,562,601
944,433 618,168
1,672,471 1,706,215 1,656,952 1,493,028 1,322,091 1,072,103
Hispanic
Mexican Puerto Rican
26,526,961 3,861,862
6,201,464 947,551 1,263,091 186,328 1,055,394 168,451
637,856 106,359 417,538 62,092
1,149,488 148,559 1,171,850 163,684 1,098,812 167,168
958,105 152,952 767,815 146,737 641,391 104,809
Other Cuban Hispanic 1/
1,496,974 8,013,241
240,901 2,023,444 44,904 294,411 28,609 310,150 21,225 178,999
4,384 131,151 34,138 340,289 38,601 332,064 31,143 359,838 51,382 330,592 57,028 350,511 46,835 279,069
Non-Hispanic
Total 2/ White
250,911,726 199,214,378
52,497,250 40,061,288 8,547,886 6,356,246 8,397,188 6,355,772 5,053,367 3,818,116 3,343,821 2,537,656 8,391,301 6,317,351 7,689,028 5,711,126 8,597,917 6,476,430 9,188,428 7,092,435
10,233,388 8,108,174 9,958,206 8,009,801
Black
36,508,902
8,639,424 1,664,204 1,513,477
922,089591,388
1,482,135 1,319,339 1,394,425 1,437,765 1,492,283 1,362,200
1/ Includes Central and South American and other and unknown Hispanic. 2/ Includes races other than white and black.
NOTE: These population counts are estimated based on the 2000 census; see text: "Population bases". Race categories are consistent with the 1977 Office of Management and Budget guidelines.
SOURCE: U.S. Census Bureau and NCHS. See references 41 and 44.
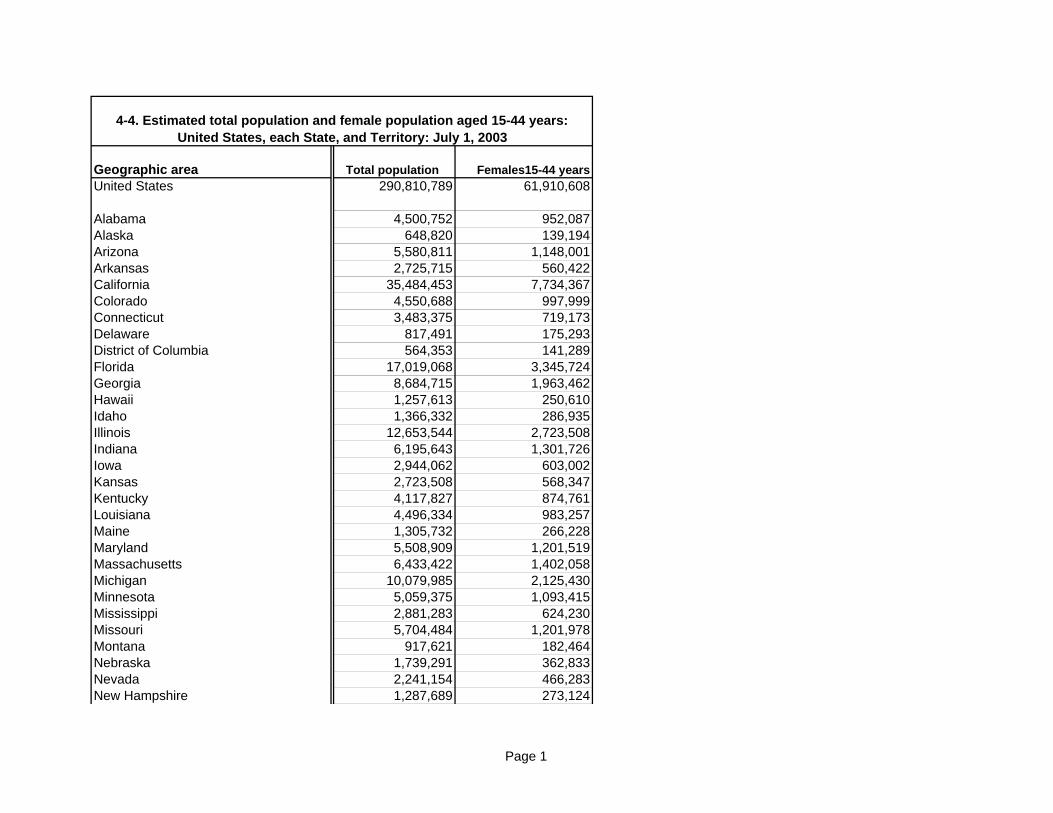
4-4. Estimated total population and female population aged 15-44 years: United States, each State, and Territory: July 1, 2003
Geographic area Total population Females15-44 years United States
Alabama Alaska Arizona Arkansas California Colorado Connecticut Delaware District of Columbia Florida Georgia Hawaii Idaho Illinois Indiana Iowa Kansas Kentucky Louisiana Maine Maryland Massachusetts Michigan Minnesota Mississippi Missouri Montana Nebraska Nevada New Hampshire
290,810,789 61,910,608
4,500,752 952,087 648,820 139,194
5,580,811 1,148,001 2,725,715 560,422
35,484,453 7,734,367 4,550,688 997,999 3,483,375 719,173
817,491 175,293 564,353 141,289
17,019,068 3,345,724 8,684,715 1,963,462 1,257,613 250,610 1,366,332 286,935
12,653,544 2,723,508 6,195,643 1,301,726 2,944,062 603,002 2,723,508 568,347 4,117,827 874,761 4,496,334 983,257 1,305,732 266,228 5,508,909 1,201,519 6,433,422 1,402,058
10,079,985 2,125,430 5,059,375 1,093,415 2,881,283 624,230 5,704,484 1,201,978
917,621 182,464 1,739,291 362,833 2,241,154 466,283 1,287,689 273,124
Page 1
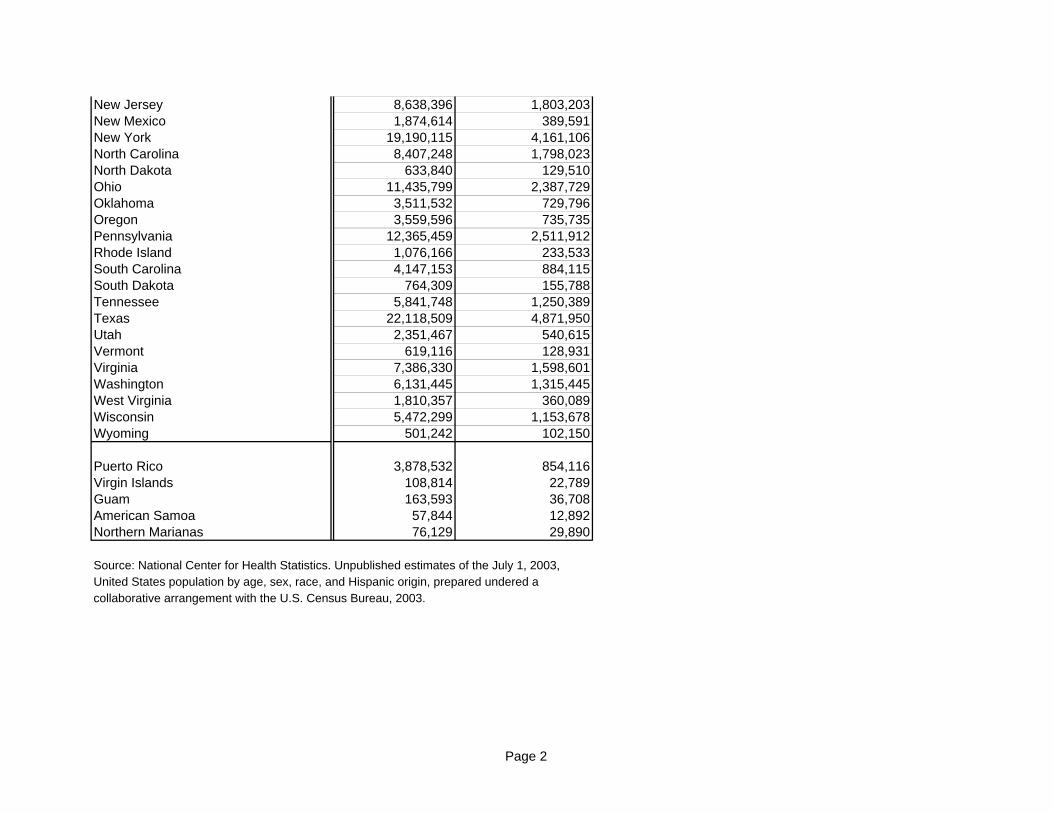
New Jersey 8,638,396 1,803,203 New Mexico 1,874,614 389,591 New York 19,190,115 4,161,106 North Carolina 8,407,248 1,798,023 North Dakota 633,840 129,510 Ohio 11,435,799 2,387,729 Oklahoma 3,511,532 729,796 Oregon 3,559,596 735,735 Pennsylvania 12,365,459 2,511,912 Rhode Island 1,076,166 233,533 South Carolina 4,147,153 884,115 South Dakota 764,309 155,788 Tennessee 5,841,748 1,250,389 Texas 22,118,509 4,871,950 Utah 2,351,467 540,615 Vermont 619,116 128,931 Virginia 7,386,330 1,598,601 Washington 6,131,445 1,315,445 West Virginia 1,810,357 360,089 Wisconsin 5,472,299 1,153,678 Wyoming 501,242 102,150
Puerto Rico 3,878,532 854,116 Virgin Islands 108,814 22,789 Guam 163,593 36,708 American Samoa 57,844 12,892 Northern Marianas 76,129 29,890
Source: National Center for Health Statistics. Unpublished estimates of the July 1, 2003, United States population by age, sex, race, and Hispanic origin, prepared undered a collaborative arrangement with the U.S. Census Bureau, 2003.
Page 2