Embed Size (px)
Citation preview
VITAL STATISTICS OFTHE UNITED STATES
1975
VOLUME II—MORTALITY
PART A
U.S.DEPARTMENT OFHEALTH, EDUCATION, AND WELFARE
PUBLIC HEALTH SERVICE
NATIONAL CENTER FOR HEALTH STATISTICS
Hyattsville, Maryland: 1979 (PHS) 79-1114
NATIONAL CENTER FOR HEALTH STATISTICS
DOROTHY P. RICE, Director
ROBERT A. ISRAEL, Deputy Director
JACOB J. FELDMAN, Ph.D., Associate Director for Amdysis
GAIL F. FISHER, Ph.D., Associate Director for the Cooperative Health Statistics Systems
ELIJAH L. WHITE, Associate Director for Data Systems
JAMES T. BAIRD, JR., Ph.D., Associate Director for International Statistics
ROBERT C. HUBER, Associate Director for Management
MONROE G. SIRKEN, Ph.D., Associate Director for Mathematical Statistics
PETER L. HURLEY, Associate Director for Operations
JAMES M. ROBEY, Ph.D., Associate Director for Program Development
PAUL E. LEAVERTON, Ph.D., Associate Director for Research
ALICE HAYWOOD, Information Officer
DIVISION OF VITAL STATISTICS
JOHN E. PATTERSON, Director
ALICE M. HETZEL, Deputy Director
MARVIN C. TEMPLETON, Assistant to the Director
ROBERT J. ARMSTRONG, M.S., Actuarial Adviser
HARRY M. ROSENBERG, Ph.D. Chiej Mortality Statistics Branch
ROBERT L. HEUSER, M.A., Chief IVatality Statistics Branch
ALICE M. HETZEL, ChieJ Marriage and Divorce Statistics Branch
LOREN E. CHANCELLOR, chief Registration Methods Branch
WILLIAM F. PRATT, Ph.D., Chiei Family Growth Survey Branch
MARSHALL C. EVANS, chief Data Control Branch
MABEL G. SMITH, Acting Chief Statistical Resources Branch
RITA U. HOFFMAN, Chief Programming Branch
For sale by the Superintendent of Documents, U.S. Government Printing Oflice Washington, D.C. 20402
Stock Number 017-022-00657-0
---------------------------
--------------
------- ---------------------
----------------
------- ------ ------ --------------
------------------------------------------------
- -- --- ---- - --- -----
-----------------------------------
---------------------------
-----------------------------
------------------------
---------------
------------------------------------------------
----------
---------------
---------------------------------------------
----------------------------------------
-------
Section 6. Tecb~ka2Appendix
Sources of dataDeath and fetal-death statisticsStandard certificates
History
Classification of dataClassification by occurrence andresidence
Geographic classificationAge,Race and colorFetal deaths .-Cause of death --------------------“Maternal deathsReport of autopsy
Figures
Page
6-3 6-3 6-3
6-5
6-6
6-6 6-7 6-8 6-8 6-9
6-12 6-18 6-18
Page
Mortality by month and date of death 6-19
Quality of data 6-19Completeness of registration 6-19Massachusetts data 6-19Quality control procedures 6-19Estimates of errors arising from50-percent sample 6-20
Computation of rates and other measures 6-20
Population bases 6-20 Age-adjusted death rates 6-21
Symbols used in tables 6-21
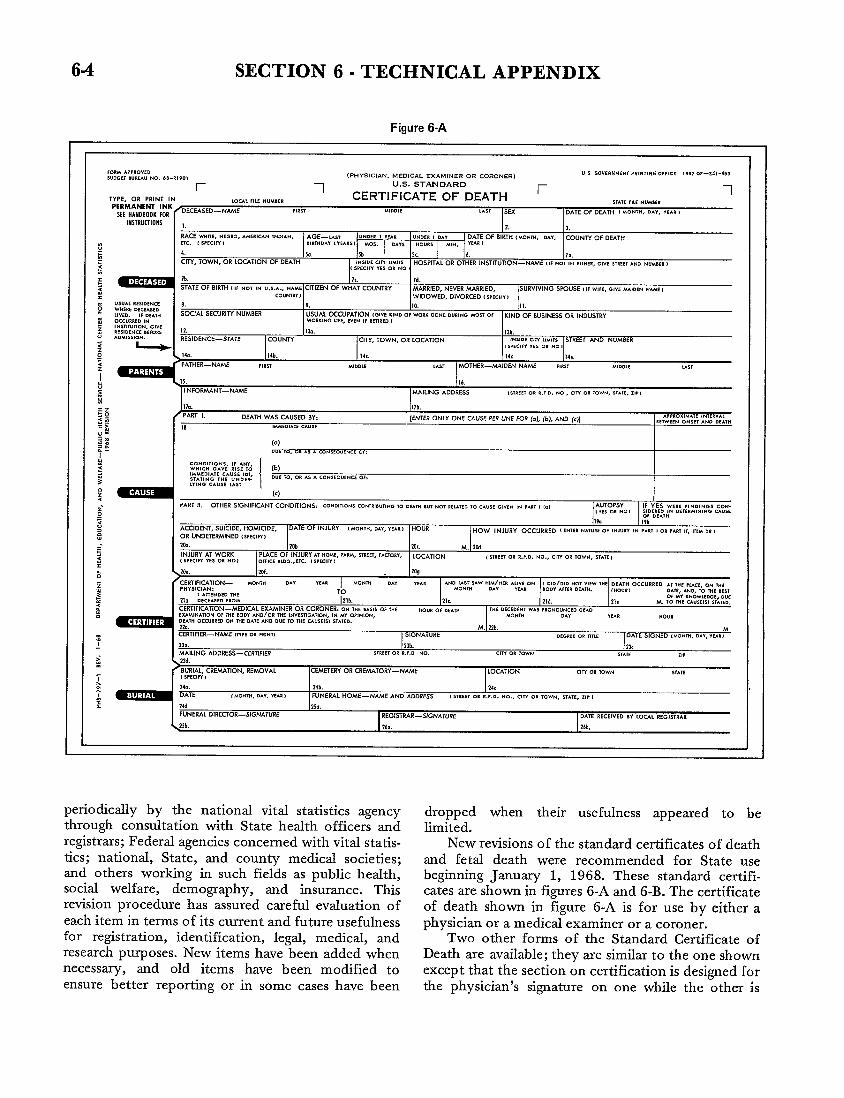
6-A. Standard Certificate of Death 6-4
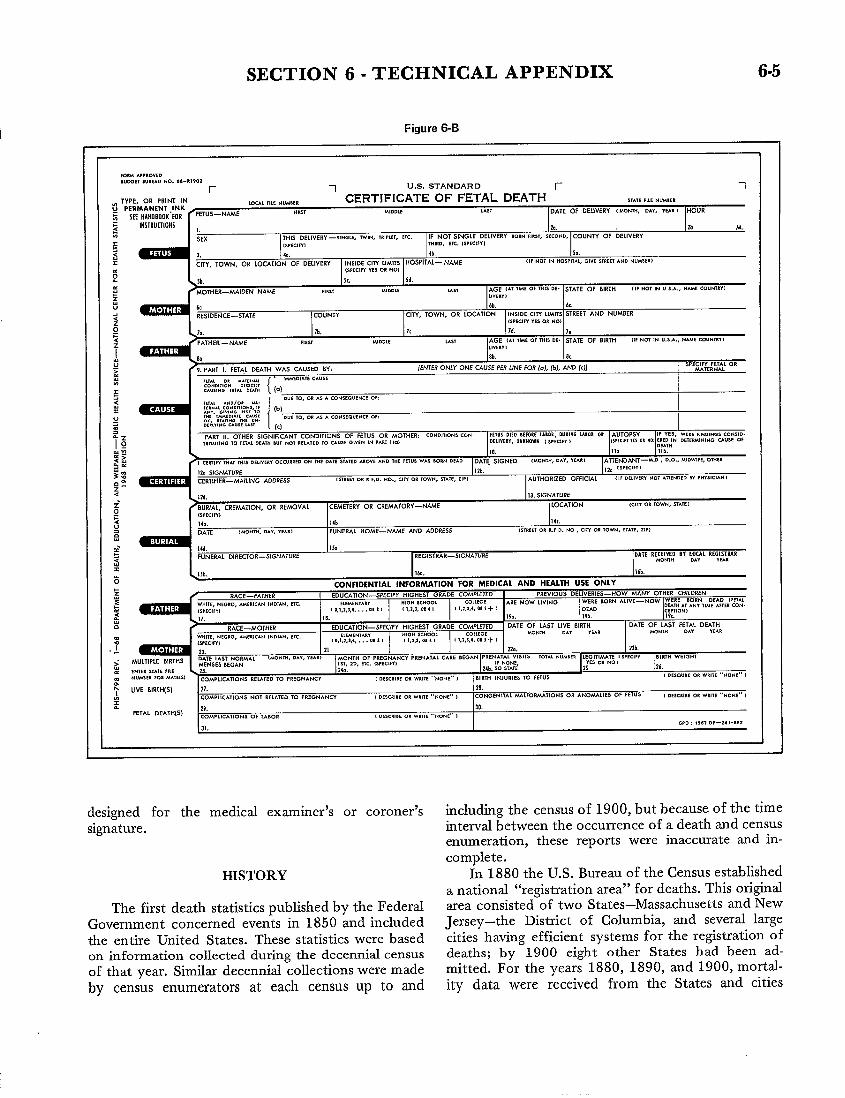
6-B. Standard Certificate of Fetal Death 6-5
Population tables
6-10 Population of birth- and death-registration States, 1900-1932, and United States, l9OO-l975----------------------------------------------------- 6-22
6-2. Estimates of total resident population of the United States, by age, race$ and sex: July 1, l975------------------------------------------------------ 6-23
6-3. Estimates of total resident population by age, for the United States, each division and State, Guam, Puerto Rico, andVirgin Islands: July 1, 1975 6-24
6-1
SECTION 6- TECHNICAL APPENDIX
SOURCES OF DATA on information derived from computer tapes of data coded by an increasing number of States according to
Death and fetal-death statistics NCHS specifications and provided to NCHS through
Mortality statistics for 1975 are again, as for all the Cooperative Health Statistics System. The year in
previous years except 1972, based on information which utilization of State-coded data was begun is
from all death records received by the National shown below for each of the 23 States now furnishing
Center for Health Statistics (NCHS). The records are demographic data.
furnished by all the States, the District of Columbia, and the independent registration area of New York 1971 1974
City. Mortality statistics for 1972 were based on Florida Illinois
information obtained from a 50-percent sample of Iowa
death records instead of from all records, as a result 1972 Kansas
of personnel and budgetary restrictions. Fetal death Maine Montana
statistics for 1975 were based, as always, on all fetal Missouri Nebraska
death records received. New Hampshire Oregon
Although the United States vital statistics system Rhode Island South Carolina
covers the 50 States, the District of Columbia, Puerto Vermont 1975
Rico, the Virgin Islands, and Guam, in this report the Maryland
term United States refers only to the aggregate of the North Carolina
50 States (including New York City) and the District 1973 Oklahoma
of Columbia. Colorado Louisiana
Death statistics for Puerto Rico, the Virgin Michigan Tennessee
Islands, and Guam were not included for 1972 but New York (except Virginia
are included in Section 8 of the reports for each of New York City) Wisconsin
the years 1973-75. The Virgin Islands were admittedto the “registration area” for deaths in 1924; Puerto Utilization of State-coded data was begun in 1974
Rico, in 1932; and Guam, in 1970. Tabulations for for two States furnishing medical data (Iowa and
Puerto Rico and the Virgin Islands have been regu- Michigan) and in 1975 for five more States furnishing
larly shown in the annual volumes from the year of medical data (Louisiana, Nebraska, North Carolina,
their admission through 1971, except for the years Virginia, and Wisconsin).
1967 through 1969. Tabulations for Guam have been For the remaining 27 States, the District of
included only for the years 1970 and 1971. Informa- Columbia, and New York City, mortality statistics for
tion for 1972 for these three areas is published in the 1975 are again based on information obtained direct-
respective annual vital statistics reports of the Depart- ly from copies of the original certificates received
ment of Health of the Commonwealth of Puerto from the registration offices. All fetal-death data are
Rico, the Department of Health of the Virgin Islands, obtained directly from copies of the original certifi-
and the Department of Public Health and Social cates,
Services of the Government of Guam. Another change from procedures for prior years, Standard certificates
begun for 1971 and continued for 1972 through Standard certificates of death and fetal death, 1975, is that tabulations of deaths are based on issued by the Public Health Service, have served for information from two sources. Before 1971 tabula- many years as the principal means of attaining tions of deaths and fetal deaths were based solely on uniformity in the content of the documents used to information obtained from copies of the original collect information on these events. They have been certificates. The info~ation from these copies was modified in each State to the extent necessitated by edited, classified, and tabulated. For 1960 and for the particular needs of the State or by special each year thereafter through 1970 all mortality provisions of the State vital statistics law. However, information taken from these records has been the certificates of most States conform closely in transferred by NCHS to magnetic tape for computer content and arrangement to the standard certificates. processing. The first issue of the Standard Certificate of
However, beginning with 1971 for demographic Death appeared shortly before the formation of the data and 1974 for medical data, tabulations are based registration area. Since then it has been revised
6-3
64 SECTION 6- TECHNICAL APPENDIX
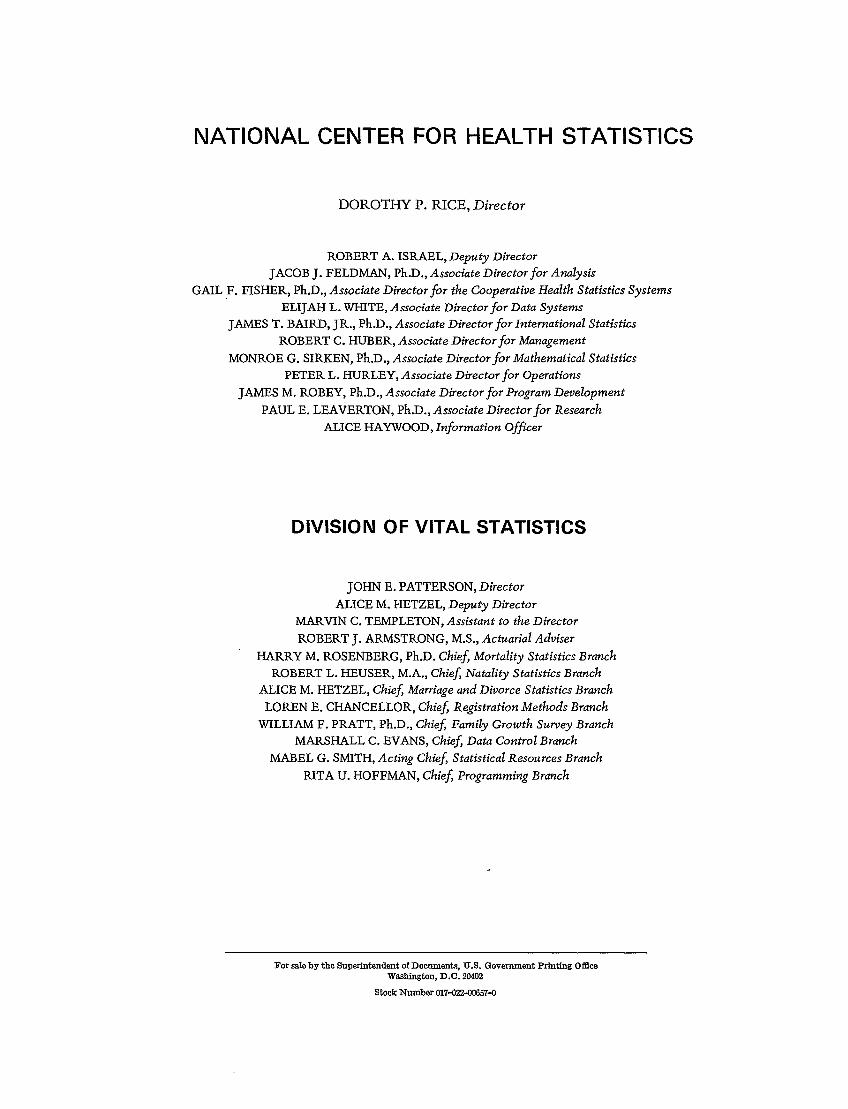
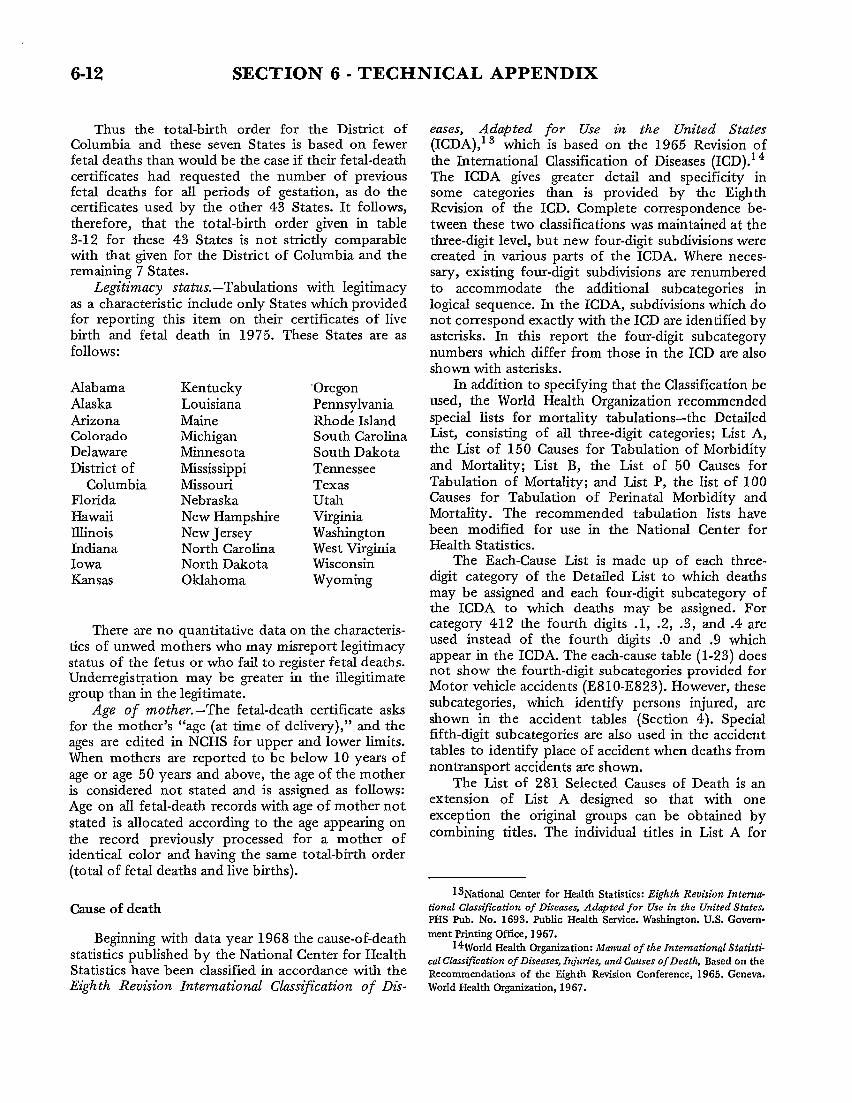
Figure 6-A
,O”IA A, P,OV,. (PHYSICIAN. MEmCAL EXAMINER OR CORONEFT)
U S GOVSI. MEN, PR, N,, NG O,F,CE l%, OF-MI-65$ BUDGET BU,EAU NO. 68-1,90,
U.S. STANDARD r 1 r 1
TYPE, OR PRINT IN LOCAL FILE NUMBER CERTIFICATE OF DEATH
SIATE n,c N“14,ER
p;EMH;Nfi}& Hy /DECEASED—NAME ,,,$, $!,0.,S ,,s, SEX DATE of OEATH I MONTH, DAY, YEARI
INSTRUCTIONS ,, 2. 3,
RACE WH17E, NEGRO, AMERICAN IND!A?4, AGE——LAS, UNDER I YEA, “Nom , .,, DATE OF SIRTH { mow”, DAY, COUNTY OF DEATH ETc. c s,,.,,,, UIuwo.y I YEARSI *OS. ..,s “0”,s M,.. WA, I
c ,= 4. 50. Sb SC 6, 70. : ClTY, TOWN, OR LOCATION OF DEATH HOSPITAL OR OTHER INSTITUTION-NAME (1PNOT 1. EITHER, GIVE SIREE1 AND )4UIABER 1
c sm.,,” “5s 0, No > ;
lb.
$ STATE OF BIRTH (,, No, IN “,s..., NAME CITIZEN OF WHAT COUNTRY MARRIED, NEVER MARRIED, SURVPflNG SPOUSE (IF WIFE, GIVE WIDEN NANf ,
x COUNIRY) WIDOWED, mvoricm (SPECIN B
;
~
USUAL RES,DE.CE WHERE DECEASED LIVED. IF DE.,”
INOCCURRED
8. 9. 10.
SOCIAL SECURITY NUMBER USUAL OCCUPATION [GIVE KIND OF WORKDONEDU,,NO /.!0S, of KIND OF 8USINESS OR INDUSTRY WOR<,NGUK, EVEN IF RETIRED,
0.s,,,”,,0., c ,“, : RESIDENCE BEFORE I 2. Isa. 13b. “ ADw,s, o.. RESIDENCE—STATE COUNTY CITY, TOWN, OR LOCATION ,.S!0S CITl LIMIIS STREET AND NUM8ER $
0 14b. I 4,.G
MLXILE
: > I NFORMANT-NmE
:
:3 $= DEArn WA5 CAU5ED BY,
.~ 18 ,M#Aw.1.,, c.”,,
. . =. -a [.) ~: 0“6 m, ., A, A .0. s,.”,.., Ofi
: :
CO NO, T,ONS, WHKH GAVE
,, AN,, RISE m [b)
WMED,A,E CAUSE ,0,, SIAT, N. THE “Nom. DUE rO# OR As A cONsEQoENCEOf:
$ ,“,.0 CAUSE LA,, {
? (.) *
, W,cn$v “Es m .0,
14d 14,,
,.s, MOTHER—MAIDEN NAME ,,Rs, M,DO,E usr
I&.
MAILING ADDRESS (STREET 08 z.,., .0, aw OR mww smrz, ZI*I
Ilb. A,, ROX,MA,L (?4,,,[fNrER ONLY ONE cAu5E PER LINE FOR fdj, ~bj, AND (cjI ,! TWE,F4 0?4,,1 AND .,.7”
”,,
z. pART u, OTHER SIGNIFICANT CONDITIONS: c...ms. s cONIRm.T,.G 70 MAT. w .0, MUTED ,0 c.”,, GWEN w PM I ,., AUTOPSY IF YES WERE flNOINOS COM, Y,, 0, .0, ,,0,”,0 ,. c.,,ERMN,NG CAUSE
0, 0,., ” I 9. 19b
i ACCIDENT, SUICIDE, HOMICIDE, DATE OF INJURY ( MONTH, o.”, “me, HOUR HOW INJURY OCCURRED I ENIER NATUREOF INJURY 1. P*R1 I OR PAW I,, IIEM 18,2 OR UNDETERMINED {SPECIFY,.
‘zCa. ?Ob 20<. M. 2W :
INJURY AT WORK PIACE OF INJURY M HOME,FARM,STREET, FACTO?.,, LOCATION , SIREE1 OR R.F,D. NO., CITY OR TOWN, STAIE ),$ [ SPECIFYYES OR NO) OFFICE Wm., ETC. 1WECI!Y 1 x
3 20,. 2of. 2og
% CERTIFICATION— MOW. D., WAR MONTH DAY PHYSICIAN:
“,., ,NOM:;:”SAW H:Ap ,::;Row ; #AD:riRN::A7LEw THE DeA,” OCC”RREC,., ,“, ,~~~, ~. we
2 21,. OECEASEDFROM 121b. ‘EIc 21d, of MY SNmv,m.x< clue
210 M. 10 lHE CAU5EISI 5TA7ED. <
CERTIFICATION-MEDICAL EXAMINER OR CORONER: ON T“E SAs,s OF WE HOUR Of OCATH l“E DECEDEW WAS Pnowl”.cm OEM
: EXAMINATIONOF mE MD” At4D/OR THE lNVESTIGATIDN, IN MY O?! W, ON, MONTH DAY YfAR HOUR
: , AnENO,. ,“, TO <Hour, ONE, AND, 10 WE 8SS,
DEATH OCCURRED 0. THE DATE AND DUE TO ~HE CAUSE(S1 STAYED. m.
CERTIFIER—NAME MPE o, PRW7,z ~
MAILING ADDRESS—CERTIFIER
2 .
BURlAL, CREMATION, REMOVAL
i [ 3PECIFY,
& 240. DATE ( Mow”, 0.7, WA.,
+24d FUNERAL DIRECTOR-SIGNATURE
\2Sb.
M. 22b. M \51GNATuRE DEGREE 0, n,,, I DATE SIGNED [hum+,”, O*V,“,.”>
23, cm O* TOW. sr~w ZIP
CEMETERY OR CREMATORY-NAME LOCATION CIW OR ,0%’$4 SIAIE
Mb. 24< FUNERAL HOME—NAME AND ADDRESS ( s,,,,, 0, ,.,... NO., cl,” 0, ,0”., ,,A,E, z,, ,
25,.
REGISTRAR-SIGNA7URE DATE RECEIVED BY LDCA1 REGISIRAR
260. 26b.
periodically by the national vital statistics agency dropped when their usefulness appeared to bethrough consultation with State health officers and limited.registrars; Federal agencies concerned with vital statis- New revisions of the standard certificates of deathtics; national, State, and county medical societies; and fetal death were recommended for State useand others working in such fields as public health, beginning January 1, 1968. These standard certifisocial welfare, demography, and tisurance. This cates are shown in figures 6-A and 6-B. The certificaterevision procedure has assured careful evaluation of of death shown in figure 6-A is for use by either aeach item in terms of its current and future usefulness physician or a medical examiner or a coroner.for registration, identification, legal, medical, and Two other forms of the Standard Certificate ofresearch purposes. New items have been added when Death are available; they are similar to the one shownnecessary, and old items have been modified to except that the section on certification is designed forensure better reporting or in some cases have been the physician’s signature on one while the other is
SECTION 6- TECHNICAL APPENDIX
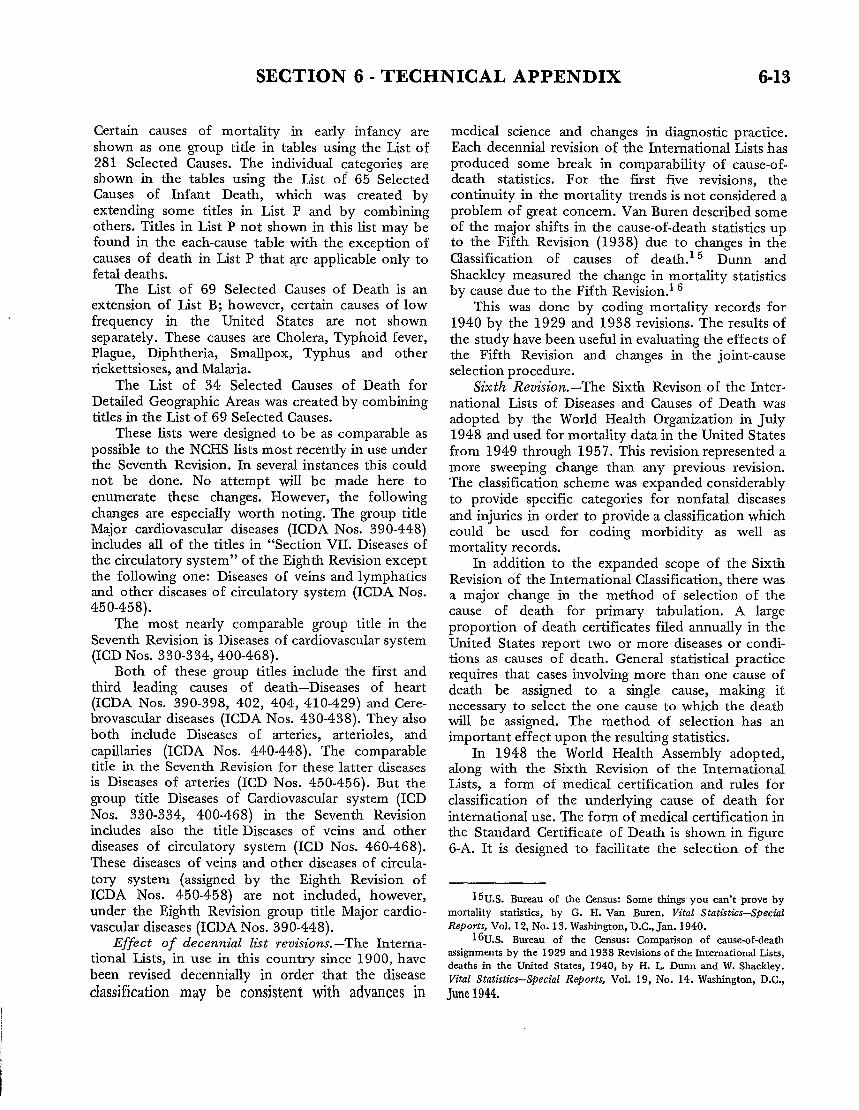
Figure 6-B
,OW APPROVED
,Uffi El lUREAU NO. 68- RIV02
r 1 U.S. STANDARD r 1
TYPE, OK PRINT IN LOCAL WE NUM8ER CERTIFICATE OF FETAL DEATH STATE FILE NUMBER
~ PERMANENT ,INK
. SEE HANDBOOKFOR ‘FETUS-NAME flRS1 MIDDIE LAsr DATE OF DELIVERY 1MONm# DAY, y~e ) HOUR
= INSTRUOIOIIS ,~ 20. lb M. .
SEX THIS DELIVERY —SINGLE, WINS lR,~LET, C,c. IF NOT SINGLE DELIVERY BORN FIRST, StCOND, COUNTY OF DELIVERY
g [Smclfw ,“,,., ETC. lsPEC1fV1
i% x
3,
CITY, TOWN, Ok
k,
10 CATION OF DELIVERY INSIDE CITY LIMITS
kb.
HOSPITAL— NAME
5.,
(IF NOT IN HOSPITAL, OIVE SIREET ANO NUM8ER1
g: (S?ECIW YES OR NO]
~
. . -i
MOTHER—MAIDEN NAME ,,,s, M!..,, LAS, AGE (AT TIME OF THIS DE- STATE OF BIRTH (IF NOT IN U S. A., NtiE COUNTRY1
. ,,”,, ”3
6, 16b. 6,,
RESIDENCE—STATE COUNTY CITY, TOWN, OR LOCATION INSIDE CIIY LIMITS STREET AND NUMBER
lS?ECIN YES OR NO)
FATHER - NAME FIRST MIDDLE LAST AGE (Al TIME OF lHI$ DE. STATE OF BIRTH [1, NO1 IN U. S.A., NAME COUNTRY)
LIVEN]
8b, 8<,
9. PART 1. FSTA,L DEATH WAS CAUSED BY: [ENTER ONLY ONE CAUSE PER LINE FOR (o}, (b), AND (c)] SPE;l~;E[fi~AL 0 R
,,,., 0, ..,[..., (’ IMMEDIATE cAusE
::i’$!t:” x’!%}; \ (.)
C.”E ,0, on AS A COMSEO”ENCE ok ,,,,, A.. /o* *. ,,”.., ,0.0!,,0.s.
I :A”&!! (b);“.,”, , Cl&:,,.
l&i,r:~ol!:A.”,n:A,m. “u’ ‘“J “’ “’ A co”’’ou’”cf 0’:
1 (.1
PART Il. OTHER SIGNIFICANT CONDITIONS OF FETUS OR MOTHER: cOND,,,OI+$ CON. FETUS DIED MFORE lABOR, DURING U1OR OR AUTOPSY IF YES, WERE H*DINGS CONS,..
TR18U11N0 10 iEIAL DEAIH BUr NOT WIATED ,0 CAUSE GIvEN IN PART 1Id DELIVERY, UNKNOWN ( WUM, ) IK?tclil 11$ Ot HOI ~EEDJN DElE9JAlNlNG CAUSE Of
10. 110 llb.
1 CER;l FY 1..1 THIS DELIVERY OCCUR*ED 0. THE DA~E S1A7ED ABOVE AND 1.6 FETUS WAS BORN DEAD DATE SIGNED IMONIH, DAY, YEAtl ATTENDANT-M.. z 0.0.. M,owt,,, Om,n
120 SIGNATURE I 2b.
CERTIFIER—MAILING ADDRESS 1S1,,,1 OR R ,.0. NO., CIT! OR TOWN, $TAIE, ZIP I lAUTHORlzED OFFICIAL l’” (If OELWERV .07 .11,..,. BY PHYSICIAN)“’’”w’
13. SIGNATURE
BURIAL, CREMATION, OR REMOVAL CEMETERY OR CREMATORY—NAME LOCATION [cm OR10WN, 3TATE I
~ 14,. Tkb 114(.
DATE 1MOM., o.,, ?,AR) FUNESAL HOME—NAME AND ADDRESS ,s7,E,, 0, ,., D. NO , C,W OR 10WM, S7A7E, 21,> z . :..
. 146. 15.
: FUNERAL DIRECTOR-SIGNATURE REGISTRAR—SIGNATURE DATE RE;~~Ej BY I$ICAL RE:&1RR4R
<., +€z
15b. 160. 16b,
s CONFIDENTIAL INFORMATION FOR MEDICAL AND HEALTH USE ONLY
5 EDUCATION—SPECIFY HIGHEST GRADE COMPLETED pREvlOus DELIVERIES—HOW MANY OTHER cHuOREN
: ‘+/”,,,, NIGRO, AMERICAN INDIAN, ETC. MAIM A, ANY ,,)4, A“m CON.
& ~
a RACE—MOTHER EDUCATION—SPECIFY HIGHEST GRADE COMPIEIED DATE OF WST LIVE BIRTH DATE OF LAST FETAL DEATH
~ w“),,, .,.,0, AME,, CAN ,..,.., Frc. ,MIAEH, AR” H(GH SCHOOL COLLEGE 140NTH
{SPECIN) i %IAW ,1 t ) r Lvl ,, 4 , 0 1,1,1,4, 0: s + ,
0.7 YEAR MONTH DAY ‘IEAR
..- 20. 21 22,. 22b,
s MULTIPLE BIRTHS MONTH OF PREGNANCY PRENATAL CARE BEGAN PRENATAL VISITS TOTAL
~Efis&;E~~JMAL ‘m””m< ““, “AR’ ,$,, ,,, ~,c, ,~pcc,w, ,, NONE, NUMBER LEGITIMATE I SPECIFY
“,5 0, NO> BIRTH WEIGHT
!+ ENTER SIATE FILE 23. 240, 24b. S0 STAIE 2s 26.
m~ NUMB,! FOi ‘A1E[51 COMPLICATIONS RELATED TO PREGNANCY { DESCRIBE OR WRIIE ,, NONE,. 1 BIRTH INJURIES TO FETUS ( DEscamf 0?. WRITE .Wo.f,. B
LIVE BIRIH(S) 27. I 28.
A COMPLICATIONS NOT RELATED To PREGNANcY 1 DESCRIIE OR WRITE ,. NONE., 1 I CONGENITAL l.ULFOSMATlONS OR ANOMALIES DF FETUS 1 DESCRIBE OR WRITE .. NONE” 1 z . 29. 20.
FETAL DEATH(S) COMPLICATIONS OF tABOR 1 DESCRIB. cm WRITE ., NoNE,. 1
.,0 : !,67 0,—,4,-662 31.
designed for the medical examiner’s or coroner’s including the census of 1900, but because of the time signature. interval between the occurrence of a death and census
enumeration, these reports were inaccurate and in-complete.
HISTORY In 1880 the U.S. Bureau of the Census established a national “registration area” for deaths. This original
The first death statistics published by the Federal area consisted of two States—Massachusetts and New
Government concerned events in 1850 and included Jersey–the District of Columbia, and several large the entire United States. These statistics were based cities having efficient systems for the registration of on information collected during the decennial census deaths; by 1900 eight other States had been ad-
of that year. Similar decennial collections were made mitted. For the years 1880, 1890, and 1900, mortal-
by census enumerators at each census up to and ity data were received from the States and cities
6-6 SECTION 6- TECHNICAL APPENDIX
included in this expanding area, but the figures for the entire country were still compiled from the reports of census enumerators.
The annual collection of mortality statistics for the registration area began with the year 1900. In 1902 the Bureau of the Census, which had previously functioned only in census years, was made a permanent agency by an act of Congress. This act authorized the Director of the Bureau of the Census to obtain annually copies of records filed in the vital statistics offices of States and cities having adequate death-registration systems. At that time not all States had enacted laws requiring the registration of deaths, and in many States the existing Iaws were poorly en-forced. The growth of the registration area is indicated in table 6-1.
The death-registration area for 1900 consisted of 10 States, the District of Columbia, and a number of cities located in nonregistration States. In 1900 the registration area included 40.5 percent of the population of the continental United States. The original registration area was predominantly urban and was characterized by a high proportion of white persons. If the reporting cities located in nonregistration States are excluded, the population coverage of the death-registration States is much lower, only 26.2 percent of the total population of the United States.
Statistics of fetal deaths (the term “stillbirth” was used for many years) were first published for the birth-registration area in 1918. However, they were not included in the reports issued for the succeeding 3 years. Beginning with 1922, statistics of fetal deaths have been published each year for the birth-registration area.
Table 6-1 presents for each year through 1932 the estimated midyear population of the United States and the estimated midyear population of the States included in the registration system. Both registration areas included the entire United States for the first time in 1933.
Prior to 1940 most of the national mortality tabulations published by the Bureau of the Census were based on data collected from the registration areas. However, beginning with 1940 all published material given in statistical series for the United States prior to the completion of the death-registration area omits data for registration cities located in nonregistration States and includes only statistics for the registration States. This change decreases the mortality statistics coverage of the United States by the exclusion of cities in nonregistration States, but it has advantages in that more reliable population estimates are available for the registration States than for smaller re~stration areas.
Rates for the expanding group of death-registration States are approximations of rates for the entire Nation, and general comparisons over a long period of time can be made. lhlore exact trends for parts of the United States can be secured through the use of some constant area such as the original registration States or the registration States in 1920.
CLASSIFICATION OF DATA
The principal value of vital statistics data is realized through the presentation of rates which are computed by relating the vital events of a class to the population of a similarly defined class. Vital statistics and population statistics must therefore be classified according to similarIy defined systems and tabulated in comparable groups. Even when the variables common to both, such as geographic area, age, race, and sex, have been similarly classified and tabulated, differences between the enumeration method of obtaining population data and the registration method of obtaining vital statistics data may result in significant discrepancies.
The general rules used in the classification of geographic and personal items for deaths and fetal deaths are set forth in two NCHS instruction manuals.l’2
The classification of certain important items is discussed below.
Classification by occurrence and residence
Tabulations for the United States and specified geographic areas in this report are by place of residence unless stated as by place of occurrence. Before 1970 resident mortality statistics for the United States included alI deaths occurring in the 50 States and the District of Columbia, with deaths of “nonresidents of the United States” assigned to place of death. “Deaths of nonresidents of the United States” refers to deaths that occur in the United States of nonresident aliens, nationals residing abroad, and residents of Puerto Rico, the Virgin Islands, and other possessions of the United States,
I National Center for Health Statistics: Vital statistics, classification and coding instructions for live-birth and fetal-death records, 1975, NCHS Instruct{on Manua~ Part 3. Health Resources Administration. Rockville, Md., July 1974.
*Nation~ Center for He~th Statistics: Vital statistics, demo-
graphic classification and coding instructions for death records, 1975.
NCHS Instruction Manual, Part 4. Health Resources Administration. Rockville, Md., July 1974.
SECTION 6- TECHNICAL APPENDIX 6-7€
Beginning with 1970 United States are not residence.
Tables by place of include both deaths of
deaths of nonresidents of the included in tables by place of
occurrence, on the other hand, residents and nonresidents of
the United States. Consequently, for each year during 1970-75, the total number of deaths in the United States by place of occurrence is somewhat greater than the total by place of residence. For 1975 this difference amounts to 2,256 deaths.
Mortality statistics by place of occurrence are shown in tables 1-10, 1-19, 1-20, 1-30, 3-1, 3-8, 7-1, and 7-7.
Except for the years 1964 and 1965, deaths of nonresidents of the United States occurring in the United States have been treated as deaths of residents of the exact place of occurrence, which in most instances was an urban area. In 1964 and 1965 deaths of nonresidents of the United States occurring in the United States were allocated as deaths of residents of the balance of the county in which they occurred.
Residence em-or.–Results of a 1960 study show that the classification of residence information on the death certificates corresponded closely to the residence classification of the census records for the decedents whose records were matched.3
A comparison of the results of this study of deaths with those for a previous matched record study of births 4 shows that considerable improvement in the quality of residence data had taken place since 1950. The results were the same—an overstatement of events in urban areas by NCHS compared with the U.S. Bureau of the Census classification. The magnitude of the difference was substantially less for deaths in 1960 than it was for births in 1950. Two factors contribute to this difference in magnitude. First, addition in 1956 of an item asking if residence is inside or outside city limits on the standard certificate aided in properly allocating the residence of persons living near cities but outside the corporate limits. The second factor is that there is more likelihood of movement for hospital utilization for births than for deaths.
3National Center for Health Statistics: Comparison of the classification of place of residence on death certificates and matchiig census records, United States, May-August 1960. Vital and Health Statistics. PHS Pub. No. 1000-Series 2-No. 30. Public Health Service, Washington. U.S. Government Printing Office, Jan. 1969.
4National Vital Statistics Dkision: Matched record comparison of birth certificate and census information, United States, 1950, Vital Statistics–Special Reports, Vol. 47, No. 12. Pubfic Health Service. Washington, D.C., Mar. 1962.
Geographic classification
The rules followed in the classification of geographic areas for deaths and fetal deaths are contained in the two instruction manuals referred to previously.
The geographic codes assigned by the National Center for Health Statistics during data reduction of source information on birth, death, and fetal-death records are given in an NCHS instruction manual.5
For 1975 there is an unpublished computer listing of the geographic codes contained in the computer tapes. The 13-digit codes in this listing are “not the same codes as the 5-digit codes for the State-city or State-balance of county. 6 Instead each of these
13-digit codes is a conversion of the two 5-digit codes into a combination code for the State-county-city (7 digits), together with codes for “population size,” SMSA’S and MSEA’S, and metropolitan and non-metropolitan counties. This listing for 1975 is the same as that used for 1970-74. It is planned that it will also be used for each of the remaining years in this decade.
Standard metropolitan statistical areas.–Except in the New England States, a standard metropolitan statistical area (SMSA) is a county or a group of contiguous counties containing at least one city of 50,000 inhabitants or more or “twin cities” with a combined population of at least 50,000 in the 1970 census. In addition to the county or counties containing such a city or cities, contiguous counties are included in an SMSA if, according to specified criteria, they are essentially metropolitan in character and are socially and economically integrated with the centrzd city or cities. 7
In New England the U.S. Office of Management and Budget uses towns and cities rather than counties as geographic components of SMSA’S. The National Center for Health Statistics cannot use the SMSA classification for these States because its data are not coded to identify all towns. Instead the metropolitan State economic area (MSEA) established by the U.S.
5Nationa Center for Herdth Statistics: Vital statistics, vital records
geographic classification, 1970. NCHS Instruction Manual, Part 8. Hesdth Resources Ad-stration. Rockville, Md., 1975.
6~id0
7For a more complete discussion, see U.S. Bureau of the Census.,
U.S. Census of Population, 1970, Number of Inhabitants, FinalReport, PC(I )-Al, United States Summary, Washington, U.S. Government Printing Office, 1971, and U.S. Bureau of the Budget, Standard Metropolitan Statistical Areas, Washington, U.S. Government Printing Office, 1967.
SECTION 6- TECHNICAL APPENDIX
Bureau of the Census, which is made up of county a PoP1-llation of 10>OOO to 257000 and a units, is used.8 density of 1,500 persons or more per square
For tables in this report numbered 7-4 and 7-8 mile. the SMSA’S and their component counties are those 3. Each county in States other than the New established by the U.S. Office of Management and England States, New Jersey, and Pennsylvania Budget as of 1970 (except in the New England that had no incorporated municipality within States) and used by the U.S. Bureau of the Census. its boundary and had a density of 1,500
Tables numbered 1-18 and 2-8, however, are persons or more per square mile. (Arlington limited to the 50 largest SMSA’S and MSEA’S (in the County, Virginia, is the only county classified New England States) established by the Office of as urban under this rule.)
Management and Budget for 1975. These 50 largest units and their component counties for 1975 are “Balance of area” consists of all other places. different from those for 1970-74. Before 1964 places were classified as “urban” or
The lists of 50 largest units for 1971-74 and for “rural.” The Technical Appendixes for earlier years
1975 also differed from the list for 1970. Moreover, discuss the previous classification system. the county components for some of the SMSA’S and MSEA’S that appear on both lists are different for Age 1975 from the components for 1970.
As a result, sometimes the number of deaths The age recorded on the death record is the age at
shown for the same-named SMSA or MSEA in tables last birthday. With respect to the computation of
7-4 and 7-8 based on units established for 1970 will death rates, the age classification used by the U.S.
differ from the number of deaths shown in tables Bureau of the Census is also based on the age of the
1-18 and 2-8 based on units established for 1975. person in completed years.
Standard consolidated areas. –For the metropolitan complexes around New York and Chicago, Race and color several contiguous SMSA’S and additional counties
Deaths in the United States in 1975 are classifiedthat do not appear to meet the formal integration
by race for vital statistics into white, Negro, Indian,criteria for SMSA’S but do have strong interrelation-ships of other kinds have been combined into the
Chinese, Japanese, and other races. The category “white “ includes in addition to per-
New York-Northeastern New Jersey and the Chicago-sons reported as “white,” those reported as Mexican,
Northwestern Indiana Standard Consolidated Areas.g Puerto Rico, Cuban, and all other Caucasians. The
Metropolitan and nonmetropolitan counties. – category Indian includes “American,” “Alaskan,”
Counties included in SMSA’S or in New England “Canadian,” “Eskimo,” and “Aleut.” If the racial
MSEA’S are called metropolitan counties; all other entry on the death certificate indicates a mixture of
counties are classified as nonmetropolitan. Population-size groups (formerly “urban” and
Hawaiian and any other race, the entry is coded to Hawaiian. If the race is given as a mixture of white
“rural” areas). —Vital statistics data for cities and and any other race, the entry is coded to the appro-
certain other urban places in 1975 are classifiedaccording to the population enumerated in the 1970
priate other race. If a mixture of races other than
Census of Population. In this report “Population-size white is given (except Hawaiian), the entry is coded
groups” refers to two groups, “Urban places” and to the first race listed. This procedure for coding thefirst race listed has been in use for each year of the
“Balance of area. “ “Urban places” consists of the period 1969-75. Prior to 1969, if the entry for race
following places: was a mixture of Negro and any other race, except
1. Each incorporated city and other urban places Hawaiian, the entry was coded to Negro.
of 10,000 inhabitants or more. Most of the tables in this report, however, do not
2. Each town in New England and each town- show data for this extended classification by race. In
ship in New Jersey and Pennsylvania that had some tables the divisions are “white, “ “Negro,” and
no incorporated municipality as a subdivision “other.” In other tables where the main purpose k to
and had either 25,000 inhabitants or more or isolate the major group, the classifications are simply “white” and “all other. ”
Race not stated. –For 1975 the number of death8For &cu~~io~ of MSEA>~, see U.S. Bme~~ of &e (&n~II~, State
Economic Areos, Washington, U.S. Government Printing Office, 1951, records for which the race was not stated was 5,255
and the first reference cited in footnote 7. or 0.3 percent of the total deaths. Of the 5,255 ‘See footnote 7. records, 4,435 come from New York, Death records
SECTION 6- TECHNICAL APPENDIX 6-9
with race entry not stated were assigned to a racial designation as follows: If the preceding record was coded white, the code assignment is made to white; if the code is other than white, the assignment is made to Negro. For years prior to 1964 all records with race not stated were assigned to white except records of residents of New Jersey for 1962-64.
New Jersey, 1962-64. –The State of New Jersey omitted the race item from its certificates of live birth, death, and fetal death in use in the beginning of 1962. The item was restored during the latter part of 1962. However, the certificate revision without the race item was used for most of 1962 as well as 1963. Therefore figures by race or color for 1962 and 1963 exclude New Jersey. For 1964, 6.8 percent of the death records in use for residents of New Jersey did not contain the race item.
Adjustments made in vital statistics to take into account the omission of the race item in New Jersey for part of the certificates filed during 1962-64 are described in the Technical Appendix of Vital Statistics of the United States for each of those data years.
Fetal deaths
In May 1950 the World Health Organization recommended for adoption for international use the definition of fetal death as “death prior to the complete expulsion or extraction from its mother of a product of conception, irrespective of the duration of pregnancy; the death is indicated by the fact that after such separation, the fetus does not breathe or show any other evidence of life such as beating of the heart, pulsation of the umbilical cord, or definite movement of voluntary muscles. ”1 0 The term “fetal death” was defined on an all-inclusive basis to end confusion arising from usage of such terms as stillbirth, abortion, and miscarriage.
Shortly thereafter this definition of fetal death was adopted by the National Center for Health Statistics as the nationally recommended standard for registration purposes. Previously the nationally recommended definition had been “A fetus showing no evidence of life after complete birth (no action of heart, breathing, or movement of voluntary muscle), if the 20th week of gestation has been reached, should be registered as a stillbirth. ” The new definition has been adopted by about half the States. In most other States, a fetal death is defined as a birth
10National Office of Vital Statistics: International Recommenda
tions on Definitions of Live Birth and Fetal Death. PHS Pub. No. 39. Public Health Service. Washington. U.S. Goverment Printing Office, Ott, 1950.
of a minimum gestation period which is not a live birth, and live births are defined in varying detail.11
As another step toward increasing the comparability of data on fetal deaths for different countries, the World Health Organization recommended that in classifying fetal deaths for statistical purposes they be grouped as early, intermediate, and late. These groups are defined as follows:
Less than 20 completed weeks of gestation (early fetal deatis) .................................................. Group I
20 completed weeks of gestation but less than 28 (intermediate.fetaf deaths) ................................. Group II
28 completed weeks of gestation and over (late fetaf deaths) .................................................... Group III
Gestation period not classifiable in groups I, II, and III .................................................. .................. Group IV
Until 1939 the nationally recommended procedure for registration of fetal death required the filing of both a live-birth and a death certificate. In 1939 a separate Standard Certificate of Stillbirth (fetal death) was created to replace the former procedure. This was revised in 1949, 1955, 1956, and 1968 (see figure 6-B). Separate certificates of fetal death are now in use in all States.
Comparability and completeness of data;–State requirements for registration of fetal deaths vary. The majority of States require registration of fetal deaths of gestations of 20 weeks or more. Table 3-1 in Section 3 shows the minimum period of gestation required by each State for death registration. There is substantial evidence that not all fetal deaths for which registration is required are reported.1 2
Underregistration is more of a problem near the lower limit for States having a minimum gestation period requirement. Failure to register fetal deaths near the lower limit results to a large degree from underestimating the gestation period. This is illustrated by the fact that for areas requiring registration of all fetal deaths, the total number reported for 20-23 weeks is higher than the numbers reported for 24-27 and 28-31 weeks. For most of the other areas, however, the opposite is true.
In order to maximize the comparability of data by year and by State, most of the tables in Section 3
11 For definitions used by the States, see National Center for
Health Statistics, State Definitions of Live Births, Fetal Deaths, and
Gestation Periods at Which Fetal Deaths are Registered, Public Health Service, Washington, D.C., May 1966.
12Unpublished fetal mortality data contained in a thesis for
Harvard School of Public Health, Apr. 1962, by Carl L. Erhardt, SC.D., Director, Bureau of Records and Statistics, Department of Health, New York, N.Y.
6-10 SECTION 6- TECHNICAL APPEND’IX
are based on fetal deaths occurring at gestations of 20 weeks or more. These tables also include fetal deaths of not stated or unknown gestation for those States requiring registration at 20 weeks or more only. Before 1969 all fetal deaths of unknown gestation were included. Beginning with 1969 fetal deaths of not stated gestation were excluded for States requiring registration of all products of conception, unless there was evidence, such as high birth weight, that those fetuses were of 20 weeks or more gestation.
The data in table 3-3 include only fetal deaths to residents of those areas in the United States which report all periods of gestation, The areas are Arkansas, Colorado, Georgia, Hawaii, Maine, Mississippi, New York, and Virginia. However, Arkansas is excluded from this table.
Arkansas has had a form for confidential reporting of abortions beginning with data year 1971. The abortions reported on this form are not limited by legislation to those described as “induced.” It is believed, therefore, that most spontaneous abortions occurring in this State are also reported on this form rather than on fetal-death certificates. The introduction of this confidential form resulted in more complete reporting of all terminations of pregnancies.
Although fetal deaths for alI periods of gestation continue to be required for Colorado, only five fetal deaths under 20 weeks gestation were reported for 1974. This undercount is attributable to the fact that Colorado did not intend to forward any copies of fetal-death certificates for periods of gestation under 20 weeks to the National Center for Health Statistics for data years 1973-74. As a result the percentage of all fetal deaths under 20 weeks gestation decreased from 65 percent for 1972, to 2 percent for 1973, and to 1 percent for 1974. For 1975, however, Colorado did send in copies of fetal-death certificates for periods of gestation under 20 weeks. These early fetal deaths accounted for 68 percent of all fetal deaths reported for Colorado for 1975.
The large increase in the number of fetal deaths reported for Hawaii for 1974 and 1975 over the number reported for 1973 results from the fact that to obtain the total number of fetal deaths for 1974 and 1975, the cause of death section of both the short and long forms of the fetal-death certificates used by this State was examined. Hawaii adopted liberalized abortion laws in 1970. For the years 1970-73, NCHS accepted the short form as an “Abortion form” without examining the cause of death. When the short forms for 1974 and 1975 were examined, it was found that they were used to report other fetal deaths as well as abortion.
For Maine the increase in the number of fetal deaths under 20 weeks gestation from 17 for 1973 to
257 for 1974 results from NCHS erroneously classifying some induced abortions as fetal deaths. Inasmuch as most of these abortions probably occurred before 20 weeks gestation, their erroneous inclusion should not affect appreciably the data for fetal deaths of 20 weeks or more gestation. With the correction of this error the number of fetal deaths under 20 weeks gestation reported for 1975 for Maine was 58.
Some livebom infants who die shortly afterbirth, particularly those born prematurely who die before the umbilical cord is severed or while the placenta is still attached, may be erroneously reported as fetal deaths. This type of error may be more of a problem in States lacking a precise definition of fetal deaths.
Georgia. –Beginning with data year 1975 fetal deaths occurring in Georgia are reported only to the State and County level. Fetal deaths assigned to urban places in table 7-1 are those occurring outside of Georgia to residents of Georgia.
Massachusetts. —Figures for 1967 exclude approximately 100 fetal deaths recorded in Worcester County, Massachusetts, primarily to residents of the city of Worcester. Figures for 1966 and those for 1963 exclude approximately 300 fetal deaths that were recorded in Boston, to residents of Suffolk County, for the most part. Microfilm copies of these records were not received by NCHS, and as a result numbers of fetal deaths for these cities and counties and for the State are understated. The fetal-death ratio for the State is understated by about 8 percent for 1967, and by about 23 percent for 1966.
Period of gestation. –The period of gestation is the number of completed weeks elapsed between the first day of the last menstrual period and the date of delivery, irrespective of whether the product of conception was Iiveborn or born without evidence of life. The first day of the last normal menstrual period (LMP) is used as the initial date since it can be more accurately determined than the date of conception, which usually occurs 2 weeks after LMP. When the period of gestation is reported in months on the certificate, it is allocated to gestation intervals in weeks as follows:
1-3 months to under 16 weeks 4 months to 16-19 weeks 5 months to 20-23 weeks 6 months to 24-27 weeks 7 months to 28-31 weeks 8 months to 32-35 weeks 9 months to 40 weeks
10 months and over to 43 weeks and over
With the adoption of the 1968 revision of the fetal-death certificate and the increased use of the
SECTION 6- TECHNICAL APPENDIX 6-11€
first day of LMP by the reporting areas, the errors in reporting length of gestation have been minimized. The proportion of fetal deaths assigned to gestation of 36 and 40 weeks has diminished; while the proportion of gestations of 37-39 weeks and 41 weeks and gestation length not stated has increased. In 1975 the areas using LMP were as follows:
Alaska Louisiana North Carolina Arizona Maine North Dakota California Maryland Ohio Colorado Massachusetts Oklahoma District of Michigan Oregon
Columbia Minnesota Rhode Island Florida Mississippi South Carolina Georgia Missouri South Dakota Hawaii Montana Tennessee Illinois Nebraska Utah Indiana Nevada Vermont Iowa New Hampshire Washington Kansas New Jersey West Virginia Kentucky New Yo~k Wyoming
Birth weight. –In practically all registration areas birth weight is reported in terms of pounds and ounces rather than in grams. However, the metric system has been used in tabulating and presenting the statistics to facilitate comparison with other data published in the United States. The equivalent of the gram intervals in pounds and ounces are as follows:
500 grams or less = 1 lb 1 oz or less 501-1,000 grams = llb 20Z - 21b 30Z 1,001-1,500 grams = 21b 40 Z- 31b 40Z 1,501-2,000 grams = 31b 50Z - 41b 60Z 2,001-2,500 grams = 4 lb 7 oz - 5 lb 8 oz 2,501-3,000 grams = 51b 902- 61b 902 3,001-3,500 grams = 61b100z - 71blloz 3,501-4,000 grams = 71b120z - 81b130z 4,001-4,500 grams = 81b140z - 91b140z 4,501-5,000 grams = 91b150z-lllb 00z 5,001 grams or more= 11 lb 1 oz or more
Race and color. –The race of the fetus is ordinarily classified to the race of the parents. If the parents are of different races, the following rules apply: (1) When only one parent is white, the fetus is assigned the other parent’s race. (2) When neither parent is white, the fetus is assigned the father’s race with one exception: If the mother is Hawaiian or Part-Hawaiian, the fetus is classified as Hawaiian.
When the race of one parent is missing or ill-defined, the race of the other determines that of the fetus. When race of both parents is missing, the
race of the fetus is allocated to the specific race of the fetus on preceding record.
Total-birth order. –The number of a birth or a fetal death in the total birth order is the sum of the births and fetal deaths which a mother has had including the birth being recorded. For example, if a mother has previously given birth to two live babies and to one born dead, the next event to occur, whether a live birth or fetal death, is counted as number four in the total-birth order.
In the 1956 and 1968 revisions of the Standard Certificate of Fetal Death, the item on previous fetal loss included all fetal deaths regardless of gestation period. The majority of States have adopted this change on their certificates of birth and of fetal death. In these States the proportion of mothers of first liveborn children reported as having had a previous fetal loss has increased because of this change. For this reason, the data in tables 3-10 and 3-12 are not completely comparable with similar data published for years before 1956.
The following registration States requested in-formation on all previous fetal deaths (fetuses born dead at any time after conception) on certificates of live birth and fetal death in use during 1975:
Alaska Maine Ohio Arizona Maryland Oklahoma Arkansas Massachusetts Oregon Colorado Michigan Pennsylvania Connecticut Minnesota Rhode Island Delaware Mississippi South Carolina Florida Missouri South Dakota Georgia Montana Utah Hawaii Nebraska Vermont Illinois Nevada Virginia Indiana New Hampshire Washington Iowa New Jersey West Virginia Kansas New York Wyoming Kentucky North Carolina Louisiana North Dakota
The total number of fetal deaths shown in tables 3-10 and 3-12 is limited to those with stated or presumed period of gestation of 20 weeks or more. The determination, however, of the total-birth order for these fetal deaths is based on the number of previous live births and fetal deaths for all periods of gestation, except for those live births and fetal deaths occurring to residents of the District of Columbia and the following seven States: Alabama, California, Idaho, New Mexico, Tennessee, Texas, and Wisconsin. The fetal-death certificates of these States provide total-birth order information only for previous live births and fetzd deaths of 20 weeks or more gestation.
6-12 SECTION 6- TECHNICAL APPENDIX€
Thus the total-birth order for the District of Columbia and these seven States is based on fewer fetal deaths than would be the case if their fetal-death certificates had requested the number of previous fetal deaths for all periods of gestation, as do the certificates used by the other 43 States. It follows, therefore, that the totaI-birth order given in table 3-12 for these 43 States is not strictly comparable with that given for the District of Columbia and the remaining 7 States.
Legitimacy status.–Tabulations with legitimacy as a characteristic include only States which provided for reporting this item on their certificates of live birth and fetal death in 1975. These States are as follows:
Alabama Kentucky “Oregon Alaska Louisiana Pennsylvania Arizona Maine Rhode Island Colorado Michigan South Carolina Delaware Minnesota South Dakota District of Mississippi Tennessee
Columbia Missouri Texas Florida Nebraska Utah Hawaii New Hampshire Virginia Illinois New Jersey Washington Indiana North Carolina West Virginia Iowa North Dakota Wisconsin Kansas Oklahoma Wyoming
There are no quantitative data on the characteristics of unwed mo~hers who may misreport legitimacy status of the fetus or who fail to register fetal deaths. Underregist~ation may be greater in the illegitimate group than in the legitimate.
Age of mother. –The fetal-death certificate asks for the mother’s “age (at time of delivery ),” and the ages are edited in NCHS for upper and lower limits. When mothers are reported to be below 10 years of age or age 50 years and above, the age of the mother is considered not stated and is assigned as follows: Age on all fetal-death records with age of mother not stated is allocated according to the age appearing on the record previously processed for a mother of identical color and having the same tot+birth order (total of fetal deaths and live births).
Cause of death
Beginning with data year 1968 the cause-of-death statistics published by the Nationzd Center for Health Statistics have been classified in accordance with the Eighth Revision International Classification of Dis
eases, Adapted for Use in the United States (ICDA),l 3 which is based on the 1965 Revision of the International Classification of Diseases (ICD).l 4 The ICDA gives greater detail and specificity in some categories than is provided by the Eighth Revision of the ICD. Complete correspondence be-tween these two classifications was maintained at the three-digit level, but new four-digit subdivisions were created in various parts of the ICDA. Where necessary, existing four-digit subdivisions are renumbered to accommodate the additional subcategories in logical sequence. In the ICDA, subdivisions which do not correspond exactly with the ICD are identified by asterisks. In this report the four-digit subcategory numbers which differ from those in the ICD are also shown with asterisks.
In addition to specifying that the Classification be used, the World Health Organization recommended special lists for mortality tabulations—the Detailed List, consisting of all three-digit categories; List A, the List of 150 Causes for Tabulation of Morbidity and Mortality; List B, the List of 50 Causes for Tabulation of Mortality; and List P, the list of 100 Causes for Tabulation of Perinatal Morbidity and Mortality. The recommended tabulation lists have been modified for use in the National Center for Health Statistics.
The Each-Cause List is made up of each three-digit category of the Detailed List to which deaths may be assigned and each four-ditit subcate~orv of the- ICDA ~o which deaths may” be assim~d. ‘For category 412 the fourth digits .~, .2, .3, ~nd .4 are used instead of the fourth digits .0 and .9 which appear in the ICDA. The each-cause table (l-23) does not show the fourth-digit subcategories provided for Motor vehicle accidents (E8 10-E823). However, these subcategories, which identify persons injured, are shown in the accident tables (Section 4). Special fifth-digit subcategories are also used in the accident tables to identify place of accident when deaths from nontransport accidents are shown.
The Lkt of 281 Selected Causes of Death is an extension of List A designed so that with one exception the original groups can be obtained by combining titles. The individual titles in List A for
13Nationaf Center for Health Statistics: Eighth Revision International Classification of Dskeases, Adapted for Use in the United States. PHS Pub. No. 1693. Public Health Service. Washington. U.S. Gover
nmentPrinting Office, 1967. 14World Health Organization: Manual of the International Statisti
cal Classification of Diseases, Injuries, and Causes of Dea th, Based on the Recommendations of the E1ghtb Revision Conference, 1965, Geneva. World Health Organization, 1967.
SECTION 6- TECHNICAL APPENDIX 6-13€
Certain causes of mortality in early infancy are shown as one group title in tables using the List of 281 Selected Causes. The individual categories are shown in the tables using the List of 65 Selected Causes of Infant Death, which was created by extending some titles in List P and by combining others. Titles in List P not shown in this list may be found in the each-cause table with the exception of causes of death in List P that We applicable only to fetal deaths.
The List of 69 Selected Causes of Death is an extension of List B; however, certain causes of low frequency in the United States are not shown separately. These causes are Cholera, Typhoid fever, Plague, Diphtheria, Smallpox, Typhus and other nckettsioses, and Malaria.
The List of 34 Selected Causes of Death for Detailed Geographic Areas was created by combining titles in the List of 69 Selected Causes.
These lists were designed to be as comparable as possible to the NCHS lists most recently in use under the Seventh Revision. In several instances this could not be done. No attempt will be made here to enumerate these changes. However, the following changes are especially worth noting. The group title Major cardiovascular diseases (ICDA Nos. 390-448) includes all of the titles in “Section VII. Diseases of the circulatory system” of the Eighth Revision except the following one: Diseases of veins and lymphatic and other diseases of circulatory system (ICDA Nos. 450-458).
The most nearly comparable group title in the Seventh Revision is Diseases of cardiovascular system (ICD NOS. 330-334, 400-468).
Both of these group titles include the first and third leading causes of death–Diseases of heart (ICDA Nos. 390-398, 402, 404, 410-429) and Cerebrovascular diseases (ICDA Nos. 430-438). They also both include Diseases of arteries, arterioles, and capillaries (ICDA Nos. 440-448). The comparable title in the Seventh Revision for these latter diseases is Diseases of arteries (ICD Nos. 450-456). But the group title Diseases of Cardiovascular system (ICD Nos. 330-334, 400-468) in the Seventh Revision includes also the title Diseases of veins and other diseases of circulatory system (ICD Nos. 460-468). These diseases of veins and tory system (assigned by ICDA Nos. 450-458) are under the Eighth Revision vascular diseases (ICDA Nos.
Effect of decennial list
other diseases of circulathe Eighth Revision of not included, however,
group title Major cardio-390-448). revisions. –The Interna
tional Lists, in use in this country since 1900, have been revised decennially in order that the disease
classification may be consistent with advances in
medical science and changes in diagnostic practice. Each decennial revision of produced some break in death statistics. For the continuity in the mortality problem of great concern.
the International Lists has comparability of cause-of-
first five revisions, the trends is not considered a
Van Buren described some of the major shifts in the cause-of-death statistics up to the Fifth Revision (1938) due to changes in the Classification of causes of death. 15 Dunn and Shackley measured the change in mortality statistics by cause due to the Fifth Revisional 6
This was done by coding mortality records for 1940 by the 1929 and 1938 revisions, The results of the study have been useful in evaluating the effects of the Fifth Revision and changes in the joint-cause selection procedure.
Six th Revision. –The Sixth Revison of the Inter-national Lists of Diseases and Causes of Death was adopted by the World Health Organization in July 1948 and used for mortality data in the United States from 1949 through 1957. This revision represented a more sweeping change than any previous revision. The classification scheme was expanded considerably to provide specific categories for nonfatal diseases and injuries in order to provide a classification which could be used for coding morbidity as well as mortality records.
In addition to the expanded scope of the Sixth Revision of the International Classification, there was a major change in the method of selection of the cause of death for primary tabulation. A large proportion of death certificates filed annually in the United States report two or more diseases or conditions as causes of death. General statistical practice requires that cases involving more than one cause of death be assigned to a single cause, making it necessary to select the one cause to which the death will be assigned. The method of selection has an important effect upon the resulting statistics.
In 1948 the World Health Assembly adopted, along with the Sixth Revision of the International Lists, a form of medical certification and rules for classification of the underlying cause of death for international use. The form of medical certification in the Standard Certificate of Death is shown in figure 6-A. It is designed to facilitate the selection of the
15U.S. Bureau of the Census: Some tfings you can’t prove by mortality statistics, by G. H. Van Buren. Vital Statistics–Special Reports, Vol. 12, No. 13. Washington, D.C., Jan. 1940.
1@_J.s. Bureau of the Census: Comparison of cause-of-death assignments by the 1929 and 1938 Revisions of the International Lists, deaths in the United States, 1940, by H. L. Dunn and W. ShackIey. Vital Statistics–Special Reports, Vol. 19, No. 14. Washkgton, D.C.,
June1944,
6-14 SECTION 6- TECHNICAL APPENDIX
underlying cause of death when two or more causes are recorded. In general if the certification is completed properly, the underlying cause of death entered by the physician is the cause to be tabulated. This procedure, used in the United States beginning with deaths in 1949, differs markedly from that used in previous years. Formerly, definite priority relation-ships were set up for combinations of causes reported on the death certificate. The single cause to be tabulated was chosen according to these fixed rules.
Comparability between the Sixth and Fifth Revisions. –In order to maintain a time series of mortality rates for comparable causes, the International Conference for the Sixth Revision of the International Lists recommended that deaths for a country as a whole in the year 1949 and 1950 be coded according to both the Sixth and Fifth Revisions. In the United States, 1950 mortality data were used for the dual coding. The differences resulting from the use of the two revisions are expressed by a factor termed the comparability ratio. This is the number of deaths assigned to a piirticular cause under the Sixth Revision divided by the number of deaths assigned to that cause using the Fifth Revisional 7Y18
Seventh Revision. –Beginning with 1955 the decennial conferences for revision of the International Lists are held in years ending in 5 rather than later in the decade as had been done previously. This is to make possible the use of revised classification for mortality data beginning with years ending in 8. The new cycle provides time to assess die effect of new provisions and variations in interpretation before the next census. Thus stable mortality data will be available for use in the population figures from the decennial census.
Changes in the Seventh Revision were held to a minimum because of the relatively short experience with the Sixth Revision. In compliance with a recommendation of the Expert Committee on Health Statistics, the changes were limited to essential ones and amendments of errors and inconsistencies. Provisions previously contained in an addenduml 9 were
17National Center for Health Statistics: Comparability of mortality Statistics for the Fifth and Sixth Revisions, United States, 1950, by M. M. Faust and A. B. Dolman. Vital StatsWcs-Special Reports, Vol. 51, No. 2. Public Health Service. Washington, D.C., Dec. 1963.
18National Center for Health Statistics: ComparabWIty ratios
based on mortslity statistics for the Fifth and Sixth Revisions, United States, 1959, by M. M. Faust and A. B. Dolman. Vital Statistics– Special Reports, Vol. 51, No. 3. Public Health Service. Washington, D.C., Feb. 1964.
19 World Health Organization: Manual of the International Statisti
cal Classification of Diseases, Injuries, and Causes of Dea th, Addendum 1, Supplementary Inteqtwetations and Instructions for Coding Causes of Death. Geneva. World Health Organization, 1953.
integrated into the manual.z 0 Since these provisions had been used with the Sixth Revision, they did not represent classification changes. The only change made in three-digit categories consisted of rewording a few titles. In a few cases the rewording included redefining morbid conditions classifiable to these categories and transferring certain terms from one category to another. The three-digit categories which were affected are listed in Section 1, Volume I, of Vital Statistics of the United States, 1958. There were also a number of changes in four-digit sub-categories, consisting mostly of the addition of subdivisions to provide more detailed classification of malignant neoplasms of specified sites. The three-digit categories for which there were additions, deletions, or changes in the four-digit subcategories are also listed in Section 1 of the 1958 report.
The international rules for selecting the cause of death for primary mortality classification were recast for use with the Seventh Revision to simplify them and to organize them from the viewpoint of the coder making the cause-of-death assignment. The intent of the rules remains the same, that is, to code the cause which the medical certifier judged to be the underlying cause starting the train of events leading directly to death. In recasting the rules, some interpretations were modified—mainly those involving selection of the underlying cause for improperly completed certifications. In adapting coding procedures to reporting practices in the United States, some additional changes in interpretations were made.
In the majority of cases, application of the rules for the Sixth Revision and those for the Seventh resulted in the same code assignment. There were some differences in individual assignments affecting a number of categories. Many of these individual assignments were compensatory and resulted in no detectable discontinuity of trends for various causes of death; the comparability of a number of categories was affected to a limited extent.
Comparability between the Seventh and Sixth Revisions. –In order to estimate the magnitude of the effect of the Seventh Revision upon the comparability of mortality trends for various causes, a 10-per-cent sample of deaths in 1958 was classified using both the Sixth and Seventh Revisions. The comparability ratios for selected causes and a discussion of the results of this study are published in “Comparability
20World Health Organization:Manual of the International Statisti
cal Classification of Diseases, Injuries, and Causes of Death, Based on the Recommendations of the Seventh Revision Conference, 1955. Geneva. World Health Organization, 1957.
SECTION 6- TECHNICAL APPENDIX 6-15
of Mortality Statistics for the Sixth and Seventh Revisions, United States, 1958.”21
Eighth Revision. –The Eighth Revision contains major modifications in several sections of the lists. Also, the international rules for selecting the underlying cause have been simplified. In addition, changes have been introduced in the special rules and decisions which adapt the coding procedures to reporting practices in the United States.
The Detailed List of the Eighth Revision consists of 671 categories of diseases and morbid conditions, 182 categories for classification of the external cause of injury, and 187 categories for characterization of injuries according to the nature of the lesion. These detailed categories are designated by three-digit numbers. There are also four-digit subcategories in the ICDA that provide further specificity or more information regarding etiology or manifestations of the disease. The classification is arranged in 17 main sections, or chapters. The important changes are summarized for each of these sections in the introduction to the ICDA, pages xxiv-xxviii. Following are some of the many changes made:
Infective and parasitic diseases. –In the Seventh Revision, list titles for diarrheal conditions were scattered over several sections of the Classification. In the Eighth Revision all the Seventh Revision subdivisions for these conditions, including those for infants, are brought together under one category, Diarrheal diseases (009).
Diseases of the nervous system and sense organs. —VascuIar lesions affecting central nervous system (330-3 34) in the Seventh Revision has been transferred in the Eighth Revision to Section VII, Diseases of the circulatory system, where they appear as Cerebrovascular diseases (430-438).
Certain causes of perinatal morbidity and mortality. —This section represents an integration of Section XV (Certain diseases of early infancy) and Classification of causes of stillbirth (Y30-Y39) in the Seventh Revision. The age qualifications used in previous revisions to classify the same conditions in or outside this section have been deleted. For example, Pneumonia of new-born (763) of the Seventh Revision is no longer in
21 Nati~nal Center for Health Statistics: Comparability of mortal
ity statistics for the Sixth and Seventh Revisions, United States, 1958, by M. M. Faust and A. B. DoIman. Vital Statistics–Special Reports,
Vol. 51, No. 4. Public Health Service. Washington, D.C., Mar. 1965.
this section. Instead, it is included in the Eighth Revision with Pneumonia (480-486), to which pneumonias are assi~ed without regard to age.
Accidents, poisonings, and violence. –A new sub-section (E980-E989) has been introduced for the classification of deaths where it was not possible for the certifier to determine whether the injuries were accidentally or purposely inflicted.
Comparability between the Eighth and Seventh Revisions. –In order to measure the degree of discontinuity in cause-of-death statistics resulting from the introduction ‘of the Eighth Revision, provisional estimates of selected comparability ratios based on dual coding of a stratified sample of 1966 death certificates by the Seventh and Eighth Revisions of the International Classification of Diseases were computed. These ratios appear in the Monthly Vital Statistics Report of the National Center for Health Statistics, Volume 17, Number 8, Supplement; and in Comparability of Mortality Statistics for the- Seventh and Eighth Revisions of the International Classification of Diseases, United States, Vital and Health Statistics, Series 2, No. 66, DHEW Pub. No. (HRA) 76-1340.
Coding in 1975.–The National Center for Health Statistics usually prepares for its cause-of-death coding clerks an instruction manual which contains decisions and interpretations that apply each year. These manuals are revised annually chiefly to bring coding procedures into alignment with new developments in reporting practices and in medical opinions as to the etiology and casual relationship of diseases and to eliminate inconsistencies in coding proce-dures.22 No significant coding changes occurred for 1975.
Significant coding changes during the Eighth Revision. –Beginning with 1969 a special four-digit subcategory Chronic obstructive lung disease (*519.3) has been added to obtain the number of certificates on which medical certifiers have entered this more general term rather than a more specific diagnosis of chronic bronchitis, emphysema, or asthma. The number of certificates assigned to (*519.3) increased from 2,704 for 1969 to 17,593 for 1975. It is necessary to add together the number of deaths assigned to this new four-digit category and
22National Center for Health Statistics: Vltd statistics, instruc
tions for classifying the underlying cause of death, 1975. NCHS Instruction Manua~ Part 2a. Health Resources Administration. Rockville, Md., Sept. 1974.
6-16 SECTION 6- TECHNICAL APPENDIX€
the number of deaths assigned to Bronchitis, emphysema, and asthma (ICDA Nos. 490-493) to obtain a measure of mortality from all chronic obstructive lung diseases.
To provide that deaths would not be assigned to Chronic obstructive lung disease (*5 19.3) if a more specific diagnosis such as chronic bronchitis, emphysema, or asthma also appeared on the death certificate, the coding procedures were updated for 1971 and 1972 data years in accordance with the linkages below:
*51 9.3 Chronicobstructive lung disease without
mention of asthma, bronchitis, or em
physema
Excludes ~on&tionS in *5 19.3 with ~ondi
tions in: 490 Bronchitis (49 1) (Chronic bronchitis)
491 (Chronic bronchitis) (491 )
492 (Emphysema) (492)
493 (Asthma) (493)
But the limitation imposed by these linkage provisions did not alter the upward trend in the number of deaths assigned to Chronic obstructive lung disease without mention of asthma, bronchitis, or emphysema (*519.3). The number of deaths assigned to (*519.3) increased from 6,321 for 1971 to 8,210 for 1972.
Under the Eighth Revision of the ICDA, deaths assigned to “chronic obstructive lung disease,” or “chronic obstructive pulmonary disease,” were assigned to Other diseases of lung (ICDA No. 519.2). Despite the transfer to these deaths from this category to the new category Chronic obstructive lung disease (*No. 519.3), the number of deaths assigned to Other diseases of lung (ICDA No. 519.2) also continued to increase–from 1,306 deaths for 1969 to 2,007 for 1975.
Also beginning with 1971, a special four-digit subcategory (* E854.8) has been added to identify “acute narcotism, not otherwise specified,” whether or not the circumstances were undetermined. Also, a preference will be given to Drug dependence (ICDA No. 304) when a statement of drug dependence or a synonymous term appears on the certificate with mention of poisoning by certain addictive drugs.
In addition, beginning with 1971, the term cerebral sclerosis (generaI) is classified to Generalized ischemic cerebrovascuku- disease (ICDA No. 437) rather than to Other dem yelinating diseases of central nervous system (ICDA No. 341). As a result of this transfer the number of deaths assi~ed to this latter category decreased from 569 for 1970 to 96 for 1971.
For 1973 the significant coding changes were concerned with the “sudden infant death syndrome” (SIDS).
SIDS, frequently called “crib death” or “cot death,” has been defined as the sudden and unexpected death of a previously healthy infant (usually between 1 and 6 months of age) which remains unexpkiined after careful post mortem studies. SIDS almost always occurs during sleep periods. This phenomenon seldom occurs in an infant under month or over 1 year of age. There are no specific symptoms identifiable with SIDS. Therefore, SIDS cannot be predicted, even by a physician, and in the light of present knowledge SIDS cannot be prevented. An autopsy usually reveals congestion and edema of the lungs and minor inflammatory changes in the respiratory system. In about 85 percent of the cases intrathoracic petechial hemorrhages are found. How-ever, evidence of a conventionally accepted lethal lesion(s) is lacking. Because of these characteristic features, experts and researchers in the field consider SIDS a clearly identifiable distinctive entity even ‘though the cause and mechanism of death remain unknown.
Estimates of the number of SIDS deaths vary, but the figure most commonly quoted by researchers for 1975 is about 7,500. Efforts to obtain accurate data on the incidence of SIDS have been hampered by a number of factors. Among these are
1. The failure of a number of physicians, coroners, and medical examiners to diagnose and/or report SIDS as the cause of death.
2. The lack of uniformity in the terminology used to describe SIDS.
3. The absence of a category in the Eighth Revision International Classification of Diseases, Adapted€ for Use in the United States (lCDA), which identifies SIDS.
4. The reluctance on the part of certifiers to report conditions that they feel may be regarded as unacceptable by vital statistics offices, and
5. The reporting of conditions, including incidental autopsy findings, that were in fact unrelated to death on the certificates of death for infants who actually died from SIDS.
NCHS has modified the ICDA and the procedures for classifying information recorded on the death certificate to facilitate the identification and analysis of data related to known and suspected cases of SIDS.
Three fourth-digit subdivisions have been created under ICDA category 795 (Sudden death). These
1
SECTION 6- TECHNICAL APPENDIX€
subdivisions together with the inclusion terms are as follows:
. .*795-O Sudden infant death syndrome, under 1 year of age
Acute fatal infant syndrome Cause unknown Cot or crib death€Died without sign of disease, so stated€Found dead (in bed, cot, cradle, crib,€
etc. ) (infant) Infant found in bed Other unknown and unspecified causes,
so stated SDII, SID, SIDS, SUDI, SUID Sudden death (in infancy) (infant) syn
drome) (unattended) (unexpected) (unexplained)
Undetermined (cause) (in infancy) (infant)
Unexpected death (in infancy) (infant) Unexplained death (in infancy) (infant) Unknown (cause)
*795.1 Sudden death syndrome, 1 year of age The same terms under *795.O when age
is 1 year *795.2 All other sudden deaths, age 2 years
and over
Died suddenly Fell dead Dropped dead Sudden death
It should be noted that two of the above sub-divisions (i.e., *795. O and *795.1) include severalterms that were previously included under ICDA categories 796.2, Found dead (cause unknown), 796.3, Died without sign of disease, and 796.9, Other unknown and specified causes. The decision to include these terms in the categories that have been created for Sudden infant death syndrome, under 1 year of age, and Sudden death syndrome, 1 year of age, was made after consultation with experts in the field. This decision was based on conclusions drawn from a recent study that relatively few infant deaths that were not sudden and unexpected are certified as found dead, “died without sign of disease,” or other unknown and unspecified causes.
The third subdivision (i.e., *795.2) does not include terms previously classifiable to ICDA categories 796.2, 796.3, or 796.9. Coders should continue to classify these terms to categories 796.2, 796.3, and 796.9 if the decedent was 2 years of age or over.
A distinction has been made between Sudden infant death syndrome, under 1 yem of age, and Sudden death syndrome, 1 year of age (but less than
2),,- because there is some difference of opinion about whether SIDS does in fact occur at age~ 1 year and above. National data for 1973. the first vear NCHS used the new coding rules show 3,264 and 75 deaths coded to categories *795.O and *795.1, respectively.
Apparently, some vital statistics offices have, perhaps unintentionally, created the impression that SIDS is not an acceptable cause of death. This is unfortunate since it is important that SIDS be cited officially as the cause of death when the certifier
believes this to be the case. This diagnosis as well as other terms that are being used to describe SIDS should be accepted as a valid cause of death without querying the certifier. Past experience has shown that some certifiers are reluctant to use terminology that they have reason to believe will be queried by vital statistics offices.
Since 1968 the use of an automated system for obtaining the underlying cause requires special coding procedures in NCHS. (See Quality Control Procedures under Quality of Data.) The automated system was designed to assign the underlying cause according to the international rules just as if a manual process were to be used.
Medical certi~ication.–The use of a standard classification list, although essential for State, regional, and international comparison, does not assure strict comparability of the tabulated fi~res. A high degree of comparability between areas could be attained only if all records of cause of death were reported with equal accuracy and completeness. The medical certification of death can be made only by a qualified person, usually a physician, a medical examiner, or a coroner. Therefore the reliability and accuracy of cause-of-death statistics are, to a large extent, governed by the ability of the medical attendant to make the proper diagnosis and by the care with which he completes the death certificate.
The quality of the basic data reported on the death certificate is of fundamental importance in the interpretation of cause-of-death statistics. A pilot study was based on a sample of deaths occurring in Pennsylvania during 3 months in 1956. A representative sample of certificates was selected for particular causes of death. Questionnaires were sent to the physicians who had signed the certificates asking for the diagnostic methods and pertinent findings on which the medical certification of death was based. The returns were reviewed along with the original cause-of-death statement and rated for quality (type and amount) of supporting diagnostic information. For 39 percent of the cases the diagnostic data given were sketchy, and for 58 percent the information was considered good or very good. The quality of the
SECTION 6- TECHNICAL APPENDIX
dia~ostic information varied considerably with the not ranked. In addition, category titles that begin cause of death. It was concluded that in Pennsylvania with the words “Other” or “All other” are not the diagnostic data for many disease categories ranked. The remaining titles are ranked to determine provided an adequate base for medical certification of the leading causes of death. When one of the titles the cause of death.z 3 that represents a subtotal is ranked, as in the case of
In a later followback study conducted by NCHS, Tuberculosis, all forms, its component parts (in this
a national sample of deaths occurring in July and case, Tuberculosis of respiratory system and Tuber-
August 1960 was selected from the 10-percent culosis, other forms) are not ranked.€
Current Mortality Sample. A questionnaire was sent€to the physician, coroner, or medical examiner Maternal deaths€signing the death certificate and to the hospitals and€others suggested by the medical examiner as possible Maternal deaths are those for which the certifying€
added sources of diagnostic information. Eighty-seven physician has designated a maternal condition as the€
percent of the medical certifiers returned a question- underlying cause of death. The maternal conditions€
naire with some kind of response. Of those returned, are those assigned to Complications of pregnancy,€
14 percent contained no useful information. The childbirth, and puerperium (630-678).€
forms were reviewed by two cardiologists to deter-€mine whether or not the cause of death &signed was Report of autopsy€
supported by the dia~ostic information provided by Prior to 1972 the last year for which autopsy data€the certifier. The results showed that “for were tabulated was 1958. For 1972-75 all registration€cardiovascular-renal diseases as a whole, it is esti- areas requested information on the death certificate€mated that 70 to 75 percent of the deaths so as to whether autopsies were performed. For 1975€classified may be considered as a reasonable inference autopsies were reported, however, on only 333,068€or better.24 death certificates (17.6 percent of the total, table
One index of the quality of reporting causes of 1-28). All but eight registration areas (New York death is the proportion of death certificates coded to City, Delaware, Georgia, Idaho, Massachusetts, Pennthe Eighth Revision category numbers 780-792, 795, sylvania, Texas, and Virginia) also requested for 1975€and 796, which are the rubrics for symptoms and information on nearly all their certificates as to€ill-defined conditions. While there are cases for which whether the autopsy findings were used in determin€it is not possible to determine the causes of death, ing the causes of deaths.€this proportion indicates the care and consideration The distribution of deaths for which autopsies€given to the certification by attending physicians. It were performed according to the entry for the item€may also be used as a rough measure of the specificity “autopsy findings used” was as shown in the table€of the medical diagnosis made by the physicians in below.€various areas and to a small deqee the extent to€which autopsies are performed and their findings used€in determining the underlying cause of death entered Entry for item “autopsy findings used” I Number I Percent€
on the death certificate. In 1975, 1.6 percent of all All autopsies ... .... . ... .. . ... . ... . 333,068 100,0
reported deaths in the United States were assigned to ill-defined or unknown causes. However, this percent- Autopsy findings used . ... ... . ... .. .. ... .. ... . ... ... .. .. ... .. 188,647 56.6
age varied among the States from 0.3 to 7.4 percent. Autopsy findings not used ... .. .. .. .. .. ..... .. .. . ... ... .. .. 14,160 4.2
Ranking causes of deat/z.-The causes included in Item not checked .. .. ... .. . ... .... .. .. .. .. ... .. .. ... .. ... . .. ... 55,934 16.7 [tern not on certificate ... .. .. .. ... .. ... .. ... .. .. .. .. ... ... .. IT 74,237 22.3
the List of 69 Selected Causes of Death have been
ranked on the basis of the number of deaths assigned to each cause. Two group titles, Major cardiovascular
Data presented in table 1-29 on “findings used”
diseases and Symptoms and ill-defined conditions, are�refer not to deaths for which autopsies were per-formed (333,068) but only to those for which information on “findings used” was ako requested cm
Zsl?or a more complete report, see “Inquiry Into Diagnostic the certificates (258,741 deaths for which autopsies Evidence Supporting Medical Certifications of Death;’ by I. M. were performed). Moriyama and others, Am, J. Pub. Health, Vol. 48, No. 10, pp. For only seven of the cause-of-death categories 1376-1387.
24’Moriyasna, L M., and others: Evaluations of Diagnostic hfORW-shown in table 1-29 were autopsies reported as’
tion Supporting MedicaJ Certification of Cardiovascular Dkease Deaths. performed for 50 percent or more of all deaths:
Paper presented at a meeting of the American Public Health Associa- Meningococcal infections; Measles; Abortions; Other tion, Kansas City, Me., Nov. 13, 1963. complications of pregnancy, childbirth, and the puer-
SECTION 6- TECHNICAL APPENDIX 6-19
perium; Congenital anomalies; Homicide; and Other external causes.
There were eight other categories for which 40 percent or more death certificates reported autopsies. Autopsies were reported for only 10.7 percent of the major cardiovascular diseases. Among all causes other than the major cardiovascub.r group, autopsies were reported for 24.9 percent of all deaths.
Mortalky by month and date of death
Deaths by month have been regularly tabulated and published in the annual report for each year beginning with data year 1900. For 1975 deaths by month are shown in this report in tables 1-20, 1-21, 1-24, 1-30, 2-10, 2-12, and 3-9.
Death rates by month reflect most clearly the influence of the respiratory diseases. Again for 1975, as for each year since the early 1920’s, when the summer peak of mortality was eliminated, the curve of mortality falls to a low during the summer months, and reaches a peak during the winter months. The curve by month for the number of deaths from influenza and pneumonia for 1975 parallels quite closely that for the curve for the number of deaths from aII causes. The greatest number of deaths from influenza and pneumonia occurred in January for 1975 (table 1-24).
The year 1972 was the first data year for which date of death was published (table 1-30). Unpublished data for selected causes by date of death for 1962 are available in NCHS.
Number of deaths by date of death in this report are shown for 1975 for the total number of deaths and for the number of deaths for the following three causes, for which the greatest general interest in date of occurrence of death has been expressed: Motor vehicle accidents, Suicide, and Homicide.
These data in table 1-30 show the frequency distribution of deaths for the selected causes by day of week. They also make it possible to identify holidays with peak numbers of deaths from specified causes.
QUALITY OF DATA
Completeness of registration
Although every State has adopted a law requiring the registration of births, deaths, and fetal deaths, these laws are not uniformly observed. In most areas practically all births and deaths are registered. For some areas, however, there is enough underregistration to affect the use of the statistics for certain purposes.
Quantitative information on completeness of death registration is not available. One condition for “ admission to the national registration areas was a demonstrated registration completeness of at least 90 percent although the method used in testing completeness was subject to considerable error. It is believed that in the past death registration for the United States has been more complete than birth registration, but the difference now may be rather small. There is evidence, however, that in certain isolated areas, incomplete registration is still a problem. For example, a study made in a few selected counties of Tennessee, where the death rates for 1949 to 1951 were unusually 10W, served to locate a number of unregistered deaths.zs A similar situation may exist in other States.
As stated above, reporting requirements for fetal deaths vary from State to State, and registration is probably incomplete in all areas.
Massachusetts data
The 1964 statistics for deaths exclude approximately 6,000 events registered in Massachusetts, primarily to residents of the State. Microfilm copies of these records were not received by NCHS. l?kures for the United States and the New England Div&ion are also somewhat affected.
Quality controI procedures
Demographic items on the death certificates. –As indicated ~bove, for 1975 the mortality data for these items were obtained from two sources: (1) microfilm images of the original certificates furnished by 27 States, the District of Columbia, and New York City; and (2) records on data tape furnished by the remaining 23 States. For the 27 States, the District of Columbia, and New York City, that send only microfilm images of the original certificates, the demographic items on a 10-percent sample of the certificates were dependently verified. For the 16 States that furnished records on data tape prior to 1975 the demographic items on about 200 records per State per month were independently verified. For the seven States (Maryland, North Carolina, Oklahoma, Louisiana, Tennessee, Virginia, and Wisconsin) that furnished records on data tape for the first time for 1975, the demo,qaphic items were independently verified for a 50-percent sample for the first 3 months, and for about 200 records per State for each of the last 9 months of 1975.
25 Tennessee Department of Public Health: Results of survey of death-registration completeness. The Spotlight, Jan. 1954.
6-20 SECTION 6- TECHNICAL APPENDIX€
Except for cause-of-death coding discussed below, the above-mentioned verification procedures involve controlling two types of error (coding and entering into the data record tape) at the same time, and the error rates are a combined measure of both types. While it may be assumed that the entering errors are randomly distributed across all items on the record, this assumption cannot be made as readily for coding errors. Systematic errors in coding infrequent events may escape detection during sample verification. This type of error is partially controlled by reverifying randomly selected lots from each operator’s work.
Medical items on the death certificate. –The “Automated Classification of Medical Entities” (ACME), a computer system for assigning the under-lying cause of death which was introduced in 1968, was used for assigning the 1975 underlying causes of death.26 The ACME rules for coding conditions are very specific, fewer in number, and far less complicated than the international rules for selecting the underlying cause of death.27
The coder produces condition codes which the ACME computer program matches against decision tables to select the underlying cause of death for each record according to the international rules. These decision tables serve two primary purposes. They provide a comprehensive guide for the relationship between conditions classifiable to different categories in ICDA when applying rules of selection and modification, and they also provide decisions used when the underlying cause is assigned by the ACME system. The tables were developed from the decisions and conclusions employed by NCHS in arriving at the underlying causes of death. Relationships between medical conditions involve varying or contradictory opinions. Therefore further refinements of the decision tables will be required periodically.
The decision table instruction manual for 1970-7128 was again used for 1972, 1973, 1974, and 1975.
For the States that did not furnish State-coded medical data, the medical items were coded for 100 percent of death records. Then the medical items on a 10-percent sample of the records were independently verified. For the five States (Louisiana, Nebraska,
26 Automated classification of Medic~ Entities (ACME) for
Selection ‘of Causes of Death. Unpublished paper presented at the
armuaf meeting of the American Public Health Association, Houston, Tex., Oct. 1970.
27see footnote 22.
28National Center for Health Statistics: Vital statistics, ICDA
Eighth Revision decision tables for classifying underlying causes of death, 1970-1971. NCHS Instruction Manua~ Part 2a. Public Health Service. Rockville, Md., 1972.
North Carolina, Virginia, and Wisconsin) that furnished State-coded medical data, for the first time in 1975, the medical items were independently verified on a 100-percent basis for the first 3 months, and for about 200 records per State for each of the last 9 months of 1975. For the other States (Iowa and Michigan) the medical items were independently verified for about 200 records per State.
For cause-of-death coding systematic errors in coding infrequent events is controlled by listing the rare and impossible codes from the computer and reverifying the cause-of-death assignment.
Demographic items on fetal death certificates. – As stated above, fetal-death certificates for 1975 are based on all fetal-death records received. Moreover the coding and entering on data tape of fetal-death records was verified completely because of their relatively small number. (Again for 1975, as for prior years, medical items on the fetal-death certificates were not coded.)
Other control procedures. –After completing coding and entering on data tape, record counts are balanced against control totals for each shipment of records from a registration area. Impossible codes are selected out during the editing processes on the computer and are either corrected by reference to the source record or adjusted by arbitrary code assignment. All subsequent operations in tabulating and in table preparation are verified either during the computer processing or by statistical clerks.
Estimates of errors arising from 50-percent sample for 1972
Death statistics for 1972 in this report (excluding fetal-death statistics) are based on a 50-percent sample of all deaths occurring in the 50 States and the District of Columbia.
A description of the sample design and a table of the percent errors of the estimated numbers of deaths by size of estimate and total deaths in the area are shown in the Technical Appendix of Vital Statist/es of the United States, Volume II, Part A, 1972.
COMPUTATION OF RATES AND OTHER MEASURES
Population bases
The death rates shown in this report were computed on the basis of population statistics published or made available by the U.S. Bureau of the Census. Rates for 1940, 1950, 1960, and 1970 are based on the populations enumerated as of April 1 in the censuses of those years. Rates for alI other years
---------------------------------------------------
SECTION 6- TECHNICAL APPENDIX 6-21.
are based on the estimated midyear (July 1) population for the respective years.
Population estimates for 1975. –Estimates of the total resident population of the United States by age, race, and sex in 1975 are published by the Bureau of the Census in Current Population Reports, Series P-25, Number 643, and are shown in table 6-2. Total estimated populations for States shown in table 6-3 are published in Series P-25, Number 619; populations by broad age groups were prepared by the Bureau of the Census for NCHS and do not appear in the P-25 Series.
The populations of the 50 largest SMSA’S and their component counties were obtained from the Bureau of the Census for July 1, 1975, as shown in selected reports from Series P-26.
Population estimates for 1971.–The rates by age, color, and sex in Section 1 of Vital Statistics of the United States, 1971, were based on provisional estimates of the 1971 population; but the life table values for 1971 in Section 5 were based on revised estimates of the 1971 population. These revised estimates are shown in Current Population Reports, Series P-25, No. 519, Washington, D. C., 1974. These revised estimates differed considerably from the provisiomd estimates for a number of age-color-sex groups. Table 6-4 of the report for 1971 shows, for example, that the revised estimates are 7 to 25 percent lower than the provisional estimates for persons other than white in the youngest (under 10 years) and oldest (80 years and over) age groups. The limited number of statistics for 1971 shown in this report are based on the revised populations. AIso available in NCHS is a set of unpublished trend tables for which the rates for 1971 are based on the revised population. These tables include age-color-sex-cause specific death rates for both the List of 69 Selected Causes of Death and the List of 281 Selected Causes of Death.
Population estimates for 1961-69. –Comparison of revised populations for 1969 (and several earlier years since 1960) with the provisional populations which were used to calculate annual death rates for these same age, color, and sex groups indicated a similar problem. Caution should be exercised in utilizing death rates published in Section 1 and life expectancy values in Section 5 of the 1969 and other volumes until the publication of the annual volume
for 1976 that will contain rates based on revised populations for each year of the period 1961-69, as shown in Current Population Reports, Series P-25, No. 519.
Rates and ratios based on live births. –Infant, neonatal, and maternal mortality rates, and fetal death rates and ratios are computed on the basis of the estimated number of live births instead of the estimated population under 1 year of age.
New Jersey.–As indicated previously, data by race or color are not available for New Jersey for 1962 and 1963. Therefore for 1962 and 1963 the National Center for Health Statistics estimated a population by age, color, and sex excluding New Jersey for rates shown by color. The methodology used to estimate the revised population excluding New Jersey is discussed in the technical appendixes of the 1962 and 1963 reports.
Age-adjusted death rates
Age-adjusted death rates shown in this report are computed by using the distribution in 10-year age intervals of the enumerated population of the United States in 1940 as the standard population. Each figure represents the rate that would have existed if the age-specific rates of the particular year prevailed in a population whose age distribution was like that of the United States in 1940. The rates for the total population and for each color-sex group were adjusted separately, using the same standard population. It is important not to compare age-adjusted death rates directly with crude rates shown in other tables.
SYMBOLS USED IN TABLES
Data not available ............................................- . . .
Category not applicable .................................... . . .
Quantity zero
Quantity more than Obut less than 0.05 .......... 0.0
Figure does not meet standards of reliability or * precision ......................................................
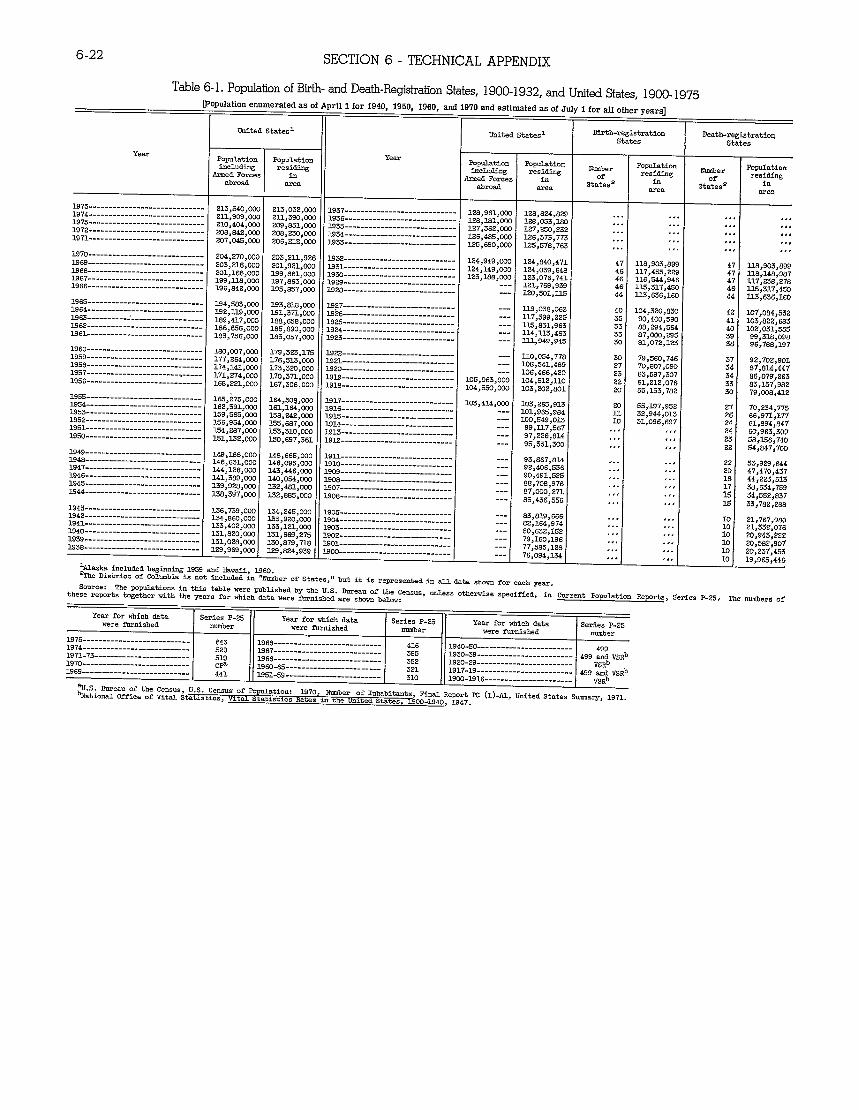
------------------
----------------------------
----------------------------
----------------------------
---------------------------
---
------------------------------------------
6-22 SECTION 6- TECHNICAL APPENDIX
Table 6-1. Popdation of Birth-and Death-RegktraiionStates, 1900-1932, and UnifedStates, 1900-1975
Year
1975-----------------------------B74-----------------------------1973-----------------------------1972-----------------------------1971-----------------------------
1970-----------------------------1969-----------------------------1968-----------------------------=67-----------------------------1966-----------------------------
1965-----------------------------1964-----------------------------1963----------J 1962-----------------------------EEL-----------------------------
MOO-----------------------------1959-----------------------------1958-----------------------------1957-----------------_-----a-----1956-----------------------------
1935-----------------------------1954-----------------------------1933-----------------------------1952-----------------------------1951-----------------------------Ego-----------------------------
B49-----------------------------1948-----------------------------1947----------------------------
@ation emmeratedas of
United state+
Population wagincluding
AzmeclForces in abrmi area
213,540,0% 21.3,032,000 2Ll,909,00C 2LL,590,000 21O,4O4,OI2C 209,851,000 208,842,OW 208,230,000 207,045>000 206,212,000
204,270,co0 203,211,926 203>216,000 201,921,W0 201,166,000 3.99,661,000 199,M.S,000 197>863,0s0 196,242,000 195,857,000
194,5t33,wo 123,818,000 2.82,3.19,0c0 3.21,371,000 189,417,CO0 188,638,000 186,656,000 185>890>030 183,756,000 163,057,000
180,007,00c 179,323,175 177,264,00c 176,5L3,000 174,141,00C 173,320,000 171,274,000 170>371,000 168,221,LhJ0 167,306,000
165>;75,000 164,308,030 162,391>IxM3 161,164,W0 L39,5S3,000 L58,242,0c0 3..56,954,OCO 155,687,000 154,287,000 2.33,31O,L7CO 2.31,2.32,LW0 130,697,361
149,M8,000 14I3,665,000 146,631>000 146,093,000 144>126,000 143,446,000
1946----------------------------- 141,389,000 140,054,000 1945----------------------------- 139,928,000 132,481,000 1944----------------------------- 3.58,3$7,000 132,3s35,000
riL1for 1940, 1950, 1960, and 19706nd eiMmatedasof July i forwofieryears]
Unite& 8tates1 Birth-registration Death-registration
States 8tates
POpul..ti.n Population Nwnbw p-at ion Number
Population includin~ residing
of residins
of residing
Irmed Forces in abroad area
States2 in
States= & area
128,961,000 128,824,829 ... ,.. ,,, ... 126,3.81,000 128,033,1s0 ... ,.. .,, ,,, 127,362,000 127,230,232 ... ... .,. ‘.,
126,485,000 125,690,000
126,373,773 125,578,763
...#..
,,, ,..
,.. ,,,
,,,
. . .
124,949,s00 124,840,471 47 118,903,899 47 US,903,899 124,149,000 124,039,648 46 117>455,229 47 11s,148,687 123,3&3,0~ 3.23,076,741 46 LL6,344,946 47 117,238,276
___ 121,769,939 46 113,317,450 4s 11s,317,430 12’0,30L,IL3 44 1L3,636,160 44 li3,6W,160
112,038,062 lo4,320,a30 42 107,064,532 117,399,225 z 90,400,590 41 103,622,E83 113,831,963 35 88,294,564 40 102,031,335 L14,3.13,463 33 07,000,295 39 99,31s,09s 113.,949,945 30 8Z,072,123 38 96,788,197
110,054,778 30 79,560,748 92,702,901 10S>541,4W 27 70,807,090 ;; 8$,614,447 106,466,420 23 63,597,3o7 34 86,079,263
105,063,000 104,312,110 22 61,212,076 33 83,157,982 104,550,000 103,2OZ,8O1 20 55,L33,782 30 79,00s,412
103,414,000 103,225,913 20 35,197,952 27 70,234,775 101,923,984 32>944,013 26 66,971,177 ___
1100,549,013 % 31,096,697 24 sl,FJ94,t347 99,117,367 ... ,.. 2.2 60,963,309 97,226,614 ... .,, 23 68,136,740 93,331,300 ... ,,, 22 64,847,7oiJ
93,867,S14 ,.. .,, 22 S3,929,644 92>406,336 ... ,.. 20 47,470,437 90,491,525 ... ,.. 18 44,223,513 88,708,976 ... ,,, 17 38,634,759 67,000>271 .,. J,. M 34,53t,e37 85,436,556 .,, <,, M 33,782,288
83,819,666 ... ,,. 82,164,974 ,.. ,,. 80,632,152 ... ,,. 79,160,196 .<. .,, 77,585,128 ...d ,,. I--- I 76,094,134
Year
1937----------------------------B36----------------------------1935----------------------------1934----------------------------1933----------------------------
1932 B31----------------------------L930----------------------------1929----------------------------L928----------------------------
L927----------------------------1926 19=----------------------------L924----------------------------B23----------------------------
1922----------------------------1921----------------------------M20----------------------------MM----------------------------1918----------------------------
m17----------------------------1916----------------------------BE----------------------------u14----------------------------LOU----------------------------B12----------------------------
L9~----------------------------L910----------------------------L909----------------------------190S L907----------------------------WOE----------------------------
1943----------------------------- L36,739,00c L54,245,000 1905----------------------------1942----------------------------- 1.34,820,00c 133,920>cF20 1904----------------------------Eel----------------------------- 133,40Z,0fX 1.33,12L,c.30 1903----------------------------1940----------------------------- 131,820,00C 131,669,275 1902----------------------------1939----------------------------- 1.31,028,0w 130,879,718 Mel----------------------------1938----------------------------- 129,969,0cc 129,824,939 Moo---------------------------
lALaska included besinnins L939 and Sawaii, L960. 2TJm District of Columbia is not included in “Number of States,” but it is represente& in all data shown for each year.
Source: The populations in this table were gublisherlby the U.S. Zuree.uof the census, ties. Otbetise speejfieti,in current Population Repmts, Serien P-23, The numbers of these reports together with the years for which 6ata were ilu’tishedare shown below:
Year for which dsta Series P-25 Year for which data 8eries P-25 Year for which date. Series P-25 were furnished number were furnished number were furnished number
1975--------------------------- 343 1968--------------------------- 416 1940-30------------------------ 499 1974--------------------------- 52S B67--------------------------- 3s5 lS30-3S------------------------ 499 and VsRb 1971-73------------------------ 51s M66--------------------------- 332 B20-28------------------------ VSRb 1970--------------------------- CF lS60-63------------------------ 321 B17-19------------------------ ,299~na “sRb 1969--------------------------- 441 E51-59------------------------ 310 1900-1916----.----------------z VsRb
aU.S. 2ureau of the Census, U.S. ceIIsuSof Popukticm: 1970, Number of Inhabitants, Final Report PC (1)-AI.,united states s-a~, 1971, bNationti Office of Vital Statistics, Vital Statistics Rates in the United States, 1900-1940, J.S4T-
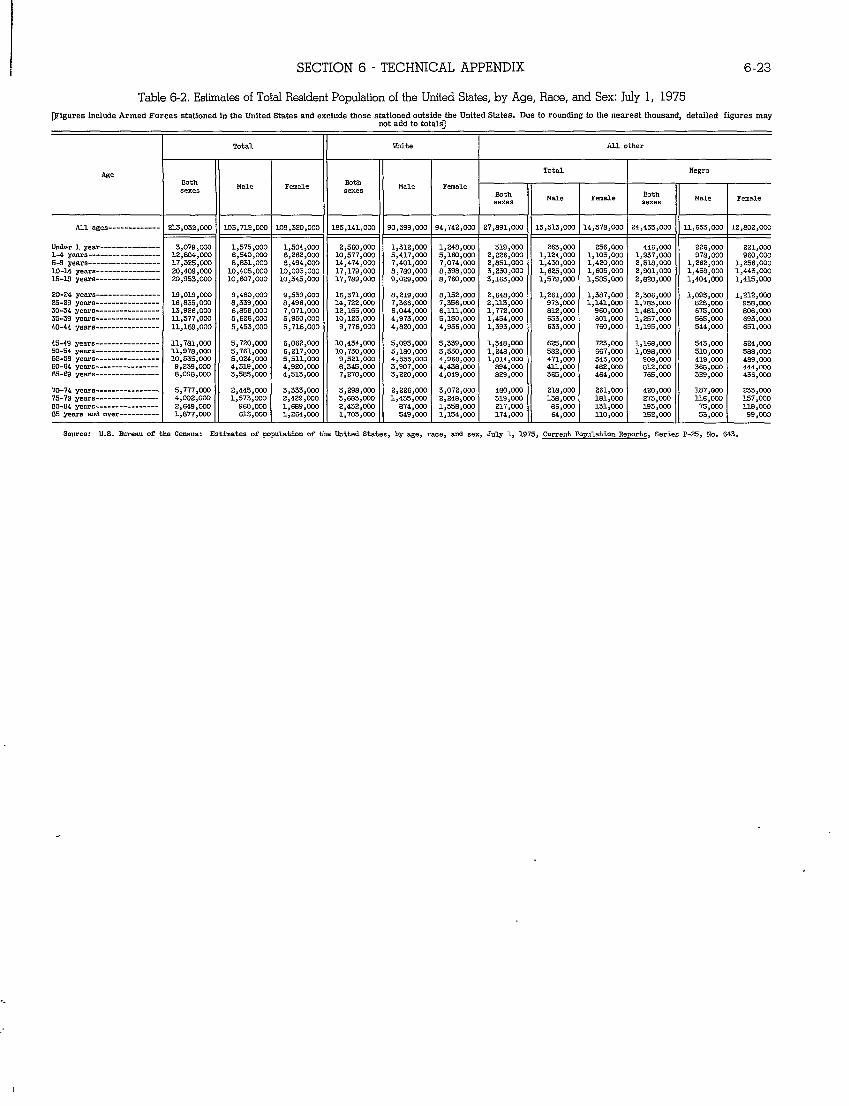
-------------
-----------------------------------------------------
----------------
--------------------------------
--------------------------------
--------------------------------
----------
SECTION 6 “ TECHNICAL APPENDIX 6-23
Table 6-2. Estimates of Total Resident Population of the United States, by Age, Race, and Sex: July 1, 1975
T3?ieures include Armed Forces stationed in the United States and exclude those stationed outside the United States. Due to roundhw to the nearest thousand. detailed fimres mav.-not add to tot61sJ
1 Total White ALLother
1 1
Age Both
Male Feud-e [email protected] Male
sexes I sexes II Femd.e
*
All ages ==4 .03,712,0W L09,320>OOC 41== .2,802,000
Under 1 ymr--------------- 3,079,W”3 1,575,000 1,504,00C 2,560,000 1,312,000 1,24S,000 519,000 263,000 236,000 446,000 226,000 221,000 1-4 yams 12,s04,002 6,540,202 6,262,00C 10,577,OW 5,417,020 5>160,000 2,226,000 1,124,000 1,103,000 1,937,000 976,000 960,000 5-9 yearn 17,325,0fM 8,s31,000 L3,494,0ci 14,474,000 7,401,0W 7,074>W0 2,1351,0W L,430,0W 1,420,000 2,6L6,cA0 L>262,W0 1,256,000 10-14 year 20,409,000 10,405,000 10,003,Ooc 17,179,000 S,780,000 8,398,000 3>230,000 1,625,000 1,603>000 2,901,000 L,456>000 1,443,LXO X5-19 yezra 20,953,000 10,607>000 10,345,OK 17,789,000 9,029,mo 8,760,000 3>163,000 L,579,0W 1,565,000 2,620,000 L,404,0W 1,415,0C0
70-74 ym.m---------------- 5,777>200 2,445,000 3,333,00C 3,072,000 480,000 216>000 261,0w 420,000 187>020 233,0W 75-79 years 4,002>W0 1,S73,0W 2,429>000 2,248,W0 319,020 L3s,ooo L61,000 273,000 116,OW 157>000 80-84 years 2,649>030 96a,ow 1,669,(XX 1,5ss,000 217,000 66,000 131,000 L93,000 75,000 118>000
20-24 years---------------- 19,019,02.3 9,480,W0 9,539,0IX 16,371,020 6,219,000 8,L52,CO0 2,648,0W 1,261,000 1,3S7,CO0 2,306,000 L,095,000 1,212,0Q0 25.29 years---------------- 16 ,s35,000 8,339,W0 S,496,00C 14,722,000 7,366,0@2 7,356,W0 Z,m,om 973,200 1,141,0w 1>783,W0 82S ,000 956,0W 30-34 yelull---------------- 13,926,000 6,S56,000 7,071,00C 12,155,WO 6,044,000 6,111,000 1,772,000 812,000 960,000 1>461,000 675,000 806,0W 35-39 yerim LL,S77,01W 5,626,0W 5,950,00C 10,123,OW 4,973,000 5,2.30>003 1,454>000 633,000 801,000 1,237,000 56S,000 693,0W 40-44 yearn 11,169,000 5,453,000 5,716,00c 9,776>000 4,620,000 4,956,000 1,393,W0 633,000 760,000 1,195,000 544,000 651,000
4s-49 Years ---------------- 11,761,000 5,720,000 6,062,00C 10,434>000 5,095,000 5,339,000 1,34S,0CF3 625,OW 723,W13 l,16S>m0 543,W0 624,000 50-54 years lL,978,000 5,761,000 6,217,00C 10,730,000 5,160,000 5,550,000 1,246,000 582,000 667,000 1,098,000 510,Wo 588,000 55-59 years 10,535,020 5 ,024,0C0 5,511,00C 9,521,003 4,553,000 4,968,000 1,014,020 471>000 543,000 908,000 419>000 4S9,0Q0 60-S4 year,---------------- 9,239,@W 4,319,coo 4,920,0W S,345,CO0 3,907,000 4,438,200 894,000 411,000 482,000 812>000 366,000 444,000 65-69 yews---------------- S,098,0C0 3,59S,000 4,513,000 7,270,000 3>220>W0 4,049,m 829,200 365,0W 464,000 765,000 329,000 436,000
85 yews EUIdover _-l 6L3,020 1>264,W0 m J_-_l 53,000 99,0001,S77,2+30 1,154,002 174,Ow 64,000 LLo,000 7.32>000J_.__Source: U.S. 6ureau of the Census: Estimates of population of the United Ste.tes,by age, race, and sex, July 1, 1975, Current Populrd.im Reports, Series P-25, No. 643,
.
..
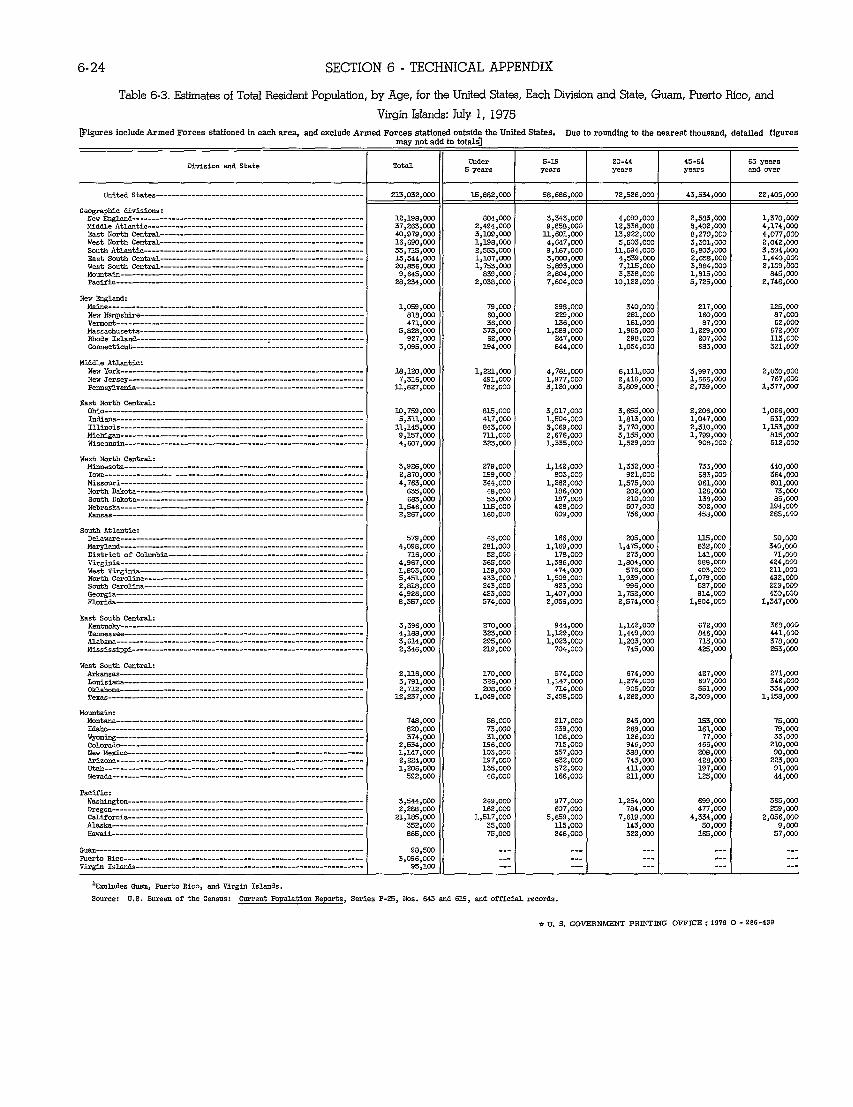
--
----------------------------------------------------------------------------------------------------------------
----------------------------------------------------------------------------------------------------------
-------------------------------------------------------------
------------------------------------------------------------------------------------------------------------------------
----------------------------------------------------------------------------------------------------------------------
----------------------------------------------------------
---------------------------------------------------------
----------------------------------------------------------------------------------------------------------------------------------------------------------------------------------------------------------------------------------------------------
-----------------------------------------------------------------------------------------------------------
-------------------------------------------------------------------------------------------------------------------------------------------------------------------------------
-------------------------------------------------------------
--------------------------------------------------------------------------------------------------------------------------
-------------------------------------------------
-------------------------------------------------------
--------------------------------------------------------------------------------------------------------------------------
----------------------------------------------------------
-------------------------------------------------------------------------------------------------------------------------
-----------------------------------------------------------------------------------------------------------------------------
------------------------------------------------------------------------------------------------------------------------------
--------------------------------------------------------------
-------------------------------------------------------------------------------------------------------------------------
-----------------------------------------------------------
---------------------------------------------------------------
---------
---------
---------
----------
------
6-24 SECTION 6- TECHNICAL APPENDIX
Table 6-3. Estimates of Total Resident Population, by Age, for the United States, Each Division and State, Guam, Puerto Rico, and
Virgin Islands: JUIY1, 1975
rF1mmesinclude iReacharea.andexcludeArmed ForcesstationsdArmed Forces stationed outsidetheUnitedStates. Due toroundlnetothenezrestthousand. detailed fieures. may not al :0 totzls]
I I
Division and State Total Under S-1$1 20-44 45-6& 65 years 5 years I years
I years years allaover
United States---------------------------------------------------- 3.5,882,000I 58,686,W0 72,526>Cr20 43,534,m 22,405,0C0 ~
Geographic divisions: I I New Ewlmd 1Z,198,000 ao4>wo 3,343,000 2,583,S00 1,370,000 Nid61e Atlmtic 37,Z63,0D0 2,494,0C0 9,858,WG 8,402,CQ0 4,174,CO0 Eeat North Cmtr~--------------------------------------------------- 40,979,0U0 3,109,OW ll,sol,wo 8,Z70,000 4,077,000 West North Catrti 16,690,CQO 1,198,000 4,647,000 3,301,000 2,042,030 South Atlmtic 33.715.000 Z,553,000 9,167,000 6,S03,0C0 3,594,0XI
,003East South Centr&--------------------------------------------------- L3;544;OO0 1,107>OCO 3,7300,000 Z,658>0’30 r,440€West South Catr&--------------------------------------------------- 20,656,000 l,753,aX) 5,893,200 3.S84.000 2,109,600€M-titi 9,845,000 839,CQo 3’,804,000 3;33S;W0 l;813;OO0 845,S00€P8ciflc-------------------------------------------------------------- 28,Z34,0W 2,038,000 7,s04,000 10,1ZZ,WO 5,7Z5,0C0 2,746,000€
NewEnglancU Mtie l,059,mo 79,000 298,ooO 340>000 217,000 125,000 Newhpstire 81S,000 60>000 ZZ9,000 281,000 160,s00 87,COO VemOnt 471>000 36,000 136,000 161,W0 s7,0=m 5Z,000 Massachusetts 5,8ZS,000 373,CXQ 1,589,CXY3 1,965,000 1,Z29,0W 672,000 mole Islmd---------------------------------r---------------------- 927,000 6Z,000 247,000 298,0CX3 207,000 113,000 cOmecticut 3,095,000 194,000 S44,000 1,054,000 6S3,000 3Z1,CCCJ
Middle Atlantic: New York------------------------------------------------------------- ls,uo,wo l,ZZ1,OCO 4,761,000 6,111,000 3,997,000 2,030,000 New Jeraey----------------------------------------------------------- 7,316,000 491,0Q0 1,977,020 2,416,000 1,666,000 767,0@ Pemsylma 3.l,S27,000 7S2,000 3,120,000 3,809,003 2,739,W l,377,0cf)
East North Central: oM0----------------------------------------------------------------- 10,759,mo 81.5,000 3,017>000 3,s65,000 Z,206,000 1,066,000 hMma 5,31.7.>000 417>000 1>504,000 1,813,0W l,047,’mo 531,00U Illinois ll,145,0w 843,0C0 3,069,2C0 3,770>s00 Z,31O,OCO 1,153,mo MicMgm 9,137,00S 7U.,OGO Z,676,WG 3,155,mo 1,799,(700 815,000
,OUO 90s,000 512,000WiscOwin 4>607,000 3Z3,0W 1,335,0C0 1,529
West North Central: Mtiesota 3,9Z6,CO0 279,000 1,142,000 1,332,s00 733,CQ0 440,0ao Iowa----------------- Z>870>OO0 199,000 803,000 9s1,000 583,000 364,CCiI
,000 1,575,000 961,0C0 601,000 Nofih D*ota 635,000 48,0C0 186,000 Zoz,m IZ6,CG0 73,CXX) Smth D&eta S83,000 53,m ls7,wo Z1O,000 138,Coo 85,Coo NebrSh 1,546,000 U.5,000 42S,020 507,S00 302,000 194,000 &s=--------------------------------------------------------------- 2,267,000 150,000 609,000 756,200 458,000 285,00S
South Atlantic: DelaWe 579 ,OCo 43,200 166,S00 Z05,CO0 115,coo 60,00Q MW~d 4,098,000 281,000 1,169,000 1,475,000 e3z,coo 340,000 District of Colmbia 716;OrlJ 5Z,000 178,0CU 273.S00 141.2W 71,000 Virginia-------------------------------------------------------------west vtigtiia--------------------------------------------------------
4,9S7,000 1>803,000
325,CC0 139,m
1,586,00) 474,m
1,804;~ 576,000
988;m 403,020
424,GO0 Zll,wo
North C=oltia 5,451,000 433,000 1,508,000 1,939,030 1,079,000 4s2.MJO south cml@------------------------------------------------------- 2,818,000 243>000 8z3,mo 996,030 5Z7,000 2Z9;OfM Oeorgia-------------------------------------------------------------- 4,9Z6,000 423,S00 1,407,000 1,752,200 914,CO0 459,020 FlOriti-------------------------------------------------------------- 13,357>oLm 574,mc Z,056,CO0 z,s74,00a 1,604,000 1,347,0C0
Mis8~i 4,783,000 344,000 1,2s2
East South Central: Kentuc@------------------------------------------------------------- 3,396,000 270,OCil 944,000 1,14Z,GC0 672,000 3m,Cxxl Temessee 4,188,000 3Z3,000 1,1Z9,0C0 1,449,020 846,000 44%,000 fiabW 3,614,S00 Z95,GO0 1>OZ3,000 1,Z03,000 715,000 376,m0 i~ississippi Z,346,000 Z19,000 704,000 745,CO0 425,000 Z53,CG0
West South Central: &kmsas Z,l16,CO0 170,000 574,000 674,000 4Z7,000 271,000 LOtisims 3,7S1,000 326,000 1,147,000 1,274,000 697,S00 346,S00 Ou&om S,7?.2,000 20s>200 714,0s0 905,200 551,0C0 334,000 Taas 1Z,Z37>200 1,049,0CXJ 3,45s,Cm 4,Z6Z,0C0 Z,3W3,00U lfl%l,ow
Mountain: Montma –.. Itio 620,000 73,Wo Z39,CC0 266,S00 161,W0 79,0CU wmiw 374,000 31,DO0 I06,0c0 1Z6,CO0 77,000 33,coo C0l0rad0------------------------------------------------------------- 2,534,000 196,000 715,000 946,000 466>000 210,000 New MticOkizoDa
1,147,000 2,224,00U
103>000 197,(700
357,000 63Z,OCO
388,000 743,2(!0
Z08,000 428,C03
90,000 223,200
ut&----------------------------------------------------------------- 1,206,02”3 lzs>ooo 37Z,0C0 413.,
74a.000 58,000 217,s00 245,000 153,0m 75,CXXI
coo 197,000 91,000 Nevati--------------------------------------------------------------- 592,000 46,CO0 166,000 211,000 125,000 44,S00
Pacific: Washington----------------------------------------------------------- 3,544,000 249,000 977>OG0 1,254,003 699,000 365,0C73 Ore~on--------------------------------------------------------------- 2,Z8S,000 162,OCO 607,000 784,s00 477,000 259,000 CtiifOrtia 21,1s5,000 1,517,000 5,659,000 7,619,000 4,334,CC0 2,056,CQ0 m5h--------------------------------------------------------------- 35Z,GC0 35,CO0 lls,oco 143,C(YJ 50,020 9,s00 Hawdi 865,0C0 75,020 246,000 322,COO 125,00Q 57,0Q0
Gw------------------------------------------------------------------- 98,500 Fuerto Rico------------------------------------------------------------ 3,096,000 Virgin Islm&--------------------------------------------------------- 95,100 .-.
%xcludes Gum, Fuert.o Rico, and Virgin Islands.
Source: U.S. Bureau of the Census: Current Population Reports, Series P-25, Nos. 843 and 612, and official recorcls.
*U. S. GOVERNMRiT PRINTING OFFICE: 1979 O- Z26-439