Embed Size (px)
Citation preview

Investment ReportExecutive SummarySeptember 2016
Vital & Growing: Adding Up the US–Indonesia
Economic Relationship
I

I I Vital & Growing: Adding Up the US-Indonesia Economic Relationship
The engaging cover of this report represents two interlocking national birds, the Javanese Hawk Eagle and the Bald Eagle. The former belongs to Indonesia and the latter represents the US. Together, they depict the collaboration and relationship between the two countries.

Amcham Indonesia & The U.S. Chamber of Commerce, 2016
© copyright reserved
AUTHOR
PRINCIPAL RESEARCHER
EDITOR
ASSOCIATE EDITORS
The US-Indonesia Investment
Report 2016
Database Services Provided
by CEIC Data Company, Jakarta
Peter Milne
Muhammad Abduh
A. Lin Neumann
Sarah Howe
Arian Ardie
John Goyer
Mary Silaban
Vital & Growing: Adding Up the US-Indonesia Economic Relationship Executive Summary
11

Preface The US-Indonesia Investment Initiative
is now in its fourth year and is a
collaborative effort between AmCham
Indonesia and the U.S. Chamber
of Commerce in Washington, DC.
Throughout the year, companies active
in the Initiative work closely with the
Indonesian government and private
sector leaders to identify ways in which
to improve the investment climate and
achieve our shared objective of higher
economic growth in Indonesia.
Under the Initiative, our annual
Investment Summits have become key
milestones at which Indonesian officials
and American companies share ideas in
a constructive and mutually
beneficial manner.
As part of this work, each year we
prepare an Investment Report. In 2013,
our first report broke new ground by
more accurately calculating the real
level of US company foreign direct
investment into Indonesia. This year,
our fourth such report, “Vital &
Growing: Adding up the US-Indonesia
Economic Relationship,” takes a
fresh approach by looking beyond
direct investment and calculating
the full value for Indonesia of the
total economic relationship with US
companies. The “big number” we
found may surprise readers, and we
think it will focus needed attention on
nurturing and opening up the
business climate.
As always, we want to recognize our
Indonesian partners in this work. The
Indonesian Chamber of Commerce and
Industry (KADIN) and the Employers’
Association of Indonesia (APINDO) are
our key private sector partners, both
of which provide counsel, support and
guidance on an ongoing basis.
The other agency with whom we work
particularly closely is the Indonesian
Investment Coordinating Board
(BKPM), which has been a co-sponsor
of our Summits since the beginning.
We greatly value the interaction with
BKPM and look forward to more joint
activities in the future.
This report would not have been
possible without the hard work of both
the AmCham and the U.S. Chamber
staff. Our consultant Arian Ardie
provides valuable advice and hard work
throughout the year on the Initiative
and the Report. We are also grateful
to all the companies who support the
Initiative and met with us to round out
the data and share their insights and
recommendations for the report.
Finally, we offer a word of heartfelt
thanks to the authors of this report,
Peter Milne and Muhammad Abduh.
Peter marshalled the resources and
wrote the report while Abduh dug deep
into the data to return the vital figures
needed to break new ground.
Our annual Investment Summits have become key milestones at which Indonesian officials and American companies share ideas in a constructive and mutually beneficial manner.
2 Vital & Growing: Adding Up the US-Indonesia Economic Relationship

Table Of Contents
Pages 4–5
Pages 6–8
Pages 8–14
Pages 14–17
Pages 18–20
Pages 20–27
Pages 27–31
Pages 32–33
Key Findings
02 Recent Trends in the Indonesia–US
Economic Relationship
01 The Real Impact of the US–Indonesia
Economic Relationship
04 Looking Beyond Our 2014 Baseline
03 Indonesia’s Current Economic
Position & Outlook
05 Cross-Sectoral Analysis & Ranking
06 Getting to a Best–Case Scenario
07 The Big Number & Our Conclusions
Index
Page 10
Page 8
Page 8
Page 9
Page 13
Page 16
Page 16
Page 16
Page 17
Page 13
Page 13
Page 18
Page 21
Tables
Figures
E1 The evolution of the five components of the Big Number, 2010-14
E1 A strong recovery in realized US FDI inflows into
Indonesia, 2010-14 ($ Billion)
E2 Growth of total economic activities vs. Indonesia
GDP Growth, 2010-15 (percent)
E3 Total economic activities growth is rapidly outpacing
Indonesia’s GDP growth, 2011-14 (percent)
E4 Evolution of US share of ASEAN peers’ economic
activities, 2010–14 (Percent)
E5 Indonesia’s manufacturing is a shadow of its former
self (Growth in GDP and real manufacturing output, %)
E6 Indonesia’s economy has de-industrialized prematurely
(Manufacturing as a share of GDP, %)
E7 Indonesia’s global manufacturing market share is low
and stagnant (Share in global manufacturing market, %)
E8 Rupiah Depreciation against the US dollar 2013-16 (Rupiah)
E2 Comparison of total US economic activities with ASEAN peers,
2010-14 (Nominal price, $ billion)
E3 Comparison of US share of ASEAN peers’
economic activities, 2010–14 (Percent)
E4 Values of Indonesia-US economic activities
in the three scenarios, 2015-19 ($ billion)
E5 Sector rankings and best overall sector for growth and investment
3US–Indonesia Investment Report 2016 Executive Summary

Key Findings
What is the real value for Indonesia
of its economic relationship with the
United States? AmCham Indonesia
and our partner in the US-Indonesia
Investment Initiative, the U.S. Chamber
of Commerce, have previously focused
in several studies on foreign direct
investment (FDI), coming up with
impressive numbers regarding US
companies and their involvement in
Indonesia. But this year, we
wanted to do more.
We set out to try and quantify the
totality of the US-Indonesia economic
relationship, to include not just FDI,
but also trade, domestic sales, finance
and government revenue. Together
these five components equal the
Big Number, which captures the
enormous importance of the economic
engagement between these two major
powers.
+ The total value of
the bilateral economic
relationship between the
US and Indonesia was
$90.1 billion in 2014.
+ The net trade adjusted
figure represents 10.1
percent of Indonesia’s
GDP in 2014.
The Big Number + The compound
annual growth rate
(CAGR) for the total
economic relationship
grew at 8.0 percent
over 5 years (2010-
15), while Indonesia’s
GDP growth over the
same period was 5.5
percent, indicating the
relationship is a strong
driver of overall growth.
+ Domestic sales make
up the largest component
of the Big Number at
$34.1 billion, followed by
bilateral trade at $27.6
billion, FDI at $14.7 billion,
finance at $11.8 billion
and government revenue
at $1.8 billion.
+ Using the best case
scenario, the number
could grow to $131.7
billion by 2019—an
increase of 46.2 percent
over 5 years.
AmCham Indonesia and our partner in the US-Indonesia Investment Initiative, the U.S. Chamber of Commerce, have previously focused in several studies on foreign direct investment (FDI), coming up with impressive numbers regarding US companies and their involvement in Indonesia. But this year, we wanted to do more. 44 Vital & Growing: Adding Up the US-Indonesia Economic Relationship
Legal Certainty is the foundation for business confidence and growth. Both US
and Indonesian companies will be able to invest, grow and create jobs if there is
greater legal certainty in terms of contract sanctity, enforcement of existing laws
and an impartial judiciary.
Collaboration and Communication are vital for the creation of an enabling
economic environment and the development of rational laws and regulations.
Effective communication as economic policies are developed to make use of the
experience and expertise of the private sector will lead to effective policies to
make Indonesia a world class economy.
Innovation is the key to keeping pace in a dynamic global economy. Incentives
for taking risks, finding new ways of doing things, investing in research and
development and human resource capacity building are the keys to innovation.
Bureaucratic and Policy Reform must continue and expand. Specific examples
include the abolition of the Negative Investment List (DNI), rationalization of the
work permit process, streamlining of permitting at all levels of government, and
reform and proper incentivization of the civil service and judiciary.
The Road to the Best Case
Economic Sector Potential
US Company Sentiment
Achieving the best-case scenario will
depend on actions taken by both the
Indonesian and US governments. It is
also dependent on external factors that
cannot necessarily be controlled. There
are, however, a series of economic
reforms that can be undertaken by
the Indonesian government that would
increase the likelihood of achieving
the best-case scenario. The process
of economic reform has already been
started by the Widodo administration,
but will need to continue and expand to
achieve the desired outcome.
These include:
The report also looks at nine industrial,
extractive and service sectors.
Each one is at a different stage of
development with US companies
playing different roles in each. The
degree to which each sector is
controlled by the government is a main
factor in the performance of each of
these sectors, now and into the future.
Based upon a ranking system
developed in the report, several
sectors have a high degree of future
potential. These include the creative
economy, finance and infrastructure.
Several sectors in which US companies
have a significant presence have
average prospects growing apace with
GDP, such as oil and gas, consumer
goods and agriculture. The final
set of sectors have lower potential
partly due to restrictive government
policies that inhibit investment and
create uncertainty. These include
extractive, pharmaceutical/healthcare/
life sciences and information
communications technology (ICT).
A survey was also taken and interviews were conducted with the executives of US
companies both in Indonesia and the US. Here are some of the findings:
+ When asked if the
reform packages have
had any impact on their
own businesses, only
25 percent stated that
they had “some impact,”
while 75 percent stated
that there was “no
impact” or that it was
still “too early to say.”
+ 87 percent felt that
there had been “some
improvement” in the
investment climate
under the Widodo
administration;
+ 100 percent stated
that the 12 economic
reform packages had
“some impact;”
5US–Indonesia Investment Report 2016 Executive Summary
What is the real value for Indonesia
of its economic relationship with the
United States? AmCham Indonesia
and our partner in the US-Indonesia
Investment Initiative, the U.S. Chamber
of Commerce, have previously focused
in several studies on foreign direct
investment (FDI), coming up with
impressive numbers regarding US
companies and their involvement in
Indonesia. But this year, we wanted
to do more.
FDI is fickle and also a relatively
unpredictable indicator of the true
importance of the Indonesia-US
economic relationship. We asked
ourselves instead if we could
quantify the wide range of economic
activities that go into the complex
relationship between the US and
Indonesia. In undertaking this task—
perhaps the first such effort of its
kind—we believe we have found a
new “Big Number” that captures
the enormous importance of the
economic engagement between these
two major economic powers and also
underscores the need to keep that
economic relationship vital and growing
as we seek to deepen the partnership
between the companies we represent
and Indonesia.
The New Big Number
In analyzing the available data we
focused on a wide-ranging series
of engagements that go far beyond
traditional FDI to encompass financial
flows, company sales, government
revenues, trade and FDI. Our aim
is to capture, as best we can, the
entire universe of economic activities
between the US and Indonesia. In
a nutshell, based on our analysis of
a wide range of economic activities
between the two countries, we came
up with a staggering figure: In 2014,
our baseline year, the total value of all
economic activities shared by Indonesia
and the US amounted to $90.1 billion.
This amounts to about 10.1 percent of
Indonesian’s total GDP in 2014.
In this summary we briefly describe
the methodology we used and also
discuss how the relationship can grow
significantly in terms of policies. It
is our strong belief that if Indonesia
follows through on President Joko
01The Real Impact of the US–Indonesia Economic Relationship
In 2014, our baseline year, the total value of all economic activities shared by Indonesia and the US amounted to US$90.1 billion. This amounts to about 10.1 percent of Indonesian’s total GDP in 2014.6 Vital & Growing: Adding Up the US-Indonesia Economic Relationship

Widodo’s stated intention to reduce
protectionism and bureaucratic
obstacles, then economic growth
will be robust with the ultimate
beneficiaries being the Indonesian
people. In our best case scenario—
which requires getting policy and
regulations right, among other things—
the total value of economic activities
between the US and Indonesia could
grow from $90.1 billion in 2014 to
$131.7 billion in 2019, or an increase of
46.2 percent over 5 years.
A Brief Methodology
Here we should digress briefly to
explain the methodology behind these
numbers, without going into too
much detail. The full methodology
can be found in Annex I of the main
report. Basically, there are five major
components in this Big Number.
Realizing that FDI is just one part of
a greater whole, we tried to capture
four other areas of economic activity
that are just as important, indeed
sometimes far more important,
than FDI. The five components are:
(i) the sum of trade between the
two countries including imports
and exports in both directions; (ii)
financing between the two countries;
(iii) the sum of domestic sales by US
companies in Indonesia, and Indonesian
companies in the US; (iv) government
revenues derived from the operations
of US companies in Indonesia
(however, this relies only on VAT
revenue, given data availability issues);
and finally (v) the sum of realized FDI,
not just of US companies in Indonesia,1
but also of Indonesian companies in the
US. Given the lack of sufficient data
for 2015, we chose 2014 as our base
year, for which the total economic
activities in the relationship amount
to $90.1 billion. This total figure then
needs to be adapted in order to make
it methodologically compatible with
Indonesia’s GDP figure, as we need to
convert the various sums (of trade,
FDI, finance and sales) into balance
figures.2 These balances when totaled
allow us to compare like for like, which
indicates that the value of economic
activities is equivalent to 10.1 percent
of GDP in 2014. Due to the lack of all
necessary data in 2014, figures for
sales and government revenue have
been extrapolated from 2013.
Beyond FDI
The first AmCham Indonesia/U.S.
Chamber of Commerce3 Investment
Report was published in 2013. That
report focused on FDI and our analysis
revealed that real US FDI into Indonesia
was far higher than the officially
published figures. We concluded,
conservatively, that from 2004 to 2012,
US FDI into Indonesia totaled about $65
billion. This contrasted significantly with
most published data and suggested that
the US, instead of being the fourth-
largest investor in the country (at that
time), was likely the largest investor
in Indonesia. More narrowly defined
official figures from Bank Indonesia
showed US FDI for the same period as
being just over a paltry $7 billion.
Moreover, back in 2013, our findings
indicated that 95 percent of total US
FDI into Indonesia was in the oil and
gas, mining and manufacturing sectors
and, while the oil and gas and mining
industries were by far the largest for
US companies, the manufacturing
sector was increasing in prominence.
However, the world is a very different
place today than it was in 2013. After
weathering the first few years after the
2008 global financial crisis remarkably
well, largely due to the commodities
boom, the Indonesian economy has
been gradually dragged down by the
collapse in commodity prices since
2012 and the economic slowdown in
China. This has been compounded
by the local currency falling more
1 Definition of US companies: In our broad definition of US companies with economic activities in Indonesia, we include all those companies that are owned by holding companies registered in the US with the address of principal executive offices as being in the US. This also applies in those cases where operating offices may be located overseas and all their subsidiaries, and affiliates and their licensees, are engaged in business activities in markets outside the US.
2 Further details of the methodology can be found in Annex I in the main report accompanying this Executive Summary.
3 The American Chamber of Commerce in Indonesia (AmCham) and the U.S. Chamber of Commerce have jointly produced the past three US-Indonesia Investment Reports (2013-15) and this current edition.
7US–Indonesia Investment Report 2016 Executive Summary

than 27 percent since 2013, and the
higher perceived risks of investing in
emerging markets globally. Meanwhile,
previously robust FDI by US companies
in the oil and gas and mining industries
took a major hit, with all firms cutting
back investment and exploration, and
some firms even deciding to pull out of
the country.
If we were to look at US FDI in the light
of the current economic environment,
while it is recovering well, it no longer
tells such an impressive story. Based
on US Department of Commerce
data, in 2014 (the latest available
year), realized US FDI into Indonesia
rose to $13.5 billion, up from $11.3
billion in 2013, a 20 percent increase.
Data from the Indonesia Investment
Coordinating Board (BKPM), however,
show far lower US numbers. BKPM
indicates that realized FDI for 2015
made Singapore the leading investor
($5.9 billion), followed by Malaysia
($3.1 billion), Japan ($2.9 billion), the
Netherlands ($1.3 billion) and South
Korea ($1.2 billion).4 The US in contrast
is said to be the seventh largest
investor, at just $0.9 billion in 2015.
But FDI is not always the best way to
measure the true value of an economic
relationship. It can fluctuate widely
depending on economic conditions
(Figure E1). This is what led us this
year to think about the US economic
relationship with Indonesia in a new
and maybe unique way.
Based on more complete US
Department of Commerce data for
US realized FDI into Indonesia, Figure
E1 below shows a very different
story, however. While we see a clear
slowdown in investment in the wake
of the global financial crisis from
2011 through to 2013, realized FDI
rebounded strongly in 2014. While
admittedly we cannot compare the US
Department of Commerce data for US
realized FDI directly with the data from
BKPM for other countries’ FDI, the
US Department of Commerce data do
nonetheless strongly suggest that the
US is by far the largest foreign investor
in Indonesia—and not just in 2014, but
for several years previously.
02Recent Trends in the Indonesia—US Economic Relationship
Once we have our formula for
calculating total economic activities
between Indonesia and the US, we
can also calculate the value of total
economic activities for previous years.
This allows us to see trends over time,
and compare these to Indonesia’s GDP
growth, as well as how constant (or
not) the size of Indonesia-US economic
activities is as a share of Indonesia’s
annual GDP by year. The nominal
value of economic activities has been
increasing rapidly since 2010, while the
annual equivalent share of Indonesia-
US economic activities in Indonesia’s
GDP has remained more or less fixed
A strong recovery in realized US FDI inflows into Indonesia, 2010–14 ($ billion)SOURCE BUREAU OF ECONOMIC ANALYSIS (BEA),
US DEPARTMENT OF COMMERCE
FIGURE E1
10.6 12 11.4 11.3 13.42010 2011 2012 2013 2014
14
13
12
11
10
4 BKPM defines US direct investment abroad as the ownership or control, direct or indirect, by one US citizen of 10 percent or more of the voting securities if the foreign business enterprise is incorporated, or an equivalent interest if the foreign business enterprise is unincorporated.
5 Note: the rate of growth of our Big Number is expressed based on IDR, and not using $.
8 Vital & Growing: Adding Up the US-Indonesia Economic Relationship

Growth of total economic activities vs. Indonesia GDP growth, 2010–15 (Percent)SOURCE BEA, CEIC, AND IMF (CPIS) DATA, WITH
AMCHAM INDONESIA STAFF CALCULATIONS
Total economic activities growth is rapidly outpacing Indonesia’s GDP growth, 2011–14 (Percent)
FIGURE E2
FIGURE E3
Total Economic
Activities8.0
5.5 GDP
2010 2011 2012 2013 2014
18
16
14
12
10
8
6
4
2
0
–2–0.6
7.4 6.2 6.0
5.65.0
6.0
3.8
9.4
16.0
NOTE TOTAL ECONOMIC ACTIVITIES ARE
CALCULATED BASED ON US$, WHILE GDP
GROWTH IS CALCULATED USING IDR. OUR DATA
FOR ECONOMIC ACTIVITIES ARE THROUGH TO
2014, WHILE THE BPS DATA FOR GDP GROWTH
ARE THROUGH TO 2015.
SOURCE BEA, CEIC, AND IMF (CPIS) DATA, WITH
AMCHAM INDONESIA STAFF CALCULATIONS
GDP GROWTH
ECONOMIC ACTIVITIES GROWTH
within the range of 8.8 to 10.1 percent.5
The average annual growth rate of the
nominal value of economic activities is
also compared with Indonesia’s annual
average GDP growth over the same
period (Figure E2). The compound
annual growth rate (CAGR) for total
economic activities between the two
countries is 8.0 percent in the period
2010-15, while the CAGR of Indonesia’s
GDP over the same period is
5.5 percent.
When seen as a timeline from 2010 to
2014 (Figure E3), it would appear that,
while there was a decline in 2011-12,
Indonesia-US economic activities are
growing robustly, while Indonesian GDP
remains below expectations. However,
given their relative size, Indonesia-US
economic activities alone can only
have a limited impact on supporting
overall Indonesian GDP growth: a 10
percent increase in the size of the
economic relationship will only increase
Indonesia’s GDP by 1 percent.
Indonesia-US economic activities are growing robustly, while Indonesian GDP remains below expectations.
9US–Indonesia Investment Report 2016 Executive Summary

Components of the Big Number
It is useful to look in more detail into
how the five components of the $90.1
billion number compare. However,
we should note that by selecting
2014 as our base year we have had
to use estimates for two of the five
components, namely domestic sales
and the total government revenue
in Indonesia. These two figures are
extrapolated from the data available
from 2009 to 2013.
The evolution of the five components of the Big Number, 2010–14SOURCE BEA, CEIC, AND IMF (CPIS) DATA, WITH
AMCHAM INDONESIA STAFF CALCULATIONS
TABLE E1
Total sales ($ bn)
GoI revenue (VAT) ($ bn)
FDI ($ bn)
Financing (US bn)
Trade ($ bn)
Total economic activities ($ bn)
Share of total economic activities vs. GDP (%)
2010 26.0 1.7 10.7 6.5 23.4 68.3 9.0
2011 30.8 1.8 12.2 9.2 26.5 80.5 9.0
2012 31.1 1.8 11.4 10.8 26.0 81.1 8.8
2013 31.2 1.7 12.4 10.5 28.0 83.8 9.2
2014 34.1 1.8 14.7 11.8 27.6 90.1 10.1
Component 1 Domestic Sales
Component 2 Trade flows
Component 3 Financing
On this basis, of the five components
in 2014—the sum of trade, the sum
of FDI, the flows of finance, the sum
of domestic sales and total revenues
to the Indonesian government—the
largest component is the sum of
domestic sales. This accounted for
an estimated $34.1 billion in 2014,
equivalent to 37.9 percent of total
economic activities. Not only this but
the nominal value of domestic sales
increased from $21.7 billion in 2009
to the current figure—a 57 percent
increase over 5 years. This level of
growth suggests that US companies in
Indonesia have shared in and benefitted
significantly from the expansion of
the consumer sector of the economy
and growth of the Indonesian middle
class. Given Indonesia’s demographics
and the continued levels of economic
growth, domestic sales are set to
continue being the main driver of the
Indonesia-US economic relationship in
the years to come.
Second in size was the sum of trade,
at $27.6 billion, or 30.7 percent of the
total. Taken together, total sales and
trade accounted for just under 68.6
percent of the relationship in 2014.
While being such a large component
of the economic relationship is highly
significant in itself, there is a more
important story here: the trade flows
between Indonesia and the US are
highly tipped in favor of Indonesia.
Looking at 2014, imports from the US
came in at $8.3 billion, while Indonesian
exports to the US were more than
double this figure, at $19.4 billion.
Indeed, in each of the past 5 years
Indonesian exports have been more
than double US imports into Indonesia.
The only caveat is that Indonesian
exports to the US are heavily
dependent on commodities but, despite
this, Indonesia-US trade has grown by
53 percent over the past 5 years, or
10.6 percent on an annualized basis.
The third component, financing,
accounted for $11.8 billion in 2014, or
13.1 percent of the total. The financial
component of the relationship is
often overlooked, despite its obvious
importance to both countries. This
may be because it is also one of the
hardest sectors for which to find
disaggregated data. However, having
met with most of the five major US
banks operating in Indonesia, a clearer
picture starts to emerge. While each
of the five banks has its own strengths
and specializations in the financial
sector, together they collectively form
a crucial platform for providing finance
1 0 Vital & Growing: Adding Up the US-Indonesia Economic Relationship

Component 4 FDI
to Indonesia, for instance through US
dollar sovereign bonds, quasi-sovereign
bonds (to state-owned enterprises)
and to the private sector. Looking at
the past 2 years, US banks have been
involved in roughly 60 to 75 percent
of all US dollar bond issuances in
Indonesia, which have raised about
$25 billion in bond financing from
2014 to May 2016. In terms of the
US dollar debt market, growth was
about 86 percent in the period 2019-
14, or an impressive 17 percent on an
annualized basis. Meanwhile, US banks
in Indonesia also constitute some of
the largest traders of equities in the
domestic stock market, together with
being major players in mergers and
acquisitions (M&A).
The fourth component is FDI, at
$14.7 billion, or 16.3 percent of the
relationship in 2014. FDI is the figure
most often cited as a measure of the
economic relationship, but it only
ranks fourth out of our five major
components. While it is undoubtedly
true that investment policy reform
often drives the broader reform
agenda, other components actually
contribute more to the total Indonesia-
US economic relationship. FDI can also
be volatile, proof of which can be seen
in the fact that it is the only one of our
components that declined due to the
global economic crisis, from 2011 to
2012. That decline notwithstanding,
total FDI (including Indonesian FDI in
the US) increased by 47 percent during
the period, from $10 billion in 2009
to $14.7 billion in 2014, an average
annualized increase of 9.4 percent.
57“On this basis, of the five components in 2014—the sum of trade, the sum of FDI, the flows of finance, the sum of domestic sales and total revenues to the Indonesian government—the largest component is the sum of domestic sales. This accounted for an estimated $34.1 billion in 2014, equivalent to 37.9 percent of total economic activities. Not only this but the nominal value of domestic sales increased from $21.7 billion in 2009 to the current figure—a 57 percent increase over 5 years.”
1 1US–Indonesia Investment Report 2016 Executive Summary
Component 5 Government Revenues
The smallest contribution to the
relationship is Indonesian government
revenues, which accounted for an
estimated $1.8 billion, or just 2 percent
of the total. Unfortunately, the
unavailability of data means that this
component is greatly understated, as
we only have complete data on value-
added tax (PPN), but not on non-tax
revenue (NTR), including royalties on
raw materials and excise on tobacco.
However, even just taking VAT
revenue into account, US companies
still contributed 13 percent of total
government tax revenue of $13.24
billion in 2014.
While the smallest of our five
components, it is nonetheless vital
to the government of Indonesia.
It is worth remembering that for
many years US companies also have
been Indonesia’s largest contributor
to government revenue, although
they are not necessarily the largest
companies operating in Indonesia.
For example, in recent years PT.
Freeport Indonesia was the largest
contributor to government revenue
until the collapse in commodities
prices and the implementation of the
export ban on mineral ore, after which
its dominant position has been taken
over by PT. HM Sampoerna, another
US company. (Note, both companies
owe their prominent position not to
VAT, but more to NTR in the form of
royalties and excise, respectively, in
addition to regular corporate income
tax.) Other major contributors to NTR
government revenues are in the oil
and gas sector, including Chevron,
ExxonMobil and ConocoPhillips. It is
worth noting that despite the current
low oil price environment, which
has caused government revenue to
plummet by around 43 percent,6 the
oil and gas sector still plays a vital role
in supporting regional development,
including through the development
of the oil and gas support services
sector, which provides important
multiplier effects. Furthermore,
Indonesia’s production share from oil
and gas is generally regarded as the
second highest in the world. From the
US company figures that we do have
access to, it is safe to say that NTR
to the government was at the very
least around $4.7 billion in 2014. This
would boost our sectoral Big Number
for government revenue from US
companies by 3.6 times.
It is worth remembering that for many years US companies have been Indonesia’s largest contributor to government revenue, although they are not necessarily the largest companies operating in Indonesia.
6 2016 Oil and Gas Production in Indonesia (BOEPD): Chevron 251,000; ConocoPhillips: 241,000; and ExxonMobil: 170,000 (Source: WoodMackenzie: SKK Migas).
By way of comparison, looking back
at 2009, at the start of the global
financial crisis, the shares of the five
components were relatively similar
to 2014. Total economic activities
in 2009 were valued at just shy of
$57.4 billion, implying a 56.8 percent
increase in the period 2009 to 2014.
The main exception is that the share
of financial flows was significantly
lower, at just 10.96 percent compared
with 13.05 percent in 2014. This would
have almost certainly been due to
the impact of the global economic
crisis at that time. In the other four
components, the shares in 2009
were 37.83 percent for total sales,
31.41 percent for the sum of trade,
17.4 percent for the sum of FDI, and
2.4 percent for total revenues to the
Indonesian government.
1 2 Vital & Growing: Adding Up the US-Indonesia Economic Relationship

Compared to the Region
We are not limited to looking only
at Indonesia in terms of economic
activities with the US. We can also
look at the value of the economic
relationship between the US and other
countries in ASEAN, for instance. Here,
using the same formula and different
sources of data, we can see Indonesia’s
nominal values relative to the size of
the other ASEAN economies
(Table E2).
Table E3 then shows these nominal
values converted into percentage
shares of total US economic activities
against GDP for each respective year.
This leads on to Figure E4, where
we can see the different shares of
GDP of the US economic relationship
with different ASEAN countries, and
observe how these have evolved over
time. In comparison to Indonesia, we
take as examples Malaysia, Thailand,
Vietnam and the Philippines.
Indonesia’s position in terms of the
value of its total economic activities
with the US compared with its ASEAN
peers is probably about where it should
be—not too high and not too low, and
also relatively stable over the five-year
period. In our five-country sample,
the nominal value of the economic
relationship between Indonesia and the
Comparison of total US economic activities with ASEAN peers, 2010–14 (Nominal price, $ billion)NOTE *IN THE 2014 DATA, GOVERNMENT
REVENUE AND DOMESTIC SALES DATA ARE
ESTIMATED FOLLOWING THE TREND IN CAGR.
SOURCE: BEA, CEIC, AND IMF DATA, WITH
AMCHAM INDONESIA STAFF CALCULATIONS.
NOTE ** 2015 DATA ARE ESTIMATES
Comparison of US share of ASEAN peers’ economic activities, 2010–14 (Percent)NOTE *IN THE 2014 DATA, GOVERNMENT
REVENUE AND DOMESTIC SALES DATA ARE
ESTIMATED FOLLOWING THE TREND IN CAGR.
SOURCE BEA, CEIC, AND IMF DATA, WITH
AMCHAM INDONESIA STAFF CALCULATIONS.
Evolution of US share of ASEAN peers’ economic activities, 2010–14 (Percent)NOTE *IN THE 2014 DATA, GOVERNMENT
REVENUE AND DOMESTIC SALES DATA ARE
ESTIMATED FOLLOWING THE TREND IN CAGR.
SOURCE: BEA, CEIC, AND IMF DATA, WITH
AMCHAM INDONESIA STAFF CALCULATIONS.
NOTE ** 2015 DATA ARE ESTIMATES
TABLE E2
TABLE E3
FIGURE E4
Thailand Vietnam Philippines Malaysia Indonesia
2010 96.5 22.6 40.3 106.8 68.3
2011 105.5 26.6 43.9 112.2 80.5
2012 113.8 29.3 43.7 105.5 81.1
2013 117.0 34.4 43.4 109.4 83.8
2014* 130.8 41.2 48.9 118.2 90.1
2015** 137.0 50.4 48.4 121.1 92.1
Thailand Vietnam Philippines Malaysia Indonesia
2010 27.93 19.50 19.61 40.10 9.03
2011 28.90 19.65 19.80 39.10 9.02
2012 28.58 18.80 16.98 33.21 8.83
2013 28.22 20.07 16.69 35.24 9.15
2014* 32.43 22.12 17.31 37.32 10.12
2010 2011 2012 2013 2014* 2015**
50
45
40
35
30
25
20
15
10
5
MALAYSIA
THAILAND
VIETNAM
PHILIPPINES
INDONESIA
40.1
27.9
19.5
19.6
9.0 9.0 8.8 9.2 10.1 10.7
19.8
17.0 16.7 17.3 17.1
19.7 18.820.1
28.9 28.6 28.2
32.4
22.1
26.0
35.0
39.1
33.235.2
37.3
45.2
1 3US–Indonesia Investment Report 2016 Executive Summary

US lies sandwiched between Malaysia
and Thailand with the highest values,
and the Philippines and Vietnam, with
the lowest. While it is true to say that
growing the size of the economy is
what is most important here, the fact
that in some countries the value of
their economic activities with the US is
growing faster than others may indicate
that these countries are more open and
attractive to US economic activities.
If this growth is indeed occurring,
while the share of the value of
economic activities in GDP remains
more or less constant, it infers that all
economic relationships with a country
are growing together and mutually
benefiting each other. This, after all, is
the ultimate goal.
03Indonesia’s Current Economic Position & Outlook
Recent Economic Trends
in Indonesia
The Indonesian economy has been
struggling to maintain growth since
2012 in the face of lower commodity
prices and slower global growth.
Despite the recent slowdown, however,
the country’s per capita GDP has
grown steadily from $560 in 2000 to
$3,630 in 2014. With Indonesia’s export
revenues contracting throughout 2015,
GDP growth slipped to 4.8 percent.
While still respectable, especially for a
commodities exporter, Indonesia will
struggle to absorb new entrants into
the country’s labor force at this rate of
growth. Going forward, Indonesia will
need to adapt to a less favorable global
environment and focus even more on
facilitating investment and reducing
the costs of doing business.
The fiscal stimulus provided by the
government, aided by additional
funds coming from the shift in public
expenditure away from wasteful fuel
subsidies, will undoubtedly help to
support economic expansion. There
was, for instance, a threefold increase
in infrastructure spending in the first
quarter of 2016, together with a 10-fold
spike in physical construction for the
same quarter. However, government
activity alone will not raise growth
above 5 percent in 2016. The only
way to ensure that growth rebounds
will be through greater private sector
activity, especially through private
sector investment. This is where US
companies can play an important
role—especially in generating
new jobs.
Driven mainly by the increase in public
spending at the end of the year,
growth did pick up in the final quarter
of 2015 to 5 percent year-on-year,
after three previous quarters of 4.7
percent growth. However, at the same
time consumption remained moderate,
while exports and imports both
continued to decline, highlighting the
challenges faced by the private sector.
Worryingly, the biggest contributor
to the overall decline in the trade
balance came from a contraction in
manufacturing exports, which fell by
13.4 percent year-on-year.
Weakening FDI and Stemming the
Outflows of Capital
Indonesia also experienced a significant
decline in its financial account in 2015,
as capital fled emerging markets
generally. Total 2015 capital flows to
Indonesia declined to just $17.1 billion
in 2015, down from $45 billion in 2014.
The outflows of capital from Indonesia
were only stemmed by foreign
investment into Indonesian government
bonds toward the end of 2015, helping
to stabilize the rupiah at 4.4 percent in
February. Most of these investments
flowed through US investment banks in
Indonesia. A stronger rupiah and lower
inflation helped Bank Indonesia (BI) to
finally start easing its monetary policy
in January with two consecutive cuts in
interest rates of 25 basis points each.
However, as we have seen in the past
few months, BI will need to remain
vigilant amid continuing global financial
market volatility and the possibility
of rising US interest rates putting
pressure on the rupiah.
Against this backdrop, the World Bank
set its GDP growth projections at
5.1 percent in 2016 and 5.3 percent
in 2017, with the figure for 2016
1 4 Vital & Growing: Adding Up the US-Indonesia Economic Relationship
contingent on private sector spending
picking up in the second half of the
year. Beyond 2016, the economic
recovery in Indonesia will ultimately
rely on policies designed to attract
far greater private investment and
diversify the economy away from
reliance on the extractive industries.
The first welcome signs of this new
approach were seen in September
2015, with the unveiling of the first
of a continuing series of economic
reform packages.
The Economic Reform Packages
The government’s series of economic
reform packages—12 packages at the
time of writing—is a step in the right
direction for the private sector. We
discuss the details of the individual
packages in the main report and how
they address some of the concerns
of US companies. Looking at the
details, however, it seems as though
the government is addressing specific
problems that it sees as holding up
investment. While the packages are
certainly positive, it is not yet clear
that they add up to a clear reform
strategy, which is really what is needed
to attract enough investment to boost
growth significantly. One of the reform
packages does address the Negative
Investment List (DNI), allowing more
foreign investment into the creative
economy and other sectors.
However, the DNI still restricts to
varying degrees some 600 sectors
that represent about 70 percent
of the economy.
Shifting from Commodities to
Manufacturing
Both Indonesian and US private
sector companies need to move away
from an over-reliance on Indonesian
commodities in the wake of one of
the greatest commodity booms ever
seen, from 2003 to 2012. One side-
effect of the commodities boom
was that it rendered investing in the
Indonesian manufacturing sector less
attractive to investors when easy
returns could be made in commodities
with little or no valued-added. Given
that manufacturing tends to be highly
labor-intensive and the extractive
industries just the opposite, it should
come as little surprise that while
Indonesia comprises half of ASEAN’s
total labor force, it contributes only
16 percent of ASEAN’s manufacturing
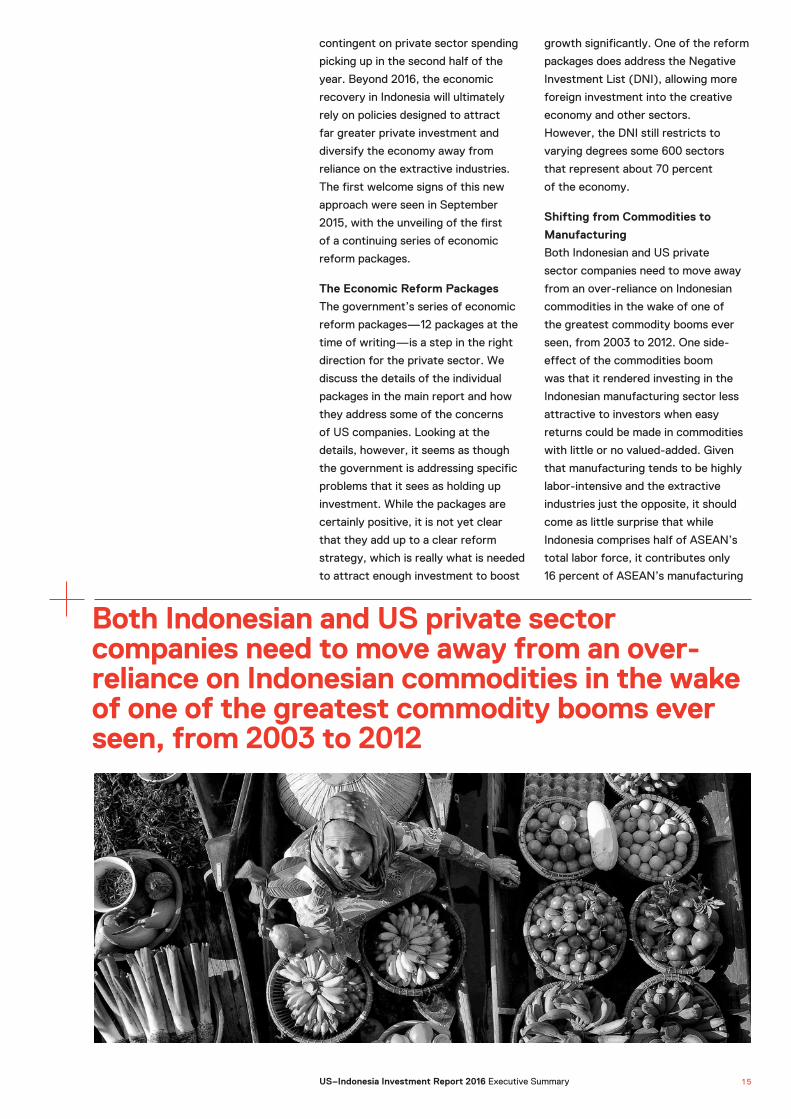
Both Indonesian and US private sector companies need to move away from an over-reliance on Indonesian commodities in the wake of one of the greatest commodity booms ever seen, from 2003 to 2012
1 5US–Indonesia Investment Report 2016 Executive Summary

exports. In fact, looking more closely
at data from the World Bank, Indonesia
underwent a process of “premature
deindustrialization” from about 2002
onward, as commodities overtook
manufacturing as the largest exports
from 2005 onward.
This de-industrialization is seen to
be premature because it is occurring
far too early in the cycle of economic
development compared with other
countries in the region (Figure E6).
With the focus of investment in
Indonesia leaning heavily toward
commodities in recent years, countries
in the region with fewer natural
resources have been busy expanding
their shares of the global manufacturing
market. As illustrated in Figure E7, this
has led to stagnation in Indonesia’s
market share of global manufacturing,
while countries such as China and
Malaysia have soared, and Vietnam’s
manufacturing share has expanded
rapidly since 2010, overtaking and
surging ahead of Indonesia.
Indonesia’s manufacturing is a shadow of its former self (Growth in GDP and real manufacturing output, %)7
SOURCE WORLD BANK STAFF CALCULATIONS.
Indonesia’s economy has de-industrialized prematurely (Manufacturing as a share of GDP, %)8
SOURCE WORLD BANK STAFF CALCULATIONS
SOURCE UN-COMTRADE; WORLD BANK STAFF
CALCULATIONS.
Indonesia’s global manufacturing market share is low and stagnant (Share in global manufacturing market, %)9
SOURCE UN-COMTRADE; WORLD BANK STAFF
CALCULATIONS
FIGURE E5
FIGURE E6
FIGURE E7
16
14
12
10
8
6
4
2
0
40
35
30
25
20
15
10
20
18
16
14
12
10
8
6
4
2
0
2.5
2.0
1.5
1.0
0.5
0
0 5,000
1990
Malaysia
China
Indonesia
Vietnam
1995 2000 2005 2010 2015
10,000 20,00015,000 25,000
199
0
199
1
199
2
199
3
199
4
199
5
199
6
200
1
200
2
200
3
200
4
200
5
200
6
200
7
200
8
200
9
2010
2011
2012
2013
2014
Post 1997/98 Crisis
GDP per–capita, PPP (constant 2011 in USD)
Before 1997/98 Crisis
GDP
MANUFACTURING GROWTH
7 World Bank, 2016. Indonesian Economic Quarterly, June 2016. Resilience through reforms.
8 Ibid.
9 Ibid.
CHINA
THAILAND
INDONESIA
MALAYSIA
1990
1990
20052014
19902005
2014
20052014
1990
2005
2014
1 6 Vital & Growing: Adding Up the US-Indonesia Economic Relationship

Several issues are holding Indonesian
manufacturing back. First, while
Indonesia has the lowest wage costs
in US dollar terms in the region, this
advantage is erased by low labor
productivity. In 2014, unit labor costs
were higher in Indonesia than in the
Philippines and Vietnam, as a result
of low productivity. Malaysia’s unit
labor costs are only slightly higher
than Indonesia’s, despite the fact that
Malaysian workers’ wages are 7-8
times higher. Second, efficient logistics
are crucial for supplying the domestic
market and competing internationally.
Indonesia’s logistics costs account
for 24 percent of GDP, compared
with Thailand at only 16 percent. This
is equivalent to Indonesia wasting
$70 billion a year on inefficient and
costly logistics. The inefficiencies and
unreliability of logistics in Indonesia
force companies to stock higher
inventory, increasing costs. Third,
regulatory procedures, licensing and
permitting are overly complex and
create delays, also increasing costs.
Along with construction permits,
paying taxes and enforcing contracts
in Indonesia are among the most
cumbersome in the world (World
Bank, 2016).
With the decline in commodity prices
manufacturing is once again relatively
attractive for investment. In addition,
the rupiah’s sharp depreciation
since 2013 should now help to make
Indonesian manufacturers more
competitive (Figure E8).
The recent government reform
packages appear to herald a new and
fundamental shift toward reducing
regulatory burdens and improving the
business climate. The government
has even expressed its interest in
joining the Trans-Pacific Partnership
(TPP). In this new and more positive
outward-looking environment, US
companies stand ready to contribute to
boosting the manufacturing sector and
helping Indonesia to regain its former
prowess as a regional manufacturing
powerhouse.
With the decline in commodity prices manufacturing is once again relatively attractive for investment. In addition, the rupiah’s sharp depreciation since 2013 helps to make Indonesian manufacturers more competitive.
Rupiah depreciation against the US dollar, 2013–16 (Rupiah)NOTE ANNUAL AVERAGE EXCHANGE RATE FOR
IDR/$: 2013, IDR 10,452; 2014, IDR 11,878; 2015: IDR
13,392; AND 2016 (UNTIL JULY), IDR 13,414.
SOURCE BANK INDONESIA.
FIGURE E8
9,500
10,500
11,500
12,500
13,500
14,500
15,500
2013 2014 2015 2016
1 7US–Indonesia Investment Report 2016 Executive Summary

04Looking Beyond Our 2014 Baseline
Three Scenarios for Growth
Using our “Big Number” for 2014 as a
baseline, it is possible to extrapolate
into the future using a number of
different scenarios of economic
growth between now and 2019. We
have selected three main scenarios
as follows: (i) our business-as-usual
scenario, which assumes a compound
annual growth rate (CAGR) of 5.1
percent over the period (the current
World Bank GDP growth projection
for 2016); (ii) a worst-case scenario
where Indonesia is hit by global
financial shocks and experiences
macroeconomic volatility that reduces
economic growth to an average of 3.5
percent; and (iii) a best-case scenario
whereby Indonesia achieves President
Joko Widodo’s goal of 7 percent GDP
growth by the end of his term in 2019.
The growth trajectories are illustrated
in Table E4 below:
46.2
Values of Indonesia–US economic activities in the three scenarios, 2015–19 ($ billion) NOTE THESE DATA USE NOMINAL FIGURES,
AFTER CALIBRATING FROM CONSTANT PRICE
FOR PROJECTION PURPOSES. AT CONSTANT
2015 PRICES (CPI = 6.38%) AND 2014 $/IDR
FOREX RATE.
SOURCE AMCHAM INDONESIA STAFF
CALCULATIONS.
TABLE E4
5.1% World Bank growth scenario (i)
3.5% growth scenario (ii)
President’s Widodo’s 7% growth by 2019 scenario (iii)
2015 98.7 97.2 100.5
2016 103.7 100.6 107.5
2017 109.0 104.1 115.0
2018 114.5 107.7 123.1
2019 120.4 111.5 131.7
Based on these assumptions, in the
best-case scenario the total value
of economic activities shared by
Indonesia and the US grows from $90.1
billion in 2014 to $131.7 billion in 2019,
an increase in the “pie” of 46.2 percent
over 5 years. Meanwhile, the business-
as-usual scenario would only increase
economic activities by 5.1 percent, to
$120.4 billion in 2019, while the worst-
case scenario would see an increase of
3.5 percent, to $111.5 billion by the end
of President Widodo’s terms in 2019.
What can be done to ensure that
Indonesia gets on track to follow the
best-case scenario and grow the
economic pie by as much as is feasibly
In the best-case scenario the total value of economic activities shared by Indonesia and the US grows from US$ 90.1 billion in 2014 to US$ 131.7 billion in 2019, an increase in the “pie” of 46.2 percent over 5 years.
1 8 Vital & Growing: Adding Up the US-Indonesia Economic Relationship

AmCham’s 2016 Investment Sentiment
Survey
BOX E1
In order to better understand the
current investment sentiment of
US companies in Indonesia and
the current characteristics of US
companies already operating here,
AmCham Indonesia conducted a
combined investment survey and
data questionnaire among large
companies in May and June of
this year. The survey provides
the following insights.
Company Perceptions
First of all, we asked US companies
whether they had seen an
improvement in the investment
climate over the past two years (i.e.,
since the new Widodo administration
took office). In response, 87 percent
of companies felt that there had been
“some improvement.” Meanwhile,
when asked whether the 12 economic
reform packages had had any
impact on the business environment,
fully 100 percent replied that they
perceived “some impact.” This
figure drops considerably when
the same companies were asked if
the packages had had any tangible
impact of their own businesses.
Here, only 25 percent felt there was
“some impact,” while 75 percent felt
there had been “no impact,” or that
it was still “too early to say.”
We then asked the companies
about those areas they felt needed
improvement in order for their
businesses to prosper, asking them
to rank five areas in terms
of importance. The most important
area of concern was Legal Certainty,
with 50 percent of companies
ranking this the highest priority.
This was followed by Regulatory
Reform, ranked first by 37 percent
of companies, followed by the need
for Policy Reform. This was followed
by Infrastructure Improvements.
The fifth most important area was
seen as Improvements in Human
Resources.
Lastly, we asked the companies if
they felt more positive today than
they did two years ago about doing
business. Here we found that while
50 percent of companies were “more
positive” now, the other 50 percent
were either “less positive” or “not
sure.” The structural, procedural and
behavioral changes underway need
to be continuously encouraged to
bring about more positive reforms.
The Characteristics of US
Companies in Indonesia
In terms of the characteristics of
the US companies in our survey,
the average amount of total FDI
invested in Indonesia was about $3
billion. Average revenue in 2015 was
about $1.9 billion, with average total
salaries of $83 million. Total salaries
and employee compensation paid by
US companies in 2015 were about
$344 million.
The figures for government revenue
paid by the companies in our survey
are also interesting, as they shed
some light on the degree to which
the government revenue component
in our Big Number is understated.
The average payments for total VAT
(PPN), total indirect taxes (royalties
and excise) and corporate income tax
by US companies in 2015 were $171.3
million, $2.0 billion and $105 million,
respectively. Meanwhile, the totals
were $685.2 million for VAT, $4.0
billion for NTR, and $315.8 million for
corporate income tax. It is interesting
to note that the revenue from NTR
is almost six times that from VAT.
Bearing in mind that our Big Number
uses data built on only VAT revenue,
this means that our Big Number is
understated by at least $4.3 billion,
if we include both NTR and
corporate income tax.
Looking at investment intentions
going forward, on average the US
companies in our survey had plans
to invest $334 million over the next
5 years. In terms of employment,
the US companies in our survey
employed about 112,000 workers
in 2015, while fewer than 100
employees in these companies were
expatriates—less than 0.1 percent.
Therefore, US companies operating
in Indonesia can be seen to be major
employers of Indonesians,
not expatriates.
possible? This assumes that the
share of the Indonesia-US economic
relationship to overall Indonesian GDP
remains more or less constant at 9.5
percent from 2014 to 2019, while the
nominal size of the relationship grows
to $ 131.7 billion by 2019.
Incidentally, if the Indonesian economy
were to grow based on our best-
case scenario assumption, this would
mean that the cumulative value of all
economic activities between the two
countries from 2015 through to 2019
would be about $577.8 billion—a very
big number indeed!
1 9US–Indonesia Investment Report 2016 Executive Summary

05Cross-Sectoral Analysis & Ranking
In the main report that accompanies
this Executive Summary, we analyze
the nature, characteristics and
challenges of nine sectors of the
Indonesian economy. These nine
sectors comprise: agriculture;
consumer goods; creative industries;
extractive (mining and quarrying);
finance; ICT; infrastructure; oil and
gas; and pharmaceuticals, healthcare
and life sciences.
In order to analyze the nature of
the involvement of US companies
across our nine sectors, and the
relative prospects for the sectors, we
constructed a methodology to rank
sectors according to four criteria.
These four criteria are:
10 For each of these criteria we ranked each sector from 1 to 9 and then added their rankings to give sector scores of 4-36. Then dividing them by 4 gives equal weighting to each of our four criteria. The result is a sectoral ranking from 1 to 9, where 1 is the sector with the greatest potential for growth and investment for US companies and 9 is the least. By including all four factors in this way we try to relatively accurately reflect, albeit subjectively, what is happening in the overall Indonesian economy.
These factors were chosen such that
we could compare the potential for
investment and growth in the various
sectors in which US companies have
investments. The absolute size of the
sector and the portion of the sector
that is occupied by US companies,
gives us an indication of the relative
importance and opportunities for
further investments in the sector.
The CAGR (2010-14) gives historical
perspective on sector growth, while
the 2014-15 growth rate gives us
information about the current direction
and potential of the sector. The
growth rates differ from those given
by the Indonesian government, as they
are based upon rupiah converted to
US dollar values, thus reflecting the
continued devaluation of the rupiah
over the past 5 years. Ultimately, this
is the value that US investors use in
making their investment decisions
and the return on the US dollar
invested. Cross-sectoral comparisons
are difficult at best and our ranking
system does not take the policy and
regulatory environment into account,
which is highly subjective, but would
probably also change the rankings of
the sectors.
1
2
3
4
Total US economic activities of US companies in each sector;
Overall share of US companies in each sector as a fraction of the total size of each sector;
Compound annual growth rate (CAGR) of each sector in 2010-14; and
Year-on-year growth of each sector from 2014 to 2015.10
2 0 Vital & Growing: Adding Up the US-Indonesia Economic Relationship
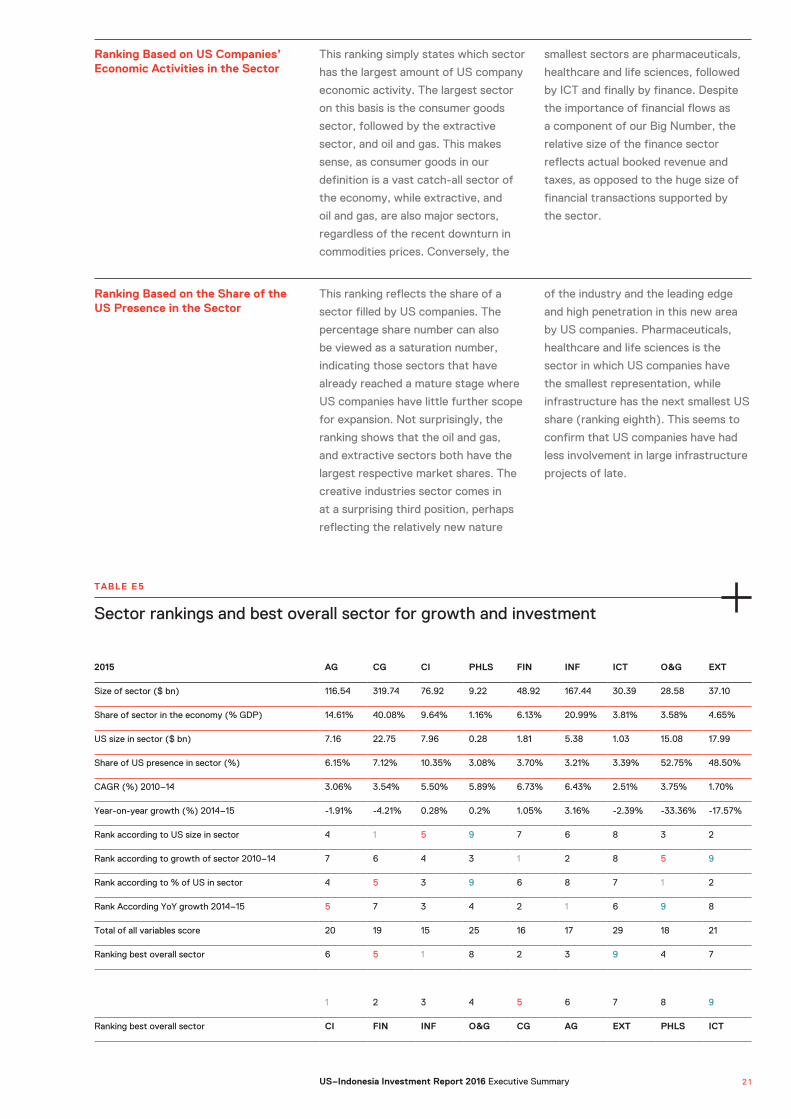
Sector rankings and best overall sector for growth and investment
TABLE E5
2015 AG CG CI PHLS FIN INF ICT O&G EXT
Size of sector ($ bn) 116.54 319.74 76.92 9.22 48.92 167.44 30.39 28.58 37.10
Share of sector in the economy (% GDP) 14.61% 40.08% 9.64% 1.16% 6.13% 20.99% 3.81% 3.58% 4.65%
US size in sector ($ bn) 7.16 22.75 7.96 0.28 1.81 5.38 1.03 15.08 17.99
Share of US presence in sector (%) 6.15% 7.12% 10.35% 3.08% 3.70% 3.21% 3.39% 52.75% 48.50%
CAGR (%) 2010–14 3.06% 3.54% 5.50% 5.89% 6.73% 6.43% 2.51% 3.75% 1.70%
Year-on-year growth (%) 2014–15 -1.91% -4.21% 0.28% 0.2% 1.05% 3.16% -2.39% -33.36% -17.57%
Rank according to US size in sector 4 1 5 9 7 6 8 3 2
Rank according to growth of sector 2010–14 7 6 4 3 1 2 8 5 9
Rank according to % of US in sector 4 5 3 9 6 8 7 1 2
Rank According YoY growth 2014–15 5 7 3 4 2 1 6 9 8
Total of all variables score 20 19 15 25 16 17 29 18 21
Ranking best overall sector 6 5 1 8 2 3 9 4 7
1 2 3 4 5 6 7 8 9
Ranking best overall sector CI FIN INF O&G CG AG EXT PHLS ICT
Ranking Based on US Companies’ Economic Activities in the Sector
This ranking simply states which sector
has the largest amount of US company
economic activity. The largest sector
on this basis is the consumer goods
sector, followed by the extractive
sector, and oil and gas. This makes
sense, as consumer goods in our
definition is a vast catch-all sector of
the economy, while extractive, and
oil and gas, are also major sectors,
regardless of the recent downturn in
commodities prices. Conversely, the
smallest sectors are pharmaceuticals,
healthcare and life sciences, followed
by ICT and finally by finance. Despite
the importance of financial flows as
a component of our Big Number, the
relative size of the finance sector
reflects actual booked revenue and
taxes, as opposed to the huge size of
financial transactions supported by
the sector.
Ranking Based on the Share of the US Presence in the Sector
This ranking reflects the share of a
sector filled by US companies. The
percentage share number can also
be viewed as a saturation number,
indicating those sectors that have
already reached a mature stage where
US companies have little further scope
for expansion. Not surprisingly, the
ranking shows that the oil and gas,
and extractive sectors both have the
largest respective market shares. The
creative industries sector comes in
at a surprising third position, perhaps
reflecting the relatively new nature
of the industry and the leading edge
and high penetration in this new area
by US companies. Pharmaceuticals,
healthcare and life sciences is the
sector in which US companies have
the smallest representation, while
infrastructure has the next smallest US
share (ranking eighth). This seems to
confirm that US companies have had
less involvement in large infrastructure
projects of late.
2 1US–Indonesia Investment Report 2016 Executive Summary

Ranking Based on the Growth Rate of the Sector
Ranking Based on the Year–on –Year Growth Rate 2014-15
The calculated 2010-14 CAGR for the
sectors helps to complete the overall
picture by ranking sectors according to
how well they were doing in the recent
past. Historically, the fastest growing
sectors are finance, infrastructure,
healthcare and life sciences, and the
creative industries. It comes as no
surprise that the worst performing
sector is oil and gas given the decline
in commodity prices, investment
and production.
The latest annual growth rate for
2014-15 reflects the current status
of each sector. The growth rate has
been impacted by the depreciation
of the rupiah over the period, which
fell by 11 percent during this period.
During 2015, infrastructure and finance
grew the fastest, with agriculture and
consumer goods contracting, while
the extractive and oil and gas sectors
plummeted with -17.6 percent and
-33.4 percent year-on-year declines.
During 2015, infrastructure and finance grew the fastest, with agriculture and consumer goods contracting, while the extractive and oil and gas sectors plummeted with -17.6 percent and -33.4 percent year-on-year declines.
2 2 Vital & Growing: Adding Up the US-Indonesia Economic Relationship

1st
2nd
The creative industries sector is the
newest of the sectors that we cover,
exhibiting strong historical and current
growth. It also is third best in terms
of US company sector penetration.
Although the creative economy did not
rank top for any of the four factors,
and faces challenges with excessive
regulatory oversight together with
inconsistent enforcement measures
impacting the exploitation and
distribution of creative content,
a strong combination of market
penetration and growth indicates that
this sector has good potential.
The nature of the finance sector is that
companies take only a small amount of
its huge overall turnover. This tends
to understate the impact of the sector
on overall economic activity, despite
its obvious importance and overall
size, as shown by the relative size
of financial flows as a component of
our Big Number. While US companies
play a vital role in this sector and the
overall economy, there are relatively
few US players operating in Indonesia.
With a CAGR of 6.73 percent over the
past 5 years, growth in the sector is
the best of all sectors. Given the US
presence of just 3.7 percent, there
should be significant scope for further
US expansion in the sector, especially
as the insurance market starts to open
up and gains traction from the growing
middle class. It may be difficult for US
banks not already present in Indonesia
to penetrate the market, given the
regulatory environment. However,
the large US banks already here are
well positioned to benefit from future
robust economic growth.
Below are some thoughts on each of the sectors based upon their overall ranking from the most promising for growth and investment to the least promising.
Creative Industries Sector
Financial Sector
2 3US–Indonesia Investment Report 2016 Executive Summary
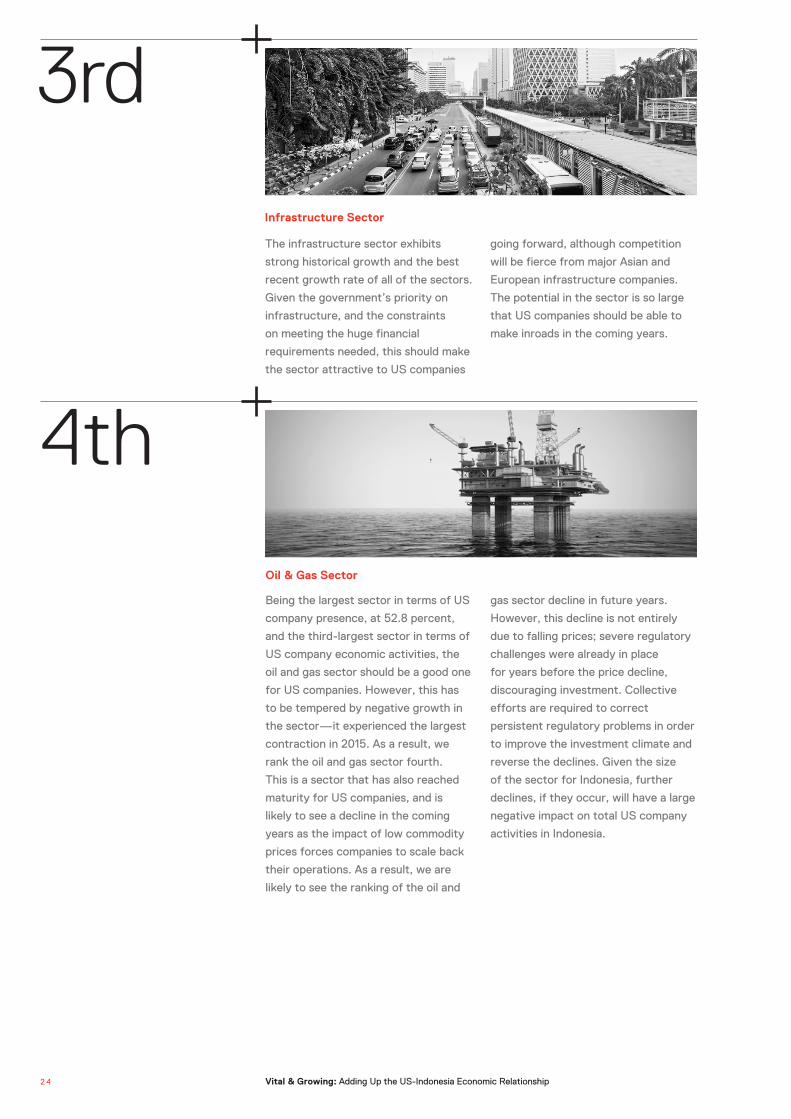
4th
Being the largest sector in terms of US
company presence, at 52.8 percent,
and the third-largest sector in terms of
US company economic activities, the
oil and gas sector should be a good one
for US companies. However, this has
to be tempered by negative growth in
the sector—it experienced the largest
contraction in 2015. As a result, we
rank the oil and gas sector fourth.
This is a sector that has also reached
maturity for US companies, and is
likely to see a decline in the coming
years as the impact of low commodity
prices forces companies to scale back
their operations. As a result, we are
likely to see the ranking of the oil and
gas sector decline in future years.
However, this decline is not entirely
due to falling prices; severe regulatory
challenges were already in place
for years before the price decline,
discouraging investment. Collective
efforts are required to correct
persistent regulatory problems in order
to improve the investment climate and
reverse the declines. Given the size
of the sector for Indonesia, further
declines, if they occur, will have a large
negative impact on total US company
activities in Indonesia.
Oil & Gas Sector
3rd
The infrastructure sector exhibits
strong historical growth and the best
recent growth rate of all of the sectors.
Given the government’s priority on
infrastructure, and the constraints
on meeting the huge financial
requirements needed, this should make
the sector attractive to US companies
going forward, although competition
will be fierce from major Asian and
European infrastructure companies.
The potential in the sector is so large
that US companies should be able to
make inroads in the coming years.
Infrastructure Sector
2 4 Vital & Growing: Adding Up the US-Indonesia Economic Relationship

6th
5th
The agriculture sector appears to
be stable for US companies, with
sizeable economic activities, together
with a US presence slightly above
the median. The growth rate, at a
CAGR of 3.06 percent in 2010-14,
is below the national GDP growth
rate of 5.1 percent, which is probably
largely due to the depreciation of the
rupiah. At 6.2 percent presence in
the sector, there is still ample scope
for US companies to expand their
penetration should government policies
encourage higher levels of investment
in agriculture.
This is the largest sector in the
Indonesian economy and it provides
the largest amount of US company
economic activities. In terms of our
ranking, the consumer goods sector
comes in fifth overall, primarily due
to relatively slow growth historically
and negative growth in 2015. Overall,
US companies are already well
positioned in the sector and making
strong revenues, but at the same
time the sector has been hurt by slow
growth and rupiah depreciation. If the
Indonesian economy gradually recovers
from the 2015 slowdown, growth in
the sector should start to reverse its
contraction of -4.21 percent in 2015,
and move back toward its historical
CAGR of 5.5 percent in 2010-14. It is
likely therefore that going forward we
can expect the consumer goods sector
to not only consolidate its primary
position for US companies in Indonesia,
but also to attract further interest from
US companies that have yet to start
operations in Indonesia.
Agriculture Sector
Consumer Goods Sector
2 5US–Indonesia Investment Report 2016 Executive Summary
7th
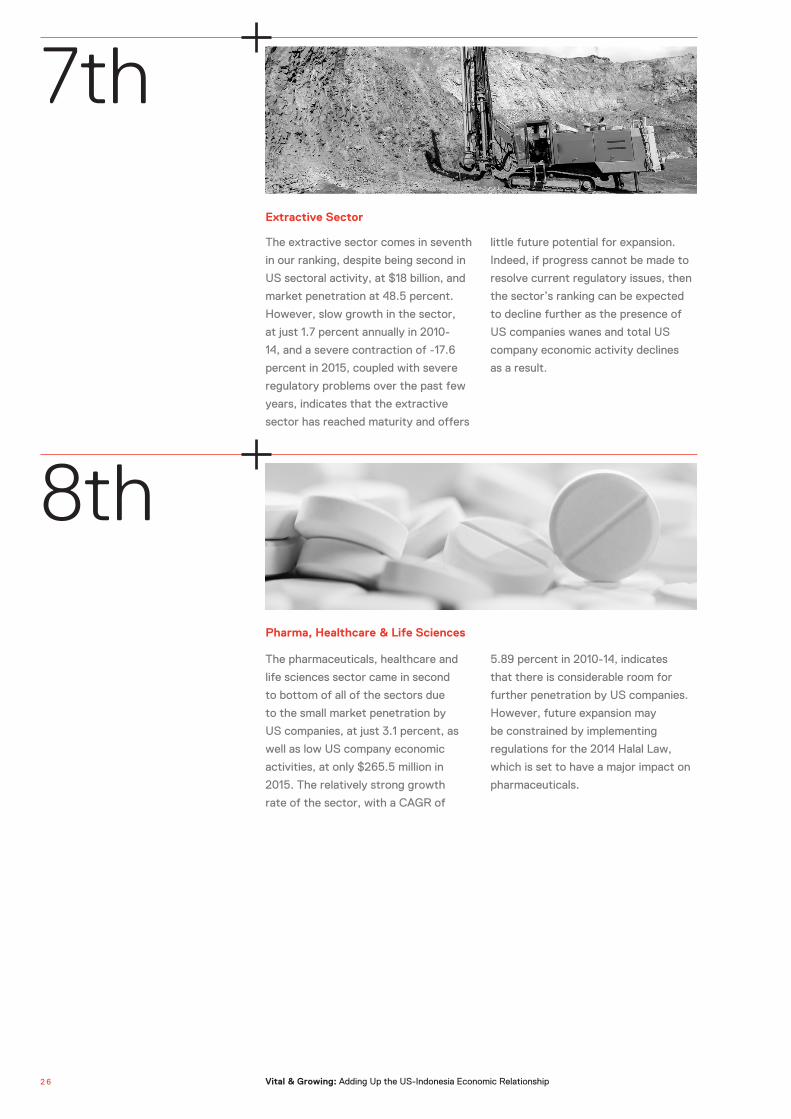
The extractive sector comes in seventh
in our ranking, despite being second in
US sectoral activity, at $18 billion, and
market penetration at 48.5 percent.
However, slow growth in the sector,
at just 1.7 percent annually in 2010-
14, and a severe contraction of -17.6
percent in 2015, coupled with severe
regulatory problems over the past few
years, indicates that the extractive
sector has reached maturity and offers
little future potential for expansion.
Indeed, if progress cannot be made to
resolve current regulatory issues, then
the sector’s ranking can be expected
to decline further as the presence of
US companies wanes and total US
company economic activity declines
as a result.
Extractive Sector
8th
The pharmaceuticals, healthcare and
life sciences sector came in second
to bottom of all of the sectors due
to the small market penetration by
US companies, at just 3.1 percent, as
well as low US company economic
activities, at only $265.5 million in
2015. The relatively strong growth
rate of the sector, with a CAGR of
5.89 percent in 2010-14, indicates
that there is considerable room for
further penetration by US companies.
However, future expansion may
be constrained by implementing
regulations for the 2014 Halal Law,
which is set to have a major impact on
pharmaceuticals.
Pharma, Healthcare & Life Sciences
2 6 Vital & Growing: Adding Up the US-Indonesia Economic Relationship

9th
Another relatively new industry, the
ICT sector is at the bottom of the
rankings due to the relatively small US
company presence in the sector, which
is dominated by the large domestic
telecommunications companies, as
well as slow historical growth and a
contraction in 2015. The presence of
US companies in the sector is also
low, at just 3.4 percent, limiting the
scope for total US company economic
activities. Overall, this indicates good
growth potential, not only for the
sector but also for US companies, as
the non-telecommunications portions
of the sector develop.
ICT
06Getting to a Best–Case Scenario
What Is Holding Indonesia Back?
It can be tempting at times to wonder
why optimal progress toward growth,
prosperity and equality seems to
be so hard to achieve in Indonesia.
Indonesia is well-endowed in many
ways, yet it has struggled to unleash
rapid economic progress and social
empowerment—at least since the
start of the Reformasi era. This may
have its roots in the command-and-
control economy of the Soeharto era
that was established in the wake of
economic collapse in the 1960s. This
focus on control is still alive in today’s
government bureaucracy.
This has become further complicated
in recent years by an apparent
yearning to become self-sufficient
without relying on international trade
or investment. Despite the welcome
efforts made by President Widodo
to encourage investment, there
is a strong perception that many
Indonesians—both in the elite and the
broader population—see foreign direct
investment (FDI) as something of an
embarrassment. When times are bad it
may be tolerated, but when times are
good then maybe it could be done away
with completely. Even the Investment
Coordinating Board (BKPM), which
has been tasked in recent years with
making international investment easier,
was originally established as part of
the broader command-and-control
system to limit FDI, as opposed to
enabling it. In light of this, its new
role of investment facilitator has been
challenging for BKPM, although it has
taken the transition seriously.
Over the course of the five
governments that have come and gone
since Reformasi in 1998, Indonesia
has become increasingly inward-
looking. As a consequence, the space
that had previously been created for
foreign private sector businesses has
narrowed. A sense of complacency was
also apparent after Indonesia avoided
the direct impact of the global financial
crisis in 2009-11, protected as it was
by the commodities boom. Bureaucrats
could claim that restrictive policies
were having the desired effect, but in
reality the collapse in commodity prices
and the economic slowdown in China
left Indonesia in the doldrums.
It has become quite clear that the
over-dependence on commodities
since 1998 has come at the heavy price
of deindustrialization and contraction
of the once-powerful manufacturing
sector. Today these policies, many of
which are still being adhered to, have
2 7US–Indonesia Investment Report 2016 Executive Summary

allowed other more open economies
in the region, such as Vietnam, India
and the Philippines, to power ahead
of Indonesia. While some senior
technocrats make the case for greater
participation in the global economy—
an idea backed by President Widodo
with orders to streamline regulations—
the reality is that many career
bureaucrats have been resisting the
directives as they continue to pursue
regulatory complexity.
While AmCham Indonesia and the
U.S. Chamber of Commerce are
mostly focused on issues that directly
challenge our members in their
respective sectors, we also view this
broader context with concern. In the
nine sector chapters of this investment
report, we dwell on specifics but we
also wish to offer some ideas—inspired
by the President’s own rhetoric—for
continuing to shift the country away
from protectionism and policies that
discourage private sector investment.
We believe these ideas would help the
Indonesian people and that if these
shifts take root in the next year or two,
it is quite possible to reach President
Widodo’s goal of 7 percent GDP
growth in 2019. This could also grow
the size of the economic relationship
between Indonesia and the US to
$131.7 billion by that year, a potential
46 percent increase on its 2014 level.
That should certainly be a goal worth
striving for.
While some senior technocrats make the case for greater participation in the global economy—an idea backed by President Widodo with orders to streamline regulations—the reality is that many career bureaucrats have been resisting the directives.2 8 Vital & Growing: Adding Up the US-Indonesia Economic Relationship

Ideas for a 21st Century
Global Economy
In interviews with senior executives
of major US companies operating
in Indonesia, we have put together
a short list of themes that resonate
across sectors and that might be useful
in helping Indonesia move toward
becoming a truly 21st century global
economy that embraces trade and
investment and feels confident enough
to become a competitive player in the
global economic system.
Achieving a best-case scenario Innovation
We frequently hear that Indonesia must become more innovative. Clearly, in a
world that is changing rapidly, in both creative and disruptive ways, Indonesia
needs to embrace change if it is to avoid falling behind its peers. In Indonesia,
however, (and not only in Indonesia) there are strong forces resisting innovation,
as it threatens established controls Not only do controls need to be loosened,
but perhaps more importantly a vital ingredient for innovation is the opportunity
to fail. Failure is an inseparable part of innovation and many, if not most, initial
attempts at innovation result in failure. For innovation to take root across
the business environment and society, failure and acceptance of risk must be
accepted as part of this process.
Ownership and equity
One facet of the protectionist environment in Indonesia has long been an
overemphasis on ownership and equity. Instead of focusing on performance and
excellence, artificial limits have been placed on ownership through equity shares.
The result is often an uncomfortable mix of “partners” and hesitation among
foreign investors who feel uneasy about being limited to holding a minority stake
in their businesses. The recent revision of the Negative Investment List (DNI)
partially addressed this in a few sectors but huge potential could be unleashed by
allowing the best and the most capable investors—regardless of whether they are
foreign or local—to prove their worth by lifting restrictions on ownership. As long
as companies follow the law, pay their taxes and create employment, generating
wealth along the way, ownership percentages should be of secondary concern.
Regulations: Control or enable?
Excessive control can be stifling for innovation and investment. The government
bureaucracy seems designed to exert control, often unnecessarily, and this
has become a justification for government itself. This is in stark contrast to
facilitating an enabling environment in which businesses, both local and foreign,
can thrive and prosper. BKPM is a good example of change. It has moved from
being an instrument for restricting and controlling investment to becoming a
modern government agency focused on enabling business. Following this model,
regulations should be seen as enabling tools, not restrictive barriers that may
benefit a few to the detriment of the majority.
Incentives
We often hear from senior executives about the need for greater incentives in
Indonesia to stimulate better performance and greater efficiency. In some sectors,
increased incentives would help reverse a continuous erosion of the economic
attractiveness of projects and significantly increase investment. The private
sector is well acquainted with incentives—indeed they are widely used internally
by companies to encourage better performance—but they need to be applied
across an even wider range of activities, especially in the interaction between
government and business. Applied correctly and with care, the right incentives
could have the same transformational impact on government and investment as
they have had in the private sector.
2 9US–Indonesia Investment Report 2016 Executive Summary

Let business decide
Executives frequently raise concerns about government regulators interfering
in what are essentially management and business decisions. We mention above
the question of ownership limits as an example, but often just as debilitating are
restrictions placed on hiring expatriates, including limiting the age of expatriate
workers regardless of their competence. Hiring decisions should be made by
companies themselves with the full understanding that employing expatriates is
expensive and is often done as a last resort when local talent cannot be found.
Frequently, expatriates create jobs and bring much needed revenue into the
country. Government should not try to micromanage corporate hiring, and in
an enabling environment for business, it would focus instead on monitoring
compliance with necessary regulations and imposing sanctions, if needed.
Actions that could transform the economy
Based on the themes we have articulated above, we have come up with four
possible actions that could unleash great economic potential if implemented.
Some of them would be immensely challenging politically, while others would
serve to strength what is already taking place but has yet to be fully optimized.
Abolish the DNI
The Negative Investment List (DNI)
is an outdated throwback. It has been
humorously referred to by a former
minister of trade as the “Import
Encouragement List” because, by
discouraging investment through
limiting equity ownership, it simply
forces companies to make products
abroad that could be made more
cheaply in Indonesia—products that
are then imported instead. It would
take a brave politician to propose it,
but the DNI should be abolished.
Bureaucratic reform
This is a daunting and far-reaching
challenge that governments have
chosen to avoid. For instance,
there is an urgent need to improve
the efficiency and transparency of
government permitting and approvals.
But the government bureaucracy
remains largely unreformed and is
not well-suited to the tasks required
by a modernizing, rapidly changing
and globally connected business
environment. There is often antipathy
and suspicion toward the private
sector, especially the foreign private
sector, and excessive regulation is seen
as a means of promoting anti-business
policies and cementing bureaucratic
power. Overhauling personnel,
imposing accountability and changing
incentive structures are prerequisites
for achieving higher levels of
professionalism. The bureaucracy is
a vital cog in the wheel of economic
performance and efficiency, and all
the regulatory improvements in the
world are unlikely to have much impact
without a professional and dynamic
interface between the government
and the real sector. One step would be
to use early retirement to create new
space for the hiring of young university
graduates as has already been done
in some ministries under the current
government. This is a way to build new
attitudes from the ground up.
Collaboration and open
communications
Time and again, we hear a similar
message: foreign companies
want deeper collaboration with
the government. Instead of being
controlled from a distance by ministry
officials, companies want to work in
partnership with government to find
win-win solutions. Often, regulations
are introduced with seemingly
little thought given to possible
negative consequences. Business
can help by being consulted early
in the process instead of just being
informed that changes are coming.
A flexible enabling government
that wants growth, investment and
employment can work with senior
executives in the private sector to
3 0 Vital & Growing: Adding Up the US-Indonesia Economic Relationship
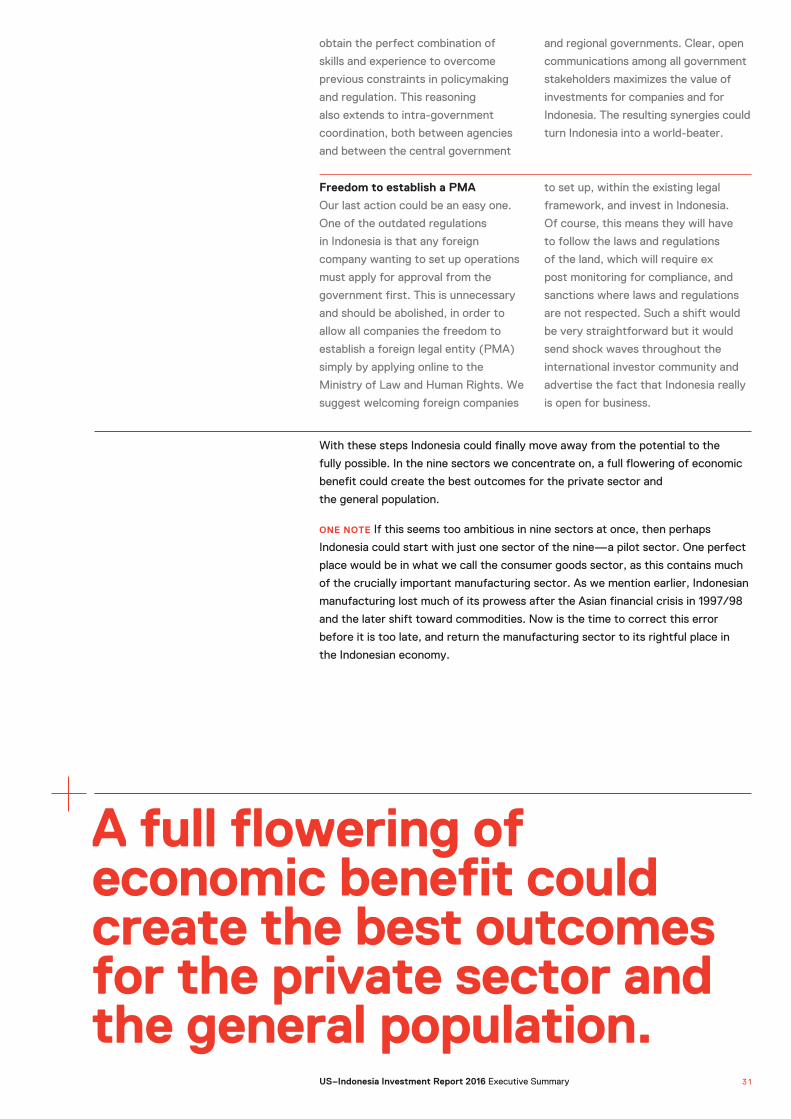
Freedom to establish a PMA
Our last action could be an easy one.
One of the outdated regulations
in Indonesia is that any foreign
company wanting to set up operations
must apply for approval from the
government first. This is unnecessary
and should be abolished, in order to
allow all companies the freedom to
establish a foreign legal entity (PMA)
simply by applying online to the
Ministry of Law and Human Rights. We
suggest welcoming foreign companies
to set up, within the existing legal
framework, and invest in Indonesia.
Of course, this means they will have
to follow the laws and regulations
of the land, which will require ex
post monitoring for compliance, and
sanctions where laws and regulations
are not respected. Such a shift would
be very straightforward but it would
send shock waves throughout the
international investor community and
advertise the fact that Indonesia really
is open for business.
With these steps Indonesia could finally move away from the potential to the
fully possible. In the nine sectors we concentrate on, a full flowering of economic
benefit could create the best outcomes for the private sector and
the general population.
ONE NOTE If this seems too ambitious in nine sectors at once, then perhaps
Indonesia could start with just one sector of the nine—a pilot sector. One perfect
place would be in what we call the consumer goods sector, as this contains much
of the crucially important manufacturing sector. As we mention earlier, Indonesian
manufacturing lost much of its prowess after the Asian financial crisis in 1997/98
and the later shift toward commodities. Now is the time to correct this error
before it is too late, and return the manufacturing sector to its rightful place in
the Indonesian economy.
A full flowering of economic benefit could create the best outcomes for the private sector and the general population.
obtain the perfect combination of
skills and experience to overcome
previous constraints in policymaking
and regulation. This reasoning
also extends to intra-government
coordination, both between agencies
and between the central government
and regional governments. Clear, open
communications among all government
stakeholders maximizes the value of
investments for companies and for
Indonesia. The resulting synergies could
turn Indonesia into a world-beater.
3 1US–Indonesia Investment Report 2016 Executive Summary

This investment report lays out the size
and importance of the Indonesia-US
economic relationship in a way that
has never been done before. We show
that, at $90.1 billion in 2014, it is far
more important than simply looking at
FDI flowing from the US to Indonesia,
especially if looking at the data. The
relationship is hugely important, not
only to the US, but particularly to
Indonesia, as it accounts for more than
10 percent of Indonesia’s GDP. With
the suggestions and actions made both
here in this Executive Summary and
in the main report, the Indonesia-US
economic relationship will
certainly grow.
For the first time in several years,
we see encouraging signs that the
government is embracing greater
openness. In this report we suggest
that a fundamental change in the
mindset of controlling foreign
private sector investors is needed,
and that such a shift must be
reflected throughout the government
administration—not just by a handful
of senior government ministers.
The more daring the reforms, the
greater will be economic growth, with
the hope being that it can result in
President Widodo’s goal of 7 percent
GDP growth being achieved by 2019.
This could increase the Indonesian-
US economic relationship to $131.7
billion in five years. This will be a tough
challenge to meet, but the US private
sector companies in Indonesia, and
those on the verge of investing, stand
ready to work in partnership with the
government and people of Indonesia to
make it happen.
07The Big Number & Our Conclusions
3 2 Vital & Growing: Adding Up the US-Indonesia Economic Relationship3 2 Vital & Growing: Adding Up the US-Indonesia Economic Relationship

The more daring the reforms, the greater will be the growth, with the hope being that it can result in President Widodo’s goal of 7 percent GDP growth by 2019.
3 3US–Indonesia Investment Report 2016 Executive Summary 3 3Amcham Indonesia Investment Report Executive Summary

IUS–Indonesia Investment Report 2016 Executive Summary
Investment ReportExecutive SummarySeptember 2016
Penting & Bertumbuh: Memperdalam Hubungan Ekonomi
Amerika Serikat – Indonesia

I I Vital & Growing: Adding Up the US-Indonesia Economic Relationship
Sampul depan yang menarik dari laporan ini menampilkan Elang Jawa dan Elang Botak yang saling bertautan. Elang Jawa mewakili Indonesia, sedangkan Elang Botak mewakili Amerika Serikat. Pertautan dua fauna nasional tersebut menggambarkan kolaborasi dan hubungan bersahabat antar kedua negara.

Amcham Indonesia & The U.S. Chamber of Commerce, 2016
© copyright reserved
PENULIS
PERISET UTAMA
EDITOR
ASSOCIATE EDITORS
The US-Indonesia Investment
Report 2016
Layanan database disediakan oleh
CEIC Data Company, Jakarta
Peter Milne
Muhammad Abduh
A. Lin Neumann
Sarah Howe
Arian Ardie
John Goyer
Mary Silaban
Penting & Bertumbuh: Memperdalam Hubungan Ekonomi Amerika Serikat – Indonesia Ringkasan Eksekutif
111

Tahun 2016 menandai tahun ke
empat “US Indonesia Investment
Initiative” yang merupakan kolaborasi
antara AmCham Indonesia dan U.S
Chamber of Commerce (USCC) di
Washington, DC. Selama tahun 2016,
perusahaan-perusahaan yang terlibat
aktif di Inisiatif ini bekerja sama
dengan pemerintah Indonesia dan
pimpinan perusahaan, mencari cara
untuk memperbaiki iklim investasi dan
mendapatkan pertumbuhan ekonomi
yang lebih tinggi yang merupakan
keinginan bersama.
Pertemuan tahunan “US Indonesia
Investment Summit” merupakan
milestone penting dimana perwakilan
pemerintah Indonesia dan pimpinan
perusahaan Amerika bertemu dan
bertukar pikiran secara konstruktif.
Sebagai bagian dari kegiatan ini, kami
juga menerbitkan laporan investasi
(Investment Report). Laporan pertama
kami yang diterbitkan tahun 2013
menunjukkan nilai akurat investasi
Amerika di Indonesia. Tahun ini, laporan
ke empat kami berjudul “Penting dan
Bertumbuh: Memperdalam Hubungan
Ekonomi Amerika Serikat – Indonesia,”
(Vital & Growing: Adding up the US-
Indonesia Economic Relationship)
mengambil pendekatan baru,
menghitung nilai keseluruhan kerjasama
ekonomi Indonesia – Amerika. “Angka
besar” yang kami temukan mungkin
akan menjadi kejutan bagi banyak
orang. Laporan ini juga memfokuskan
kepada hal-hal yang diperlukan untuk
menjaga dan membuka iklim usaha
yang lebih baik.
Kami ingin mengucapkan terimakasih
kepada para mitra Indonesia kami.
Kamar Dagang Indonesia (KADIN)
dan Asosiasi Pengusaha Indonesia
(APINDO) adalah mitra swasta kami
yang sangat penting, dimana mereka
telah memberikan konsultasi, dukungan
dan arahan secara terus menerus.
Institusi lain yang bekerja sama
dengan kami adalah Badan Koordinasi
Penanaman Modal (BKPM) yang telah
menjadi mitra sponsor dari pertemuan-
pertemuan kami sejak awal. Kami
sangat menghargai interaksi dengan
BKPM dan berharap lebih banyak
kerjasama dan aktivitas ke depan.
Laporan ini tidak akan bisa tercapai
apabila tidak ada kerja keras dari
para staf AmCham Indonesia dan U.S
Chamber of Commerce. Konsultan
kami Arian Ardie telah memberikan
saran yang sangat berharga dan
bekerja keras sepanjang tahun untuk
Inisiatif dan Laporan yang kami
kerjakan. Kami juga sangat berterima
kasih kepada semua perusahaan-
perusahaan yang telah mendukung
US Indonesia Investment Initiative,
meluangkan waktu untuk bertemu
untuk menyempurnakan data serta
berbagi wawasan dan rekomendasi.
Sebagai penutup, kami ingin
memberikan terima kasih yang
sedalam-dalamnya untuk para
penulis dari laporan ini, Peter Milne
dan Muhammad Abduh. Peter telah
menyusun dan menulis laporan ini
sedangkan Abduh menggali lebih
dalam data-data yang diperlukan untuk
mendapatkan nilai besar kerjasama
ekonomi Indonesia Amerika yang
merupakan temuan baru.
Pendahuluan
2 Penting & Bertumbuh: Memperdalam Hubungan Ekonomi Amerika Serikat – Indonesia 2
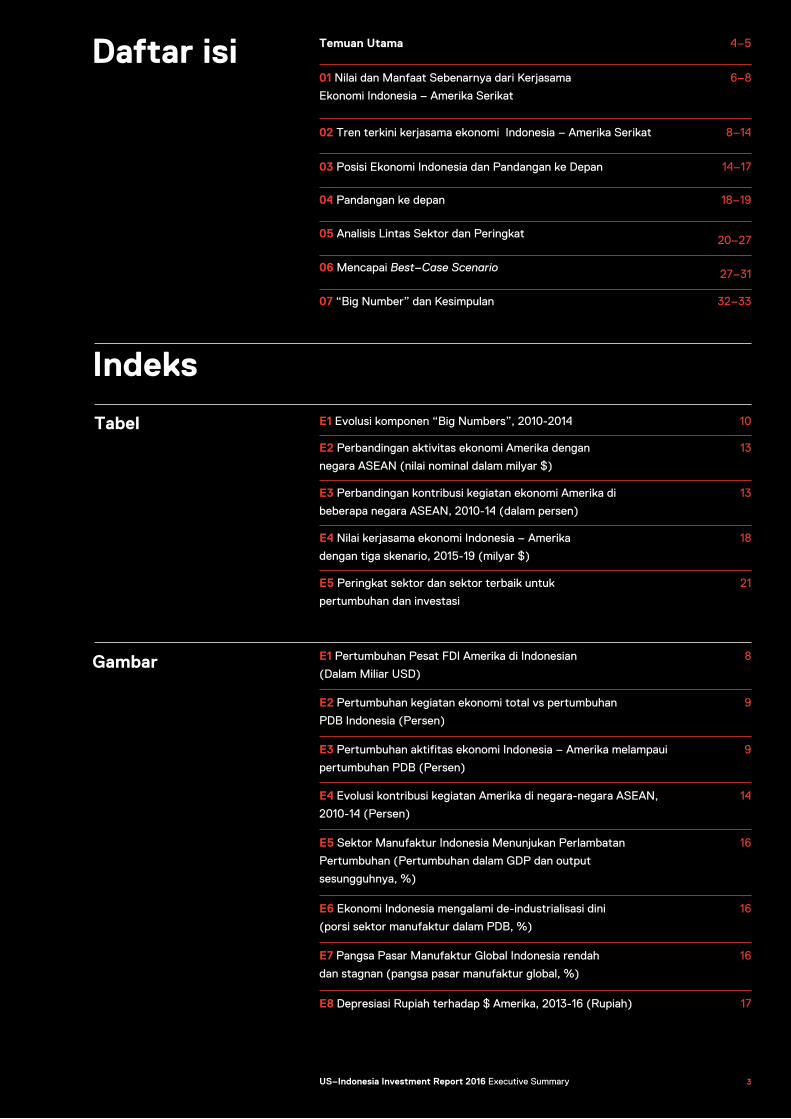
Daftar isi
Indeks
4–5
10
8
9
9
14
16
16
16
17
13
13
18
21
Tabel
Gambar
6–8
8–14
14–17
18–19
20–27
27–31
32–33
Temuan Utama
E1 Evolusi komponen “Big Numbers”, 2010-2014
E1 Pertumbuhan Pesat FDI Amerika di Indonesian
(Dalam Miliar USD)
E2 Pertumbuhan kegiatan ekonomi total vs pertumbuhan
PDB Indonesia (Persen)
E3 Pertumbuhan aktifitas ekonomi Indonesia – Amerika melampaui
pertumbuhan PDB (Persen)
E4 Evolusi kontribusi kegiatan Amerika di negara-negara ASEAN,
2010-14 (Persen)
E5 Sektor Manufaktur Indonesia Menunjukan Perlambatan
Pertumbuhan (Pertumbuhan dalam GDP dan output
sesungguhnya, %)
E6 Ekonomi Indonesia mengalami de-industrialisasi dini
(porsi sektor manufaktur dalam PDB, %)
E7 Pangsa Pasar Manufaktur Global Indonesia rendah
dan stagnan (pangsa pasar manufaktur global, %)
E8 Depresiasi Rupiah terhadap $ Amerika, 2013-16 (Rupiah)
E2 Perbandingan aktivitas ekonomi Amerika dengan
negara ASEAN (nilai nominal dalam milyar $)
E3 Perbandingan kontribusi kegiatan ekonomi Amerika di
beberapa negara ASEAN, 2010-14 (dalam persen)
E4 Nilai kerjasama ekonomi Indonesia – Amerika
dengan tiga skenario, 2015-19 (milyar $)
E5 Peringkat sektor dan sektor terbaik untuk
pertumbuhan dan investasi
01 Nilai dan Manfaat Sebenarnya dari Kerjasama
Ekonomi Indonesia – Amerika Serikat
02 Tren terkini kerjasama ekonomi Indonesia – Amerika Serikat
03 Posisi Ekonomi Indonesia dan Pandangan ke Depan
04 Pandangan ke depan
05 Analisis Lintas Sektor dan Peringkat
07 “Big Number” dan Kesimpulan
06 Mencapai Best–Case Scenario
3US–Indonesia Investment Report 2016 Executive Summary 3

Kepastian hukum. Kepastian hukum menjadi fondasi pertumbuhan ekonomi dan
bisnis. Investasi perusahaan Indonesia dan Amerika akan menciptakan lapangan
pekerjaan. Hal ini terjadi apabila ada kepastian hukum yang memberikan jaminan
kepada asas kesakralan kontrak (contract sanctity), penegakkan hukum dan
hukum yang tidak memihak (impartial judiciary).
Kolaborasi dan komunikasi. Unsur ini diperlukan untuk menciptakan iklim ekonomi
positif, membuat undang-undang serta peraturan yang rasional. Komunikasi
dengan pelaku usaha swasta berpengalaman dibutuhkan dalam setiap penyusunan
Temuan Utama
Berapa nilai total kerja sama ekonomi
Indonesia–Amerika Serikat?
AmCham Indonesia (AmCham) dan U.S
Chamber of Commerce (USCC) —
mitra dalam US-Indonesia Investment
Initiative (USIII) — sejak beberapa
tahun melakukan kajian investasi
langsung (foreign direct investment/
FDI) perusahaan-perusahaan Amerika
di Indonesia. Hasil kajian menunjukkan
nilai investasi yang fantastis yang
telah dan akan dilakukan oleh
perusahaan Amerika.
Pada tahun ini kami kembali melakukan
kajian yang lebih besar untuk
mengetahui berapa nilai total kerja
sama ekonomi Indonesia-Amerika.
Selain FDI, kami mengkaji komponen
perdagangan, penjualan domestik,
keuangan dan penerimaan negara.
Kelima komponen ini menghasilkan apa
yang kami sebut sebagai “Big Number”
atau “Nilai Besar” yang memang
menunjukkan besarnya dan pentingnya
nilai kerja sama ekonomi Indonesia-
Amerika Serikat.
+ Nilai kerja sama total
antara Indonesia–
Amerika Serikat adalah
US$ 90,1 miliar
pada 2014.
+ Nilai tersebut setara
dengan 10,1 persen
produk domestik bruto
(PDB) Indonesia 2014.
“The Big Number”
Jalan menuju skenario terbaik Pemerintah Indonesia dan Amerika
berperan penting mewujudkan
tercapainya skenario terbaik atau best-
case scenario. Selain faktor eksternal,
kebijakan dan langkah-langkah
yang diambil kedua negara sangat
mempengaruhi keberhasilan kerja
sama ekonomi ini.
Pemerintah Indonesia dapat melakukan
beberapa kebijakan untuk mewujudkan
tercapainya skenario tersebut.
Salah satunya adalah menjalankan
agenda reformasi ekonomi secara
terus-menerus.
+ Compound Annual
Growth Rate (CAGR)
atau laju pertumbuhan
majemuk tahunan kerja
sama ekonomi tumbuh
8,0 persen selama lima
tahun (2010-2015).
Sedangkan pada
periode yang sama PDB
Indonesia tumbuh 5,5
persen. Ini menunjukkan
kerja sama ekonomi
kedua negara menjadi
faktor penting dalam
pertumbuhan ekonomi
keseluruhan.
+ Penjualan dalam
negeri merupakan
komponen terbesar “Big
Number,” yaitu US$ 34,1
miliar, diikuti dengan
perdagangan bilateral
US$ 27,6 miliar, FDI US$
14,7 miliar, keuangan
US$ 11,8 miliar dan
penerimaan negara US$
1,8 miliar.
+ Dengan menggunakan
best-case scenario atau
skenario terbaik, total
nilai kerja sama ekonomi
kedua negara akan
naik menjadi US$ 131,7
miliar pada 2019 atau
meningkat 46,2 persen
dalam lima tahun.
4 Penting & Bertumbuh: Memperdalam Hubungan Ekonomi Amerika Serikat – Indonesia 4
Potensi Sektor Ekonomi
Sentimen perusahaan Amerika
Laporan ini membahas sembilan
sektor industri, ekstraktif dan jasa.
Kajian ini menunjukkan tahapan yang
berbeda-beda dari setiap sektor dan
beragam peran yang dimainkan oleh
perusahaan-perusahaan Amerika di
masing-masing sektor. Seberapa besar
kontrol pemerintah di masing-masing
sektor merupakan faktor penentu yang
penting yang mempengaruhi kinerja
industri saat ini dan masa depan.
Pemeringkatan industri dalam laporan
ini dilakukan berdasarkan peluang
keberhasilan atau prospek masa depan.
Sektor yang dinilai memiliki potensi
terbesar adalah ekonomi kreatif,
keuangan dan infrastruktur. Sektor-
sektor dimana perusahaan Amerika
memiliki keterlibatan signifikan dan
memiliki potensi pertumbuhan yang
setara dengan PDB Indonesia adalah
minyak & gas, produk konsumsi dan
pertanian. Kelompok terakhir yang
memiliki potensi paling rendah, yang
disebabkan oleh aturan-aturan yang
membatasi fleksibilitas operasional
perusahaan, adalah ekstraktif, farmasi/
kesehatan/life science dan Teknologi
Informasi dan Komunikasi (ICT).
Untuk mengetahui sentimen perusahaan Amerika yang melakukan kegiatan
usaha di Indonesia, kami melakukan proses wawancara dengan para eksekutif
perusahaan Amerika yang berada di Indonesia dan Amerika. Berikut adalah
beberapa poin dari hasil wawancara:
+ 25 persen menyatakan
paket kebijakan ekonomi
memberikan “beberapa
dampak” di sektor
tempat para eksekutif
bekerja, sedangkan
sisanya 75 persen
mengatakan “tidak
memberikan dampak”
atau “masih terlalu
dini untuk memberikan
penilaian”.
+ 87 persen merasakan
adanya “beberapa
perubahan” iklim
investasi di bawah
kepemimpinan Presiden
Joko Widodo.
+ 100 persen
menyatakan 12 paket
kebijakan ekonomi
memberikan “beberapa
dampak”
kebijakan ekonomi. Pelibatan pelaku usaha dalam pembuatan kebijakan
akan membantu Indonesia menjadi salah satu negara dengan perekonomian
terkuat di dunia.
Inovasi. Inovasi adalah salah satu cara agar Indonesia dapat mengikuti perubahan
perekonomian global yang sangat dinamis. Diperlukan insentif untuk merangsang
inovasi dan menumbuhkan jiwa inovasi. Dibutuhkan investasi-investasi di bidang
riset dan pengembangan, pemberian insentif resiko serta peningkatan kapasitas
sumber daya manusia.
Reformasi Birokrasi dan kebijakan. Pemerintah harus melakukan reformasi
birokrasi dan kebijakan secara konsisten di beberapa sektor. Seperti penghapusan
daftar negatif investasi (DNI), rasionalisasi proses izin kerja, penyederhanaan
proses perizinan di seluruh tingkat pemerintahan, reformasi pegawai pemerintahan
dan pemberian insentif yang tepat.
5US–Indonesia Investment Report 2016 Executive Summary 5

Berapakah nilai sebenarnya hubungan
kerja sama ekonomi Indonesia –
Amerika Serikat?
AmCham Indonesia (AmCham) dan U.S
Chamber of Commerce (USCC) telah
melakukan kajian sejak 2013 tentang
investasi langsung perusahaan Amerika
di Indonesia. Hasil kajian menunjukkan
angka fantastis.
Pada tahun ini, AmCham dan USCC
kembali melakukan kajian yang
lebih mendalam kerja sama
Indonesia-Amerika.
Kegiatan investasi langsung (FDI)
sering berubah dan dipengaruhi
banyak faktor. Kondisi ini
menyebabkan FDI sulit dijadikan
indikator pentingnya kerja sama
ekonomi Indonesia – Amerika.
Awal 2016, Amcham dan USCC
melakukan kajian kuantifikasi seluruh
kerja sama ekonomi Indonesia-Amerika
Serikat. Hasil kajian itu menghasilkan
apa yang kami sebut “The Big
Number” atau “Nilai Besar”, yang
memang menggambarkan besarnya
dan pentingnya kerja sama ekonomi
Indonesia–Amerika.
Kami berharap angka-angka yang
disajikan dalam kajian ini dapat menjadi
pengingat pentingnya hubungan
ekonomi kedua negara seiring dengan
harapan perusahaan-perusahaan
Amerika untuk meningkatkan
investasinya di Indonesia.
“The New Big Number”: Temuan
Baru Nilai Kerja Sama Ekonomi
Dalam kajian ini kami menggunakan
data-data selain FDI, seperti data
transaksi keuangan, penerimaan negara
dan perdagangan, untuk mendapatkan
angka total seluruh kerja sama dan
kegiatan ekonomi Indonesia–
Amerika Serikat.
Secara singkat, analisis dari berbagai
data kegiatan perekonomian kedua
negara menghasilkan angka sangat
besar; US$ 90,1 miliar pada 2014 atau
setara dengan 10,1 persen
PDB Indonesia.
Sebagai catatan, kajian ini
menggunakan data 2014 karena adanya
keterbatasan data tahun 2015.
Dalam ringkasan eksekutif ini,
dijelaskan mengenai metodologi yang
digunakan dalam melakukan analisis
dan upaya-upaya untuk meningkatkan
kerja sama kedua negara. Kami yakin
apabila kebijakan Presiden Joko
Widodo dijalankan untuk mengurangi
proteksi dan hambatan birokrasi serta
menciptakan iklim investasi yang
bersahabat, maka Indonesia akan
mengalami pertumbuhan ekonomi yang
pesat. Pertumbuhan ekonomi ini akan
menciptakan manfaat bagi
rakyat Indonesia.
Dengan skenario terbaik (best-case
scenario) total nilai kegiatan ekonomi
Indonesia-Amerika akan naik 46,2
persen dari US$ 90,1 miliar pada 2014
menjadi US$ 131,7 pada 2019. Untuk
mencapai angka ini, Indonesia harus
mengimplementasikan peraturan dan
kebijakan yang tepat.
01Nilai dan Manfaat Sebenarnya dari Kerjasama Ekonomi Indonesia – Amerika Serikat
Secara singkat, analisis yang dilakukan dengan menggunakan data berbagai macam aktivitas ekonomi kedua negara menghasilkan angka yang sangat besar; $90,1 miliar di tahun 2014 atau setara dengan 10,1% PDB Indonesia.6 Penting & Bertumbuh: Memperdalam Hubungan Ekonomi Amerika Serikat – Indonesia

Penjelasan mengenai Metodologi
Pada bagian ini kami akan menjelaskan
metodologi yang digunakan.
Metodologi lengkap dapat dilihat
dalam Annex 1.
Pada dasarnya, “Big Number” terdiri
dari lima komponen. Karena FDI hanya
merupakan salah satu komponen
penting dari keseluruhan kerja sama
ekonomi, maka kami memasukkan
komponen lain yang sama pentingnya
dengan FDI. Kelima komponen
tersebut adalah: (i) nilai perdagangan
Indonesia – Amerika Serikat, termasuk
kegiatan ekspor impor kedua negara,
(ii) pendanaan (financing) antara
Indonesia – Amerika Serikat, (iii) nilai
penjualan domestik oleh perusahaan
Amerika di Indonesia dan oleh
perusahaan Indonesia di Amerika,
(iv) penerimaan negara dari kegiatan
operasional perusahaan Amerika di
Indonesia (karena keterbatasan data,
data yang digunakan hanya data Pajak
Pertambahan Nilai), (v) realisasi FDI
perusahaan Amerika di Indonesia,1 dan
perusahaan Indonesia di Amerika.
Hasil kajian yang dilakukan
menunjukkan nilai keseluruhan kegiatan
ekonomi pada 2014 sebesar US$
90,1 miliar. Nilai ini kemudian kami
adaptasikan agar dapat dibandingkan
secara metodologi (methodologically
compatible) dengan PDB Indonesia.2
Hasil perhitungan menunjukkan bahwa
nilai kerja sama ekonomi Indonesia –
Amerika setara dengan 10,1 persen
PDB Indonesia pada 2014. Karena
adanya keterbatasan data 2014, untuk
komponen penjualan dan pendapatan
pemerintah, kajian ini menggunakan
data yang diekstrapolasi dari data
tahun 2013.
Lebih dari FDI
Laporan pertama AmCham Indonesia
dan USCC yang diterbitkan pada 2013
memfokuskan kepada FDI. Analisis
menunjukkan bahwa FDI Amerika di
Indonesia lebih besar dari angka yang
dipublikasikan. Secara konservatif
dapat disimpulkan bahwa FDI Amerika
di Indonesia mencapai US$ 65
miliar selama 2004-2012. Angka ini
lebih besar dari angka yang dikutip
pemerintah dan menempatkan Amerika
sebagai investor terbesar ke empat di
Indonesia (selama periode tersebut).
Bank Indonesia bahkan menggunakan
angka yang lebih kecil yaitu sekitar
US$ 7 miliar.
Temuan kami pada 2013 menunjukkan;
95 persen investasi langsung Amerika
di Indonesia di sektor minyak dan gas,
pertambangan dan manufaktur. Selain
perusahaan minyak dan pertambangan
yang menjadi investor terbesar,
investasi sektor manufaktur ikut
mencatat pertumbuhan pesat.
Saat ini dunia berada dalam situasi
yang berbeda. Indonesia, yang
sebelumnya mampu menghadapi
krisis keuangan global karena harga
komoditas yang tinggi, mulai mengalami
pelemahan sejak 2012 akibat penurunan
harga komoditas dan melemahnya
perekonomian Tiongkok. Pelemahan
nilai tukar rupiah yang turun 27 persen
sejak 2013 dan persepsi global tentang
risiko investasi di negara-negara
berkembang memperburuk situasi ini.
Pelemahan ekonomi global berimbas
kepada kegiatan investasi, khususnya
di sektor minyak dan pertambangan.
Perusahaan-perusahaan di sektor ini
melakukan pemotongan besar-besaran
rencana investasi dan eksplorasi.
Bahkan beberapa perusahaan tidak
melanjutkan investasinya dan keluar
dari Indonesia. Kondisi ini berdampak
kepada kegiatan investasi langsung
perusahaan-perusahaan Amerika
Serikat di Indonesia.
1 Definisi dari perusahaan Amerika di Indonesia: pengertian secara luas adalah perusahaan Amerika dengan kegiatan ekonomi di Indonesia. termasuk ke dalamnya adalah perusahaan-perusahaan yang dimiliki oleh induk perusahaan yang terdaftar di Indonesia, dengan alamat utama di Amerika. Termasuk dalam kategori ini adalah perusahaan-perusahaan dimana kantor operasional berada di luar negeri, namun anak perusahaan, afiliasi dan lisensi mereka melakukan kegiatan operasional di Indonesia.
2 Penjelasan mengenai metodologi dapat dilihat di Annex 1.
3 The American Chamber of Commerce in Indonesia (AmCham) dan US Chamber of Commerce (USCC) selama 3 tahun berturut-turut menerbitkan US – Indonesia Investment Report (2013-2015) dan laporan tahun ini.
7US–Indonesia Investment Report 2016 Executive Summary

Bila melihat FDI Amerika di Indonesia
pada situasi ekonomi yang mulai
membaik, jumlahnya tak lagi fantastis.
Menurut data US Department of
Commerce (USDC) pada 2014 (data
tahun terakhir yang tersedia), realisasi
FDI Amerika di Indonesia naik 20
persen menjadi US$ 13,5 miliar dari
US$ 11,3 miliar pada 2013.
Data Badan Koordinasi Penanaman
Modal (BKPM) menunjukkan angka
berbeda. Lembaga itu menyebutkan,
investasi Amerika berada diperingkat
ketujuh atau US$ 0,9 miliar pada 2015.
Peringkat teratas investasi asing di
Indonesia ditempati Singapura (US$
5,9 miliar) diurutan pertama, kemudian
Malaysia (US$ 3,1 miliar), Jepang (US$
2,9 miliar), Belanda (US$ 1,3 miliar)
dan Korea Selatan (US$ 1,2 miliar).4
FDI tidak selalu merupakan elemen
terbaik untuk mengukur nilai
sebenarnya dari kerja sama ekonomi.
Hal ini dikarenakan FDI dipengaruhi
kondisi ekonomi (Gambar E1). Fakta
ini yang kemudian mendorong kami
menemukan cara menghitung nilai
kerja sama ekonomi Indonesia-Amerika
Serikat dengan cara baru dan
mungkin unik.
Data realisasi investasi dari USDC
(Gambar E1) menunjukkan cerita yang
berbeda. Setelah mengalami penurunan
selama periode 2011-2013, realisasi FDI
di Indonesia naik secara signifikan
pada 2014.
Data USDC juga menunjukkan bahwa
Amerika Serikat, hingga saat ini,
masih merupakan investor terbesar di
Indonesia, tidak hanya pada 2014 tapi
juga tahun sebelumnya.
02Tren terkini kerjasama ekonomi Indonesia – Amerika Serikat
Setelah mendapatkan formula untuk
menghitung kerja sama ekonomi
Indonesia-Amerika Serikat, kami
juga dapat menghitung nilai dari
kegiatan ekonomi keseluruhan tahun
sebelumnya. Ini membantu kami dalam
memperkirakan tren secara berkala dan
membandingkan dengan pertumbuhan
PDB Indonesia dan untuk melihat
konstan atau tidaknya kontribusi FDI
Amerika ke PDB Indonesia setiap tahun.
Data USDC memperlihatkan nilai
nominal dari kegiatan ekonomi
Indonesia-Amerika meningkat pesat
sejak 2010 dengan ekuivalensi
sumbangan kepada PDB sebesar
8,8-10,1 persen.5 Kajian ini juga
membandingkan pertumbuhan tahunan
rata-rata kegiatan ekonomi dengan
pertumbuhan PDB Indonesia dalam
kurun waktu yang sama (Gambar E2).
Laju pertumbuhan majemuk tahunan
(CAGR) untuk kegiatan ekonomi total
antara kedua negara adalah 8,0 persen
untuk periode 2010-15 dan CAGR PDB
Indonesia adalah 5,5 persen.
Pertumbuhan pesat FDI Amerika di Indonesia, 2010-14 (dalam Miliar USD) SUMBER BUREAU OF ECONOMIC ANALYSIS (BEA),
US DEPARTMENT OF COMMERCE
GAMBAR E1
10,6 12,0 11,4 11,3 13,42010 2011 2012 2013 2014
14
13
12
11
10
4 Definisi investasi asing langsung Amerika menurut BKPM adalah kepemilikan atau kontrol, secara langsung maupun tidak langsung, oleh satu orang WN Amerika sebanyak 10 persen atau lebih dalam hal voting, apabila dalam bentuk korporasi atau dalam jumlah yang sama apabila bentuk usaha tersebut bukan merupakan korporasi.
5 Catatan: Tingkat pertumbuhan dalam “The Big Number” adalah dalam IDR
8 Penting & Bertumbuh: Memperdalam Hubungan Ekonomi Amerika Serikat – Indonesia

Pertumbuhan kegiatan ekonomi total vs pertumbuhan PDB Indonesia (Persen)SUMBER BEA, CEIC DAN IMF (CPIS), KALKULASI
STAFF AMCHAM INDONESIA.
Pertumbuhan aktivitas ekonomi Indonesia – Amerika melampaui pertumbuhan PDB (Persen)
GAMBAR E2
GAMBAR E3
Total Aktivitas
Ekonomi8,0
5,5 PDB
2010 2011 2012 2013 2014
18
16
14
12
10
8
6
4
2
0
–2–0,6
7,4 6,2 6,0
5,65,0
6,0
3,8
9,4
16,0
CATATAN NILAI KEGIATAN EKONOMI DIHITUNG
BERDASARKAN $, DAN PERTUMBUHAN PDB
BERDASARKAN IDR. DATA UNTUK KEGIATAN
EKONOMI MENGGUNAKAN DATA SAMPAI
DENGAN TAHUN 2014, SEDANGKAN DATA BPS
UNTUK PERTUMBUHAN PDB ADALAH SAMPAI
DENGAN TAHUN 2015.
SUMBER BEA, CEIC DAN IMF (CPIS)
DATA, DENGAN KALKULASI OLEH STAF
AMCHAM INDONESIA.
PERTUMBUHAN PDB
PERTUMBUHAN KEGIATAN EKONOMI
Meskipun terjadi penurunan investasi
dari 2011 ke 2012, kegiatan ekonomi
Indonesia – Amerika mengalami
kenaikan dan PDB Indonesia cenderung
tidak berubah (Tabel 3). Melihat skala
ukuran kerja sama Indonesia – Amerika,
kerja sama ini hanya dapat memberikan
dampak terbatas kepada kenaikan PDB
Indonesia. Setiap kenaikan 10 persen
kerja sama ekonomi kedua negara
akan meningkatkan satu persen
PDB Indonesia.
Setiap kenaikan 10 persen kerja sama ekonomi kedua negara akan meningkatkan satu persen PDB Indonesia.
9US–Indonesia Investment Report 2016 Executive Summary

Komponen “Big Numbers”
Bagian ini membahas bagaimana
kelima komponen “Big Numbers”
dibandingkan. Sebagai catatan, dalam
kajian ini data yang diestimasi untuk
komponen perdagangan domestik dan
penerimaan pemerintah keseluruhan
dengan melakukan ekstrapolasi data
2009-2013.
Evolusi komponen “Big Numbers”, 2010–2014 SUMBER BEA, CEIC DAN IMF (CPIS) DATA,
DENGAN KALKULASI OLEH STAF AMCHAM
INDONESIA.
TABEL E1
Penjualan total ($ miliar)
Penerimaan negara (PPN) ($ miliar)
FDI ($ miliar)
Keuangan ($ miliar)
Perdagangan ($ miliar)
Kegiatan ekonomi total($ miliar)
Kontribusi kegiatan ekonomi total kepada PDB (%)
2010 26,0 1,7 10,7 6,5 23,4 68,3 9,0
2011 30,8 1,8 12,2 9,2 26,5 80,5 9,0
2012 31,1 1,8 11,4 10,8 26,0 81,1 8,8
2013 31,2 1,7 12,4 10,5 28,0 83,8 9,2
2014 34,1 1,8 14,7 11,8 27,6 90,1 10,1
Komponen 1 Penjualan Domestik
Komponen 2 Perdagangan
Komponen 3 Keuangan
Dari kelima komponen, penjualan
domestik menyumbang angka terbesar
dari kerja sama kedua negara dengan
nilai US$ 34,1 miliar atau 37,9 persen
dari total kegiatan ekonomi pada 2014.
Komponen ini mencatat pertumbuhan
signifikan sebesar 57 persen sejak 2009
(US$ 21,7 miliar) dalam kurun waktu
lima tahun.
Angka ini menunjukkan perusahaan
Amerika memberikan sumbangan
dan ikut menikmati keuntungan dari
pertumbuhan penjualan domestik.
Melihat skala demografi Indonesia dan
pertumbuhan ekonomi berkelanjutan,
sektor penjualan domestik diperkirakan
akan tetap menjadi penggerak utama
kerja sama ekonomi Indonesia–Amerika
pada masa mendatang.
Perdagangan merupakan komponen
kedua terbesar dengan nilai US$27,6
miliar atau 30,7 persen dari total nilai
kerja sama ekonomi kedua negara.
Perdagangan dan penjualan domestik
menyumbang 68,6 persen dari nilai
total kerja sama ekonomi pada 2014.
Yang menarik, nilai perdagangan
Indonesia ke Amerika lebih besar
dibandingkan Amerika ke Indonesia.
Pada 2014, nilai impor Amerika dari
Indonesia tercatat sebesar US$ 8,3
miliar sedangkan nilai perdagangan
Indonesia ke Amerika mencapai US$
19,4 miliar atau lebih dari dua kali nilai
perdagangan Amerika ke Indonesia.
Data ini menunjukkan nilai perdagangan
tahunan Indonesia selalu lebih besar
dibandingkan dari ekspor Amerika
ke Indonesia. Yang perlu dicermati
ekspor terbesar Indonesia ke Amerika
adalah komoditas. Dalam kurun lima
tahun perdagangan Indonesia-Amerika
tumbuh sebesar 53 persen atau 10,6
persen per tahun.
Keuangan memberikan sumbangan
sebesar US$ 11,7 miliar atau 13,1 persen
dari nilai total kerja sama ekonomi
Indonesia-Amerika pada 2014. Komponen
ini kurang mendapat perhatian dalam
kerja sama kedua negara. Kondisi
ini diperkirakan karena sulitnya
mendapatkan data-data keuangan yang
tersebar di berbagai sektor.
Dari wawancara dengan lima bank
Amerika yang beroperasi di Indonesia,
kami mendapatkan gambaran
yang jelas. Dengan kekuatan dan
keahliannya, institusi-institusi tersebut
bersama-sama menyediakan instrumen
keuangan di Indonesia, seperti obligasi
dolar AS, sukuk semi pemerintah (quasi
sovereign bond) untuk BUMN dan
sektor swasta.
Selama dua tahun terakhir, 60-70
persen penerbitan obligasi dolar AS
melibatkan bank-bank Amerika di
1 0 Penting & Bertumbuh: Memperdalam Hubungan Ekonomi Amerika Serikat – Indonesia

Komponen 4 FDI
Indonesia. Penerbitan obligasi dolar AS
tersebut menghasilkan dana sebesar
US$ 25 miliar. Dalam kurun 2009-2014
pasar hutang dalam bentuk dolar AS
naik sebesar 86 persen atau 17
persen per tahun.
Bank-bank Amerika di Indonesia juga
tercatat sebagai pedagang ekuitas di
pasar saham Indonesia dan ikut terlibat
dalam aksi merger dan akuisisi (M&A).
FDI merupakan komponen keempat
dengan nilai total US$ 14,7 miliar atau
16,3 persen dari seluruh kerja sama
ekonomi Indonesia – Amerika pada
2014. FDI sering dianggap sebagai
ukuran kerja sama ekonomi. Hasil kajian
kami menunjukkan FDI menempati
urutan keempat dari seluruh
komponen kerja sama ekonomi.
Reformasi kebijakan investasi dapat
mendorong peningkatan FDI dan
komponen lainnya dalam kerja sama
ekonomi Indonesia-Amerika. Volatilitas
FDI terlihat dari penurunan nilai
investasi pada saat krisis global 2011-
2012. FDI juga menjadi satu-satunya
komponen yang mengalami penurunan
dibandingkan komponen lainnya.
Terlepas dari penurunan investasi
langsung, total FDI (termasuk FDI
Indonesia di Amerika) selama periode
2009-2014 naik sebesar 47 persen dari
US$ 10 miliar menjadi US$14,9 miliar,
atau naik 9,4 persen setiap tahun.
57“Dari kelima komponen, perdagangan domestik merupakan komponen terbesar, yaitu $34,1 miliar di tahun 2014 atau 37,9 persen dari total kegiatan ekonomi. Komponen ini mencatat pertumbuhan yang sangat besar sejak tahun 2009, dari $21,7 miliar atau naik 57 persen dalam kurun waktu 5 tahun.”
Komponen 5 Penerimaan Negara
Komponen ini memberikan kontribusi
terkecil dalam kerja sama ekonomi
kedua negara. Pada 2014, penerimaan
negara menyumbang US$ 1,8 miliar
atau hanya dua persen dari keseluruhan
kegiatan kerja sama ekonomi.
Sebagai catatan, rendahnya angka
penerimaan negara dari kerja sama
Indonesia-Amerika disebabkan
karena keterbatasan data. Data yang
digunakan bersumber dari data pajak
penghasilan (PPh). Data ini tidak
memasukkan data penerimaan negara
1 1US–Indonesia Investment Report 2016 Executive Summary

Selama bertahun-tahun perusahaan Amerika tercatat sebagai pembayar pajak terbesar di Indonesia, meskipun tidak selalu sebagai perusahaan terbesar
6 Produksi minyak & gas Indonesia tahun 2016 (barrel per hari): Chevron 251.000; ConocoPhillips 241.000 dan ExxonMobil 170.000. (Sumber: WoodMackenzie; SKK Migas) Sumber: BEA, CEIC
bukan pajak (PNBP) atau non-tax
revenue (NTR), termasuk royalti bahan
mentah dan cukai tembakau.
Meski hanya menggunakan data
PPH, namun kontribusi perusahaan
Amerika cukup signifikan, yaitu sebesar
13 persen dari total penerimaan
pemerintah sekitar US$ 13,24 miliar
pada 2014.
Selama bertahun-tahun perusahaan
Amerika tercatat sebagai penyumbang
penerimaan negara terbesar di
Indonesia, meskipun tidak selalu
sebagai perusahaan terbesar. Salah
satunya adalah PT Freeport Indonesia.
Perusahaan ini tercatat sebagai
pembayar pajak terbesar di Indonesia
sampai turunnya harga komoditas dunia
dan larangan ekspor bijih mineral.
Posisi sebagai pembayar pajak terbesar
kemudian diambil alih oleh PT HM
Sampoerna, yang juga merupakan
perusahaan Amerika. (catatan: posisi
sebagai penyumbang penerimaan
negara terbesar bukan berdasarkan
PPN, namun berasal dari PNBP
dalam bentuk cukai dan royalti yang
disetorkan ke pemerintah dan pajak
penerimaan perusahaan).
Penyumbang penerimaan negara
bukan pajak terbesar lainnya
adalah ExxonMobil, Chevron dan
ConocoPhillips yang bergerak di
sektor minyak dan gas bumi. Meskipun
penerimaan negara saat ini turun 43
persen6 akibat penurunan harga minyak
dunia, namun sektor minyak dan gas
bumi masih memegang peranan penting
dalam pembangunan daerah melalui
kegiatan sektor jasa penunjang lokal.
Sektor ini memberikan dampak ganda
dalam kegiatan perekonomian.
Indonesia merupakan negara dengan
bagi hasil produksi (production sharing)
minyak & gas kedua terbesar di dunia.
Berdasarkan data yang diperoleh,
diperkirakan Indonesia memperoleh
penerimaan sebesar US$ 4,7 miliar
pada 2014 dari sektor ini. Angka
ini akan meningkatkan pendapatan
pemerintah dari perusahaan Amerika
sebanyak 3,6 kali.
Sebagai perbandingan, pada 2009
ketika krisis ekonomi global mulai
terjadi, sumbangan kelima
komponen relatif sama dengan
sumbangan di 2014.
Nilai total kerja sama ekonomi tahun
2009 adalah US$57,4 miliar, naik
56,8 persen selama 2009-2014. Hal
yang berbeda adalah kontribusi sektor
keuangan pada 2014 sebesar 13,05
persen, naik dari 10,96 persen pada
2009. Rendahnya kontribusi sektor
ini diperkirakan akibat pengaruh krisis
ekonomi. Kontribusi komponen lainnya
pada 2009, adalah 37,83 persen dari
penjualan domestik, 31,41 persen
dari perdagangan total, 17,4 persen
total dari FDI dan 2,4 persen dari
penerimaan negara.
1 2 Penting & Bertumbuh: Memperdalam Hubungan Ekonomi Amerika Serikat – Indonesia

Perbandingan Regional
Dalam kajian ini, kami juga melakukan
perbandingan kerja sama ekonomi
Amerika dengan negara-negara di
ASEAN. Dengan menggunakan formula
yang sama dan data berbeda, diperoleh
nilai relatif kerja sama ekonomi Amerika
dan negara-negara ASEAN (Tabel E2).
Tabel E3 menunjukkan nilai nominal
yang dikonversikan ke dalam
persentase kontribusi ekonomi
terhadap PDB.
Gambar E4 menunjukkan kontribusi
yang berbeda-beda dari kegiatan
ekonomi Amerika Serikat- negara
ASEAN terhadap PDB dan perubahan
kontribusi setiap tahunnya. Sebagai
pembanding, kami mengambil Malaysia,
Thailand, Vietnam dan Filipina.
Perbandingan aktivitas ekonomi Amerika dengan negara ASEAN (nilai nominal dalam miliar $) CATATAN *DALAM DATA 2014, NILAI UNTUK
PENERIMAAN NEGARA DAN PENJUALAN DOMESTIC
DIESTIMASIKAN BERDASARKAN TREN CAGR
SUMBER BEA, CEIC DAN IMF (CPIS) DATA, DENGAN
KALKULASI OLEH STAF AMCHAM INDONESIA.
Perbandingan kontribusi kegiatan ekonomi Amerika di beberapa negara ASEAN, 2010–14 (dalam persen)CATATAN *DALAM DATA 2014, NILAI UNTUK
PENERIMAAN NEGARA DAN PENJUALAN DOMESTIC
DIESTIMASIKAN BERDASARKAN TREN CAGR
SUMBER BEA, CEIC DAN IMF (CPIS) DATA, DENGAN
KALKULASI OLEH STAF AMCHAM INDONESIA.
Evolusi kontribusi kegiatan Amerika di negara-negara ASEAN, 2010-14 (Persen)CATATAN* DALAM DATA 2014, NILAI UNTUK
PENERIMAAN NEGARA DAN PENJUALAN
DOMESTIK DIESTIMASIKAN BERDASARKAN
TREN CAGR
CATATAN **ANGKA 2015 ADALAH ESTIMASI
SUMBER BEA, CEIC DAN IMF (CPIS)
DATA, DENGAN KALKULASI OLEH STAF
AMCHAM INDONESIA.
TABEL E2
TABEL E3
GAMBAR E4
Thailand Vietnam Filipina Malaysia Indonesia
2010 96,5 22,6 40,3 106,8 68,3
2011 105,5 26,6 43,9 112,2 80,5
2012 113,8 29,3 43,7 105,5 81,1
2013 117,0 34,4 43,4 109,4 83,8
2014* 130,8 41,2 48,9 118,2 90,1
2015** 137,0 50,4 48,4 121,1 92,1
Thailand Vietnam Filipina Malaysia Indonesia
2010 27,93 19,50 19,61 40,10 9,03
2011 28,90 19,65 19,80 39,10 9,02
2012 28,58 18,80 16,98 33,21 8,83
2013 28,22 20,07 16,69 35,24 9,15
2014* 32,43 22,12 17,31 37,32 10,12
2010 2011 2012 2013 2014* 2015**
50
45
40
35
30
25
20
15
10
5
40,1
27,9
19,5
19,6
9,0 9,0 8,8 9,2 10,1 10,7
19,8
17,0 16,7 17,3 17,1
19,7 18,820,1
28,9 28,6 28,2
32,4
22,1
26,0
35,0
39,1
33,235,2
37,3
45,2
MALAYSIA
THAILAND
VIETNAM
FILIPINA
INDONESIA
1 3US–Indonesia Investment Report 2016 Executive Summary

Data tersebut memperlihatkan
posisi Indonesia berada di tengah
dibandingkan negara lain di ASEAN
yang melakukan kerja sama ekonomi
dengan Amerika. Posisi tengah juga
menunjukkan nilai kerja sama yang
dilakukan tidak terlalu kecil dan tidak
besar. Dengan kata lain bisa dikatakan
kerja sama yang dibangun relatif stabil
selama periode lima tahun.
Di ASEAN posisi Indonesia berada
setelah Malaysia dan Thailand.
Setelah Indonesia, ditempati Filipina
dan Vietnam yang memiliki nilai
terendah. Dalam kerja sama ini,
pertumbuhan ekonomi menjadi faktor
penting. Negara-negara lain dengan
nilai kerjasama yang lebih tinggi
mengindikasikan iklim investasi yang
lebih terbuka dan lebih menarik
bagi investor Amerika.
Peningkatan kontribusi dari aktivitas
ekonomi yang diikuti pertumbuhan
PDB menunjukkan adanya kerja sama
ekonomi saling menguntungkan. Hal ini
adalah menjadi target utama dari kerja
sama kedua negara.
03Posisi Ekonomi Indonesia & Pandangan ke Depan
Sejak 2012, Indonesia berusaha
menjaga tingkat pertumbuhan ekonomi
di tengah perlambatan perekonomian
dunia dan penurunan harga komoditas.
Penurunan harga komoditas menjadi
salah satu penyebab perlambatan
pertumbuhan PDB menjadi 4,8
persen. Terlepas dari perlambatan
ekonomi sejak 2012, Indonesia berhasil
mencatatkan pertumbuhan PDB per
kapita cukup signifikan dari US$ 560
pada 2000 menjadi US$ 3.630 pada
2014.
Kondisi perekonomian dunia dan
Indonesia yang masih melambat
berdampak kepada penyediaan
lapangan kerja. Kedepan, Indonesia
harus mampu beradaptasi dengan
kondisi perekonomian global,
memfasilitasi investasi dan
pengurangan biaya tinggi (cost of
doing business).
Stimulus fiskal yang diberikan
pemerintah dari hasil penghematan
subsidi bahan bakar minyak (BBM)
akan membantu menjaga pertumbuhan
ekonomi. Pencabutan subsidi bahan
bakar telah memberikan ruang kepada
pemerintah untuk menaikkan anggaran
belanja infrastruktur pada kuartal
pertama 2016. Pembangunan fisik
meningkat sepuluh kali lipat.
Masalahnya, peningkatan belanja
pemerintah saja belum mampu
mencapai target pertumbuhan diatas
lima persen. Salah satu cara untuk
menggenjot pertumbuhan adalah
dengan menarik investor swasta,
khususnya dari Amerika.
Kenaikan belanja pemerintah pada akhir
tahun mampu membantu pertumbuhan
ekonomi kuartal pertama 2015 sebesar
lima persen (year on year) setelah
selama tiga kuartal hanya tercatat 4,7
persen. Akan tetapi pada saat yang
bersamaan, konsumsi masyarakat
relatif tetap dan kegiatan ekspor-
impor mengalami penurunan. Kondisi
ini memberikan tantangan yang cukup
berat kepada sektor swasta.
Hal yang cukup mengkhawatirkan
adalah penurunan kinerja ekspor
produk manufaktur dan menjadi
penyumbang terbesar penurunan
neraca perdagangan sebesar 13,4
persen (year on year).
Penurunan FDI dan Upaya
Menjaga FDI
Tahun 2015 Indonesia juga mengalami
penurunan arus dana. Aliran modal
yang masuk ke Indonesia selama
2015 sebesar US$ 17,1 miliar dari
US$ 45 miliar pada 2014. Satu-
satunya instrumen yang membantu
mengimbangi aliran dana keluar adalah
investasi asing dalam bentuk obligasi
negara menjelang akhir 2015. Sebagian
besar dari investasi ini masuk melalui
bank investasi Amerika di Indonesia.
Penguatan rupiah dan menurunnya
inflasi mendorong Bank Indonesia
melonggarkan kebijakan moneter pada
Januari dengan melakukan pemotongan
1 4 Penting & Bertumbuh: Memperdalam Hubungan Ekonomi Amerika Serikat – Indonesia

suku bunga sebanyak dua kali masing-
masing 25 basis poin. Bank Indonesia
diperkiraan akan terus menerapkan
kebijakan kehati-hatian ditengah
volatilitas perekonomian global dan
kemungkinan naiknya suku bunga The
Fed yang akan menekan nilai
tukar Rupiah.
Ditengah situasi ekonomi saat ini, Bank
Dunia mematok target pertumbuhan
PDB 5,1 persen pada 2016 dan 5,3
persen pada 2017 dengan estimasi
adanya perubahan belanja sektor
swasta yang naik pada semester
kedua 2016.
Perbaikan ekonomi Indonesia sangat
bergantung kepada berbagai kebijakan
pemerintah untuk menarik investasi
swasta dan diversifikasi ekonomi untuk
mengurangi ketergantungan kepada
industri ekstraktif. Salah satu indikasi
positif adalah dikeluarkannya paket
deregulasi ekonomi I yang disusul
oleh beberapa paket kebijakan
ekonomi lainnya.
Paket Kebijakan Reformasi Ekonomi
12 paket kebijakan (sampai laporan ini
disajikan) merupakan langkah tepat
pemerintah untuk menarik investasi
swasta. Rincian mengenai setiap paket
dan bagaimana setiap paket membantu
mengatasi hambatan yang dialami
investor Amerika di Indonesia dibahas
dalam bagian laporan utama.
Dalam setiap paket kebijakan,
pemerintah berusaha mengatasi hal-hal
yang menghambat investasi. Meskipun
paket-paket kebijakan tersebut sangat
positif, namun belum dapat dipastikan
apakah akan membentuk suatu strategi
reformasi yang kuat dan jelas, yang
sangat diperlukan untuk
menarik investasi.
Salah satu paket kebijakan yang
dikeluarkan pemerintah adalah
revisi daftar negatif investasi (DNI).
Kebijakan ini memberikan peluang
investor asing untuk masuk ke sektor
ekonomi kreatif dan beberapa sektor
lain. Namun DNI masih membatasi
investasi asing di sekitar 600 sektor.
Jumlah itu merepresentasikan 70
persen ekonomi Indonesia.
Dari Komoditas ke Manufaktur
Melihat tren saat ini, Indonesia dan
perusahaan-perusahaan Amerika
sebaiknya mulai mengurangi
ketergantungan kepada sektor
komoditas. Selama periode 2002-2013,
Indonesia menikmati harga komoditas
tinggi di pasar dunia. Ketergantungan
kepada sektor komoditas memberikan
dampak kurang baik, yaitu
berkurangnya upaya pemerintah untuk
menjaga investasi di sektor manufaktur
karena sektor komoditas menawarkan
keuntungan yang besar tanpa
memberikan nilai tambah.
Dari sisi tenaga kerja, jumlah pekerja
Indonesia adalah setengah dari
seluruh jumlah pekerja di ASEAN.
Namun, dari sisi kinerja ekspor, total
ekspor Indonesia hanya 16 persen dari
total ekspor ASEAN. Data dari Bank
Dunia menunjukkan bahwa Indonesia
mengalami “deindustrialisasi dini” sejak
2002 ketika komoditas menggantikan
Melihat tren saat ini, Indonesia dan perusahaan-perusahaan Amerika sebaiknya mulai mengurangi ketergantungan kepada sektor komoditas. Selama periode 2002-2013, Indonesia menikmati harga komoditas tinggi di pasar dunia
1 5US–Indonesia Investment Report 2016 Executive Summary

Sektor manufaktur Indonesia menunjukkan perlambatan pertumbuhan (pertumbuhan dalam PDB dan output sesungguhnya, %)7
SUMBER KALKULASI STAFF BANK DUNIA
Ekonomi Indonesia mengalami deindustrialisasi dini (porsi sektor manufaktur dalam PDB persen)8 SUMBER UN-COMTRADE, KALKULASI STAF
BANK DUNIA
Pangsa pasar manufaktur global Indonesia rendah dan stagnan (Pangsa pasar manufaktur global, %)9
SUMBER UN-COMTRADE; KALKUKASI STAF
BANK DUNIA.
GAMBAR E5
GAMBAR E6
GAMBAR E7
16
14
12
10
8
6
4
2
0
40
35
30
25
20
15
10
20
18
16
14
12
10
8
6
4
2
0
2,5
2,0
1,5
1,0
0,5
0
0 5,000
1990
Malaysia
China
Indonesia
Vietnam
1995 2000 2005 2010 2015
10,000 20,00015,000 25,000
199
0
199
1
199
2
199
3
199
4
199
5
199
6
200
1
200
2
200
3
200
4
200
5
200
6
200
7
200
8
200
9
2010
2011
2012
2013
2014
Pasca krisis 1997/98
PDB per kapita, PPP (konstan 2011 dalam USD)
Sebelum krisis 1997/98
GDP
MANUFACTURING GROWTH
7 World Bank, 2016. Indonesian Economic Quarterly, June 2016. Resilience through reforms.
8 Ibid.
9 Ibid.
CHINA
THAILAND
INDONESIA
MALAYSIA
1990
1990
20052014
19902005
2014
20052014
1990
2005
2014
manufaktur sebagai ekspor terbesar
Indonesia sejak 2005.
Proses deindustrialisasi ini dinilai
terlalu cepat karena terjadi di tahap
awal siklus pertumbuhan ekonomi,
dibandingkan dengan negara-negara
lain di kawasan regional.
Pada saat Indonesia memberikan
atensi penuh dan khusus kepada sektor
komoditas, negara-negara lain di
kawasan regional yang tidak memiliki
potensi komoditas, gencar melakukan
ekspansi di pasar manufaktur dunia.
Seperti terlihat pada Gambar E7,
Indonesia sulit untuk meningkatkan
porsinya di pasar manufaktur
global. Negara-negara lain seperti
Tiongkok dan Malaysia menunjukkan
perkembangan industri manufaktur
yang sangat besar dan Vietnam berhasil
menggantikan posisi Indonesia di pasar
manufaktur internasional sejak 2010.
1 6 Penting & Bertumbuh: Memperdalam Hubungan Ekonomi Amerika Serikat – Indonesia

Ada beberapa hal yang menjadi
penghambat pertumbuhan sektor
manufaktur Indonesia. Pertama,
produktivitas tenaga kerja yang rendah,
meskipun upah tenaga kerja Indonesia
adalah yang terendah di kawasan
regional (dalam US$). Pada 2014, biaya
tenaga kerja per unit (unit labor cost)
di Indonesia lebih tinggi dibandingkan
Filipina dan Vietnam karena tingkat
produktivitas yang rendah. Malaysia
mencatat unit labor cost yang sedikit
lebih tinggi dari Indonesia meskipun
upah di Malaysia 7-8 kali lebih tinggi
dari Indonesia.
Kedua, efisiensi logistik yang
dibutuhkan untuk memenuhi kebutuhan
dalam negeri dan berkompetisi di pasar
internasional. Biaya logistik Indonesia
saat ini mencapai 24 persen PDB.
Angka ini lebih tinggi dari Thailand yang
hanya 16 persen dari PDB. Dengan
kata lain Indonesia menghabiskan biaya
sebesar US$ 70 miliar tiap tahun akibat
sistem logistik yang tidak efisien dan
mahal. Inefisiensi dan ketidakpastian
sistem logistik di Indonesia memaksa
perusahaan untuk menyimpan stok lebih
banyak yang berakibat kenaikan biaya.
Ketiga, prosedur dan perizinan
yang sangat rumit menyebabkan
keterlambatan pelaksanaan proyek-
proyek dan berujung peningkatan biaya
usaha. Menurut data Bank Dunia, selain
izin konstruksi, pembayaran pajak
dan pemaksaan kontrak di Indonesia
merupakan salah satu yang terburuk di
dunia (World Bank, 2016).
Dengan menurunnya harga komoditas,
sektor manufaktur mulai menarik untuk
investasi. Depresiasi Rupiah yang
cukup tajam sejak 2013 seharusnya
dapat membantu sektor manufaktur
Indonesia menjadi lebih kompetitif
(Gambar E8)
Paket kebijakan ekonomi pemerintah
menunjukkan perubahan fundamental
untuk memperbaiki iklim usaha
dan mengurangi peraturan yang
menghambat. Pemerintah Indonesia
juga menyatakan niat untuk bergabung
di Trans-Pacific Partnership (TPP).
Di tengah keterbukaan iklim usaha,
perusahaan Amerika siap untuk
berkontribusi membangun sektor
manufaktur. Perusahaan Amerika
juga ingin mengembalikan Indonesia
menjadi pemimpin sektor manufaktur di
kawasan regional.
Dengan menurunnya harga komoditas, sektor manufaktur mulai menarik untuk investasi. Depresiasi Rupiah yang cukup tajam sejak 2013 seharusnya dapat membantu sektor manufaktur Indonesia menjadi lebih kompetitif
Depresiasi Rupiah terhadap $ Amerika, 2013–16 (Rupiah)CATATAN NILAI TUKAR TAHUNAN IDR/$:
RP 10.452 (2013), RP 11.878 (2014), RP
13.392 (2015) DAN RP 13.414 (2016, JULI).
SUMBER BANK INDONESIA
GAMBAR E8
9.500
10.500
11.500
12.500
13.500
14.500
15.500
2013 2014 2015 2016
1 7US–Indonesia Investment Report 2016 Executive Summary
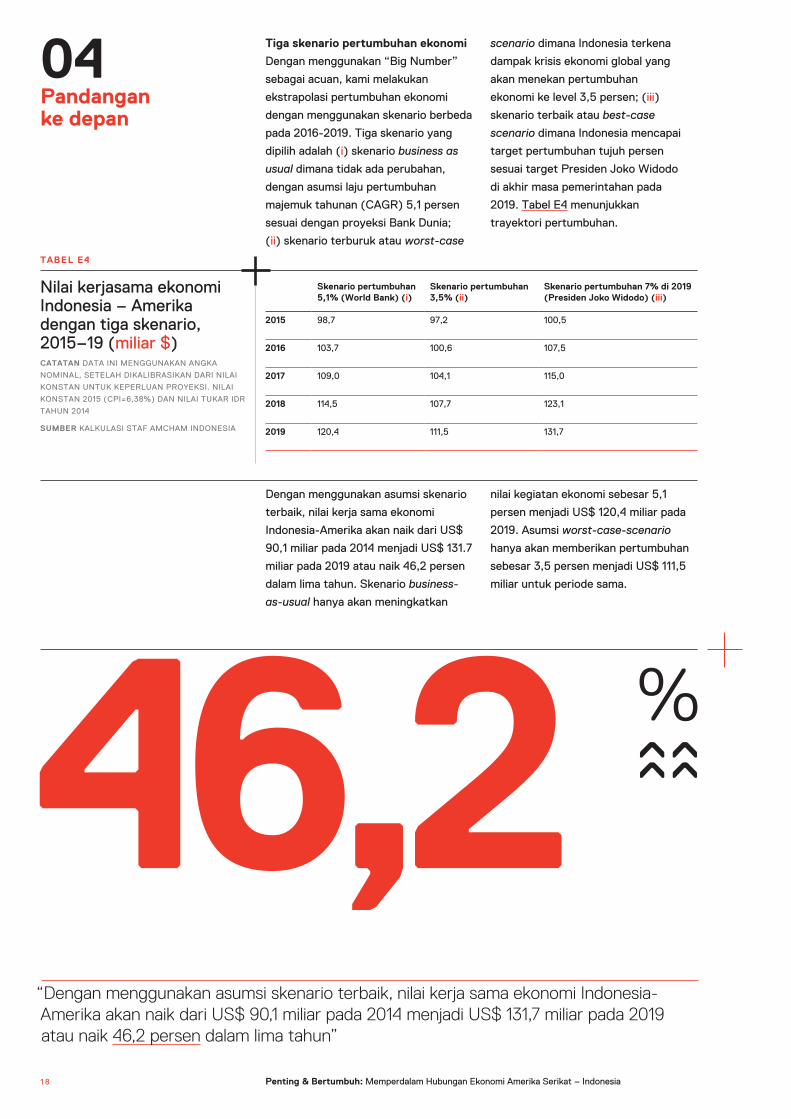
04Pandangan ke depan
Tiga skenario pertumbuhan ekonomi
Dengan menggunakan “Big Number”
sebagai acuan, kami melakukan
ekstrapolasi pertumbuhan ekonomi
dengan menggunakan skenario berbeda
pada 2016-2019. Tiga skenario yang
dipilih adalah (i) skenario business as
usual dimana tidak ada perubahan,
dengan asumsi laju pertumbuhan
majemuk tahunan (CAGR) 5,1 persen
sesuai dengan proyeksi Bank Dunia;
(ii) skenario terburuk atau worst-case
scenario dimana Indonesia terkena
dampak krisis ekonomi global yang
akan menekan pertumbuhan
ekonomi ke level 3,5 persen; (iii)
skenario terbaik atau best-case
scenario dimana Indonesia mencapai
target pertumbuhan tujuh persen
sesuai target Presiden Joko Widodo
di akhir masa pemerintahan pada
2019. Tabel E4 menunjukkan
trayektori pertumbuhan.
46,2
Nilai kerjasama ekonomi Indonesia – Amerika dengan tiga skenario, 2015–19 (miliar $) CATATAN DATA INI MENGGUNAKAN ANGKA
NOMINAL, SETELAH DIKALIBRASIKAN DARI NILAI
KONSTAN UNTUK KEPERLUAN PROYEKSI. NILAI
KONSTAN 2015 (CPI=6,38%) DAN NILAI TUKAR IDR
TAHUN 2014
SUMBER KALKULASI STAF AMCHAM INDONESIA
TABEL E4
Skenario pertumbuhan 5,1% (World Bank) (i)
Skenario pertumbuhan 3,5% (ii)
Skenario pertumbuhan 7% di 2019 (Presiden Joko Widodo) (iii)
2015 98,7 97,2 100,5
2016 103,7 100,6 107,5
2017 109,0 104,1 115,0
2018 114,5 107,7 123,1
2019 120,4 111,5 131,7
Dengan menggunakan asumsi skenario
terbaik, nilai kerja sama ekonomi
Indonesia-Amerika akan naik dari US$
90,1 miliar pada 2014 menjadi US$ 131.7
miliar pada 2019 atau naik 46,2 persen
dalam lima tahun. Skenario business-
as-usual hanya akan meningkatkan
nilai kegiatan ekonomi sebesar 5,1
persen menjadi US$ 120,4 miliar pada
2019. Asumsi worst-case-scenario
hanya akan memberikan pertumbuhan
sebesar 3,5 persen menjadi US$ 111,5
miliar untuk periode sama.
“Dengan menggunakan asumsi skenario terbaik, nilai kerja sama ekonomi Indonesia-Amerika akan naik dari US$ 90,1 miliar pada 2014 menjadi US$ 131,7 miliar pada 2019 atau naik 46,2 persen dalam lima tahun”
1 8 Penting & Bertumbuh: Memperdalam Hubungan Ekonomi Amerika Serikat – Indonesia

Survei Sentimen 2016
BOX E1
Untuk mengetahui sentimen
investasi perusahaan Amerika
yang beroperasi di Indonesia serta
karakteristik perusahaan, AmCham
Indonesia melakukan survei investasi
dan kuisioner data. Survei diikuti
perusahaan-perusahaan Amerika
berskala besar yang melakukan
kegiatan usaha di Indonesia.
Persepsi Perusahaan
Pertanyaan pertama yang diajukan
adalah, apakah perusahaan melihat
adanya perubahan iklim investasi
dalam dua tahun terakhir (sejak
dimulainya kepemimpinan Presiden
Joko Widodo). Sebanyak 87 persen
responden melihat terdapat beberapa
perbaikan. Bahkan seluruh responden
menjawab ada dampak positif kepada
dunia usaha setelah pemerintah
mengeluarkan 12 paket
kebijakan ekonomi.
Namun, responden memberikan
jawaban beragam ketika ditanya
apakah paket kebijakan ekonomi
memberikan dampak nyata.
Sebanyak 25 persen responden
menjawab “ada beberapa dampak”
dan sisanya, 75 persen, menjawab
“tidak ada dampak” atau “masih
terlalu dini untuk memberikan
penilaian”.
Kami juga menanyakan kepada
responden tentang area mana
saja yang memerlukan perbaikan
untuk membantu kelancaran usaha
di Indonesia. Hasilnya, 50 persen
responden menyatakan kepastian
hukum merupakan hal yang paling
penting, disusul oleh reformasi
regulasi sebanyak 37 persen dan
sisanya tentang kebutuhan untuk
melakukan reformasi kebijakan.
Hal kelima terpenting yang
memerlukan perhatian adalah
sumber daya manusia.
Pertanyaan terakhir kepada
responden tentang apakah
perusahaan merasa lebih positif
dibandingkan dua tahun lalu.
Sebanyak 50 persen menjawab “lebih
positif” sedangkan sisanya menjawab
“kurang positif” atau “tidak yakin”.
Perbaikan struktural dan prosedural
yang sedang berlangsung harus
terus menerus dilakukan untuk
menciptakan reformasi yang lebih
positif.
Karakteristik Perusahaan
Amerika di Indonesia
Nilai investasi rata-rata yang
dilakukan perusahaan Amerika
di Indonesia adalah US$ 3 miliar
dengan pendapatan sekitar US$ 1,9
miliar. Total gaji yang dibayarkan
perusahaan Amerika adalah US$ 83
juta. Total gaji dan kompensasi untuk
pegawai yang dibayarkan di Indonesia
pada 2015 sebesar US$ 344 juta.
Dalam studi ini, salah satu hal penting
untuk dicermati adalah komponen
penerimaan negara yang jumlahnya
lebih rendah dari angka sebenarnya.
Rata-rata pajak yang dibayarkan
perusahaan Amerika selama 2015
adalah, PPN sebesar US$ 171 juta,
penerimaan negara bukan pajak
(royalti dan cukai) US$ 2 miliar
dan pajak pendapatan perusahaan
sebesar US$ 105 miliar. Nilai yang
disetorkan untuk PPN US$685,2
juta, US$40 miliar untuk pendapatan
tidak kena pajak dan US$ 315,8 juta
untuk pajak pendapatan perusahaan.
Menarik untuk dicermati adalah
pendapatan negara bukan pajak yang
dibayarkan perusahaan Amerika
nilainya enam kali lipat dari PPN.
Mengingat bahwa kajian ini hanya
mengacu kepada nilai PPN, maka
dapat disimpulkan “Big Number”
dalam studi ini lebih rendah
setidaknya US$ 4,3 miliar.
Kedepan, perusahaan-perusahaan
Amerika di Indonesia yang ikut
dalam jejak pendapat ini berencana
melakukan investasi rata-rata
sebesar US$ 334 juta dalam lima
tahun ke depan. Rata-rata jumlah
tenaga kerja yang diserap 112.000
orang pada 2015 dan jumlah pekerja
asing kurang dari 100 orang atau
kurang 0,1 persen. Dengan demikian,
perusahaan Amerika yang beroperasi
di Indonesia memperkerjakan orang
Indonesia dan bukan asing.
Apa yang dapat dilakukan agar
Indonesia Indonesia dapat mencapai
nilai pertumbuhan terbesar melalui
best-case scenario? Skenario terbaik
ini akan memberikan kontribusi kepada
PDB Indonesia sebesar 9,5 persen
selama 2014-2019. Selama periode
tersebut nilai nominal dari kerja sama
ekonomi diperkirakan naik menjadi
US$ 131,7 miliar pada 2019.
Apabila ekonomi Indonesia tumbuh
berdasarkan asumsi ini, berarti nilai
kumulatif seluruh kegiatan ekonomi
Indonesia- Amerika dari 2009 hingga
2019 menjadi US$ 557,9 miliar. Tentu
saja nilai ini sangat besar.
1 9US–Indonesia Investment Report 2016 Executive Summary

05Analisis Lintas Sektor dan Peringkat
10 Kami melakukan pemeringkatan sektor dari 1-9, kemudian menambahkan peringkat masing-masing sektor untuk memperoleh skor 4-36. Hasil yang diperoleh kemudian dibagi 4 yang kemudian memberikan bobot yang sama untuk kriteria tersebut, menghasilkan urutan sektoral 1-9. Peringkat 1 adalah sektor dengan potensi pertumbuhan terbesar dan investasi untuk perusahaan Amerika dan peringkat 9 adalah sektor yang paling rendah. Dengan cara ini, kami berusaha untuk secara akurat menggambarkan, meskipun faktor subjektifitas tidak dapat dihindari, kondisi ekonomi Indonesia keseluruhan.
Dalam laporan utama yang disusun
sebagai bagian utama dari kajian ini,
kami menganalisis sifat, karakter
dan tantangan dari sembilan sektor
di ekonomi Indonesia. Sektor
tersebut adalah pertanian, barang
konsumsi, industri kreatif, ekstraktif
(pertambangan dan penggalian),
keuangan, informasi teknologi dan
komunikasi (ICT), minyak dan gas,
farmasi, kesehatan dan life science.
Untuk menganalisis sifat atau jenis
keterlibatan perusahaan Amerika pada
sembilan sektor dan prospek relatif dari
usaha tersebut, kami membuat suatu
metodologi pemeringkatan menurut
empat kriteria sebagai berikut:
Empat kriteria ini dipilih agar kami
dapat melakukan perbandingan antara
potensi investasi dan pertumbuhan di
sektor mana saja perusahaan Amerika
melakukan investasi. Ukuran absolut
dan besarnya kegiatan perusahaan
Amerika di sektor tersebut memberikan
gambaran akan pentingnya sektor
tersebut dan peluang investasi di
sektor yang sama.
CAGR (2010-14) memberikan
perspektif historikal pertumbuhan
di tiap sektor sedangkan tingkat
pertumbuhan 2014-2015 memberikan
informasi kondisi saat ini dan potensi
sektor-sektor tersebut.
Hasil kajian memperlihatkan tingkat
pertumbuhan yang berbeda dengan
angka yang diberikan pemerintah
karena dihitung berdasarkan nilai
rupiah yang dikonversikan ke dolar AS
sehingga merefleksikan devaluasi yang
terjadi dalam lima tahun terakhir. Inilah
nilai sebenarnya yang digunakan para
investor Amerika dalam menentukan
investasi dan tingkat pengembalian
dolar AS yang telah ditanamkan
di Indonesia.
Membuat perbandingan lintas
sektor bukan hal mudah. Sistem
pemeringkatan yang kami lakukan tidak
memasukkan faktor kebijakan dan iklim
regulasi. Hasil studi ini sangat subjektif.
1
2
3
4
Aktivitas ekonomi total perusahaan Amerika di masing-masing sektor
Kontribusi perusahaan Amerika di masing-masing sektor
Laju Pertumbuhan Majemuk Tahunan (CAGR) sektor tahun 2010–2014
Tingkat pertumbuhan year-on-year masing-masing sektor tahun 2014–201510
2 0 Penting & Bertumbuh: Memperdalam Hubungan Ekonomi Amerika Serikat – Indonesia
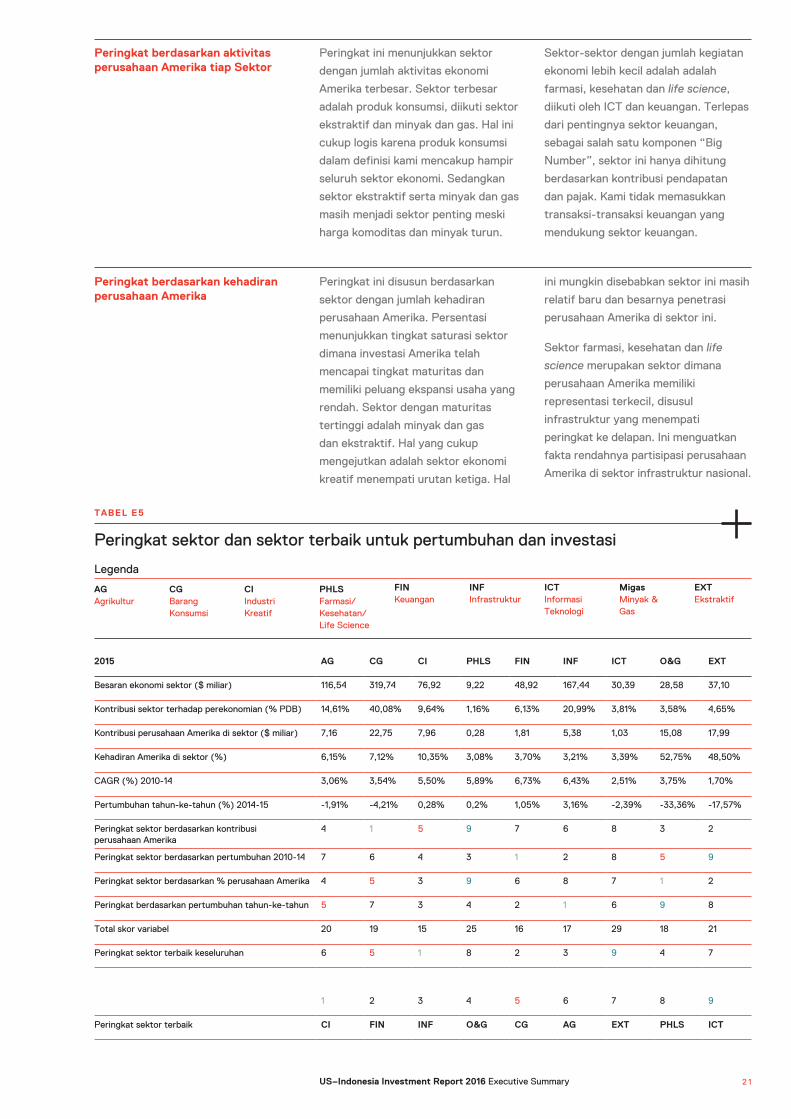
Peringkat berdasarkan aktivitas perusahaan Amerika tiap Sektor
Peringkat ini menunjukkan sektor
dengan jumlah aktivitas ekonomi
Amerika terbesar. Sektor terbesar
adalah produk konsumsi, diikuti sektor
ekstraktif dan minyak dan gas. Hal ini
cukup logis karena produk konsumsi
dalam definisi kami mencakup hampir
seluruh sektor ekonomi. Sedangkan
sektor ekstraktif serta minyak dan gas
masih menjadi sektor penting meski
harga komoditas dan minyak turun.
Sektor-sektor dengan jumlah kegiatan
ekonomi lebih kecil adalah adalah
farmasi, kesehatan dan life science,
diikuti oleh ICT dan keuangan. Terlepas
dari pentingnya sektor keuangan,
sebagai salah satu komponen “Big
Number”, sektor ini hanya dihitung
berdasarkan kontribusi pendapatan
dan pajak. Kami tidak memasukkan
transaksi-transaksi keuangan yang
mendukung sektor keuangan.
Peringkat berdasarkan kehadiran perusahaan Amerika
Peringkat ini disusun berdasarkan
sektor dengan jumlah kehadiran
perusahaan Amerika. Persentasi
menunjukkan tingkat saturasi sektor
dimana investasi Amerika telah
mencapai tingkat maturitas dan
memiliki peluang ekspansi usaha yang
rendah. Sektor dengan maturitas
tertinggi adalah minyak dan gas
dan ekstraktif. Hal yang cukup
mengejutkan adalah sektor ekonomi
kreatif menempati urutan ketiga. Hal
ini mungkin disebabkan sektor ini masih
relatif baru dan besarnya penetrasi
perusahaan Amerika di sektor ini.
Sektor farmasi, kesehatan dan life
science merupakan sektor dimana
perusahaan Amerika memiliki
representasi terkecil, disusul
infrastruktur yang menempati
peringkat ke delapan. Ini menguatkan
fakta rendahnya partisipasi perusahaan
Amerika di sektor infrastruktur nasional.
TABEL E5
2015 AG CG CI PHLS FIN INF ICT O&G EXT
Besaran ekonomi sektor ($ miliar) 116,54 319,74 76,92 9,22 48,92 167,44 30,39 28,58 37,10
Kontribusi sektor terhadap perekonomian (% PDB) 14,61% 40,08% 9,64% 1,16% 6,13% 20,99% 3,81% 3,58% 4,65%
Kontribusi perusahaan Amerika di sektor ($ miliar) 7,16 22,75 7,96 0,28 1,81 5,38 1,03 15,08 17,99
Kehadiran Amerika di sektor (%) 6,15% 7,12% 10,35% 3,08% 3,70% 3,21% 3,39% 52,75% 48,50%
CAGR (%) 2010-14 3,06% 3,54% 5,50% 5,89% 6,73% 6,43% 2,51% 3,75% 1,70%
Pertumbuhan tahun-ke-tahun (%) 2014-15 -1,91% -4,21% 0,28% 0,2% 1,05% 3,16% -2,39% -33,36% -17,57%
Peringkat sektor berdasarkan kontribusi perusahaan Amerika
4 1 5 9 7 6 8 3 2
Peringkat sektor berdasarkan pertumbuhan 2010-14 7 6 4 3 1 2 8 5 9
Peringkat sektor berdasarkan % perusahaan Amerika 4 5 3 9 6 8 7 1 2
Peringkat berdasarkan pertumbuhan tahun-ke-tahun 5 7 3 4 2 1 6 9 8
Total skor variabel 20 19 15 25 16 17 29 18 21
Peringkat sektor terbaik keseluruhan 6 5 1 8 2 3 9 4 7
1 2 3 4 5 6 7 8 9
Peringkat sektor terbaik CI FIN INF O&G CG AG EXT PHLS ICT
Peringkat sektor dan sektor terbaik untuk pertumbuhan dan investasi
AG Agrikultur
CG Barang Konsumsi
CI Industri Kreatif
PHLS Farmasi/ Kesehatan/ Life Science
FIN Keuangan
INF Infrastruktur
ICT Informasi Teknologi
Migas Minyak & Gas
EXT Ekstraktif
Legenda
2 1US–Indonesia Investment Report 2016 Executive Summary

Peringkat berdasarkan laju pertumbuhan
Peringkat berdasarkan Pertumbuhan Tahunan
Hasil penghitungan CAGR 2010-14
membantu mendapatkan gambaran
keberhasilan sektor industri dalam
beberapa tahun terakhir. Data tahun-
tahun sebelumnya menunjukkan
bahwa sektor dengan pertumbuhan
terbesar adalah sektor keuangan,
infrastruktur, kesehatan dan life
science, dan ekonomi kreatif. Sektor
minyak dan gas merupakan sektor
dengan pertumbuhan terendah. Hal
ini disebabkan oleh turunnya harga
komoditas, investasi dan produksi di
pasaran dunia.
Data laju pertumbuhan untuk 2014-
2015 merefleksikan status terkini
dari setiap sektor. Laju pertumbuhan
dipengaruhi oleh depresiasi rupiah,
yang mengalami penurunan sebesar
11 persen selama periode tersebut.
Selama 2015, sektor infrastruktur dan
keuangan mengalami pertumbuhan
tercepat dan sektor barang konsumsi
dan pertanian mengalami penekanan.
Sedangkan sektor ekstraktif dan
minyak dan gas masing-masing
mengalami penurunan dari periode
tahun sebelumnya (year on year)
sebesar minus 17,6 persen dan minus
33,4 persen.
Selama 2015, sektor infrastruktur dan keuangan mengalami pertumbuhan tercepat dan sektor barang konsumsi dan pertanian mengalami penekanan. Sedangkan sektor ekstraktif dan minyak dan gas masing-masing mengalami penurunan dari periode tahun sebelumnya (year on year) sebesar minus 17,6 persen dan minus 33,4 persen.2 2 Penting & Bertumbuh: Memperdalam Hubungan Ekonomi Amerika Serikat – Indonesia
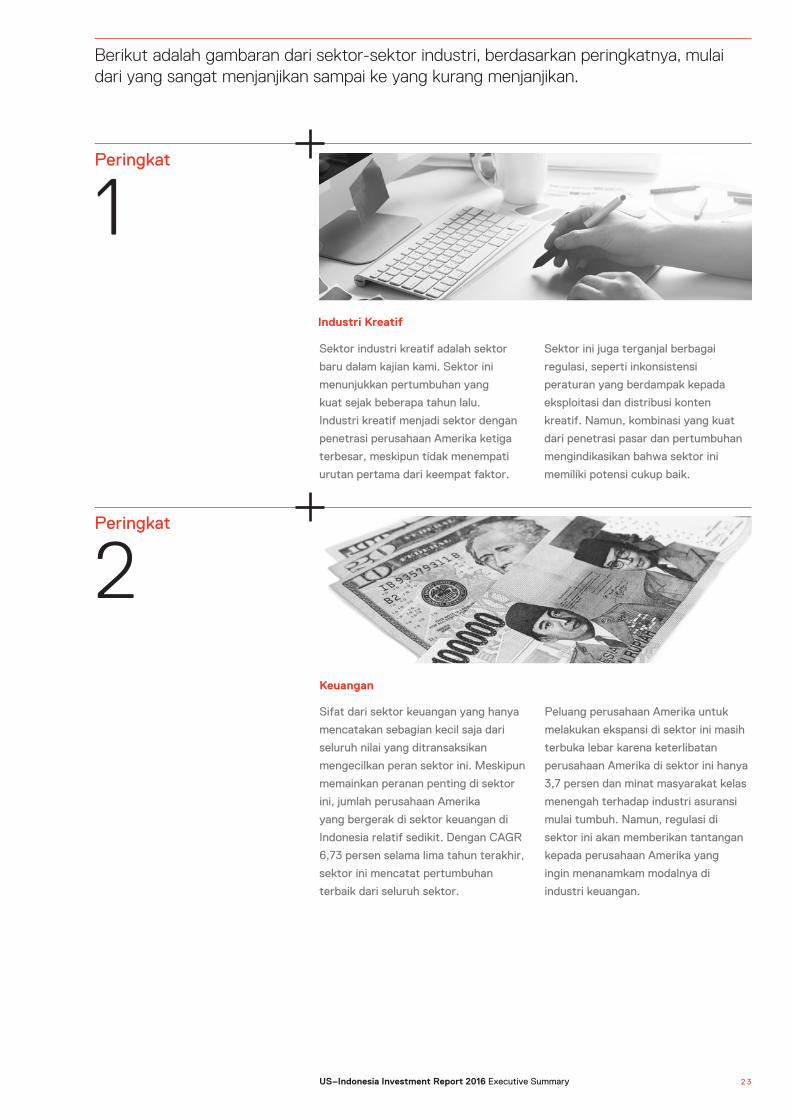
Peringkat
1
Peringkat
2
Sektor industri kreatif adalah sektor
baru dalam kajian kami. Sektor ini
menunjukkan pertumbuhan yang
kuat sejak beberapa tahun lalu.
Industri kreatif menjadi sektor dengan
penetrasi perusahaan Amerika ketiga
terbesar, meskipun tidak menempati
urutan pertama dari keempat faktor.
Sektor ini juga terganjal berbagai
regulasi, seperti inkonsistensi
peraturan yang berdampak kepada
eksploitasi dan distribusi konten
kreatif. Namun, kombinasi yang kuat
dari penetrasi pasar dan pertumbuhan
mengindikasikan bahwa sektor ini
memiliki potensi cukup baik.
Sifat dari sektor keuangan yang hanya
mencatakan sebagian kecil saja dari
seluruh nilai yang ditransaksikan
mengecilkan peran sektor ini. Meskipun
memainkan peranan penting di sektor
ini, jumlah perusahaan Amerika
yang bergerak di sektor keuangan di
Indonesia relatif sedikit. Dengan CAGR
6,73 persen selama lima tahun terakhir,
sektor ini mencatat pertumbuhan
terbaik dari seluruh sektor.
Peluang perusahaan Amerika untuk
melakukan ekspansi di sektor ini masih
terbuka lebar karena keterlibatan
perusahaan Amerika di sektor ini hanya
3,7 persen dan minat masyarakat kelas
menengah terhadap industri asuransi
mulai tumbuh. Namun, regulasi di
sektor ini akan memberikan tantangan
kepada perusahaan Amerika yang
ingin menanamkam modalnya di
industri keuangan.
Berikut adalah gambaran dari sektor-sektor industri, berdasarkan peringkatnya, mulai dari yang sangat menjanjikan sampai ke yang kurang menjanjikan.
Industri Kreatif
Keuangan
2 3US–Indonesia Investment Report 2016 Executive Summary
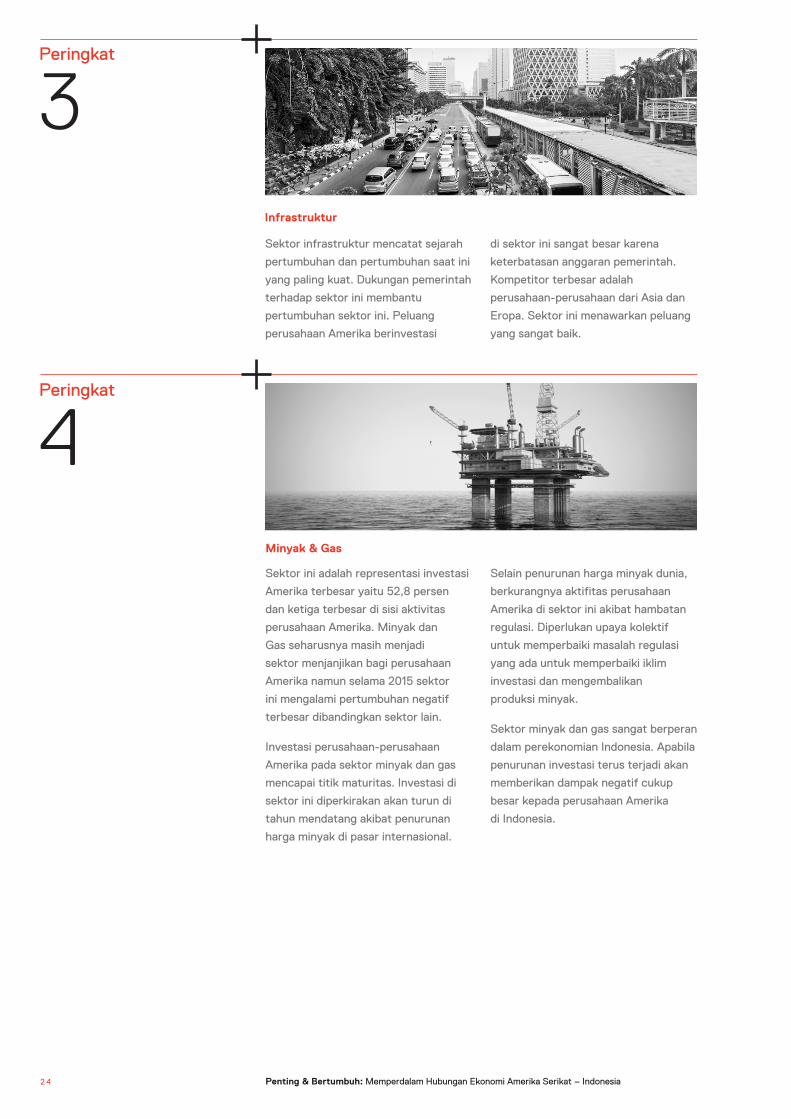
Sektor ini adalah representasi investasi
Amerika terbesar yaitu 52,8 persen
dan ketiga terbesar di sisi aktivitas
perusahaan Amerika. Minyak dan
Gas seharusnya masih menjadi
sektor menjanjikan bagi perusahaan
Amerika namun selama 2015 sektor
ini mengalami pertumbuhan negatif
terbesar dibandingkan sektor lain.
Investasi perusahaan-perusahaan
Amerika pada sektor minyak dan gas
mencapai titik maturitas. Investasi di
sektor ini diperkirakan akan turun di
tahun mendatang akibat penurunan
harga minyak di pasar internasional.
Selain penurunan harga minyak dunia,
berkurangnya aktifitas perusahaan
Amerika di sektor ini akibat hambatan
regulasi. Diperlukan upaya kolektif
untuk memperbaiki masalah regulasi
yang ada untuk memperbaiki iklim
investasi dan mengembalikan
produksi minyak.
Sektor minyak dan gas sangat berperan
dalam perekonomian Indonesia. Apabila
penurunan investasi terus terjadi akan
memberikan dampak negatif cukup
besar kepada perusahaan Amerika
di Indonesia.
Minyak & Gas
Sektor infrastruktur mencatat sejarah
pertumbuhan dan pertumbuhan saat ini
yang paling kuat. Dukungan pemerintah
terhadap sektor ini membantu
pertumbuhan sektor ini. Peluang
perusahaan Amerika berinvestasi
di sektor ini sangat besar karena
keterbatasan anggaran pemerintah.
Kompetitor terbesar adalah
perusahaan-perusahaan dari Asia dan
Eropa. Sektor ini menawarkan peluang
yang sangat baik.
Infrastruktur
Peringkat
3
Peringkat
4
2 4 Penting & Bertumbuh: Memperdalam Hubungan Ekonomi Amerika Serikat – Indonesia
Agrikultur merupakan sektor yang
paling stabil bagi perusahaan-
perusahaan Amerika dengan
ukuran aktivitas yang cukup besar.
Keterlibatan investor Amerika di
sektor ini sedikit diatas angka median.
Sektor ini mencatat CAGR 3,06 persen
dibawah tingkat pertumbuhan PDB 5,1
persen. Hal ini kemungkinan disebabkan
oleh depresiasi Rupiah. Dengan tingkat
keterlibatan sebesar 6,2 persen,
perusahaan Amerika masih memiliki
peluang ekspansi. Apabila tantangan-
tantangan regulasi tidak diselesaikan
dikhawatirkan peringkat sektor ini
akan terus menurun. Kondisi ini akan
terjadi sejalan dengan menurunnya
jumlah perusahaan yang berinvestasi
dan berkurangnya aktivitas ekonomi
perusahaan Amerika.
Barang konsumsi adalah sektor
terbesar di perekonomian Indonesia.
Peran perusahaan Amerika terbesar
juga berada di sektor ini.
Barang konsumsi menempati peringkat
kelima karena pernah mengalami
perlambatan pertumbuhan dan bahkan
negatif pada 2015. Secara umum,
perusahaan Amerika menduduki posisi
yang baik di sektor ini. Namun, pada
saat yang sama sektor ini mengalami
tekanan akibat melambatnya
pertumbuhan dan depresiasi rupiah.
Jika ekonomi tumbuh secara bertahap,
maka pertumbuhan dari minus 4,21
persen pada 2015 akan naik ke CAGR
5,5 persen. Kenaikan tersebut sama
seperti yang dicapai pada 2010-2014.
Pada tahun mendatang, perusahaan
Amerika yang sudah beroperasi di
sektor ini diperkirakan akan menaikkan
investasinya. Sektor ini juga akan
menarik perusahaan-perusahaan
Amerika lainnya untuk berinvestasi
di Indonesia.
Agrikultur
Barang Konsumsi
Peringkat
5
Peringkat
6
2 5US–Indonesia Investment Report 2016 Executive Summary
Sektor ekstraktif menempati peringkat
ketujuh, meskipun dari sisi aktifitas
menempati peringkat kedua. Nilai
aktivitas ekonomi sektor ini adalah US$
18 miliar dengan penetrasi pasar 48,5
persen. Melambatnya pertumbuhan
sektor ini sebesar 1,7 persen per tahun
selama periode 2010-2014, kontraksi
yang cukup signifikan minus 17,6
persen dan banyaknya masalah regulasi
mengindikasikan kemungkinan turunnya
peringkat sektor ini. Penurunan
peringkat juga akibat berkurangnya
kegiatan ekonomi.
Ekstraktif
Sektor ini menduduki peringkat kedua
terbawah. Kondisi ini tercermin dari
rendahnya penetrasi pasar perusahaan
Amerika di Indonesia sebesar 3,1 persen
dan rendahnya aktifitas ekonomi hanya
sebesar US$ 265,5 juta pada 2015.
Selama periode 2010-2014,
pertumbuhan sektor ini relatif kuat
dengan CAGR 5,89 persen. Data ini
mengindikasikan peluang penetrasi
pasar yang lebih besar bagi
perusahaan Amerika. Pengesahan
Undang-Undang Halal pada 2014
diperkirakan akan menjadi tantangan
bagi investasi farmasi.
Farmasi, Kesehatan dan Life Science
Peringkat
7
Peringkat
8
2 6 Penting & Bertumbuh: Memperdalam Hubungan Ekonomi Amerika Serikat – Indonesia

Sektor ini menempati peringkat
terbawah karena relatif baru dan
peran perusahaan Amerika yang
terbilang sedikit.
ICT mencatat pertumbuhan yang
rendah sehingga mempengaruhi lingkup
aktivitas perusahaan Amerika. Secara
keseluruhan, sektor ini memiliki
potensi cukup baik dan sejalan
dengan berkembangnya porsi
non telekomunikasi.
Informasi Teknologi & Komunikasi (ICT)
06Mencapai Best-Case-Scenario
Yang menjadi pertanyaan banyak
orang saat ini, mengapa Indonesia
sulit mencapai pertumbuhan ekonomi,
kemakmuran dan pemerataan
kesejahteraan. Sejak era reformasi,
Indonesia masih bekerja keras untuk
mencapai tingkat pertumbuhan
ekonomi yang tinggi dan pemberdayaan
sosial hingga kini, padahal potensi yang
dimiliki sangat besar.
Pada masa pemerintahan Soeharto
(1966-1998), perekonomian Indonesia
dibangun dengan “perintah dan
kontrol.” Kecenderungan fokus
kepada kontrol masih terlihat di jajaran
birokrasi pemerintah saat ini. Situasi
ini menjadi makin rumit adanya aspirasi
untuk dapat memenuhi kebutuhan
nasional tanpa terlibat dalam
perdagangan internasional
atau investasi asing.
Meskipun Presiden Jokowi berupaya
meningkatkan investasi asing, namun
masih ditemukan persepsi bahwa
Indonesia tidak memerlukan investasi
asing. Fungsi BKPM beberapa tahun
lalu dinilai sebagai pengontrol untuk
investasi. Fungsi ini mulai berubah
setelah BKPM secara serius menjalani
masa transisi.
Indonesia telah mengalami lima era
kepemimpinan sejak reformasi. Banyak
pihak menilai Indonesia memiliki
kecenderungan untuk melihat ke dalam
(inward looking) untuk mengurangi
investasi asing pada sektor-sektor yang
sebelumnya terbuka bagi asing.
Rasa percaya diri Indonesia tumbuh
karena berhasil melalui krisis ekonomi
2009-2011 dengan ditopang harga
tinggi komoditas. Birokrat menganggap
kebijakan yang tertutup telah
melindungi Indonesia dari dampak
krisis tersebut. Anggapan ini kemudian
tergerus menyusul melemahnya
perekonomian Cina yang berdampak
kepada perekonomian Indonesia.
Ketergantungan pada sektor komoditas
sejak 1998 menyebabkan Indonesia
mengalami deindustrialisasi dini
(premature deindustrialization)
dan pelemahan sektor manufaktur.
Manufaktur pernah berjaya sebagai
industri pada masa lalu.
Kondisi ini membuka peluang bagi
negara-negara tetangga seperti
Vietnam, India dan Filipina menyusul
Indonesia di sektor manufaktur dunia.
Peringkat
9
2 7US–Indonesia Investment Report 2016 Executive Summary

Pemikiran beberapa teknokrat dan Presiden Jokowi agar Indonesia berpartisipasi dalam perekonomian global, salah satunya dengan mengurangi rantai birokrasi, belum sepenuhnya dijalankan jajaran pemerintahan.
Pemikiran beberapa teknokrat dan
Presiden Jokowi agar Indonesia
berpartisipasi dalam perekonomian
global, salah satunya dengan mengurangi
rantai birokrasi, belum sepenuhnya
dijalankan jajaran pemerintahan.
Perusahaan Amerika masih menemui
birokrasi berbelit di lapangan.
Fokus utama AmCham Indonesia dan
USCC adalah membantu para anggota
untuk mengatasi tantangan-tantangan
di sektornya. Kami melihat hal ini dalam
horizon yang lebih luas. Dalam bab-bab
mengenai masing-masing sektor, kami
tidak hanya memaparkan masalah, tapi
juga menawarkan ide untuk membantu
Indonesia lebih membuka diri. Kami juga
menawarkan ide untuk meninggalkan
kebijakan-kebijakan proteksionis yang
dapat mengurangi minat investasi.
Ide yang kami tawarkan semata
berdasarkan pernyataan-pernyataan
dari Presiden Jokowi agar Indonesia
lebih terbuka. Kami percaya ide-ide
yang kami sampaikan dapat membantu
Indonesia. Apabila perubahan ini dapat
dilakukan dalam dua tahun kedepan,
Indonesia sangat mungkin untuk
mencapai pertumbuhan PDB tujuh
persen pada 2019. Ini dapat membantu
meningkatkan kerja sama ekonomi
Indonesia – Amerika Serikat menjadi
US$ 131,7 juta miliar pada 2017 atau
naik 46 persen dari 2014. Pencapaian
tersebut menjadi target yang layak
dikejar.
2 8 Penting & Bertumbuh: Memperdalam Hubungan Ekonomi Amerika Serikat – Indonesia
Ide untuk Menciptakan Ekonomi
Abad 21
Hasil wawancara dan diskusi dengan
para eksekutif senior perusahaan
Amerika di Indonesia menghasilkan
beberapa gagasan. Gagasan tersebut
dapat diimplementasikan di semua
sektor industri, membantu Indonesia
menjadi negara ekonomi abad 21,
mengakomodir perdagangan dan
investasi, serta memperkuat posisi
Indonesia lebih kompetitif dalam
perekonomian global.
Mencapai best-case scenario Inovasi
Indonesia harus mengikuti perubahan dunia yang cepat agar tidak tertinggal dari
negara lainnya. Inovasi menjadi salah satu kunci untuk memenangi persaingan
global. Sangat disayangkan Indonesia belum melakukan banyak inovasi disebabkan
kekuatiran kehilangan kontrol pemerintah.
Inovasi tidak saja memerlukan fleksibilitas, tapi juga hal penting lainnya adalah
kesiapan untuk menerima kegagalan. Kegagalan merupakan bagian dari inovasi dan
sering terjadi pada tahap awal. Agar jiwa inovasi dapat tumbuh di masyarakat dan
lingkungan usaha, maka kegagalan dan risiko inovasi harus dapat diterima sebagai
bagian dari proses.
Kepemilikan & Ekuitas
Salah satu bentuk proteksionisme yang diterapkan Indonesia adalah pembatasan
kepemilikan perusahaan bagi investor asing. Salah satunya batasan kepemilikan
berupa pembagian saham kepada perusahaan lokal. Investor asing menilai
kebijakan pembagian saham menyebabkan ketidaknyaman dalam bekerja karena
hanya menjadi pemilik minoritas. Revisi Daftar Negatif Investasi yang baru-baru ini
dilakukan hanya mengatasi masalah kepemilikan saham di beberapa sektor saja.
Hasil terbaik akan diperoleh apabila pemerintah mengijinkan perusahaan-
perusahaan yang benar-benar handal dalam bidangnya, baik perusahaan
internasional ataupun nasional, untuk membuktikan kemampuan terbaik mereka
dengan cara menghapuskan pembatasan kepemilikan saham. Selama perusahaan
mengikuti peraturan yang berlaku, membayar pajak, membuka lapangan pekerjaan
dan menciptakan kesejahteraan, masalah kepemilikan saham seharusnya bukan
menjadi perhatian utama pemerintah.
Regulasi: Mengontrol atau Membuka Jalan?
Di Indonesia, pengawasan berlebihan di semua bidang bisa ditemui di semua
sektor. Akibatnya inovasi dan investasi terhambat. Pengawasan yang dilakukan
pemerintah seringkali berlebihan dan mengarah kepada justifikasi. Kebijakan
tersebut tentu saja tidak sejalan dengan upaya menciptakan iklim investasi
kepada investor asing dan lokal.
BKPM adalah salah satu lembaga pemerintah yang melakukan perubahan; dari
lembaga yang membatasi kegiatan investasi menjadi fasilitator investasi. BKPM
harus menjadi model bagaimana regulasi menjadi suatu alat yang membantu dan
bukan penghambat.
Insentif
Beberapa eksekutif senior perusahaan menyatakan, insentif dari pemerintah
diperlukan untuk menstimulasi kinerja dan meningkatkan efisiensi. Pemberian
insentif dapat menjadi penyeimbang sektor yang daya tariknya menurun. Insentif
juga mampu mendatangkan investasi. Pemberian insentif merupakan hal yang
lazim diberikan oleh perusahaan untuk meningkatkan kinerja.
2 9US–Indonesia Investment Report 2016 Executive Summary

Kami menyarankan insentif sebaiknya diberikan kepada banyak aktifitas usaha,
khususnya yang berhubungan dengan pemerintah dan dunia usaha. Insentif dapat
diberikan agar memberikan dampak kepada perubahan pada pemerintah dan investasi.
Langkah-langkah Tranformasi Ekonomi
Berdasarkan kajian tersebut, kami menyimpulkan ada empat poin yang harus
diimplementasikan untuk mendorong pertumbuhan ekonomi. Tentu saja tidak
semua poin bisa diterapkan karena adanya hambatan politik.
Penghapusan DNI
Daftar negatif investasi merupakan
produk kebijakan pemerintah masa
lalu yang cenderung digunakan untuk
mengontrol kegiatan usaha. Seorang
pejabat kementerian mengatakan, DNI
mengurangi minat investasi karena
dapat mereduksi skala investasi melalui
pengurangan saham dan ekuitas.
Pembatasan seperti ini akan membuat
perusahaan memilih melakukan
investasi di negara lain yang biaya
produksinya lebih murah. Ide untuk
menghapuskan DNI harus diajukan oleh
politikus yang berani.
Reformasi Birokrasi
Reformasi birokrasi merupakan
tantangan tersendiri bagi pemerintah
Indonesia. Contoh, efisiensi dan
transparansi dalam hal perizinan dan
proses persetujuan. Reformasi birokrasi
pemerintah belum berjalan seusai iklim
usaha modern yang cepat berubah.
Antipati dan kecurigaan terhadap
investasi asing sering terlihat di
beberapa tempat.
Peraturan-peraturan yang dibuat
secara berlebihan dirasakan
sebagai alat anti investasi asing
dan memperkuat otoritas birokrasi.
Penggantian personil, penerapan
akuntabilitas dan perubahan
struktur insentif dibutuhkan untuk
meningkatkan profesionalisme.
Birokrasi merupakan bagian kecil
namun penting dari suatu kegiatan
ekonomi dan efisiensi. Reformasi
kebijakan tidak ada artinya apabila tidak
diikuti oleh reformasi birokrasi dan
kerja sama dinamis antara pelaku usaha
dan pemerintah. Tawaran pensiun
dini kepada aparatur birokrasi adalah
langkah tepat untuk memberi peluang
kepada lulusan universitas bergabung
ke dalam pemerintahan. Ini merupakan
salah satu cara membangun sikap baru
dari bawah.
Kolaborasi dan Komunikasi Terbuka
Perusahaan asing yang beroperasi di
Indonesia ingin menjalin kolaborasi
dengan pemerintah secara langsung.
Kerja sama yang dibangun untuk
mencari solusi saling menguntungkan
kedua pihak.
Pemerintah sering kali mengeluarkan
kebijakan tanpa memperhitungkan
dampak bagi pelaku usaha. Banyak ahli
yang memiliki pengalaman di bidangnya
tidak diikutsertakan dalam konsultasi.
Mereka hanya dilibatkan pada tahap
akhir sebuah kebijakan.
Kebebasan Perusahaan Mengambil Keputusan.
Let business decide. Para eksekutif perusahaan mengungkapkan, intervensi
pemerintah kepada manajemen menyebabkan kegiatan perusahaan terhambat.
Contohnya tentang perekrutan tenaga kerja asing. Pemerintah membatasi jumlah
dan usia pekerja asing di Indonesia. Kebijakan ini tidak memperhatikan keahlian dari
pekerja tersebut yang sangat diperlukan oleh perusahaan.
Mempekerjakan pekerja asing seharusnya menjadi keputusan perusahaan. Pekerja
asing adalah pilihan terakhir karena biaya yang dikeluarkan tidak murah dan
keahlian yang diperlukan belum tersedia di Indonesia. Pemerintah seharusnya
tidak melakukan “mikro-manajemen” dalam perekrutan tenaga kerja. Fokus
pemerintah seharusnya kepada pengawasan hukum dan menjatuhkan
sanksi apabila diperlukan.
3 0 Penting & Bertumbuh: Memperdalam Hubungan Ekonomi Amerika Serikat – Indonesia
Kemudahan Membentuk PMA
Indonesia sudah lama menerapkan
kebijakan kepada perusahaan asing
yang akan beroperasi di Indonesia harus
mendapatkan izin dari pemerintah.
Kebijakan ini dinilai tidak perlu dan
harus dihapus agar perusahaan asing
lebih leluasa mendirikan perusahaan
penanaman modal asing (PMA).
Kami menyarankan proses pendirian
PMA bisa dilakukan melalui online
ke Kementerian Hukum dan HAM.
Pembentukan perusahaan PMA harus
disesuaikan dengan kerangka kerja.
Pemerintah cukup melakukan
monitoring atas kepatuhan perusahaan
dalam membuka usaha. Pemberian
sanksi dijatuhkan kepada perusahaan
asing apabila perusahaan tersebut
tidak memenuhi peraturan yang
berlaku. Perubahan kebijakan ini
akan memberikan manfaat nyata dan
menumbuhkan kepercayaan bahwa
Indonesia terbuka untuk investasi asing.
Dengan mengaplikasikan langkah-langkah tersebut Indonesia dapat memperoleh
manfaat yang besar dalam perekonomian dari potensi yang ada. Sembilan sektor
tersebut menjadi perhatian utama kami, pemerintah dan masyarakat Indonesia.
CATATAN Melakukan perubahan pada sembilan sektor secara bersamaan
merupakan langkah ambisius. Untuk memulainya, bisa dilakukan melalui sektor
percontohan (pilot sector), misalnya, produk barang konsumsi. Sektor ini banyak
terkait dengan kegiatan manufaktur.
Sektor manufaktur Indonesia kehilangan posisinya sebagai pemimpin di kawasan
regional setelah krisis keuangan Asia pada 1997-1998. Pasca krisis perhatian
pemerintah lebih banyak kepada sektor komoditas dibandingkan manufaktur. Saat
ini adalah waktu yang tepat untuk memperbaiki kesalahan masa lalu dan beralih
kepada manufaktur.
Untuk mencapai target pertumbuhan
ekonomi dan membuka lapangan kerja,
pemerintah harus bekerjasama dengan
eksekutif senior dari kalangan usaha
untuk menemukan jalan keluar dari
berbagai masalah yang ada. Kolaborasi
dan komunikasi yang lebih terbuka
di pemerintahan akan membantu
meningkatkan manfaat dari investasi
bagi perusahaan dan Indonesia.
Dengan mengaplikasikan langkah-langkah tersebut Indonesia dapat memperoleh manfaat yang besar dalam perekonomian dari potensi yang ada
3 1US–Indonesia Investment Report 2016 Executive Summary
Laporan ini memaparkan kerja sama
ekonomi Indonesia – Amerika Serikat,
bentuk kerja sama dan jenis aktifitas
serta manfaat dari kerja sama bagi
kedua negara. Laporan ini menunjukkan
bahwa nilai kerja sama ekonomi
mencapai US$ 90,1 miliar pada 2014
atau lebih besar dari investasi langsung
(FDI) Amerika Serikat ke Indonesia.
Kerja sama ini sangat penting bagi
kedua negara, khususnya Indonesia
karena memberikan nilai lebih dari
sepuluh persen dari total kerja sama.
Saran-saran yang disampaikan akan
membantu meningkatkan kerja sama
ekonomi tersebut.
Untuk pertama kalinya dalam
beberapa tahun, kami menyarankan
pemerintah lebih terbuka kepada
investasi, khususnya perubahan atas
kontrol investasi asing. Perubahan
harus dilakukan di seluruh jajaran
pemerintahan dan bukan hanya
beberapa pada level menteri
senior saja.
Semakin banyak perubahan yang
dilakukan pemerintah akan membantu
mengejar target pertumbuhan sebesar
tujuh persen yang diinginkan Presiden
Jokowi. Perubahan akan meningkatkan
nilai kerja sama ekonomi kedua negara
menjadi US$ 131,9 miliar dalam waktu
lima tahun.
Langkah tersebut tentu saja tidak
mudah untuk dilakukan. Perusahaan-
perusahaan Amerika yang berada di
Indonesia akan membantu tercapainya
target-target tersebut.
07“Big Number” dan Kesimpulan
3 2 Penting & Bertumbuh: Memperdalam Hubungan Ekonomi Amerika Serikat – Indonesia 3 2

Semakin banyak perubahan yang dilakukan tentu akan lebih membantu meningkatkan pertumbuhan ekonomi sehingga target pertumbuhan ekonomi sebesar 7 persen yang diharapkan oleh Presiden Joko Widodo akan dapat tercapai
3 3US–Indonesia Investment Report 2016 Executive Summary Amcham Indonesia Investment Report Executive Summary 3 3