Embed Size (px)
Citation preview

Vital Farms, Inc. (NASDAQ: VITL)
May 11, 2021 Corporate Presentation

This presentation contains, in addition to historical information, certain forward-looking statements, as defined in Private Securities Litigation Reform Act of 1995, that are based on our current assumptions, expectations and projections about future
performance and events and relate to, among other matters, our future financial performance, our business strategy, industry and market trends, future expectations concerning our market position, future operations and capital expenditures.
Statements in this release that are forward-looking include, but are not limited to, statements related to the impact of the COVID-19 pandemic on the Company’s business, the company’s ability to acquire new customers and successfully retain
existing customers and the Company’s ability to effectively manage long-term growth.
Forward-looking statements generally contain words such as "believes," "expects," "may," "will," "should," "seeks," "approximately," "intends," "plans," "estimates," "anticipates," and similar expressions. These forward-looking statements are only
predictions, not historical fact. You should, therefore, not rely on these forward-looking statements as representing our views as of any date subsequent to the date of this presentation. Forward-looking statements are based on information
available at the time those statements are made and/or management’s good faith belief as of that time with respect to future events and are subject to risks and uncertainties that could cause actual performance or results to differ materially from
those expressed in or suggested by the forward-looking statements. Important factors that could cause actual results to differ materially from expectations include, among others: the magnitude and duration of the COVID-19 pandemic; our ability
to effectively manage our growth; our ability to effectively expand our manufacturing and production capacity, forecast demand and manage our inventory; our ability to successfully enter new markets, manage our international expansion and
comply with any applicable laws and regulations; the effects of increased competition from our market competitors; the success of our marketing efforts and the ability to grow brand awareness, maintain, protect and enhance our brand, attract and
retain new customers and grow our market share; changes in consumer tastes and trends in our industry; changes in government regulations and policies; availability and prices of raw materials for our products; outcomes of legal or administrative
proceedings; the financial condition of, and our relationship with our suppliers, co-manufacturers, distributors, retailers and foodservice customers; the ability of our suppliers and co-manufacturers to comply with food safety, environmental or other
laws or regulations; and general economic conditions. We are under no duty to update any of these forward-looking statements after the date of this presentation except as otherwise required by law.
This presentation also contains estimates and other statistical data obtained from independent parties and by us relating to market size and growth and other data about our industry, customers and consumers. This data involves a number of
assumptions and limitations, and you are cautioned not to give undue weight to such estimates and data. In addition, projections, assumptions and estimates of our future performance and the future performance of the geographic and other
markets in which we operate are necessarily subject to a high degree of uncertainty and risk.
Our historical results are not necessarily indicative of the results to be expected for any future periods and our operating results for the three-month period ended March 28, 2021 are not necessarily indicative of the results that may be expected for
the fiscal year ending December 26, 2021 or any other interim periods or any future year or period.
The trademarks included in this presentation are the property of the owners thereof and are used for reference purposes only.
Non-GAAP Financial Measures
Adjusted EBITDA is a financial measure that is not required by, or presented in accordance with generally accepted accounting principles in the United States (“GAAP”). We believe that Adjusted EBITDA, when taken together with our financial
results presented in accordance with GAAP, provides meaningful supplemental information regarding our operating performance and facilitates internal comparisons of our historical operating performance on a more consistent basis by excluding
certain items that may not be indicative of our business, results of operations or outlook. Adjusted EBITDA should not be considered as an alternative to net (loss) income, net (loss) income per share or any other performance measures derived in
accordance with GAAP as measures of operating performance, operating cash flows or liquidity. Our presentation of Adjusted EBITDA should not be construed to imply that our future results will be unaffected by these items. See the appendix to
this presentation for a reconciliation of Adjusted EBITDA to net (loss) income, the most directly comparable financial measure presented in accordance with GAAP
“Adjusted EBITDA” is defined as net (loss) income, adjusted to exclude: (1) depreciation and amortization; (2) provision for income taxes; (3) stock-based compensation expense; (4) interest expense; (5) interest income; (6) change in fair value of
contingent consideration; and (7) net litigation settlement gain.
“Adjusted EBITDA” as a % of net revenues” is defined as Adjusted EBITDA divided by net revenues.
Adjusted EBITDA is presented for supplemental informational purposes only, has limitations as an analytical tool and should not be considered in isolation or as a substitute for financial information presented in accordance with GAAP. Some of the
limitations of Adjusted EBITDA include that (1) it does not properly reflect capital commitments to be paid in the future, (2) although depreciation and amortization are non-cash charges, the underlying assets may need to be replaced and Adjusted
EBITDA does not reflect these capital expenditures, (3) it does not consider the impact of stock-based compensation expense, (4) it does reflect other non-operating expenses, including interest expense, (5) it does not consider the impact of any
contingent consideration liability valuation adjustments and (6) it does not reflect tax payments that may represent a reduction in cash available to us. In addition, our use of Adjusted EBITDA may not be comparable to similarly titled measures of
other companies because they not calculate Adjusted EBITDA in the same manner, limiting its usefulness as a comparative measure. Because of these limitations, when evaluating our performance, you should consider Adjusted EBITDA
alongside other financial measures, including our net income and other results stated in accordance with GAAP.
REPORTING DISCLAIMER
1

2

Source: SPINS, Whole Foods Market1 Numerator panel data based on the 52 week period ending 21-Mar-2021.2 Based on retail dollar sales for the 12 week period ending 21-Mar-2021. Brand rank excludes private label.3 Based the 12 week period ending 21-Mar-2020.
Q1 2021 HIGHLIGHTS
3
5mmHouseholds
Purchasing
24Total Retail SKUs
16.5K+Stores
Selling3
#1 4.7%U.S. Pasture-Raised
Egg Brand2
U.S. Retail Egg
Share3
#2U.S. Overall
Egg Brand2
BULLSH*T FREE HONEST FOOD
4.1%Household
Penetration1
+23%Net Revenue
Growth
+25%Adj. EBITDA
Growth
+311 bpsGross Margin
Growth

OUR VALUES ARE ROOTED IN CONSCIOUS CAPITALISM
4
These principles guide our day-to-day operations and, we
believe, deliver a more SUSTAINABLE AND
SUCCESSFUL business
We operate a
STAKEHOLDER
MODELthat prioritizes the long-term
benefits of each of our stakeholders
We balance
PROFIT AND
PURPOSE to meet highest verified
standards of social and
environmental performance,
public transparency and legal
accountability

AN ETHICAL ALTERNATIVE TO FACTORY FARMING PRACTICES
5
LIVING
CONDITIONS
Open Air, 108 Square
Feet per Hen
FEEDOmnivorous, Including
Grain, Plants, Insects
LAND
MANAGEMENTSustainable Practices
PARTNERSDirect Relationships with
Small Family Farms
YEAR-ROUND PRODUCTION OUR FRAMEWORK
Snow… Brr!
A little too much rain
Not quite enough rain
Spicy-hot in the summer
The Pasture Belt –
Perfect year-round for
our picky ladies!

IMPROVING THE LIVES OF PEOPLE, ANIMALS AND THE PLANET
THROUGH FOOD
6
EACH DAY WE BRING ETHICAL FOOD TO THE TABLE BY SOURCING AND MARKETING
PASTURE-RAISED FOOD FROM SMALL FAMILY FARMS
CHAMPIONING
ANIMAL WELFARE
INNOVATING
THE SUPPLY CHAIN
BUILDING
A PREMIUM BRAND

7
OUR MODEL ALLOWS US TO DELIVER QUALITY AT SCALE
ECS
Wash
Grade
Pack
Ship
Quality control
HQ
Branding
Selling
Supporting
NETWORK OF 200+ SMALL
FAMILY FARMS
RETAIL
FOOD SERVICE
MORE THAN 16,500
STORES
EGG CENTRAL
STATION
Wash, Grade, Pack,
Ship, Quality control
HEADQUARTERS
Branding, Selling,
Supporting
Aggregate
product
from farm
network
Direct to
customer
& through
distributors

BUSINESS UPDATE

VITAL FARMS GROWTH STRATEGY
9
GROW WITHIN THE RETAIL CHANNEL
EXPAND HOUSEHOLD PENETRATION THROUGH GREATER
CONSUMER AWARENESS
EXPAND PRODUCT OFFERING THROUGH INNOVATION
1
2
3
EXPAND OUR FOOTPRINT ACROSS FOODSERVICE4

Source: Numerator Household Panel
Note: Numerator data refresh adjusted historical data to reflect accurate receipt captures 10
HOUSEHOLD PENETRATION
VITAL FARMS EGGS & CHANGE VS. YEAR AGO
WE ARE ACCELERATING HOUSEHOLD PENETRATION THROUGH NEW
DISTRIBUTION AND INCREASING BRAND AWARENESS
+68 bps+88 bps
+137 bps
+130 bps+134 bps
+117 bps
2008 2015
2018
2019
11Source: SPINS, Whole Foods Market
Note: Store Count figures for last 12 weeks as of 21-Mar-2021 and Year Ago
2019
2020
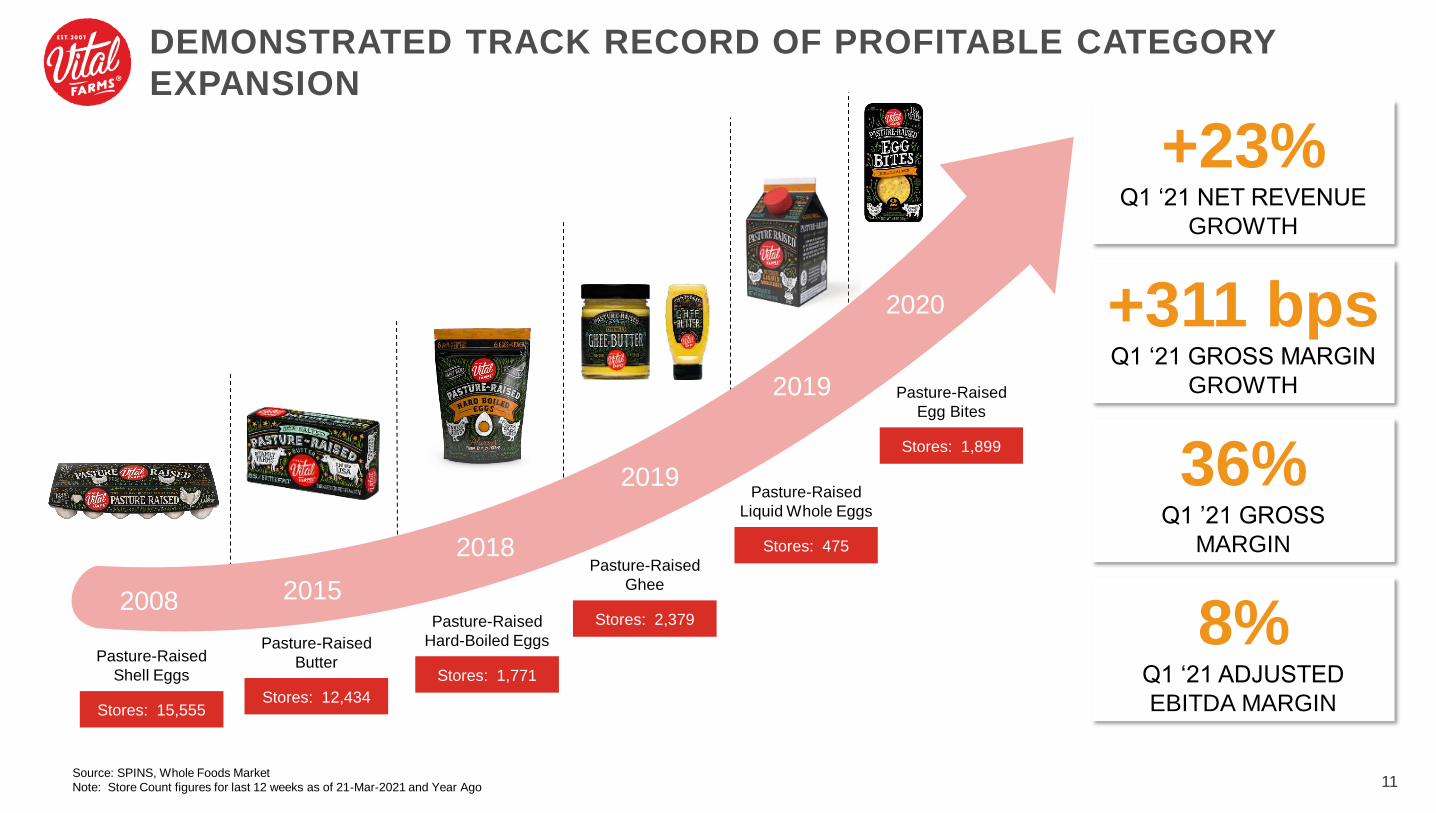
DEMONSTRATED TRACK RECORD OF PROFITABLE CATEGORY
EXPANSION
+23%Q1 ‘21 NET REVENUE
GROWTH
+311 bpsQ1 ‘21 GROSS MARGIN
GROWTH
36%Q1 ’21 GROSS
MARGIN
8%Q1 ‘21 ADJUSTED
EBITDA MARGIN
2008 2015
2018
2019
Stores: 12,434
Pasture-Raised
ButterStores: 1,771
Pasture-Raised
Hard-Boiled Eggs
Stores: 2,379
Pasture-Raised
Ghee
Stores: 475
Pasture-Raised
Liquid Whole Eggs
Stores: 15,555
Pasture-Raised
Shell Eggs
2019
2020
Stores: 1,899
Pasture-Raised
Egg Bites
12
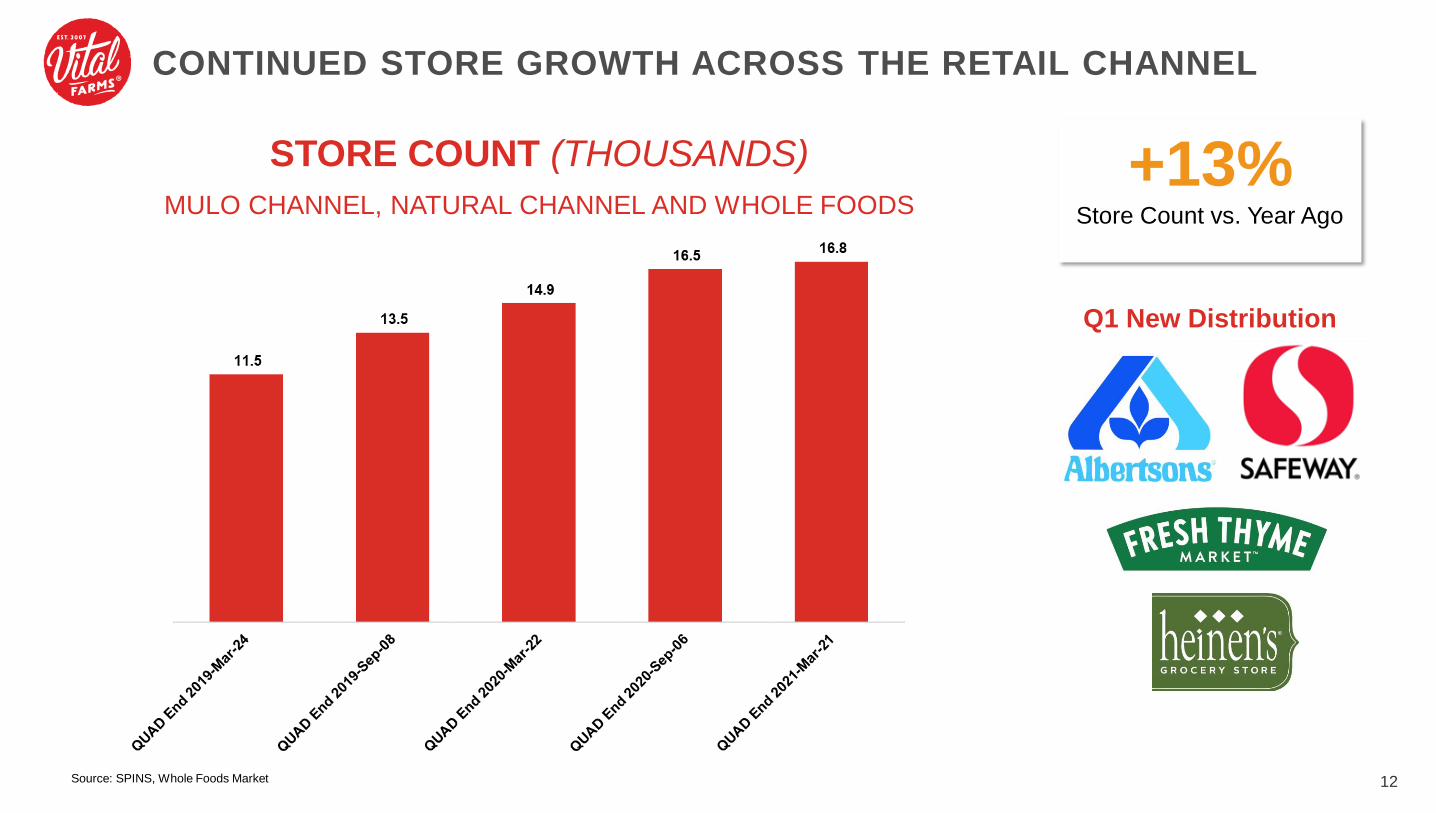
+6%
CONTINUED STORE GROWTH ACROSS THE RETAIL CHANNEL
Source: SPINS, Whole Foods Market
STORE COUNT (THOUSANDS)
MULO CHANNEL, NATURAL CHANNEL AND WHOLE FOODS+13%
Store Count vs. Year Ago
Q1 New Distribution
13
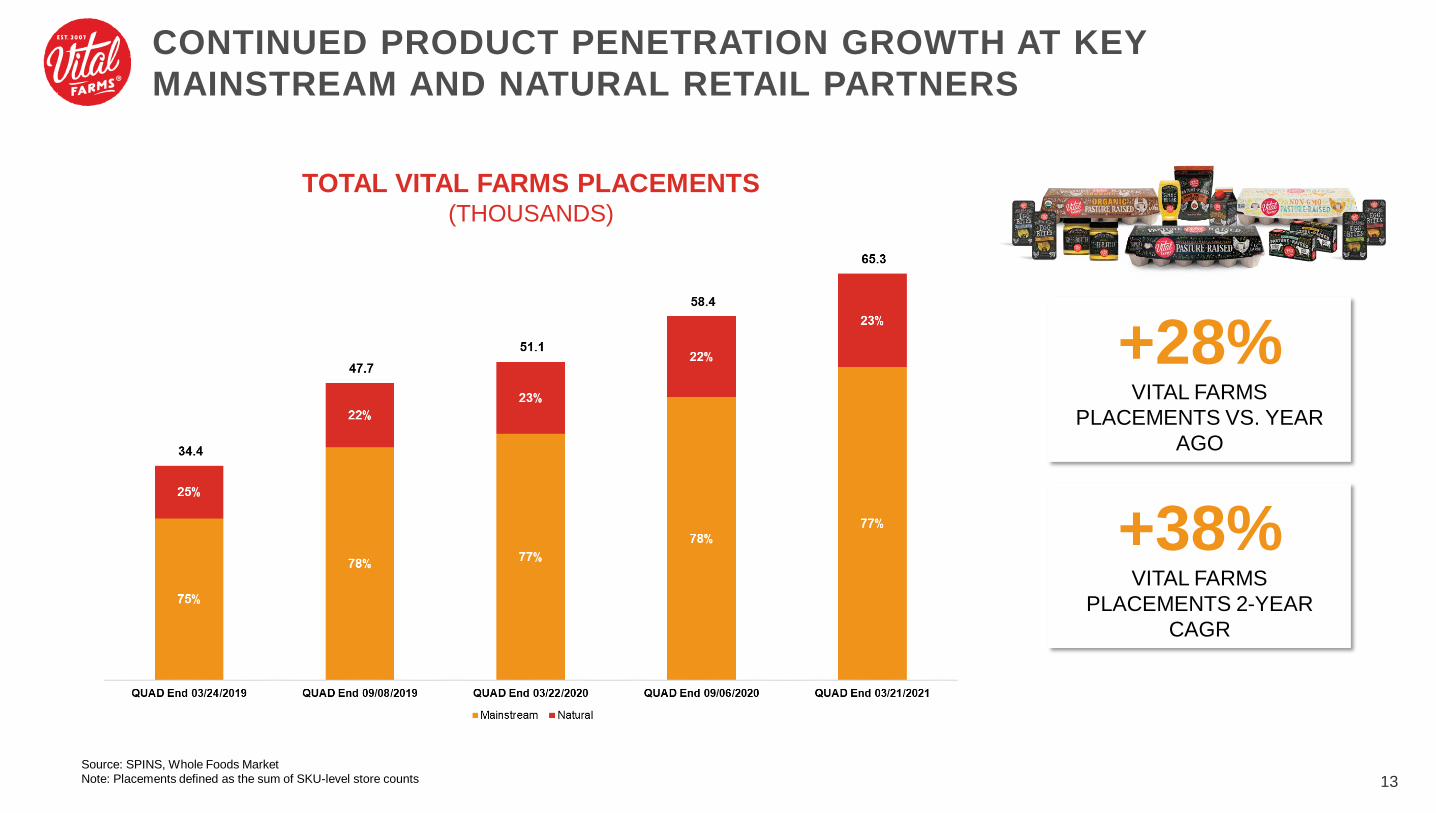
CONTINUED PRODUCT PENETRATION GROWTH AT KEY
MAINSTREAM AND NATURAL RETAIL PARTNERS
Source: SPINS, Whole Foods Market
Note: Placements defined as the sum of SKU-level store counts
TOTAL VITAL FARMS PLACEMENTS(THOUSANDS)
+28%VITAL FARMS
PLACEMENTS VS. YEAR
AGO
+38%VITAL FARMS
PLACEMENTS 2-YEAR
CAGR
14
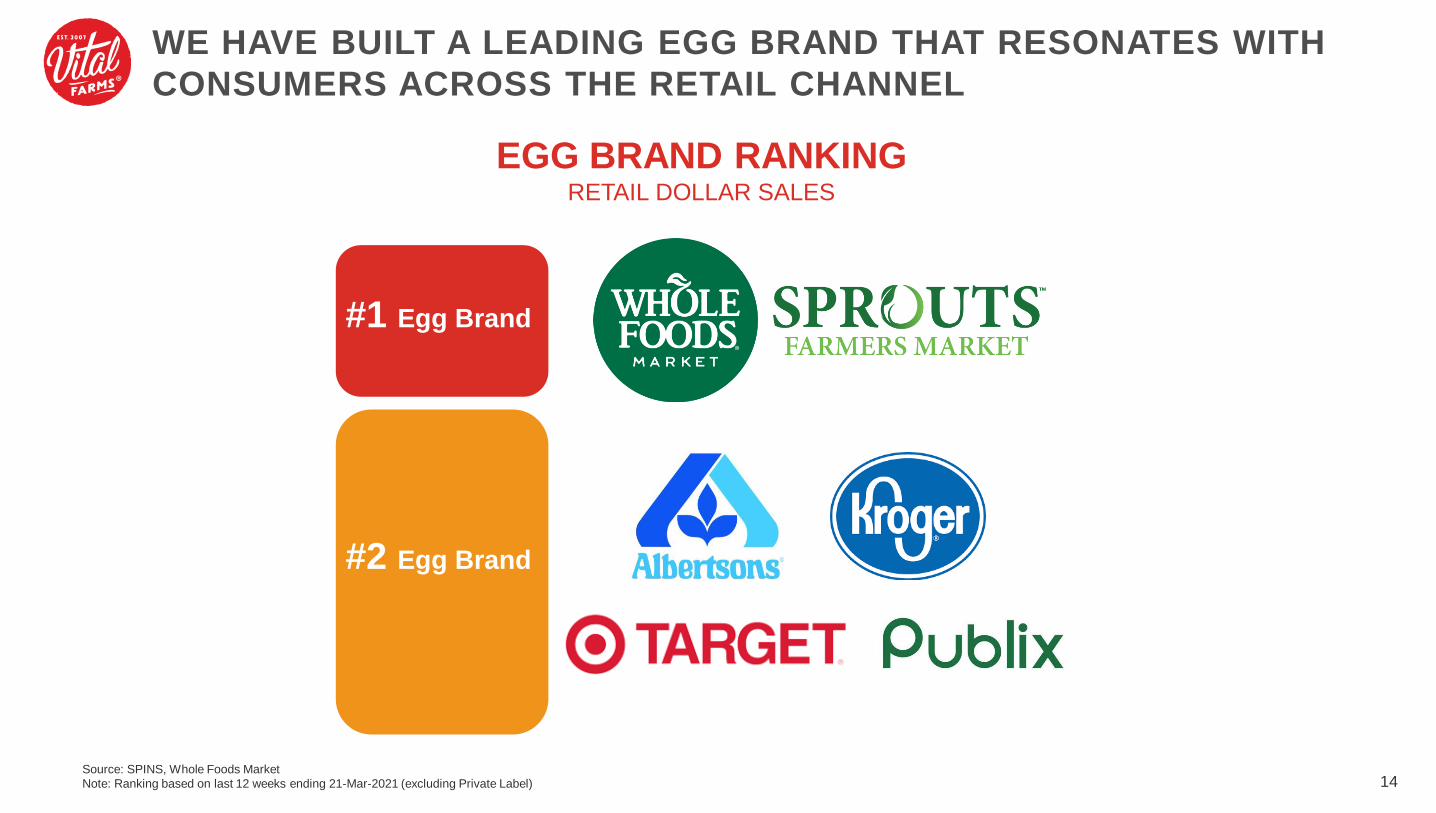
EGG BRAND RANKINGRETAIL DOLLAR SALES
#2 Egg Brand
#1 Egg Brand
Source: SPINS, Whole Foods Market
Note: Ranking based on last 12 weeks ending 21-Mar-2021 (excluding Private Label)
WE HAVE BUILT A LEADING EGG BRAND THAT RESONATES WITH
CONSUMERS ACROSS THE RETAIL CHANNEL

ECS EXPANSION UPDATE

16
EXPANSION OF OUR PROCESSING CAPACITY IS ON SCHEDULE
EXPECTED
COMPLETION
Q2 2022
• 3 million additional eggs
per day
• Supports $600 million
egg business
• 153,000 square feet
ECS EXPANSION WILL DOUBLE OUR PROCESSING CAPACITY TO SUPPORT GROWTH BEYOND 2022

FINANCIAL UPDATE
Q1 2021 PERFORMANCE UPDATE
FINANCIAL SUMMARY HIGHLIGHTS
18
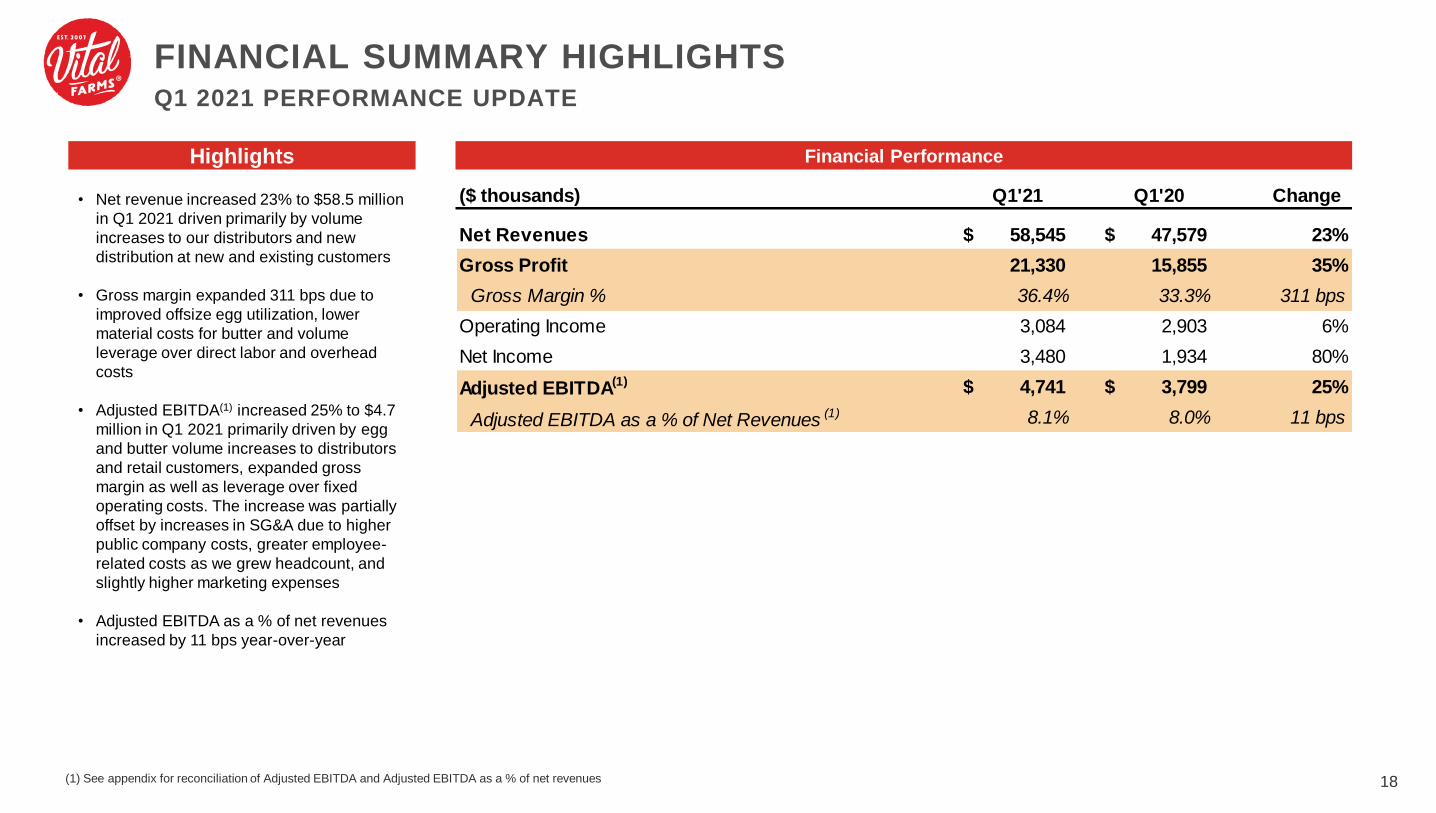
• Net revenue increased 23% to $58.5 million
in Q1 2021 driven primarily by volume
increases to our distributors and new
distribution at new and existing customers
• Gross margin expanded 311 bps due to
improved offsize egg utilization, lower
material costs for butter and volume
leverage over direct labor and overhead
costs
• Adjusted EBITDA(1) increased 25% to $4.7
million in Q1 2021 primarily driven by egg
and butter volume increases to distributors
and retail customers, expanded gross
margin as well as leverage over fixed
operating costs. The increase was partially
offset by increases in SG&A due to higher
public company costs, greater employee-
related costs as we grew headcount, and
slightly higher marketing expenses
• Adjusted EBITDA as a % of net revenues
increased by 11 bps year-over-year
Highlights Financial Performance
(1) See appendix for reconciliation of Adjusted EBITDA and Adjusted EBITDA as a % of net revenues
($ thousands) Change
Net Revenues $ 58,545 $ 47,579 23%
Gross Profit 21,330 15,855 35%
Gross Margin % 36.4% 33.3% 311 bps
Operating Income 3,084 2,903 6%
Net Income 3,480 1,934 80%
Adjusted EBITDA(1) $ 4,741 $ 3,799 25%
Adjusted EBITDA as a % of Net Revenues (1) 8.1% 8.0% 11 bps
Q1'21 Q1'20
2019 2020 Q1 ‘20 Q1 ‘21
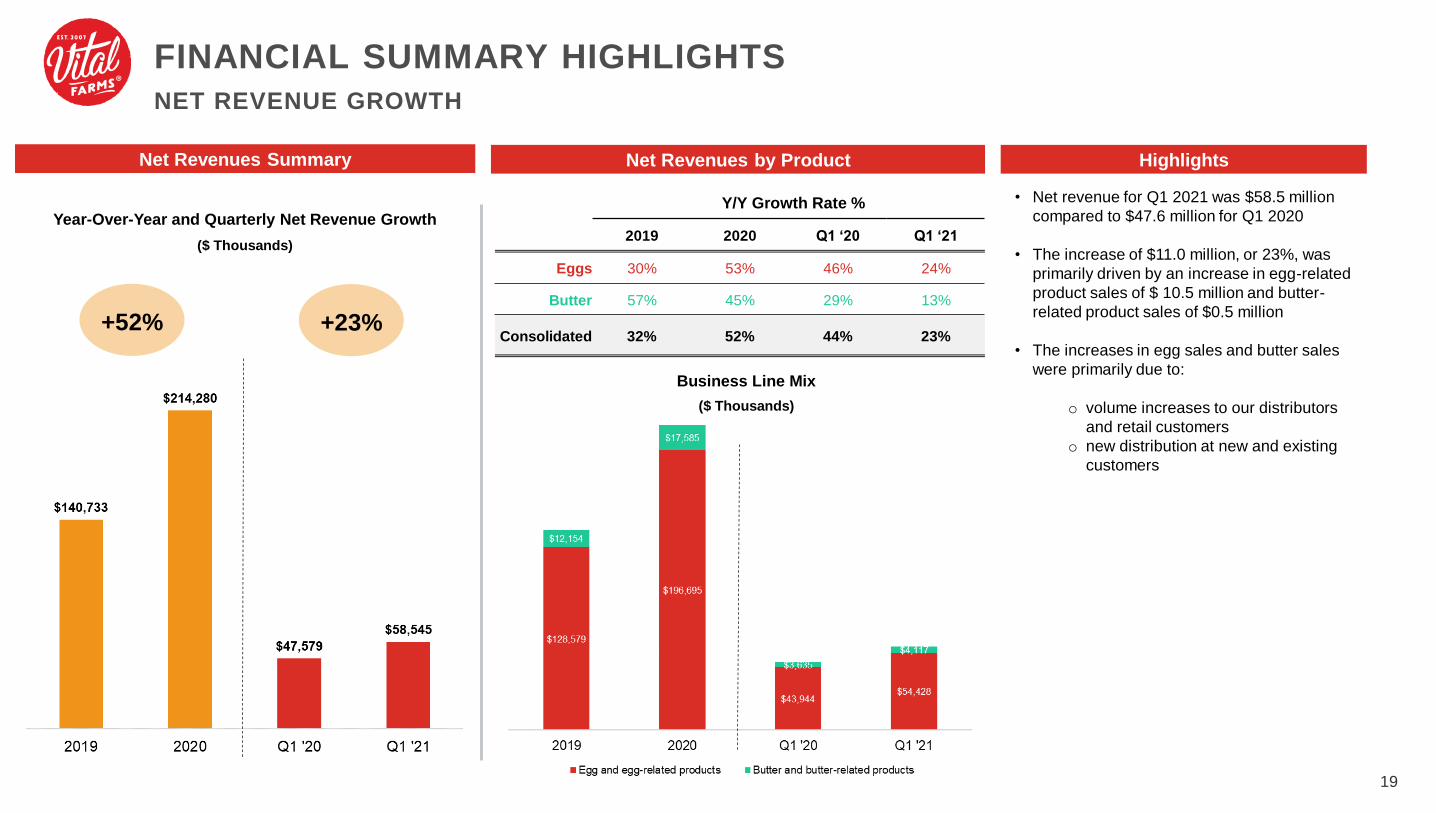
Eggs 30% 53% 46% 24%
Butter 57% 45% 29% 13%
Consolidated 32% 52% 44% 23%
NET REVENUE GROWTH
FINANCIAL SUMMARY HIGHLIGHTS
19
Highlights
• Net revenue for Q1 2021 was $58.5 million
compared to $47.6 million for Q1 2020
• The increase of $11.0 million, or 23%, was
primarily driven by an increase in egg-related
product sales of $ 10.5 million and butter-
related product sales of $0.5 million
• The increases in egg sales and butter sales
were primarily due to:
o volume increases to our distributors
and retail customers
o new distribution at new and existing
customers
Net Revenues by Product
Y/Y Growth Rate %
Business Line Mix
Year-Over-Year and Quarterly Net Revenue Growth
($ Thousands)
Net Revenues Summary
($ Thousands)
+23%+52%

IMPROVING MARGIN PROFILE
FINANCIAL SUMMARY HIGHLIGHTS
20
Highlights
• The increase in gross profit of $5.5 million, or
35%, was primarily driven by an increase in
net revenue
• Gross margin expanded 311 bps in Q1 2021
due to improved offsize egg utilization, lower
material costs for butter and volume leverage
over direct labor and overhead costs
• Shipping and distribution increased $1.8
million, or 55%, primarily driven by an increase
in sales volume and outbound freight rates
that resulted in increased costs related to
third-party freight for our products
• Selling, general, and administrative expenses
as a percent of net sales increased to 23% for
Q1 2021, compared to 20% for Q1 2020. The
increase was primarily driven by higher public
company costs, greater employee-related
costs as we grew headcount, and slightly
higher marketing expenses
Gross Profit and Margin Operating Expenses
($ Thousands)
30%
Gross Margins
35% 36%
SG&A as a % of Net Revenues
21% 20%
($ Thousands)
Adjusted
EBITDA(1)
(Thousands)$6,406 $16,751 $3,799 $4,741
(1) See appendix for reconciliation of Adjusted EBITDA and Adjusted EBITDA as a % of net revenues
33% 22% 23%
Shipping & Distribution as a % of Net Revenues
7% 7%7% 9%

UPDATED 2021 GUIDANCE
22
2021 NET REVENUE AND ADJUSTED EBITDA GUIDANCE
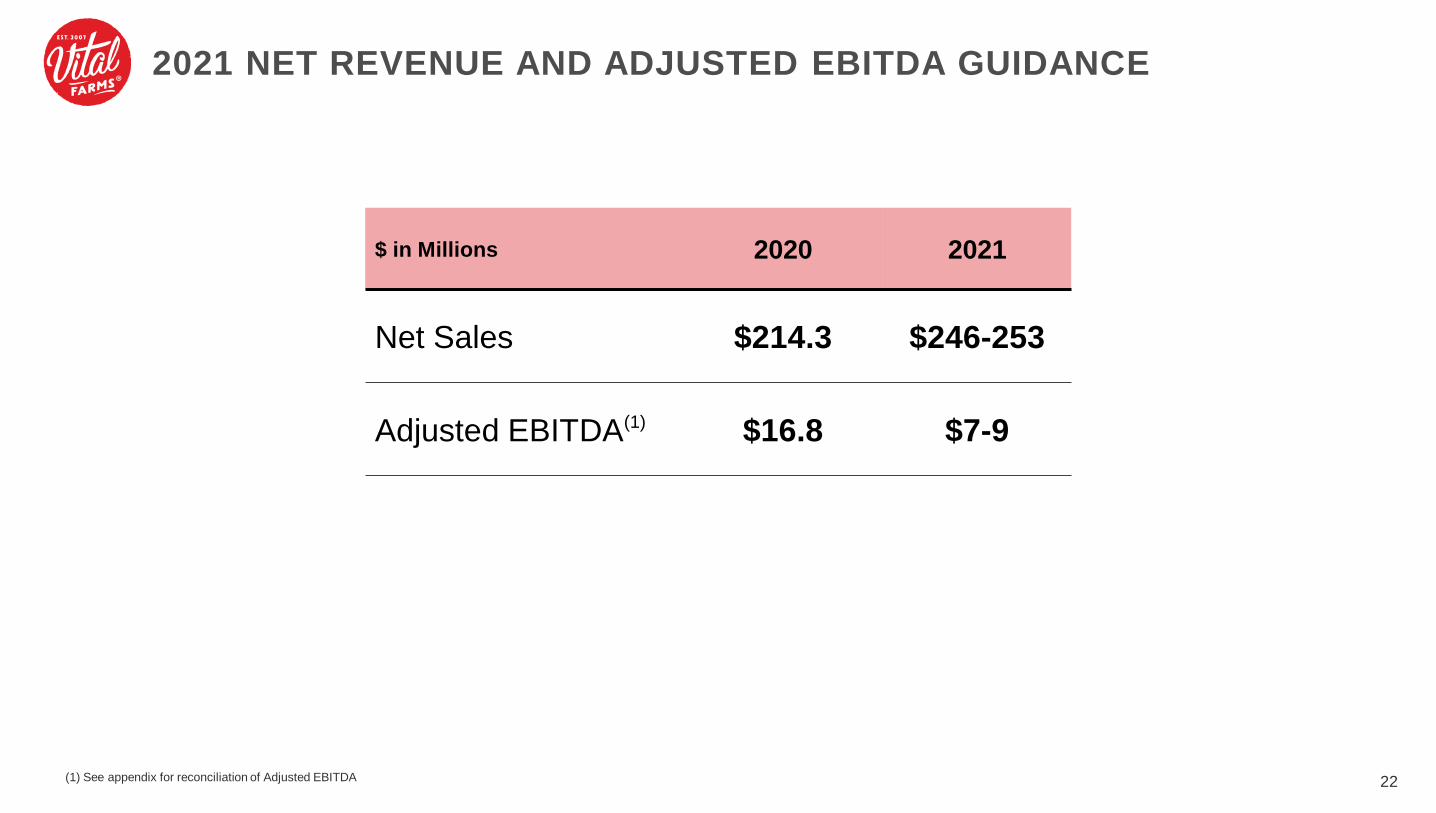
$ in Millions 2020 2021
Net Sales $214.3 $246-253
Adjusted EBITDA(1) $16.8 $7-9
(1) See appendix for reconciliation of Adjusted EBITDA
APPENDIX
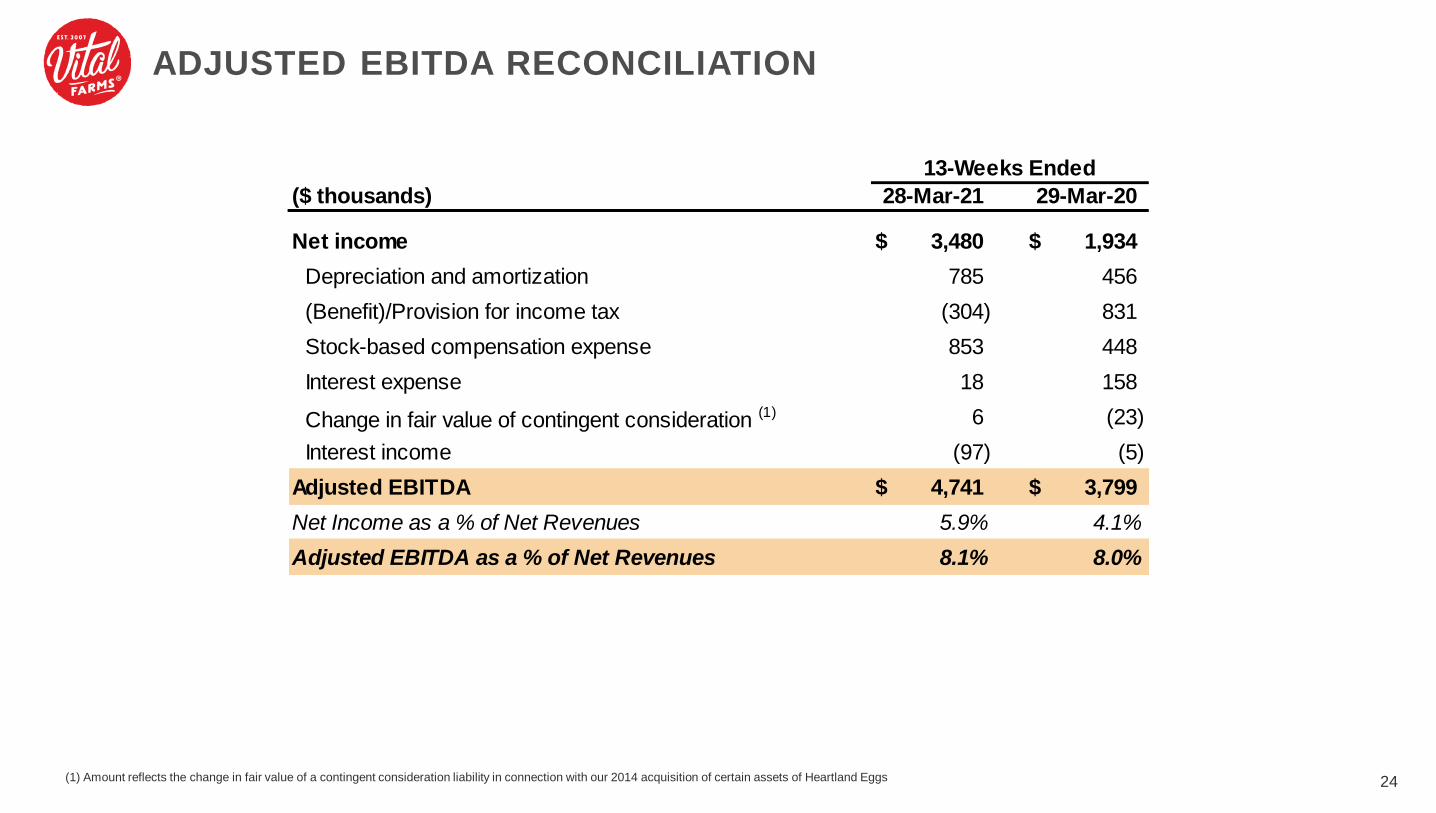
(1) Amount reflects the change in fair value of a contingent consideration liability in connection with our 2014 acquisition of certain assets of Heartland Eggs 24
ADJUSTED EBITDA RECONCILIATION
($ thousands)
Net income $ 3,480 $ 1,934
Depreciation and amortization 785 456
(Benefit)/Provision for income tax (304) 831
Stock-based compensation expense 853 448
Interest expense 18 158
Change in fair value of contingent consideration (1) 6 (23)
Interest income (97) (5)
Adjusted EBITDA $ 4,741 $ 3,799
Net Income as a % of Net Revenues 5.9% 4.1%
Adjusted EBITDA as a % of Net Revenues 8.1% 8.0%
13-Weeks Ended
28-Mar-21 29-Mar-20