Embed Size (px)
Citation preview

Visualizing self-organizing maps with GIS
Tonio FinckeInstitut für Geoinformatik,
Westfälische Wilhelms-Universität Münster
Victor LoboPortuguese Naval Academy, Almada, Portugal
Fernando BaçãoISEGI, Universidade Nova de Lisboa, Portugal
17.06.2008

Motivation● Self-organizing maps (SOM) are usually built
to detect patterns, relationships or anomalies within large and high-dimensional data sets with unknown structures
● Although a lot of visualization techniques exist, it might still be cumbersome to detect patterns in the data
● GIS can be used to analyze the visualization techniques

Self-organizing maps
● A self-organizing map is a neural network● Each neuron is associated with a codebook
vector● A topological order is defined over the
network● Via Training the SOM becomes
representative for an input data set

Self-organizing maps
Set of Input Vectors Codebook Vectors
Training
Self-organizing maps
Codebook Vectors The output grid

Applications for further investigation
● Component Planes● U-Matrix● P-Matrix● U*-Matrix● ...

Example 1: The John Snow map
● 2 Attributes per victim– X-dimension– Y-dimension
● The input vectors and codebook vectors are 2-dimensional so they can be plotted directly
Input Vectors Codebook Vectors
Input Vectors andCodebook Vectors
The output grid
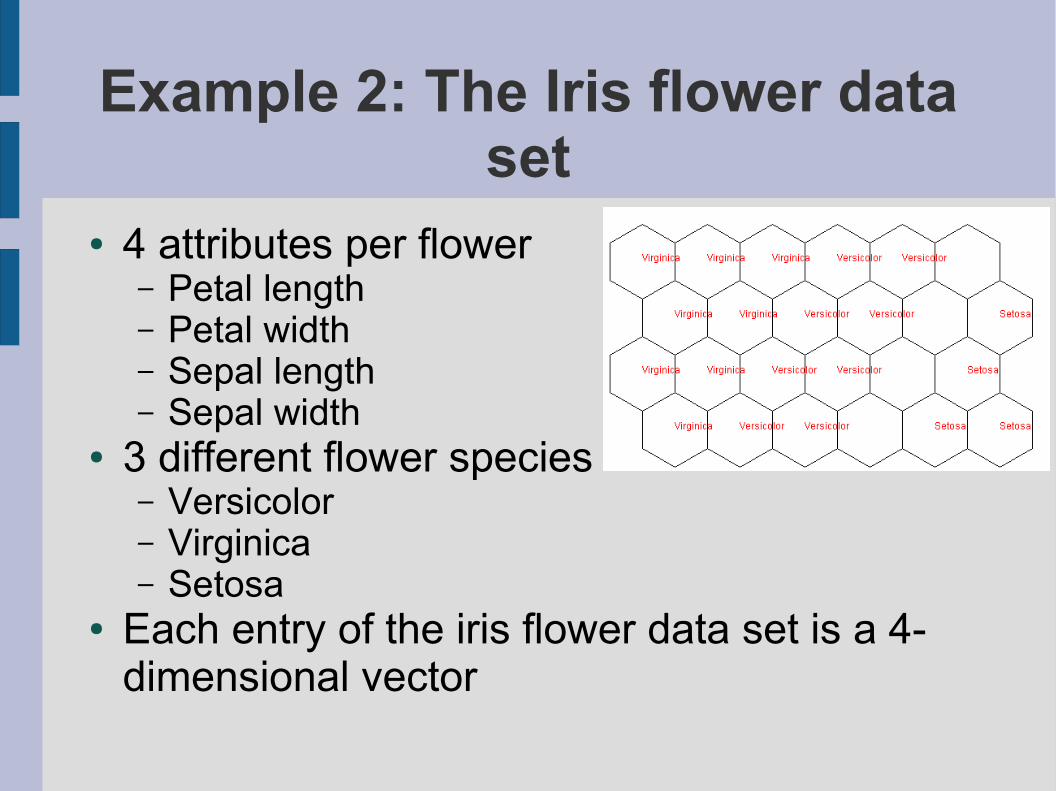
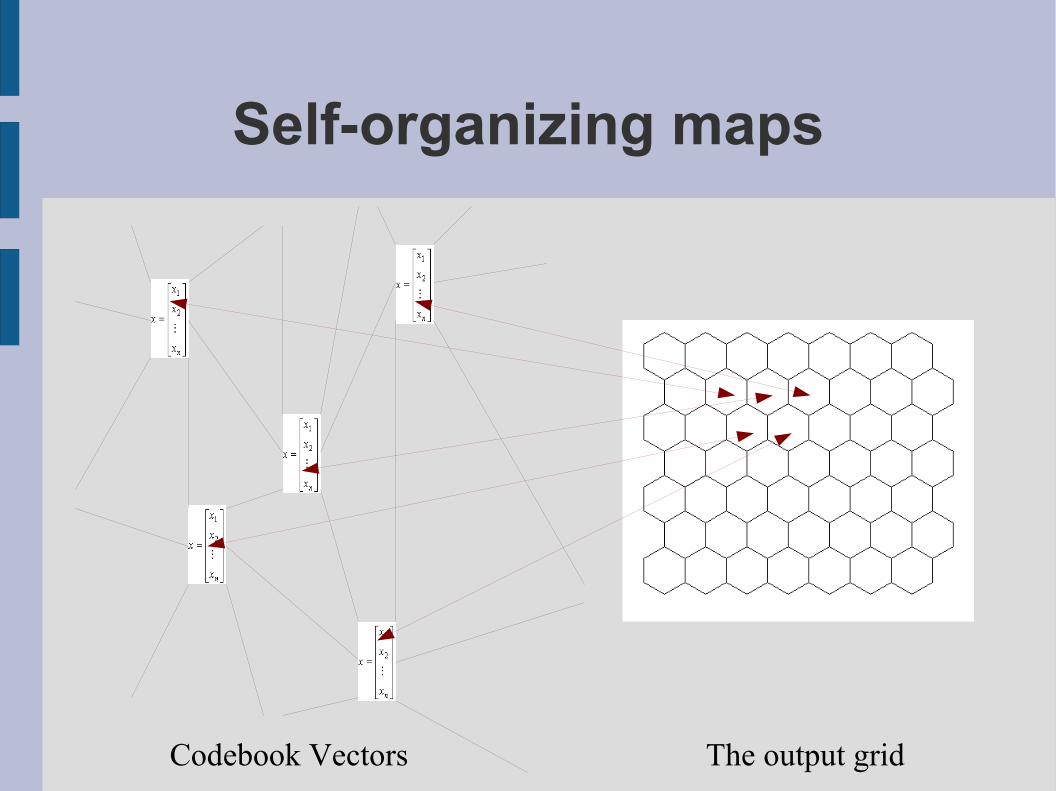
Example 2: The Iris flower data set
● 4 attributes per flower – Petal length– Petal width– Sepal length– Sepal width
● 3 different flower species– Versicolor– Virginica– Setosa
● Each entry of the iris flower data set is a 4-dimensional vector

Component Planes
● A Component Plane is a grid whose cells contain the value of the n-th dimension of a codebook vector which can be displayed by color coding
The Component Planes for the John Snow Map SOM

The Component Planes for the Iris flower data set SOM
Component Plane for Sepal Length Component Plane for Sepal Width
Component Plane for Petal Length Component Plane for Petal Width

U-Matrices
● A U-Matrix is a grid whose cells contain a value which tells about the distance of one unit to its neighbouring units
U-Matrix for the John Snow map SOM
U-Matrix for the Iris flower data set SOM
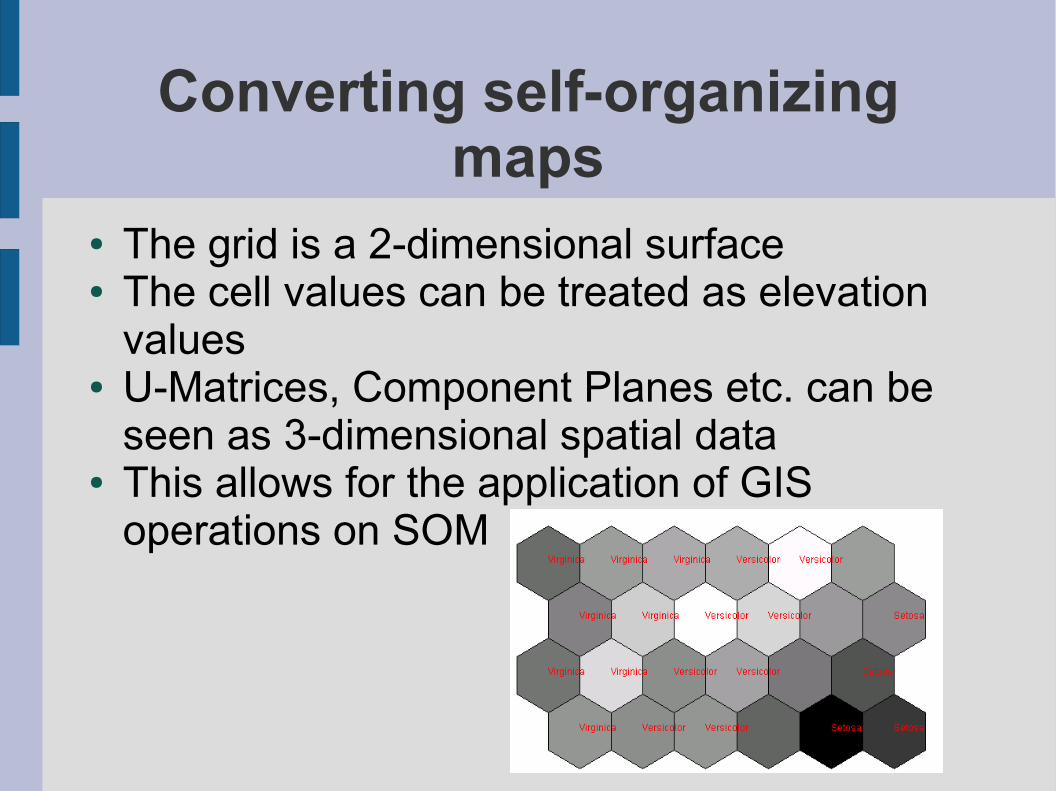
Converting self-organizing maps
● The grid is a 2-dimensional surface● The cell values can be treated as elevation
values● U-Matrices, Component Planes etc. can be
seen as 3-dimensional spatial data● This allows for the application of GIS
operations on SOM

SOM ConverterInput: A SOM calculated by another program
Operation: Creation of differentvisualizationtechniques
Output: Point Feature Data that can be readinto ArcGIS

Analysis of landscape-like visualization types
● Triangulated Irregular Networks
Triangulated Irregular Network for the U-Matrix of the Iris flower data set

Analysis of landscape-like visualization types
● Interpolated elevation values
Spline-interpolated raster surface for the U-Matrix of the Iris flower data set

Analysis of Component Planes
● Composite Bands for the Iris flower data set
Combinations of Planes 1, 3, and 4
Combinations of Planes 1, 2, and 4Combinations of Planes 1, 2, and 3
Combinations of Planes 2, 3, and 4

Analysis of Component Planes
● Maximum Likelihood Classification of the Iris flower data set

Outview
● Research will continue in different ways:– New visualization techniques– New GIS-provided operations
● Main goal:– Emphasize the meaning of the operations for a
SOM and its input data

End
● Thank you for your attention● I am looking forward to hearing your
comments