Embed Size (px)
Citation preview
Visualizing Primary Care, Policy & Visualizing Primary Care, Policy & ReformReform
Andrew Bazemore MD MPHAndrew Bazemore MD MPH

APHCRI-RGC Visiting
Fellowship

Senator DaschleSenator Daschle: : ““Other countries starts at the Other countries starts at the base of the pyramid with primary care, and they base of the pyramid with primary care, and they work their way up until the money runs out.work their way up until the money runs out.””
3° Care
1° Care
2° Care
3° Care
2° Care
1° Care
… “We start at the top of the pyramid, and we work our way down until the money runs out…And so we have to change the pyramid. We have to start at the base.”

International Comparison of Spending on Health, International Comparison of Spending on Health, 19801980––20052005
0
1000
2000
3000
4000
5000
6000
7000
1980
1982
1984
1986
1988
1990
1992
1994
1996
1998
2000
2002
2004
United StatesGermanyCanadaFranceAustraliaUnited Kingdom
0
2
4
6
8
10
12
14
16
1980
1982
1984
1986
1988
1990
1992
1994
1996
1998
2000
2002
2004
United StatesGermanyCanadaFranceAustraliaUnited Kingdom
Source: Commonwealth Fund; OECD Health Data 2007, Version 10/2007 .
Average spending on health per capita ($US PPP)
Total expenditures on health as percent of GDP
4

Expenditures Expenditures vsvs Primary Care ScorePrimary Care Score
UNITED STATES
AUSBEL
GERCAN
DKFINNTH
SPASWE UK
FRA
JAP
$0
$500
$1,000
$1,500
$2,000
$2,500
$3,000
$3,500
$4,000
0 0.2 0.4 0.6 0.8 1 1.2 1.4 1.6 1.8 2worse Primary Care Score better
Per
Cap
ita H
ealth
Car
e Ex
pend
iture
s 20
00
Adapted with permission from Starfield B. Policy relevant determinants of health: an international perspective. Health Policy 2002;60:201-21.

PrimaryPrimary--care score care score vsvs health outcomeshealth outcomes
UnitedStates
AUS
BEL GER
CANFIN
SP SWE
UK
0
1
2
3
4
5
6
7
8
9
10
0 1 2 3 4 5 6 7 8 9 10 11 12
better------Primary care score ranking-------worseH
ealth
care
Out
com
es
Ran
k* NTH/DK
*Rank based on patient satisfaction, expenditures per person, 14 health indicators, and medications per person in Australia, Belgium, Canada, Denmark, Finland, Germany, Netherlands, Spain, Sweden, United Kingdom, United States
Adapted with permission from Starfield B. Is primary care essential? Lancet 1994;344:1129-33.

Preventable DeathsPreventable Deaths
US is last among industrial nations in preventable deaths (ranked 19th )
Could prevent 100,000 deaths annually
Health Affairs, Sept, 2006

Mortality Amenable to Health CareMortality Amenable to Health Care U.S. Rank Fell from 15 to Last out of 19 CountriesU.S. Rank Fell from 15 to Last out of 19 Countries
7681
88 8489 89
99 9788
97
109 106116 115 113
130 134128
115
65 71 71 74 74 77 80 82 82 84 84 90 93 96 101 103 103 104 110
0
50
100
150
Fran
ceJa
pan
Austra
liaSpa
in
Italy
Canad
aNor
wayNeth
erlan
dsSwed
enGre
ece
Austri
aGer
many
Finlan
dNew
Zeala
ndDen
mark
United
King
dom
Irelan
dPor
tuga
lUnit
ed S
tates
1997/98 2002/03
Deaths per 100,000 population*
* Countries’ age-standardized death rates, ages 0–74; includes ischemic heart disease.Source: Commonwealth Fund; E. Nolte and C. M. McKee, Measuring the Health of Nations: Updating an Earlier Analysis, Health Affairs, January/February 2008, 27(1):58–71

How do we rate?How do we rate? World Health Organization, 2000 ReportWorld Health Organization, 2000 Report
CountryCountry DALE RankDALE Rank Overall RankOverall RankFranceFrance 4 4 11JapanJapan 99 1010UKUK 2424 1818CubaCuba 3636 3939CanadaCanada 3535 3030
USUS 7272 3737Level of Health=25% Distribution of Health=25% Level of Health=25% Distribution of Health=25% Level of Responsiveness=12.5% Level of Responsiveness=12.5% Distribution of Responsiveness=12.5% Fairness of financing=25%Distribution of Responsiveness=12.5% Fairness of financing=25%

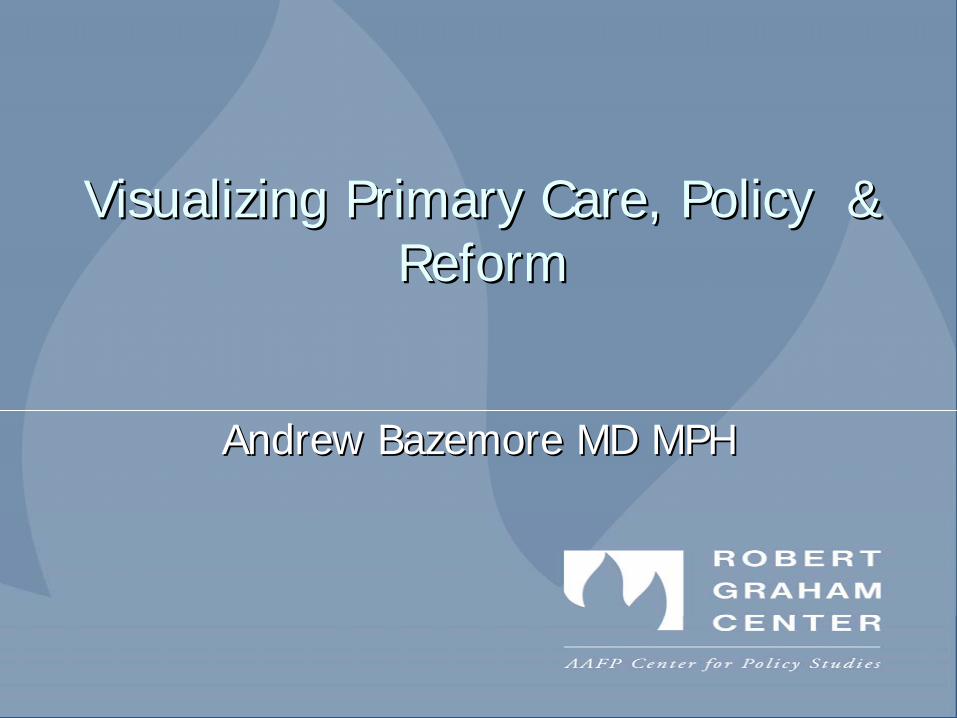
Health ReformHealth Reform……The American WayThe American Way

Zero Sum GameZero Sum Game

What is on the policy radar for What is on the policy radar for primary care in the U.S.?primary care in the U.S.?

Growing Consensus among US Growing Consensus among US policymakers around Primary Care policymakers around Primary Care
ReformReformPipelinePipeline
Workforce & TrainingWorkforce & Training
Payment ReformPayment ReformPCMHPCMH
Reorganization around a Patient Centered Reorganization around a Patient Centered Medical HomeMedical Home
CholskiCholski, NEJM 11/09, NEJM 11/09
Reforming the PC WorkforceReforming the PC Workforce……or or who will you find in the Medical who will you find in the Medical
Home?Home?
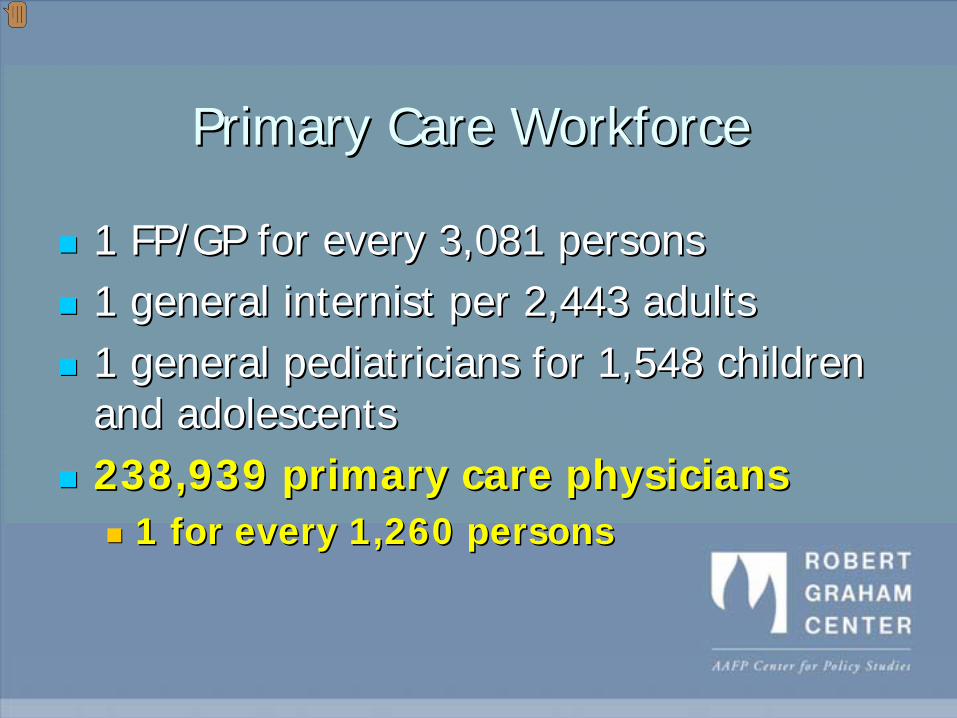
Primary Care WorkforcePrimary Care Workforce
1 FP/GP for every 3,081 persons1 FP/GP for every 3,081 persons1 general internist per 2,443 adults1 general internist per 2,443 adults1 general pediatricians for 1,548 children 1 general pediatricians for 1,548 children and adolescentsand adolescents238,939 primary care physicians238,939 primary care physicians
1 for every 1,260 persons1 for every 1,260 persons
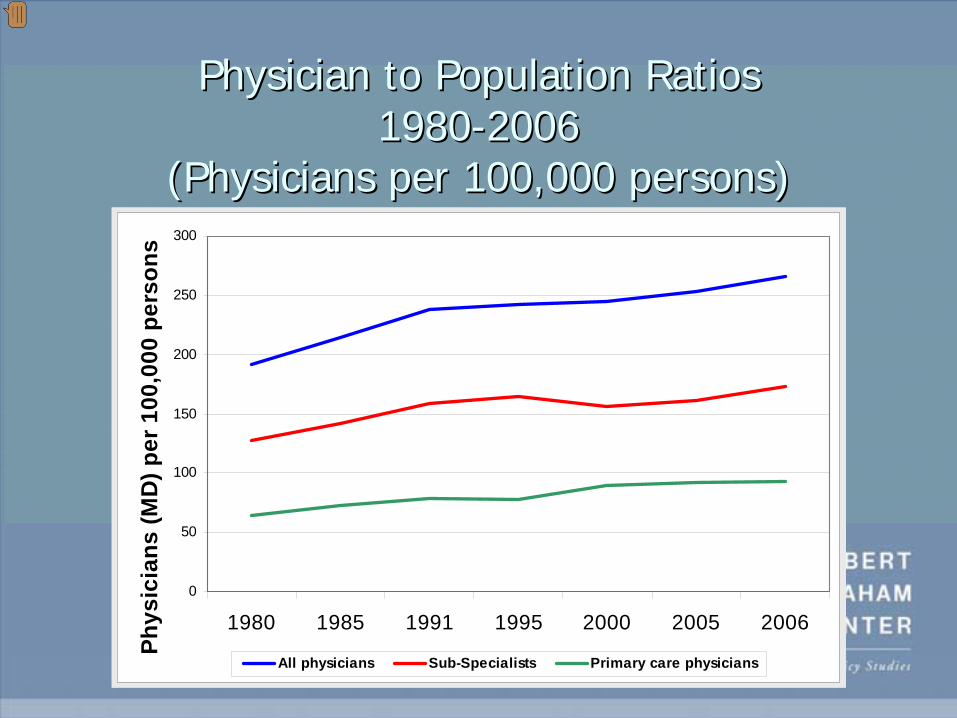
Physician to Population Ratios Physician to Population Ratios 19801980--20062006
(Physicians per 100,000 persons)(Physicians per 100,000 persons)
0
50
100
150
200
250
300
1980 1985 1991 1995 2000 2005 2006
Phys
icia
ns (M
D) p
er 1
00,0
00 p
erso
ns
All physicians Sub-Specialists Primary care physicians

Primary Care Shortage?Primary Care Shortage?
Currently a problem of distribution, Currently a problem of distribution, composition, and scopecomposition, and scope
Still concentrated in desirable areasStill concentrated in desirable areasRelative shortage in underserved and rural Relative shortage in underserved and rural areas, of certain demographics, and of a areas, of certain demographics, and of a complete, uniform basket of servicescomplete, uniform basket of servicesTrue for physicians, NPs and True for physicians, NPs and PAsPAs

Training Pipeline IssuesTraining Pipeline Issues
Market vs. Policy: Can Senate/House Market vs. Policy: Can Senate/House efforts to rebalance Graduate Medical efforts to rebalance Graduate Medical Education to favor primary care overcome Education to favor primary care overcome market realitiesmarket realities……School admission policies, debt, & primary School admission policies, debt, & primary care payment, workload, & prestige all care payment, workload, & prestige all weigh against entry into PCweigh against entry into PC

Status check: Family MedicineStatus check: Family MedicineFamily
Medicine Positions
March, 2008
Filled by US Graduates

MedPAC June 2008
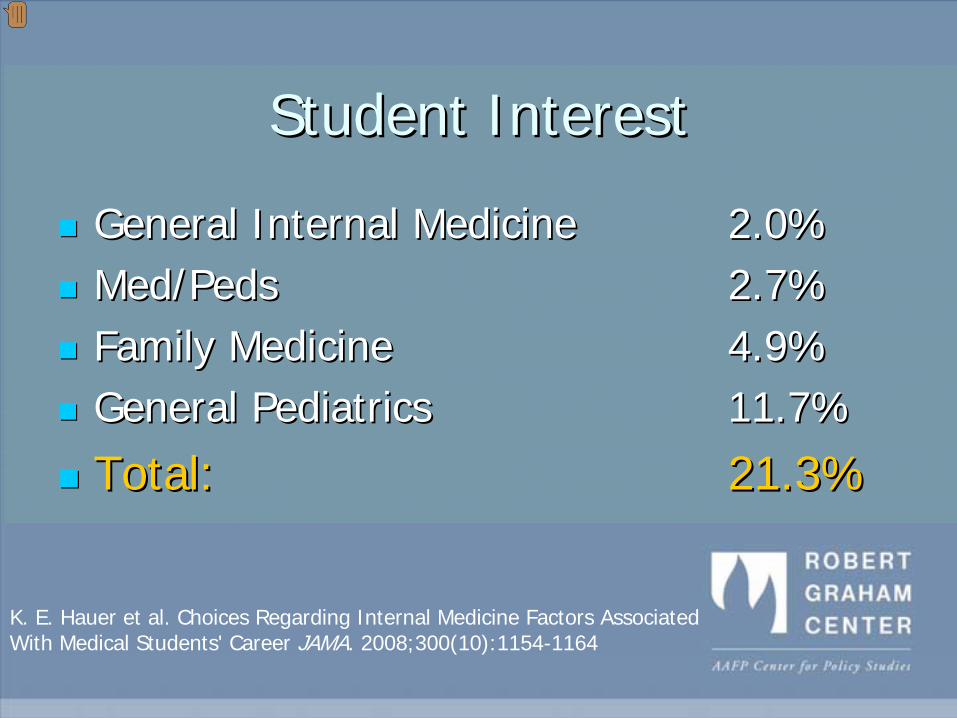
Student InterestStudent Interest
General Internal Medicine General Internal Medicine 2.0%2.0%Med/Med/PedsPeds 2.7%2.7%Family MedicineFamily Medicine 4.9%4.9%General PediatricsGeneral Pediatrics 11.7%11.7%
Total: Total: 21.3%21.3%
K. E. Hauer et al. Choices Regarding Internal Medicine Factors Associated With Medical Students' Career JAMA. 2008;300(10):1154-1164

M. H. Ebell. Future Salary and US Residency Fill Rate RevisitedJAMA. 2008;300
Income Disparity affects Choice
True in 1989, true now
Is that a surprise?
Income Gap?
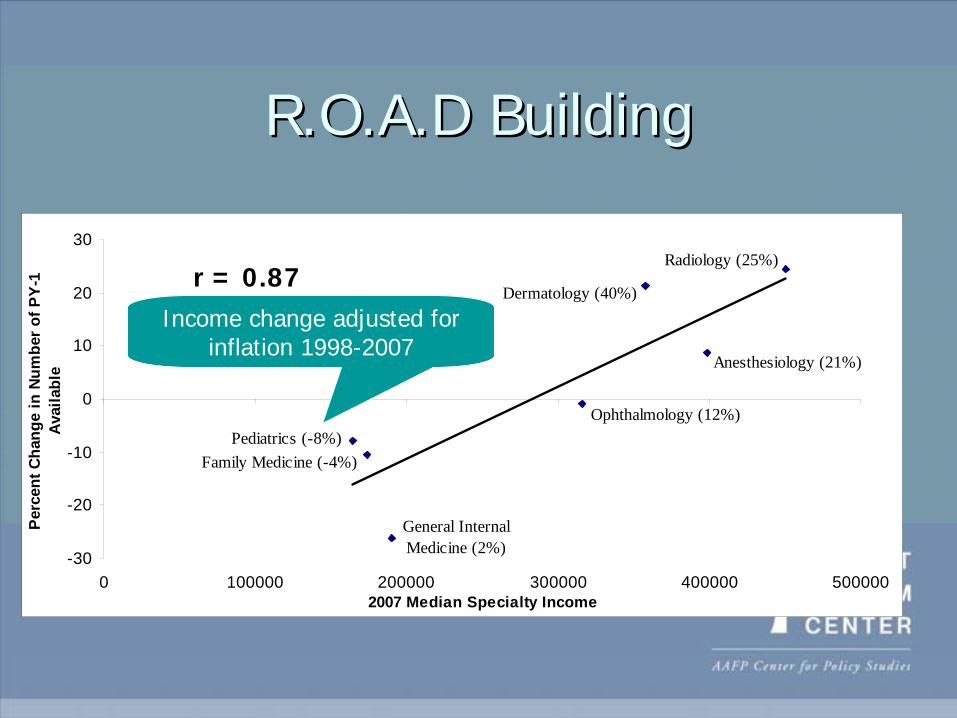
R.O.A.D BuildingR.O.A.D Building
Anesthesiology (21%)
Dermatology (40%)
Radiology (25%)
Ophthalmology (12%)
Family Medicine (-4%)Pediatrics (-8%)
General Internal Medicine (2%)-30
-20
-10
0
10
20
30
0 100000 200000 300000 400000 5000002007 Median Specialty Income
Perc
ent C
hang
e in
Num
ber o
f PY-
1 Av
aila
ble
r = 0.87Income change adjusted for
inflation 1998-2007

Reliance on International Medical Reliance on International Medical GraduatesGraduates
IM
Anesthesiology
Family Medicine
OBGYN
IM Sub-specialties
General Surgery
Pathology
Physical MedPsychiatry
Pediatrics
-1000
-500
0
500
1000
1500
2000
Source: JAMA Medical Education Issues, Ed Salsberg, AAMC
Change in Number of IMGs in Training 2002-2006
Decline in interest among US graduates
Growth of subspecialty positions

Training Pipeline IssuesTraining Pipeline Issues
Market vs. Policy: Can Senate/House Market vs. Policy: Can Senate/House efforts to rebalance Graduate Medical efforts to rebalance Graduate Medical Education to favor primary care overcome Education to favor primary care overcome market realitiesmarket realities……School admission policies, debt, & primary School admission policies, debt, & primary care payment, workload, & prestige all care payment, workload, & prestige all weigh against entry into PCweigh against entry into PC

But there is But there is evidence of evidence of
the the effectiveness effectiveness
of policy of policy across the across the
primary care primary care pipelinepipeline

PaymentPayment
Primary care is increasingly pushed away Primary care is increasingly pushed away from broad scopefrom broad scope

‘‘Nothing new under the sunNothing new under the sun’’ –– PCMH as Political ConstructPCMH as Political Construct

PCMHPCMH
Attitude and Cultural ChangesAttitude and Cultural Changes
Team based careTeam based careAsynchronous communicationAsynchronous communicationPopulation basedPopulation basedProactiveProactivePatient centeredPatient centered
Process & Structural ChangesProcess & Structural Changes
Open accessOpen accessEMREMRGroup visitsGroup visitsQI initiativesQI initiatives
31
• See also: Nutting, et.al. Annals of FamilyMedicine; Vol. 7, No. 3; May/June 2009

Policymakers & NumbersPolicymakers & Numbers
'A low voter turnout is an indication of fewer 'A low voter turnout is an indication of fewer people going to the polls'.people going to the polls'.
--George W Bush [George W Bush [FmrFmr. President USA] . President USA]

““Like elaborately plumed birdsLike elaborately plumed birds…… we preen and strut and display we preen and strut and display
our tour t--valuesvalues””
--Edward Edward LeamerLeamer, UCLA Economist, UCLA Economist
Repacking Evidence for Delivery to Repacking Evidence for Delivery to Policymakers requires creativityPolicymakers requires creativity
……and thinking like a 3rd graderand thinking like a 3rd grader

Meeting in the middle: Meeting in the middle: HSR and the PolicymakerHSR and the Policymaker
OneOne--pagerspagers: Policy briefs anchored around : Policy briefs anchored around a single piece of evidencea single piece of evidenceRGC UpdateRGC Update: Annually updated, : Annually updated, annotated, referenced policy evidence annotated, referenced policy evidence summariessummariesFactsheetsFactsheets: State, School or Residency : State, School or Residency level level HealthLandscapeHealthLandscape: GIS engine for : GIS engine for the common manthe common man

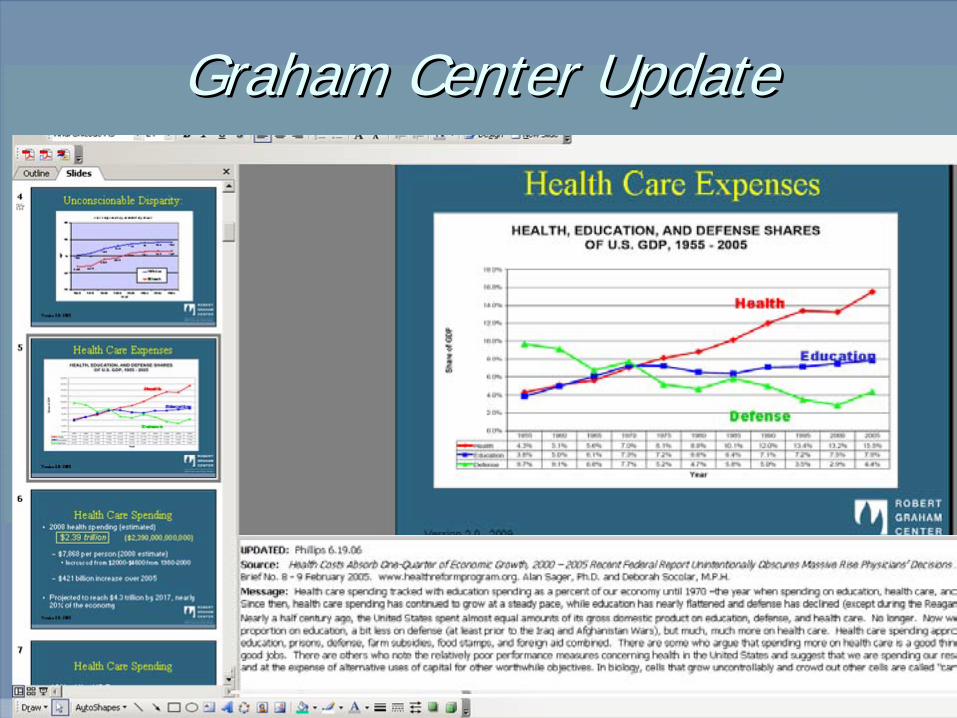
Graham Center UpdateGraham Center Update

Reframing the GP for the policy Reframing the GP for the policy audienceaudience…… as Economic Stimulus?as Economic Stimulus?
Impact per Family Impact per Family Physician/year Physician/year
(average)(average)
$904,696$904,696
Range (state to state)Range (state to state) $660,392 $660,392 -- $1,259,838$1,259,838
Total Nationwide Total Nationwide Impact per yearImpact per year
$46,183,968,060$46,183,968,060

……and considering novel or effective and considering novel or effective visual displayvisual display

The Power of Mapped DataThe Power of Mapped Data

Creating Data Layers . . . linking digital data to “geography”
Creating Data LayersCreating Data Layers . . . linking digital data to . . . linking digital data to ““geographygeography””
Street AddressesStreets/Rivers/Land FeaturesHospital/Medical Center/ ClinicsZip Codes/CountiesSpatial Analysis – (i.e.travel times)Service Demand/Provider Density
Street AddressesStreet AddressesStreets/Rivers/Land FeaturesStreets/Rivers/Land FeaturesHospital/Medical Center/ ClinicsHospital/Medical Center/ ClinicsZip Codes/CountiesZip Codes/CountiesSpatial Analysis Spatial Analysis –– (i.e.travel times)(i.e.travel times)Service Demand/Provider DensityService Demand/Provider Density

Physician to Population Ratios Physician to Population Ratios 19801980--20062006
(Physicians per 100,000 persons)(Physicians per 100,000 persons)
0
50
100
150
200
250
300
1980 1985 1991 1995 2000 2005 2006
Phys
icia
ns (M
D) p
er 1
00,0
00 p
erso
ns
All physicians Sub-Specialists Primary care physicians


Residency FootprintResidency Footprint
Virginia Commonwealth University Residency Graduates

““FootprintingFootprinting”” Training Sites Training Sites –– Residency Residency & Medical School Social Accountability& Medical School Social Accountability

Localizing & Translating Complex Localizing & Translating Complex AnalysisAnalysis……

Customizing Data: Logical Next Customizing Data: Logical Next StepStep
WebWeb--based mapping toolsbased mapping toolsBridges Technology/Cost barriers for usersBridges Technology/Cost barriers for usersPuts Puts ‘‘dormantdormant’’ data (Provider data, HPSA, data (Provider data, HPSA, Census, Political Boundaries, etc.) in the Census, Political Boundaries, etc.) in the hands of grassroots primary care users and hands of grassroots primary care users and advocatesadvocatesResearch & Planning Applications: Expand Research & Planning Applications: Expand downstream as users multiply, data is pooleddownstream as users multiply, data is pooled


Putting primary care clinics on the Putting primary care clinics on the mapmap
Much policymaking and planning is localMuch policymaking and planning is localClinicians and regional planners think in Clinicians and regional planners think in context of community & geographycontext of community & geographyBut lack tools to understand But lack tools to understand
Gaps in access, service deliveryGaps in access, service deliveryImpacts of social determinants of health on Impacts of social determinants of health on clinical outcomesclinical outcomes


Understanding WHERE We ServeUnderstanding WHERE We ServeUnity Service Area (2007)Unity Service Area (2007)
(Service Area Threshold 70%)(Service Area Threshold 70%)N= 77,400N= 77,400

Unity Patients with AsthmaUnity Patients with Asthma-- Ages <17 years (2006)Ages <17 years (2006)
ICD9 used: 493ICD9 used: 493
Avoidable Hospitalizations Avoidable Hospitalizations Ages <17 years (2002)Ages <17 years (2002)
(DCPCA 2003)(DCPCA 2003)
Quality ImprovementQuality Improvement

ConclusionsConclusions
U.S. Health Reform Train is speeding forwardU.S. Health Reform Train is speeding forward……Alongside a 1000 foot chasmAlongside a 1000 foot chasmOn a rusty & poorly maintained trackOn a rusty & poorly maintained trackPrimary & Preventive Care (not PHC) are Primary & Preventive Care (not PHC) are nominally central to Reformnominally central to ReformBarring derailment, weBarring derailment, we’’ll see real changes to PC ll see real changes to PC Access, Payment and InfrastructureAccess, Payment and InfrastructureBut not significant enoughBut not significant enough…… as in as in Massachusetts, Cost & QI will still demand Massachusetts, Cost & QI will still demand solutionssolutions

ConclusionsConclusions
We are as liable for the lack of evidence based We are as liable for the lack of evidence based policymaking as the policymakerspolicymaking as the policymakersCommunication of results demands creativity Communication of results demands creativity and thoughtful communicationand thoughtful communicationHealth Services & Outcomes vary regionally and Health Services & Outcomes vary regionally and even at the practice leveleven at the practice level…… and and Politics are localPolitics are localConsider spatial analytic tools and aspects of Consider spatial analytic tools and aspects of your work, andyour work, andBe back here at 2PM if you want to hear moreBe back here at 2PM if you want to hear more……