Embed Size (px)
Citation preview
Visualizing Plant Development and Gene Expression in ThreeDimensions Using Optical Projection Tomography W
Karen Lee,a Jerome Avondo,b Harris Morrison,c Lilian Blot,b Margaret Stark,d James Sharpe,c
Andrew Bangham,b and Enrico Coena,1
a Department of Cell and Developmental Biology, John Innes Centre, Norwich Research Park, Norwich, NR4 7UH United Kingdomb School of Computing Sciences, University of East Anglia, Norwich, NR4 7TJ United KingdomcOptical Projection Tomography Group, Medical Research Council Human Genetics Unit, Western General Hospital, Edinburgh,
EH4 2XU United Kingdomd Edinburgh Mouse Atlas Group, Medical Research Council Human Genetics Unit, Western General Hospital, Edinburgh, EH4 2XU
United Kingdom
A deeper understanding of the mechanisms that underlie plant growth and development requires quantitative data on three-
dimensional (3D) morphology and gene activity at a variety of stages and scales. To address this, we have explored the use
of optical projection tomography (OPT) as a method for capturing 3D data from plant specimens. We show that OPT can be
conveniently applied to a wide variety of plant material at a range of scales, including seedlings, leaves, flowers, roots,
seeds, embryos, and meristems. At the highest resolution, large individual cells can be seen in the context of the
surrounding plant structure. For naturally semitransparent structures, such as roots, live 3D imaging using OPT is also
possible. 3D domains of gene expression can be visualized using either marker genes, such as b-glucuronidase, or more
directly by whole-mount in situ hybridization. We also describe tools and software that allow the 3D data to be readily
quantified and visualized interactively in different ways.
INTRODUCTION
A major aim of developmental biology is to understand how the
three-dimensional (3D) morphology of organisms arises through
molecular and cellular mechanisms. However, traditional anat-
omical and molecular studies of plant development have mainly
relied on two-dimensional (2D) images. 3D properties of plant
structures are often inferred indirectly by semiquantitative ex-
trapolations from 2D information. Although this may be sufficient
for some aspects of plant biology, understanding of plant growth
and function increasingly requiresquantitative3Ddata.Thispres-
ents twomajor challenges. First, we need convenient methods to
acquire 3D digital images. Second, software tools are needed
that allow 3D images to be readily visualized, interrogated, and
quantified.
Various approaches have been used to gain 3D information
from plants with a variety of resolutions along the different axes
(x, y, and z). Several of these techniques use optical methods. An
example is 3D reconstructions from a series of microtome sec-
tions (Fiala, 2005). Resolution along the x and y axes is limited by
the wavelength of visible light (;0.5 mm), whereas resolution
along the z axis depends on the thickness of the sections (typi-
cally 5 to 10 mm). Serial sectioning has the advantage that gene
activity and histological stains can be readily viewed. However,
the procedure is laborious and prone to alignment errors. Con-
focal microscopy addresses many of these issues and has a
resolution limit of 0.3 mm 3 0.3 mm 3 0.5 mm (Liu and Chiang,
2003; Jonsson et al., 2006). However, this method is limited by
the overall thickness of the specimen that can be visualized:
image quality decreases rapidly for optical sections deeper than
60 to 80 mm (Haseloff et al., 1997). The depth can be extended at
the expense of spatial resolution using optical coherence mi-
croscopy (OCM). OCM was used to obtain 3D images of whole
growing Arabidopsis thaliana plants and single cells at a resolu-
tion of 3 mm3 3 mm3 5 mm and a maximum specimen depth of
2 to 3 mm. OCM provides a means of continuously monitoring
plants and plant cells throughout development and in response
to exogenous stimuli (Hettinger et al., 2000; Reeves et al., 2002).
More recently, OCMhas been used in animal systems to obtain a
resolution of 1mm3 1mm3 1mm,with a depth of 10mm (Greive
et al., 2005). Selective plane illumination microscopy also over-
comes depth restrictions using a sheet of laser light 2 to 8 mm
thick to section a sample optically. Protein expression patterns
within living embryos were captured with a resolution of 6 mm3
6 mm3 6 mm, to a depth of 500 mm, using this method (Huisken
et al., 2004). Saturated structured-illumination microscopy has
been used to obtain 2D images beyond diffraction limitations
with resolutions to 50 nm (Gustafsson, 2005). 3D images of the
actin cytoskeleton of a human neutrophil were obtained using
this technique (http://msg.ucsf.edu:8100/;mats/).
Depth restrictions can also be overcome usingmethods based
onmagnetic resonance or types of radiation that penetrate deeper
1 To whom correspondence should be addressed. E-mail [email protected]; fax 44-01603-450045.The author responsible for distribution of materials integral to thefindings presented in this article in accordance with the policy describedin the Instructions for Authors (www.plantcell.org) is: Enrico Coen([email protected]).WOnline version contains Web-only data.www.plantcell.org/cgi/doi/10.1105/tpc.106.043042
The Plant Cell, Vol. 18, 2145–2156, September 2006, www.plantcell.orgª 2006 American Society of Plant Biologists
into specimens. However, this is at the expense of resolution.
Magnetic resonance imaging (MRI) offers live imaging without
depth restrictionandcan resolvedown to20mm320mm31.5mm
(Holbrook et al., 2001). Although it is possible to view gene
expression patterns by MRI using contrast agents that can
indicate reporter expression in living animals (Louie et al., 2000),
this process is not well suited for general applications (Ruijter
et al., 2004). The x-ray high-resolution computed tomography
(HRCT) allows live imaging to a resolution of 13 mm (http://www.
mouseimaging.ca/research/gallery_microct_placenta.html).How-
ever HRCT depends on the contrast between the x-ray absorp-
tion coefficient of the material and does not allow gene
expression to be captured (Stuppy et al., 2003). Gene expression
in living animals has also been visualized using positron emission
tomography; however, this method only achieves resolutions of
1.8mm31.8mm31.8mm(Gambhir etal., 1999).MRI,HRCT,and
positron emission tomography do not allow the visualization of
existing histological stains commonly used for light microscopy.
Another method, not previously used with plants, is optical
projection tomography (OPT). OPT has the advantages of optical
methods, but with greater penetration and the ability to generate
3D images of nonfluorescent signals (such as the blue precipitate
from X-Gal). This allows it to capture gene expression and his-
tology using traditional tissue stains to a resolution of 5 mm 3
5mm3 5mmwithin the 3D context of whole embryos and organs
between 0.5 and 15 mm in depth (Sharpe et al., 2002; Sharpe,
2003). A further advantage of OPT is that the scanner is relatively
inexpensive (currently approximately one-quarter of the price of
a confocal microscope). A disadvantage of optical techniques,
including OPT, is that large specimens typically need to be
cleared with an organic solvent, precluding live imaging in most
cases. The 3D information about a specimen can be collected in
two ways. In fluorescence OPT, the specimen is illuminated with
UV light and the signal depends on the fluorescence of stains and
markers or the autofluorescence of the tissue. In transmission
OPT, visible light is shone through the specimen and the signal
depends on the amount of light absorbed. To date, OPT has been
applied to numerous vertebrate systems, including mouse
(Sharpe et al., 2002; Sharpe, 2003, 2004; Wilkie et al., 2004;
Walls et al., 2005; Takeuchi et al., 2005), human (Kerwin et al.,
2004; Lickert et al., 2004; Lindsay andCopp, 2005; Lindsay et al.,
2005; Sarma et al., 2005), zebrafish (Bryson-Richardson
and Currie, 2004), chick (Tickle, 2004), and frog (Tyszka et al.,
2005).
One general problem in dealing with volumetric data obtained
fromOPT and other methods is the need to visualize and analyze
the information.When creating software tools, there is a trade-off
between flexibility and ease of use. One approach is to provide a
flexible software environment that tries to address most issues
found in the visualization and analysis of volumetric data, inde-
pendent of the field of science. A disadvantage is the time taken
for users to develop packages that are appropriate for their prob-
lem. Successful examples of such software packages are AMIRA
(http://www.tgs.com/),VTK(http://public.kitware.com/VTK/),and
AVS (http://www.avs.com/). The second approach is to produce
solutions tailored to each type of volumetric data. For example,
MAPaint has been devised to allow manual painting of regions
of interest in 3D data sets (Baldock et al., 2003). We use a
Figure 1. OPT Data Reconstructed and Displayed as Volumes.
(A) OPT volume views of an Antirrhinum flower. The image is based on a combination of transmission and fluorescence OPT (Leica TXR filter and GFP1
filters). Bar ¼ 525 mm.
(B) Antirrhinum vegetative meristem imaged by fluorescence OPT (GFP1 filter). Bar ¼ 85 mm.
(C) First true leaves of an Arabidopsis seedling showing trichome cells on the adaxial leaf surface (cotyledons removed). The image was taken with
fluorescence OPT (GFP1 filter). Bar ¼ 285 mm.
(D) Part of an Arabidopsis silique imaged by fluorescence OPT (TXR filter). Bar ¼ 42 mm.
2146 The Plant Cell

combination of these approaches to develop generally applica-
ble software that allows interactive visualization and interroga-
tion of 3D data of the kind generated by OPT.
Here, we explore the use of OPT for obtaining 3D data from
plant material. We show that plant structures at a range of scales
provide ideal material for visualization by OPT. The method
provides a convenient means to examine 3D morphology and
gene expression patterns of Arabidopsis and Antirrhinum majus
plant structures. OPT allows the 3D analysis of large, thick
specimens, with visualization of large cells. However subcellular
structures and small cells are not resolvable. In the case of
Arabidopsis roots, it is also possible to use OPT for live imaging.
We also present QtVolView as a general software solution par-
ticularly suited for the interactive visualization and quantitative
analysis of OPT data sets
RESULTS
Visualization of OPT Data from Plants
To explore the possibility of using OPT on plant material, spec-
imens were cleared and photographed using the OPT device.
Specimens were illuminated with visible light (transmission OPT)
or UV light with associated filters (fluorescence OPT). In most
cases, illumination with UV light was most effective for revealing
tissue structure. The specimen was rotated about its main axis in
steps of 0.98 and an image was taken at each step, giving 400
imagesper scan. This allowed the information for theentire speci-
men to be reconstructed as a 3D digital image (Sharpe et al.,
2002). A 3D digital image consists of a set of volume units, called
voxels (just as a 2D digital image comprises a set of pixels).
Collectively, these voxels carry quantitative information for the
entire volume of the specimen, from its internal structures to the
outer surface. Voxel size is measured along three directions (x, y,
and z). Software was developed to facilitate viewing and quan-
tification of the OPT data in various ways.
The specimen could be viewed interactively without significant
time delays, at 10 to 15 frames per second, from any position in
3D space. Examples of such volume views for floral buds, api-
ces, seedlings, and fruits are shown in Figures 1A to 1D. The
viewing point could be varied continuously, improving the user’s
overall sense of the 3D structure of the specimen. Two sample
views are shown for a flower bud in Figure 1A. The QtVolView
program was used to calculate voxel sizes obtained by OPT. A
range of scales was obtained, from 28 to 1 mm3/voxel.
Volume views have the disadvantage that structures nearer to
the viewing point can occlude those farther away. One way of
circumventing this problem is to cut away some of the structure
using standard clipping planes. This can reveal more detail about
internal structure. For example, by cutting away part of the flower
bud, the internal organs (stamens, carpels) were revealed (Figure
2A). Similarly, primordia, vasculature, and ovules were revealed
Figure 2. Clipping to Reveal Internal Morphology.
(A) Virtual dissection using clipping planes of the Antirrhinum flower shown in Figure 1A reveals internal floral structures such as anther lobes
(arrowheads) and the ovary at the base of the carpel (asterisk). Pollen is more autofluorescent than the surrounding tissues, making the anthers appear
brighter. Bars ¼ 200 mm (left) and 365 mm (right).
(B) Clipping plane through the center of the Antirrhinum shoot apical meristem. Bar ¼ 55 mm.
(C) An Arabidopsis seedling clipped to display vasculature. Vasculature is more autofluorescent than the surrounding tissue, making it appear brighter.
Bar ¼ 100 mm.
(D) An Arabidopsis silique (from Figure 1D) clipped to reveal internal structure. A piece was removed using three clipping planes to show the seeds
developing within. The removed piece is shown at left. Individual seeds were also dissected out using six clipping planes to display the heart-stage
embryo (arrowhead) and endosperm within (two examples shown at right). Bar ¼ 35 mm.
3D Development and Gene Expression 2147
by clipping an apex, seedling, and silique, respectively (Figures
2B to 2D).
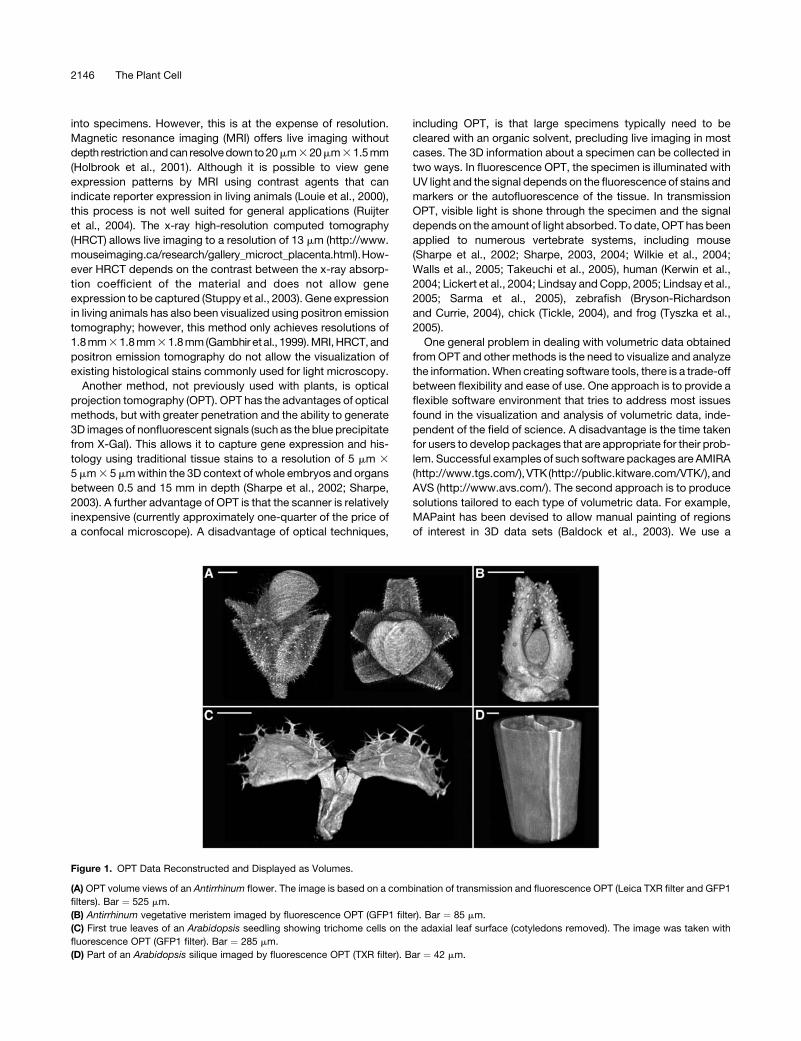
It was also possible to generate slices through the specimen,
equivalent to histological sections. Sections of any thickness
could be generated using two parallel clipping planes separated
by the required thickness. Sections one voxel thick could also be
generated by specifying a single plane and visualizing the voxels
that intersect it (Figures 3A to 3F).
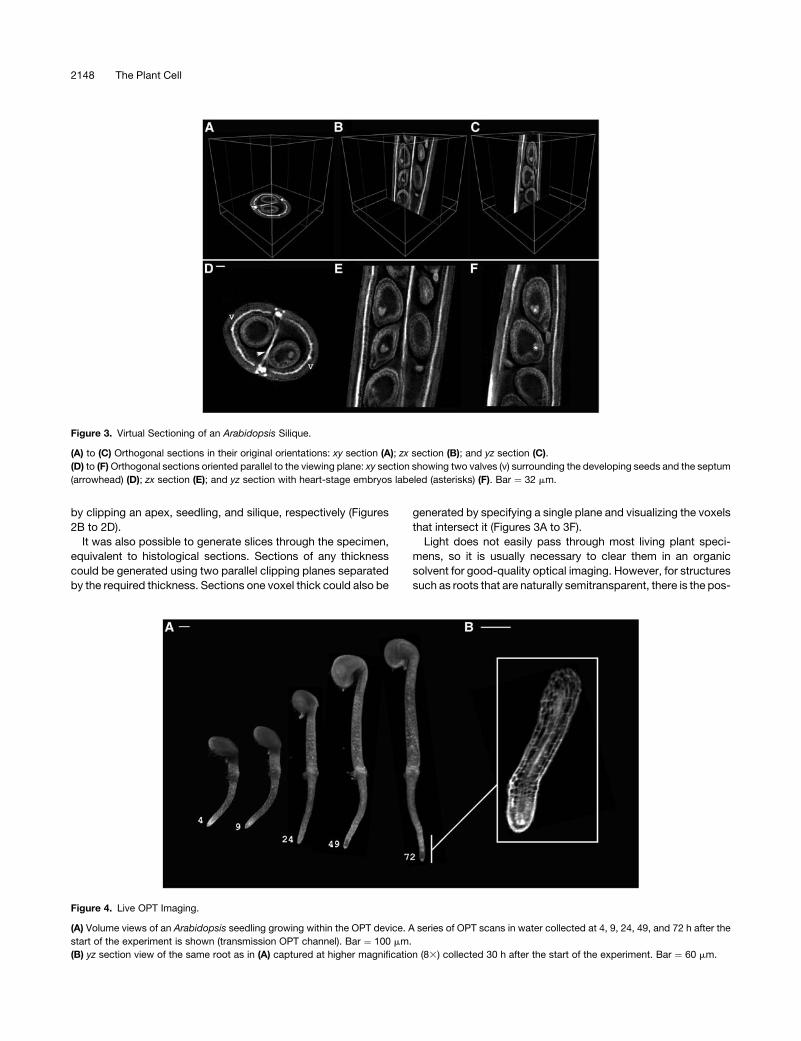
Light does not easily pass through most living plant speci-
mens, so it is usually necessary to clear them in an organic
solvent for good-quality optical imaging. However, for structures
such as roots that are naturally semitransparent, there is the pos-
Figure 3. Virtual Sectioning of an Arabidopsis Silique.
(A) to (C) Orthogonal sections in their original orientations: xy section (A); zx section (B); and yz section (C).
(D) to (F)Orthogonal sections oriented parallel to the viewing plane: xy section showing two valves (v) surrounding the developing seeds and the septum
(arrowhead) (D); zx section (E); and yz section with heart-stage embryos labeled (asterisks) (F). Bar ¼ 32 mm.
Figure 4. Live OPT Imaging.
(A) Volume views of an Arabidopsis seedling growing within the OPT device. A series of OPT scans in water collected at 4, 9, 24, 49, and 72 h after the
start of the experiment is shown (transmission OPT channel). Bar ¼ 100 mm.
(B) yz section view of the same root as in (A) captured at higher magnification (83) collected 30 h after the start of the experiment. Bar ¼ 60 mm.
2148 The Plant Cell
sibility of collecting OPT data from living tissue without fixing and
clearing. To achieve this, an Arabidopsis seed was embedded in
agarose, allowed to germinate, and transferred into the OPT
device, where it grew submerged in water. OPT images of the
germinating seedling were collected several times during a 72-h
growth period. The seedling was transparent enough to allow
reliable 3D reconstruction without fixation and clearing (see vol-
ume views in Figure 4A). Thus, it is possible to useOPT for live 3D
imaging for naturally semitransparent material. At higher magni-
fications, larger individual cells within the root could be identified,
raising the possibility of using OPT to extract detailed growth
dynamics (Figure 4B).
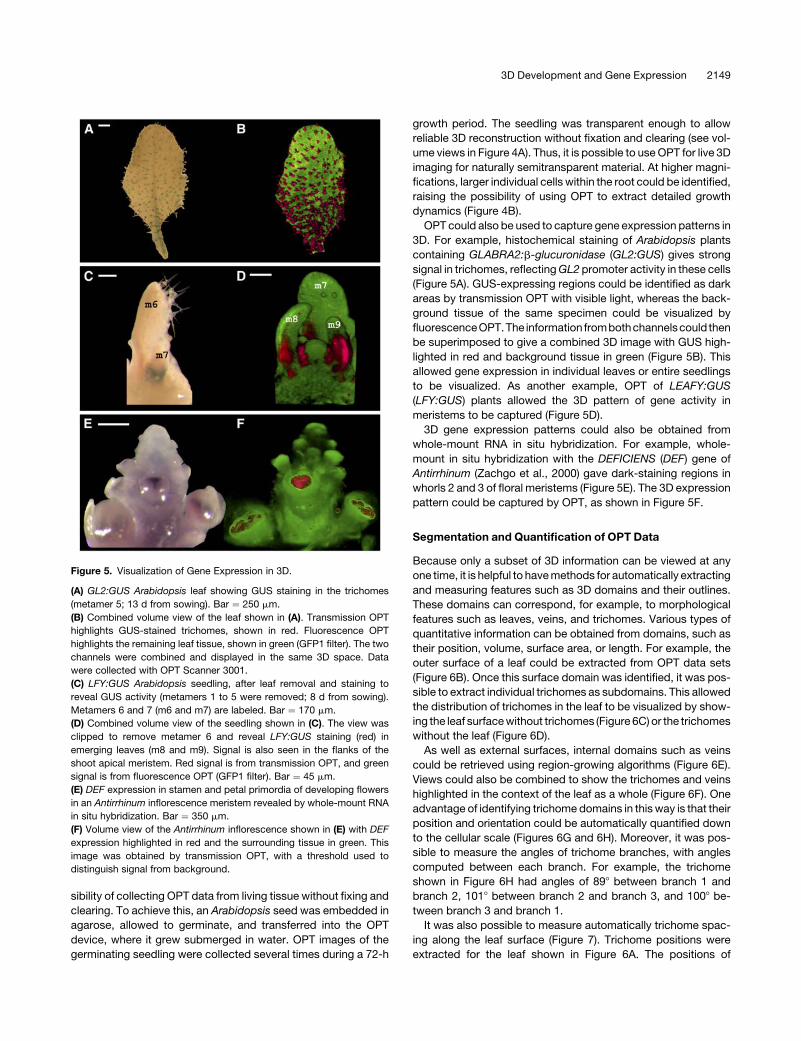
OPT could also be used to capture gene expression patterns in
3D. For example, histochemical staining of Arabidopsis plants
containing GLABRA2:b-glucuronidase (GL2:GUS) gives strong
signal in trichomes, reflectingGL2 promoter activity in these cells
(Figure 5A). GUS-expressing regions could be identified as dark
areas by transmission OPT with visible light, whereas the back-
ground tissue of the same specimen could be visualized by
fluorescenceOPT.The information frombothchannelscould then
be superimposed to give a combined 3D image with GUS high-
lighted in red and background tissue in green (Figure 5B). This
allowed gene expression in individual leaves or entire seedlings
to be visualized. As another example, OPT of LEAFY:GUS
(LFY:GUS) plants allowed the 3D pattern of gene activity in
meristems to be captured (Figure 5D).
3D gene expression patterns could also be obtained from
whole-mount RNA in situ hybridization. For example, whole-
mount in situ hybridization with the DEFICIENS (DEF) gene of
Antirrhinum (Zachgo et al., 2000) gave dark-staining regions in
whorls 2 and 3 of floral meristems (Figure 5E). The 3D expression
pattern could be captured by OPT, as shown in Figure 5F.
Segmentation and Quantification of OPT Data
Because only a subset of 3D information can be viewed at any
one time, it is helpful to havemethods for automatically extracting
and measuring features such as 3D domains and their outlines.
These domains can correspond, for example, to morphological
features such as leaves, veins, and trichomes. Various types of
quantitative information can be obtained from domains, such as
their position, volume, surface area, or length. For example, the
outer surface of a leaf could be extracted from OPT data sets
(Figure 6B). Once this surface domain was identified, it was pos-
sible to extract individual trichomes as subdomains. This allowed
the distribution of trichomes in the leaf to be visualized by show-
ing the leaf surfacewithout trichomes (Figure 6C) or the trichomes
without the leaf (Figure 6D).
As well as external surfaces, internal domains such as veins
could be retrieved using region-growing algorithms (Figure 6E).
Views could also be combined to show the trichomes and veins
highlighted in the context of the leaf as a whole (Figure 6F). One
advantage of identifying trichome domains in this way is that their
position and orientation could be automatically quantified down
to the cellular scale (Figures 6G and 6H). Moreover, it was pos-
sible to measure the angles of trichome branches, with angles
computed between each branch. For example, the trichome
shown in Figure 6H had angles of 898 between branch 1 and
branch 2, 1018 between branch 2 and branch 3, and 1008 be-
tween branch 3 and branch 1.
It was also possible to measure automatically trichome spac-
ing along the leaf surface (Figure 7). Trichome positions were
extracted for the leaf shown in Figure 6A. The positions of
Figure 5. Visualization of Gene Expression in 3D.
(A) GL2:GUS Arabidopsis leaf showing GUS staining in the trichomes
(metamer 5; 13 d from sowing). Bar ¼ 250 mm.
(B) Combined volume view of the leaf shown in (A). Transmission OPT
highlights GUS-stained trichomes, shown in red. Fluorescence OPT
highlights the remaining leaf tissue, shown in green (GFP1 filter). The two
channels were combined and displayed in the same 3D space. Data
were collected with OPT Scanner 3001.
(C) LFY:GUS Arabidopsis seedling, after leaf removal and staining to
reveal GUS activity (metamers 1 to 5 were removed; 8 d from sowing).
Metamers 6 and 7 (m6 and m7) are labeled. Bar ¼ 170 mm.
(D) Combined volume view of the seedling shown in (C). The view was
clipped to remove metamer 6 and reveal LFY:GUS staining (red) in
emerging leaves (m8 and m9). Signal is also seen in the flanks of the
shoot apical meristem. Red signal is from transmission OPT, and green
signal is from fluorescence OPT (GFP1 filter). Bar ¼ 45 mm.
(E) DEF expression in stamen and petal primordia of developing flowers
in an Antirrhinum inflorescence meristem revealed by whole-mount RNA
in situ hybridization. Bar ¼ 350 mm.
(F) Volume view of the Antirrhinum inflorescence shown in (E) with DEF
expression highlighted in red and the surrounding tissue in green. This
image was obtained by transmission OPT, with a threshold used to
distinguish signal from background.
3D Development and Gene Expression 2149
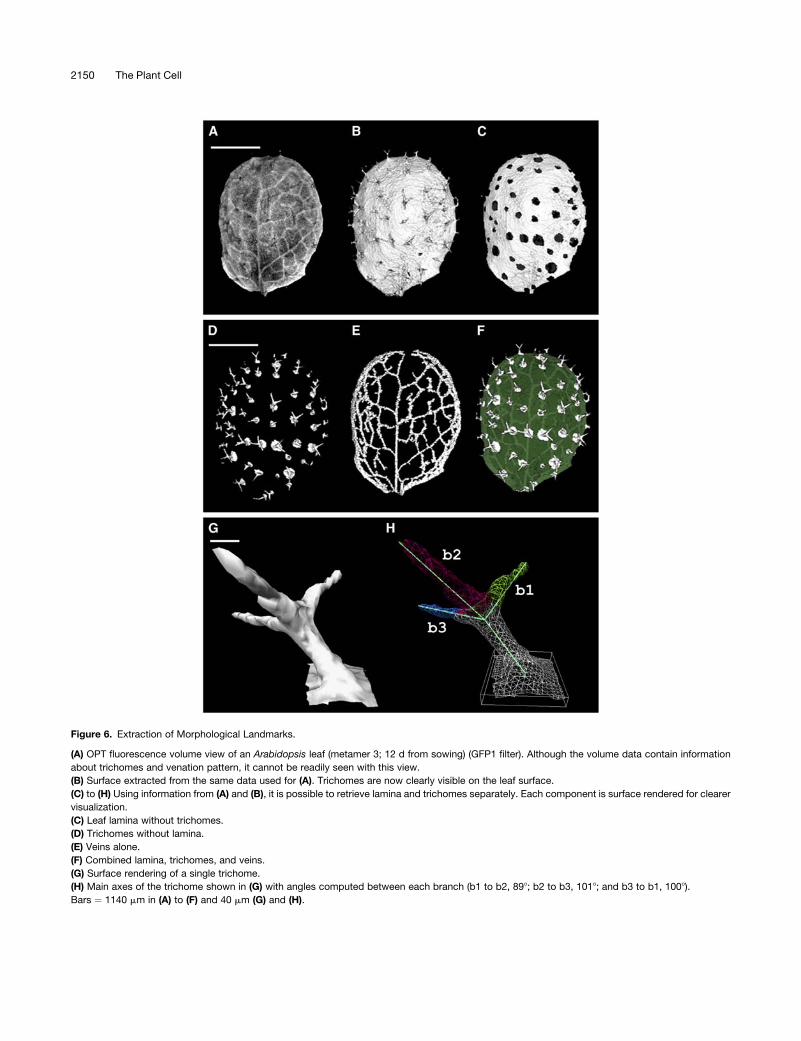
Figure 6. Extraction of Morphological Landmarks.
(A) OPT fluorescence volume view of an Arabidopsis leaf (metamer 3; 12 d from sowing) (GFP1 filter). Although the volume data contain information
about trichomes and venation pattern, it cannot be readily seen with this view.
(B) Surface extracted from the same data used for (A). Trichomes are now clearly visible on the leaf surface.
(C) to (H) Using information from (A) and (B), it is possible to retrieve lamina and trichomes separately. Each component is surface rendered for clearer
visualization.
(C) Leaf lamina without trichomes.
(D) Trichomes without lamina.
(E) Veins alone.
(F) Combined lamina, trichomes, and veins.
(G) Surface rendering of a single trichome.
(H) Main axes of the trichome shown in (G) with angles computed between each branch (b1 to b2, 898; b2 to b3, 1018; and b3 to b1, 1008).
Bars ¼ 1140 mm in (A) to (F) and 40 mm (G) and (H).
2150 The Plant Cell
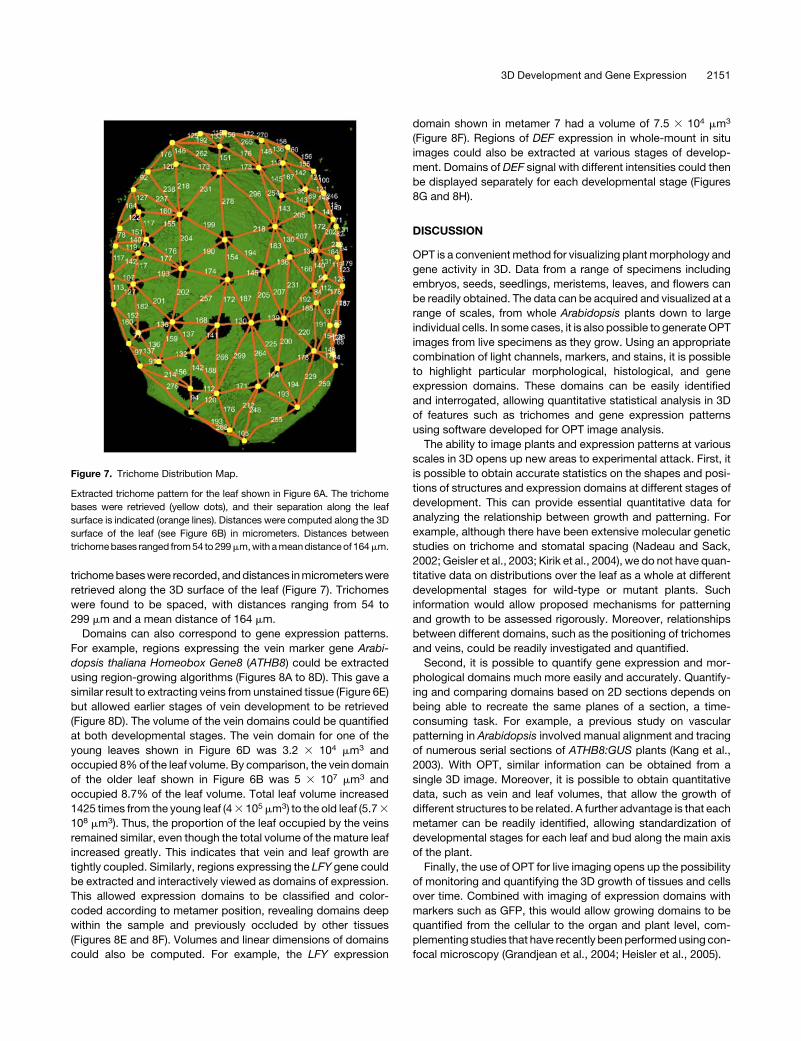
trichomebaseswere recorded, anddistances inmicrometerswere
retrieved along the 3D surface of the leaf (Figure 7). Trichomes
were found to be spaced, with distances ranging from 54 to
299 mm and a mean distance of 164 mm.
Domains can also correspond to gene expression patterns.
For example, regions expressing the vein marker gene Arabi-
dopsis thaliana Homeobox Gene8 (ATHB8) could be extracted
using region-growing algorithms (Figures 8A to 8D). This gave a
similar result to extracting veins from unstained tissue (Figure 6E)
but allowed earlier stages of vein development to be retrieved
(Figure 8D). The volume of the vein domains could be quantified
at both developmental stages. The vein domain for one of the
young leaves shown in Figure 6D was 3.2 3 104 mm3 and
occupied 8%of the leaf volume. By comparison, the vein domain
of the older leaf shown in Figure 6B was 5 3 107 mm3 and
occupied 8.7% of the leaf volume. Total leaf volume increased
1425 times from the young leaf (43 105mm3) to the old leaf (5.73
108 mm3). Thus, the proportion of the leaf occupied by the veins
remained similar, even though the total volume of themature leaf
increased greatly. This indicates that vein and leaf growth are
tightly coupled. Similarly, regions expressing the LFY gene could
be extracted and interactively viewed as domains of expression.
This allowed expression domains to be classified and color-
coded according to metamer position, revealing domains deep
within the sample and previously occluded by other tissues
(Figures 8E and 8F). Volumes and linear dimensions of domains
could also be computed. For example, the LFY expression
domain shown in metamer 7 had a volume of 7.5 3 104 mm3
(Figure 8F). Regions of DEF expression in whole-mount in situ
images could also be extracted at various stages of develop-
ment. Domains of DEF signal with different intensities could then
be displayed separately for each developmental stage (Figures
8G and 8H).
DISCUSSION
OPT is a convenientmethod for visualizing plantmorphology and
gene activity in 3D. Data from a range of specimens including
embryos, seeds, seedlings, meristems, leaves, and flowers can
be readily obtained. The data can be acquired and visualized at a
range of scales, from whole Arabidopsis plants down to large
individual cells. In some cases, it is also possible to generateOPT
images from live specimens as they grow. Using an appropriate
combination of light channels, markers, and stains, it is possible
to highlight particular morphological, histological, and gene
expression domains. These domains can be easily identified
and interrogated, allowing quantitative statistical analysis in 3D
of features such as trichomes and gene expression patterns
using software developed for OPT image analysis.
The ability to image plants and expression patterns at various
scales in 3D opens up new areas to experimental attack. First, it
is possible to obtain accurate statistics on the shapes and posi-
tions of structures and expression domains at different stages of
development. This can provide essential quantitative data for
analyzing the relationship between growth and patterning. For
example, although there have been extensive molecular genetic
studies on trichome and stomatal spacing (Nadeau and Sack,
2002; Geisler et al., 2003; Kirik et al., 2004), we do not have quan-
titative data on distributions over the leaf as a whole at different
developmental stages for wild-type or mutant plants. Such
information would allow proposed mechanisms for patterning
and growth to be assessed rigorously. Moreover, relationships
between different domains, such as the positioning of trichomes
and veins, could be readily investigated and quantified.
Second, it is possible to quantify gene expression and mor-
phological domains much more easily and accurately. Quantify-
ing and comparing domains based on 2D sections depends on
being able to recreate the same planes of a section, a time-
consuming task. For example, a previous study on vascular
patterning in Arabidopsis involved manual alignment and tracing
of numerous serial sections of ATHB8:GUS plants (Kang et al.,
2003). With OPT, similar information can be obtained from a
single 3D image. Moreover, it is possible to obtain quantitative
data, such as vein and leaf volumes, that allow the growth of
different structures to be related. A further advantage is that each
metamer can be readily identified, allowing standardization of
developmental stages for each leaf and bud along the main axis
of the plant.
Finally, the use of OPT for live imaging opens up the possibility
of monitoring and quantifying the 3D growth of tissues and cells
over time. Combined with imaging of expression domains with
markers such as GFP, this would allow growing domains to be
quantified from the cellular to the organ and plant level, com-
plementing studies that have recently beenperformedusing con-
focal microscopy (Grandjean et al., 2004; Heisler et al., 2005).
Figure 7. Trichome Distribution Map.
Extracted trichome pattern for the leaf shown in Figure 6A. The trichome
bases were retrieved (yellow dots), and their separation along the leaf
surface is indicated (orange lines). Distances were computed along the 3D
surface of the leaf (see Figure 6B) in micrometers. Distances between
trichomebases ranged from54 to299mm,with ameandistanceof 164mm.
3D Development and Gene Expression 2151
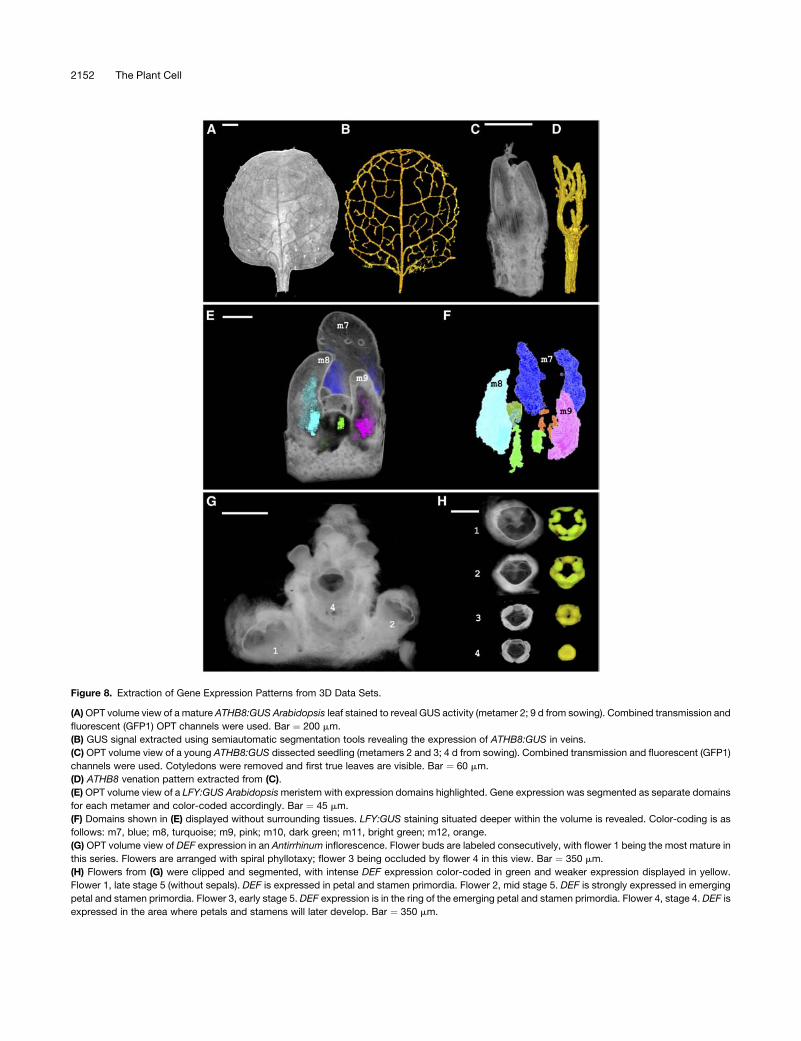
Figure 8. Extraction of Gene Expression Patterns from 3D Data Sets.
(A)OPT volume view of a mature ATHB8:GUS Arabidopsis leaf stained to reveal GUS activity (metamer 2; 9 d from sowing). Combined transmission and
fluorescent (GFP1) OPT channels were used. Bar ¼ 200 mm.
(B) GUS signal extracted using semiautomatic segmentation tools revealing the expression of ATHB8:GUS in veins.
(C) OPT volume view of a young ATHB8:GUS dissected seedling (metamers 2 and 3; 4 d from sowing). Combined transmission and fluorescent (GFP1)
channels were used. Cotyledons were removed and first true leaves are visible. Bar ¼ 60 mm.
(D) ATHB8 venation pattern extracted from (C).
(E) OPT volume view of a LFY:GUS Arabidopsismeristem with expression domains highlighted. Gene expression was segmented as separate domains
for each metamer and color-coded accordingly. Bar ¼ 45 mm.
(F) Domains shown in (E) displayed without surrounding tissues. LFY:GUS staining situated deeper within the volume is revealed. Color-coding is as
follows: m7, blue; m8, turquoise; m9, pink; m10, dark green; m11, bright green; m12, orange.
(G) OPT volume view of DEF expression in an Antirrhinum inflorescence. Flower buds are labeled consecutively, with flower 1 being the most mature in
this series. Flowers are arranged with spiral phyllotaxy; flower 3 being occluded by flower 4 in this view. Bar ¼ 350 mm.
(H) Flowers from (G) were clipped and segmented, with intense DEF expression color-coded in green and weaker expression displayed in yellow.
Flower 1, late stage 5 (without sepals). DEF is expressed in petal and stamen primordia. Flower 2, mid stage 5. DEF is strongly expressed in emerging
petal and stamen primordia. Flower 3, early stage 5. DEF expression is in the ring of the emerging petal and stamen primordia. Flower 4, stage 4. DEF is
expressed in the area where petals and stamens will later develop. Bar ¼ 350 mm.
2152 The Plant Cell
METHODS
Plant Material
Antirrhinum majus plants were grown in a greenhouse. Arabidopsis
thaliana plants were grown in a continuous-light growth cabinet at 258C.
Plant Nomenclature and Staging
Plant age is described as days from sowing. An Arabidopsis plant was
considered as a series of metamers, each comprising three modules: an
axillary meristem, a subtending leaf (if present), and a supporting inter-
node. In the main axis of the plant, one cotyledon was defined as m0, the
other as m1, and the metamers above this were numbered sequentially
m2, m3, to mi, irrespective of the organ at that position (Mundermann
et al., 2005). Antirrhinum flowers were staged as described previously
(Vincent and Coen, 2004).
GUS Staining
The GUS reporter gene (uidA encoding Escherichia coli b-glucuronidase
[Jefferson et al., 1987]) was used for the histochemical localization of GUS
activity. LEAFY:GUS (Blazquez et al., 1997), ATHB8:GUS (Kang et al.,
2003), and GL2:GUS (Masucci et al., 1996) constructs were used.
GL2:GUS seeds were obtained from John Schielefbein. Fresh tissue
was dissected and incubated in the dark at 378C overnight in 1 mM
5-bromo-4-chloro-3-indolyl-b-D-glucuronic acid with 0.5 mM potassium
ferrocyanide and 0.5 mM potassium ferricyanide. Stained specimens
were washed in deionized water and soaked in 95% ethanol to clear
tissue of chlorophyll.
Whole-Mount in Situ Hybridization
Antirrhinum floral inflorescences ;1 cm long were collected and dis-
sected to remove bracts and sepals. In situ hybridization was performed
as described by Coen et al. (1990) and adapted by Desmond Bradley
(John Innes Centre) for whole-mount specimens. Fixed tissue in 100%
ethanol was rehydrated through an ethanol series and incubated in
acetone for 30 min, in PBS for 1 h, in acetic anhydride/triethanolamine for
30min, and for twowashes in PBS for 10min. The probe to detect theDEF
transcript was a 370-bpBamHI-HindIII fragment ofDEF A (Sommer et al.,
1990) linearized with HindIII. Probe was prepared and hybridized over-
night at 508C as described by Coen et al. (1990). After hybridization,
specimens were given three washes of 23 SSC (13 SSC is 0.15 M NaCl
and 0.015M sodium citrate) and 50% formamide at 508C for 2 h each, two
washes of NTE (13 NTE is 0.5 M NaCl, 10 mM Tris-HCl, pH 7.5, and 10
mM EDTA) at 378C for 30 min each, one wash of NTE and RNase at 378C
for 1 h, two washes of NTE at room temperature for 30 min each, one
wash of 23SSC and 50% formamide at 508C for 2 h, onewash of 13SSC
at room temperature for 5min, and onewash of PBS at room temperature
for 30 min. Blocking was as described by Coen et al. (1990), with an
extended incubation period of up to 4 h. After blocking, specimens were
incubated overnight with anti-digoxigenin-alkaline phosphatase at 48C.
They were then washed at room temperature once with 100mMTris-HCl,
150 mM NaCl, 1% BSA, and 0.3% Triton for 20 min, once with 100 mM
Tris-HCl and 150 mM NaCl for 20 min, and once with 100 mM Tris-HCl,
150 mMNaCl, and 50mMMgCl2, pH 9.5, for 30 min. Staining for the anti-
body was as described by Coen et al. (1990) with incubations of 5 to 12 h.
Specimen Preparation for OPT
Specimens for OPT analysis were usually fixed in 4% paraformaldehyde
and 0.1% Tween/0.1% Triton followed by dehydration steps of 3 h each
through an ethanol/0.85% saline series (50, 70, 85, 95, and finally 100%
ethanol, after which the specimen was left overnight at 48C). Alternatively,
specimens were incubated overnight in 100% ethanol without fixation.
Arabidopsis seedlings younger than 4 d from sowing and specimens <300
mm in size were stained with a cell wall–specific stain, saffranin (0.3% in
100% ethanol), at 48C overnight to enhance tissue fluorescence, followed
by destaining for up to 1 h in 100% ethanol. Specimens were rehydrated
through an ethanol series (70, 50, 30, and 10% ethanol for 30 min each at
room temperature). Rehydrated specimens were embedded in 1% low-
melting-point agarose, as described previously (Sharpe et al., 2002).
Embeddedspecimensweredehydratedovernight inmethanol andcleared
in a 1:2mixture of benzyl alcohol andbenzyl benzoate (Sigma-Aldrich) for 2
to 24 h until almost transparent. The strong signal and sharp boundaries of
expression observed around trichomes indicate that the diffusion of stains
in the benzyl alcohol and benzyl benzoate clearing agent is limited.
For liveOPT,Arabidopsis seedswereembedded in1% low-melting-point
agarose, stratified for 3 d at 48C, and allowed to germinate in a growth
roomwith 16 h of light at 208C.When the seedlingswere 3 d old, theywere
placed in the OPT scanner in which further growth occurred.
OPT Scanning
Images of embedded plant tissues were collected using a prototype OPT
device constructed at the Human Genetics Unit of the Medical Research
Council (Edinburgh, UK) (Sharpe et al., 2002) and installed at the John
Innes Centre. Specimens were rotated through 3608 using a stepper
motor with 0.98 steps on a Leica MZ FLIII microscope using either a
planapo 0.633 M-series or a plan 0.53 M-series objective, via a 13
C-mount adaptor, with a 100-W mercury-vapor burner for fluorescence
imaging (Leica Microsystems). Images were recorded using a Coolsnap
CF camera (Roper Scientific, Photometrics) controlled by IPLab imaging
software (Scanalytics) (Sharpe et al., 2002). The following Leica filters
were used: TXR, 560/40 nm excitation, 610 LP nm emission, for saffranin-
stained tissue andautofluorescence;GFP1, 425/60 nmexcitation, 480 nm
emission; Green, 546/10 nmexcitation, 590 nmbarrier; andGFP2, 480/40
nm excitation, 510 nm emission for tissue autofluorescence. Visible light
transmission images were collected using a 20-W halogen lamp con-
nected to the OPT device. Infrared path filters (700, 750, and 800 nm)
reduced dark signal in strongly stained specimens. Voxel size was
calculated based on the microscope objective and magnification used
and verified with reconstructions of a calibration pin of known size. Voxel
sizes at each magnification were obtained and linear measurements and
volume measurements of domains were collected with QtVolView. Data
for the specimen shown in Figure 5Awere obtained using anOPTScanner
3001 (Bioptonics, MRC Technology). Reconstructions of OPT images
were performed as described previously (Sharpe et al., 2002).
For live OPT, germinating Arabidopsis seedlings were scanned in
water. Visible light transmission images were collected at several inter-
vals over a 72-h period. The quality of 3D images from water-scanned
Arabidopsis roots was superior to 3D data obtained from roots fixed and
treated with clearing agent, although internal detail through dense re-
gions, such as the seed coat, was reduced.
Visualization and Segmentation
A software package, called QtVolView, was developed to display com-
bined volume, surface, and section-rendered images. The program ex-
ploits graphics hardware to allowmore rapid and interactive viewing of 3D
data. Interactive viewing of the specimens was achieved by approximat-
ing the volumes as series of parallel view-aligned quadrilateral slices. The
individual slices were texture-mapped with the corresponding volumetric
data and blended together to achieve the 3D volume view, as described
by Blythe (1998). The visibility of the renderings was improved with user-
specified transfer functions, edge enhancement (Jain, 1989), and per-
voxel lighting (Ebert and Rheingans, 2001). Gaussian blurring and
3D Development and Gene Expression 2153
thresholding were also used to remove noise in the scans. Up to three
OPT scan filter channels were combined within the same 3D space. Each
channel could be independently clipped and interrogated. A basic version
of the program is presentedwith the supplemental data online, and the full
version of QtVolView is available on request.
Segmentation of the trichomes for the Arabidopsis leaf was achieved
using a semiautomatic seeded region-growing algorithm (separate soft-
ware fromQtVolView). This was applied to a surface representation of the
leaf. To retrieve the surface representation, the marching-cubes algo-
rithmwas applied (Lorenson andCline, 1987). A surface normal clustering
algorithm based onmean shift was then applied to the surface (Yamauchi
et al., 2005). The trichomes were then differentiated from the rest of the
surface using a region-growing algorithm. To initialize the region-growing
algorithm, the user selected a nontrichome vertex as the seed point.
The algorithm was then allowed to propagate, by edge traversal and
a curvature term, defined as the angle between the normals of two edge
vertices. By specifying this curvature term, the region-growing algorithm
was able to achieve the desired segmentation. Further processing
of individual trichomes using principal component analysis (http://
www.cs.otago.ac.nz/cosc453/student_tutorials/principal_components.pdf)
(Pearson, 1901) and k-means clusteringwas used to retrieve the trichome
branches (http://fconyx.ncifcrf.gov/;lukeb/kmeans.html) (MacQueen,
1967).
Distances between trichomes were obtained by first performing
Delaunay triangulation on the positions of the trichome bases (www.qhull.
org). Points on the leaf surface lying nearest to the triangle edges were
then obtained by sampling along the edges at constant intervals. These
points were fittedwith a B-spline curve to get a smooth path along the leaf
surface for each neighboring trichome base. The lengths of the B-spline
curves were then calculated to obtain the distances between trichome
bases.
For the segmentation of gene expression and veins, a region-growing
algorithm combined with information gain was incorporated into QtVol-
View (Jain, 1989; Singh et al., 2004). Figures were composed with Adobe
Photoshop CS.
QtVolViewMovies
Movies of images illustrated in Figures 1 to 8 are provided as Supple-
mental Movies 1 to 14 online. All movies were obtained from QtVolView
with an image size of 256 3 256 3 256 pixels unless stated otherwise.
QtVolViewLITE Program
The QtVolViewLITE program is provided with the reconstructed OPT data
set illustrated in Figures 1A and 2A to allow the visualization and direct
interaction with the 3D data (http://www.cmp.uea.ac.uk/Research/cbg/
downloads.htm). Minimum system requirements for the QtVolViewLITE
program are a 3.0-GHz CPU, 2 Gb of RAM, and a 256-Mb graphic card.
The full QtVolView program is available on request.
Accession Numbers
LEAFY:GUS (Blazquez et al., 1997) seeds were obtained from Notting-
ham Arabidopsis Stock Centre (NASC) reference N6297. ATHB8:GUS
(Kang et al., 2003) seeds were obtained from NASC reference N296.
Supplemental Data
The following materials are available in the online version of this article.
Supplemental Movie 1. Movie for Figures 1A and 2A.
Supplemental Movie 2. Movie for Figures 1C and 2C.
Supplemental Movie 3. Movie for Figures 1D and 2D.
Supplemental Movie 4. Movie for Figure 3F.
Supplemental Movie 5. Movie for Figure 4A.
Supplemental Movie 6. Movie for Figure 4B.
Supplemental Movie 7. Movie for Figure 5B.
Supplemental Movie 8. Movie for Figure 5D.
Supplemental Movie 9. Movie for Figure 6A.
Supplemental Movie 10. Movie for Figures 8A and 8B.
Supplemental Movie 11. Movie for Figures 8C and 8D.
Supplemental Movie 12. Movie for Figures 8E and 8F.
Supplemental Movie 13. Movie for Figure 8G.
Supplemental Movie 14. Movie for Figure 8H, Flower 1.
ACKNOWLEDGMENTS
We thank Richard Baldock, Duncan Davidson, Bill Hill, and Allyson Ross
from the Edinburgh Mouse Atlas Group for their invaluable support and
for providing us with Mouse Atlas software and expertise. We also thank
the Bioptonics team for the use of a prototype OPT Scanner 3001, to
obtain the OPT scan shown in Figure 5B. Steve Rawsthorne (John Innes
Centre) provided the Arabidopsis silique shown in Figures 1 to 3. We
also thank Desmond Bradley for advice on whole-mount in situ tech-
niques and Paul Derbyshire for advice on root growth.
Received April 6, 2006; revised June 16, 2006; accepted July 21, 2006;
published August 11, 2006.
REFERENCES
Baldock, R.A., et al. (2003). EMAP and EMAGE: A framework for
understanding spatially organized data. Neuroinformatics 1, 309–325.
Blazquez, M.A., Soowal, L.N., Lee, I., and Weigel, D. (1997). LEAFY
expression and flower initiation in Arabidopsis. Development 124,
3835–3844.
Blythe, D. (1998). Advanced Graphics Programming Techniques Using
OpenGL. SIGGRAPH 1998 Course. (New York: ACM Press).
Bryson-Richardson, R.J., and Currie, P.D. (2004). Optical projection
tomography for spatio-temporal analysis in the zebrafish. Methods
Cell Biol. 76, 37–50.
Coen, E.S., Romero, J.M., Doyle, S., Elliott, R., Murphy, G., and
Carpenter, R. (1990). Floricaula: A homeotic gene required for flower
development in Antirrhinum majus. Cell 63, 1311–1322.
Ebert, D., and Rheingans, P. (2001). Volume illustration: Nonphoto-
realistic rendering of volume models. IEEE Trans. Vis. Comput. Graph.
7, 253–264.
Fiala, J.C. (2005). Reconstruct: A free editor for serial section micros-
copy. J. Microsc. 218, 52–61.
Gambhir, S.S., et al. (1999). Imaging adenoviral-directed reporter gene
expression in living animals with positron emission tomography. Proc.
Natl. Acad. Sci. USA 96, 2333–2338.
Geisler, M.J., Deppong, D.O., Nadeau, J., and Sack, F.D. (2003).
Stomatal neighbour cell polarity and division in Arabidopsis. Planta
216, 571–579.
Grandjean, O., Vernoux, T., Laufs, P., Belcram, K., Mizukami, M.,
and Trass, J. (2004). In vivo analysis of cell division, cell growth and
differentiation at the shoot apical meristem in Arabidopsis. Plant Cell
16, 74–87.
2154 The Plant Cell
Greive, K., Dubois, A., Simonutti, M., Paques, M., Sahel, J., Le
Gargasson, J.-F., and Boccara, C. (2005). In vivo anterior segment
imaging in the rat eye with high speed white light full field optical
coherence tomography. Opt. Express 13, 6286–6295.
Gustafsson, M.G.L. (2005). Nonlinear structured-illumination micros-
copy: Wide-field fluorescence imaging with theoretically unlimited
resolution. Proc. Natl. Acad. Sci. USA 102, 13081–13086.
Haseloff, J., Siemering, K.R., Prasher, D.C., and Hodge, S. (1997).
Removal of a cryptic intron and subcellular localization of green
fluorescent protein are required to mark transgenic Arabidopsis plants
brightly. Proc. Natl. Acad. Sci. USA 94, 2122–2127.
Heisler, M.G., Ohno, C., Das, P., Sieber, P., Reddy, G.V., Long, J.A.,
and Meyerowitz, E.M. (2005). Patterns of auxin transport and gene
expression during primordium development revealed by live imag-
ing of the Arabidopsis inflorescence meristem. Curr. Biol. 15, 1899–
1911.
Hettinger, J.W., de la Pena Mattozzi, M., Myers, W.R., Williams,
M.E., Reeves, A., Parsons, R.L., Haskell, R.C., Petersen, D.C.,
Wang, R., and Medford, J.I. (2000). Optical coherence microscopy. A
technology for rapid, in vivo, non-destructive visualization of plants
and plant cells. Plant Physiol. 123, 3–16.
Holbrook, N.M., Ahrens, E.T., Burns, M.J., and Zwieniecki, M.A.
(2001). In vivo observation of cavitation and embolism repair using
magnetic resonance imaging. Plant Physiol. 126, 27–31.
Huisken, J., Swoger, J., Del Bene, F., Wittbrodt, J., and Stelzer,
E.H.K. (2004). Optical sectioning deep inside live embryos by selec-
tive plane illumination microscopy. Science 305, 1007–1009.
Jain, A.K. (1989). Fundamentals of Digital Image Processing. (Upper
Saddle River, NJ: Prentice-Hall).
Jefferson, R.A., Kavanagh, T.A., and Bevan, M.W. (1987). GUS
fusions: Beta-glucuronidase as a sensitive and versatile gene fusion
marker in higher plants. EMBO J. 6, 3901–3907.
Jonsson, H., Heisler, M., Shapiro, B., Meyerowitz, E., and
Mjolsness, E. (2006). An auxin-driven polarized transport model for
phyllotaxis. Proc. Natl. Acad. Sci. USA 103, 1633–1638.
Kang, J., Tang, J., Donnelly, P., and Dengler, N. (2003). Primary
vascular pattern and expression of ATHB-8 in shoots of Arabidopsis.
New Phytol. 158, 443–454.
Kerwin, J., Scott, M., Sharpe, J., Puelles, L., Robson, S.C., Martinez-
de-la-Torre, M., Ferran, J.L., Feng, G., Baldock, R., Strachan, T.,
Davidson, D., and Lindsay, S. (2004). 3 dimensional modelling of
early human brain development using optical projection tomography.
BMC Neurosci. 5, 27.
Kirik, V., Simon, M., Huelskamp, M., and Schiefelbein, J. (2004). The
ENHANCER OF TRY AND CPC1 gene acts redundantly with TRIP-
TYCHON and CAPRICE in trichome and root hair cell patterning in
Arabidopsis. Dev. Biol. 268, 506–513.
Lickert, H., Takeuchi, J.K., von Both, I., Walls, J.R., McAuliffe, F.,
Adamson, S.L., Henkelman, R.M., Wrana, J.L., Rossant, J., and
Bruneau, B.G. (2004). Baf60c is essential for function of BAF chro-
matin remodelling complexes in heart development. Nature 432,
107–112.
Lindsay, S., and Copp, A.J. (2005). MRC-Wellcome Trust Human
Developmental Biology Resource: Enabling studies of human trends
in genetics developmental gene expression. Trends Genet. 21,
586–590.
Lindsay, S., Sarma, S., Martinez-De-La-Torre, M., Kerwin, J.,
Scott, M., Ferran, J.L., Baldock, R., and Puelles, L. (2005). Ana-
tomical and gene expression mapping of the ventral pallium in a three-
dimensional model of developing human brain. Neuroscience 136,
625–632.
Liu, Y.C., and Chiang, A.S. (2003). High-resolution confocal imaging
and three-dimensional rendering. Methods 30, 86–93.
Lorenson, W.E., and Cline, H.E. (1987). Marching cubes: A high
resolution 3D surface construction algorithm. In Proceedings of the
14th Annual Conference on Computer Graphics and Interactive
Techniques. (New York: ACM Press), pp. 163–169.
Louie, A.Y., Huber, M.M., Ahrens, E.T., Rothbacher, U., Moats, R.,
Jacobs, R.E., Fraser, S.E., and Meade, T.J. (2000). In vivo visual-
ization of gene expression using magnetic resonance imaging. Nat.
Biotechnol. 18, 321–325.
MacQueen, J. (1967). Some methods for classification and analysis of
multivariate observations. In Proceedings of the Fifth Berkeley Sym-
posium on Mathematical Statistics and Probability. (Berkeley, CA:
University of California Press), pp. 281–297.
Masucci, J.D., Rerie, W.G., Foreman, D.R., Zhang, M., Galway, M.E.,
Marks, M.D., and Schiefelbein, J.W. (1996). The homeobox gene
GLABRA 2 is required for position-dependent cell differentiation in the
root epidermis of Arabidopsis thaliana. Development 122, 1253–
1260.
Mundermann, L., Erasmus, Y., Lane, B., Coen, E., and Prusinkiewicz,
P. (2005). Quantitative modeling of Arabidopsis development. Plant
Physiol. 139, 960–968.
Nadeau, J.A., and Sack, F.D. (2002). Control of stomatal distribution on
the Arabidopsis leaf surface. Science 296, 1697–1700.
Pearson, K. (1901). On lines and planes of closest fit to systems of
points in space. Philos. Mag. 2, 559–572.
Reeves, A., Parsons, R.L., Hettinger, J.W., and Medford, J.I. (2002).
In vivo three-dimensional imaging of plants with optical coherence
microscopy. J. Microsc. 208, 177–189.
Ruijter, J.M., Soufan, A.T., Hagoort, J., and Moorman, A.F. (2004).
Molecular imaging of the embryonic heart: Fables and facts on 3D
imaging of gene expression patterns. Birth Defects Res. Part C
Embryo Today Rev. 72, 224–240.
Sarma, S., Kerwin, J., Puelles, L., Scott, M., Strachan, T.,
Feng, G., Sharpe, J., Davidson, D., Baldock, R., and Lindsay,
S. (2005). 3D modelling, gene expression mapping and post-mapping
image analysis in the developing human brain. Brain Res. Bull. 66,
449–453.
Sharpe, J. (2003). Optical projection tomography as a new tool for
studying embryo anatomy. J. Anat. 202, 175–181.
Sharpe, J. (2004). Optical projection tomography. Annu. Rev. Biomed.
Eng. 6, 209–228.
Sharpe, J., Ahlgren, U., Perry, P., Hill, B., Ross, A., Hecksher-
Sorensen, J., Baldock, R., and Davidson, D. (2002). Optical pro-
jection tomography as a tool for 3D microscopy and gene expression
studies. Science 296, 541–545.
Singh, H., Crawford, M., Curtin, J., and Zwiggelaar, R. (2004).
Automated 3D segmentation of lung airway tree using gain
based region growing approach. Lect. Notes Comput. Sci. 3217,
975–982.
Sommer, H., Beltran, J.-P., Huijser, P., Pape, H., Lonnig, W.,
Saedler, H., and Schwarz-Sommer, Z. (1990). Deficiens, a homeotic
gene involved in the control of flower morphogenesis in Antirrhinum
majus: The protein shows homology to transcription factors. EMBO J.
9, 605–613.
Stuppy, W.H., Maisano, J.A., Colbert, M.W., Rudall, P.J., and
Rowe, T.B. (2003). Three-dimensional analysis of plant structure
using high-resolution X-ray computed tomography. Trends Plant Sci.
8, 2–6.
Takeuchi, J.K., et al. (2005). Tbx20 dose-dependently regulates tran-
scription factor networks required for mouse heart and motoneuron
development. Development 132, 2463–2474.
Tickle, C. (2004). The contribution of chicken embryology to the
understanding of vertebrate limb development. Mech. Dev. 121,
1019–1029.
3D Development and Gene Expression 2155

Tyszka, J.M., Ewald, A.J., Wallingford, J.B., and Fraser, S.E. (2005).
New tools for visualization and analysis of morphogenesis in spherical
embryos. Dev. Dyn. 234, 974–983.
Vincent, C.A., and Coen, E.S. (2004). A temporal and morphological
framework for flower development in Antirrhinum majus. Can. J. Bot.
82, 681–690.
Walls, J.R., Sled, J.G., Sharpe, J., and Henkelman, R.M. (2005).
Correction of artefacts in optical projection tomography. Physiol.
Med. Biol. 50, 4645–4665.
Wilkie, A.L., Jordan, S.A., Sharpe, J.A., Price, D.J., and Jackson, I.J.
(2004). Widespread tangential dispersion and extensive cell death dur-
ing early neurogenesis in the mouse neocortex. Dev. Biol. 267, 109–118.
Yamauchi, H., Lee, S., Lee, Y., Ohtake, Y., Belyaev, A., and Hans-
Peter, S. (2005). Feature sensitive mesh segmentation with mean
shift. In Shape Modeling International Conference 2005 (Cambridge,
MA: IEEE), pp. 236–243.
Zachgo, S., Perbal, M.-C., Saedler, H., and Schwarz-Sommer, Z.
(2000). In situ analysis of RNA and protein expression in whole mounts
facilitates detection of floral gene expression dynamics. Plant J. 23,
697–702.
2156 The Plant Cell


![Visualizing Structured Hypotheses in the Gene Ontology with …jasonjunjiezhu.com/docs/cs448b_final_report.pdf · value would be uniformly distributed on [0,1]. Thus, if one is testing](https://img.pdfslide.us/doc/110x75/6070b1a719464b2a4b41e3e4/visualizing-structured-hypotheses-in-the-gene-ontology-with-value-would-be-uniformly.jpg)