Embed Size (px)
Citation preview
E n e r g y R e s e a r c h a n d D e v e l o p m e n t D i v i s i o n F I N A L P R O J E C T R E P O R T
VISUALIZING CLIMATE CHANGE RISK AND ADAPTATION OPTIONS FOR CALIFORNIA Cal-Adapt
JUNE 2016 CE C-500-2016-046
Prepared for: California Energy Commission Prepared by: The Regents of the University of California on behalf of the
Geospatial Innovation Facility
PREPARED BY: Primary Authors: Kevin Koy Maggi Kelly Brian Galey Geospatial Innovation Facility UC Berkeley 111 Mulford Hall Berkeley, CA 94720-3114 Phone: 510-643-4539 http://gif.berkeley.edu Contract Number: 500-10-007 Prepared for: California Energy Commission Susan Wilhelm Contract Manager Aleecia Gutierrez Office Manager Energy Generation Research Office Laurie ten Hope Deputy Director ENERGY RESEARCH AND DEVELOPMENT DIVISION Robert P. Oglesby Executive Director
DISCLAIMER This report was prepared as the result of work sponsored by the California Energy Commission. It does not necessarily represent the views of the Energy Commission, its employees or the State of California. The Energy Commission, the State of California, its employees, contractors and subcontractors make no warranty, express or implied, and assume no legal liability for the information in this report; nor does any party represent that the uses of this information will not infringe upon privately owned rights. This report has not been approved or disapproved by the California Energy Commission nor has the California Energy Commission passed upon the accuracy or adequacy of the information in this report.
i
ACKNOWLEDGEMENTS
Cal-Adapt’s design and functionality were developed with insight from dozens of beta testers who provided valuable feedback throughout several iterations of updates. These individuals represent scientists and climate experts, planners and technicians, as well as interested participants from the general public. Their thoughtful comments and advice helped to make Cal-Adapt a better product.
Brian Galey and Sarah Van Wart were the primary developers on the Cal-Adapt project and were responsible for bringing the site to life and providing elegant solutions to the many difficult programming challenges. Several developers have also subsequently contributed to Cal-Adapt include after its initial launch including Matea Marsic, Falk Schuetzenmeister, and Shruti Mukhtyar. The project also benefited greatly from the advisory oversight of Guido Franco, Carol Greenwood, Sarah Pittiglio, Kurt Malchow, and Amy Luers.
Previous to the inception of this project, the Stockholm Environmental Institute’s Dylan Beaudette, Vishal Mehta, and David Purkey had created an initial prototype for Cal-Adapt that was instrumental in the site’s origin. We also thank Shannon Koy for her valuable contribution to the graphic design and layout of the site.
ii
PREFACE
The California Energy Commission Energy Research and Development Division supports public interest energy research and development that will help improve the quality of life in California by bringing environmentally safe, affordable, and reliable energy services and products to the marketplace.
The Energy Research and Development Division conducts public interest research, development, and demonstration (RD&D) projects to benefit California.
The Energy Research and Development Division strives to conduct the most promising public interest energy research by partnering with RD&D entities, including individuals, businesses, utilities, and public or private research institutions.
Energy Research and Development Division funding efforts are focused on the following RD&D program areas:
• Buildings End-Use Energy Efficiency
• Energy Innovations Small Grants
• Energy-Related Environmental Research
• Energy Systems Integration
• Environmentally Preferred Advanced Generation
• Industrial/Agricultural/Water End-Use Energy Efficiency
• Renewable Energy Technologies
• Transportation
Cal-Adapt: Visualizing Climate Change Risk and Adaptation Options for California is the final report for the Cal-Adapt project (contract number 500-10-007) conducted by UC Berkeley’s Geospatial Innovation Facility. The information from this project contributes to Energy Research and Development Division’s Energy-Related Environmental Research Program.
When the source of a table, figure or photo is not otherwise credited, it is the work of the author of the report.
For more information about the Energy Research and Development Division, please visit the Energy Commission’s website at www.energy.ca.gov/research/ or contact the Energy Commission at 916-327-1551.
iii
ABSTRACT
One of the major challenges facing the climate change adaptation community is the lack of tools and established methodologies to convey the nature of the risk posed by climate change to a wide audience, including energy utilities. There is a bottleneck in delivering relevant information, much of which is spatial in nature, to decision makers that allows them to turn climate change research results into effective climate change adaptation decisions and policies. To start addressing this need, the research team created the Cal-Adapt website (http://cal-adapt.org). Through a combination of locally relevant information, visualization tools, and access to primary data, Cal-Adapt allows users to investigate how the climate is projected to change in their areas of interest.
Additionally, the research team has undertaken numerous outreach efforts to carry Cal-Adapt’s visualization tools to a range of audiences across the state. Cal-Adapt succeeded in providing a wide number of users with sound scientific basis to serve as a starting point for adaptation planning efforts as well as a resource supporting critical research in safeguarding the public from climate impacts and to support developing much-needed tools to inform adaptation efforts.
Keywords: Cal-Adapt, Climate, Climate Change, California, Website, Temperature, Precipitation, Sea Level Rise, Data
Please use the following citation for this report:
Koy, Kevin; Maggi Kelly; Brian Galey. (Geospatial Innovation Facility). 2014. Cal-Adapt: Visualizing Climate Change Risk and Adaptation Options for California. California Energy Commission. Publication number: CEC-500-2016-046.
iv
TABLE OF CONTENTS
Acknowledgements ................................................................................................................................... i
PREFACE ................................................................................................................................................... ii
ABSTRACT .............................................................................................................................................. iii
TABLE OF CONTENTS ......................................................................................................................... iv
LIST OF FIGURES .................................................................................................................................... v
LIST OF TABLES ...................................................................................................................................... v
EXECUTIVE SUMMARY ........................................................................................................................ 1
Introduction ........................................................................................................................................ 1
Project Purpose ................................................................................................................................... 1
Project Results ..................................................................................................................................... 1
Project Benefits ................................................................................................................................... 2
CHAPTER 1: Introduction ...................................................................................................................... 3
1.1 Climate Change Challenges...................................................................................................... 3
1.2 Addressing the Challenges ....................................................................................................... 3
1.3 Audience ..................................................................................................................................... 4
CHAPTER 2: Features and Data ............................................................................................................. 5
2.1 Features ....................................................................................................................................... 5
2.1.1 Local Climate Snapshot ..................................................................................................... 5
2.1.2 Map Animations ................................................................................................................. 6
2.1.3 Data Visualization .............................................................................................................. 6
2.1.4 Data Downloads ................................................................................................................. 7
2.2 Data Sources ............................................................................................................................... 7
CHAPTER 3: Technology Methods ....................................................................................................... 9
CHAPTER 4: Outreach For and Uses of Cal-Adapt .......................................................................... 11
4.1 Presentations ............................................................................................................................. 11
4.2 Example Targeted Application: Extreme Heat Tool ........................................................... 12
CHAPTER 5: Future Opportunities ..................................................................................................... 14
v
5.1 New Features ............................................................................................................................ 14
5.2 New Data ................................................................................................................................... 14
GLOSSARY .............................................................................................................................................. 15
REFERENCES .......................................................................................................................................... 17
LIST OF FIGURES Figure 1: Local Climate Snapshot Tool ................................................................................................... 5
Figure 2: Map Animations ........................................................................................................................ 6
Figure 3: Data Visualization Tool ............................................................................................................ 7
Figure 4: Extreme Heat Charts for Oakland, California ..................................................................... 13
LIST OF TABLES Table 1: Data Sources Used to Populate the Dynamic Temperature Charting Tool ........................ 8
Table 2: Cal-Adapt Software Stack ........................................................................................................ 10
1
EXECUTIVE SUMMARY
Introduction
Over the past twenty-five years, California has been a leader in developing models to project regional impacts of global climate change. California has also been at the forefront of monitoring indicators of climate change, which provide a basis for understanding the types and magnitudes of climatic changes that are already underway. Because human-caused climate change is projected to substantially affect all major economic sectors in the state, California must translate regionally projected climate impacts into local and sector-specific climate risks as a basis for climate-resilience decision-making. This challenge is particularly salient in the energy sector, where California is tasked with the dual challenges of dramatically reducing its greenhouse gas emissions while at the same time ensuring resilience in the face of a changing climate.
In December 2009, Governor Arnold Schwarzenegger released a Comprehensive Climate Adaptation Strategy for California and unveiled a prototype Cal-Adapt website that was developed with funding and technical direction from the Energy Commission and Google.org. Recognizing the critical need for readily accessible, visual information portraying climate change-related phenomena at the local level if California is to successfully safeguard its human, natural, and economic resources as well as its vast infrastructure, the strategy mandated the Energy Commission to develop Cal-Adapt. After a year of development at UC Berkeley’s Geospatial Innovation Facility, the Chair of the California Energy Commission and the Secretary of the Natural Resources Agency officially launched the Cal-Adapt website (http://cal-adapt.org) in June 2011.
Project Purpose
The Cal-Adapt web application was developed to showcase the wealth of innovative climate change research being produced by the scientific community in California. Through a combination of locally relevant information, visualization tools, and access to primary data, Cal-Adapt allows users to investigate how the climate is projected to change in their areas of interest, and gives them tools to plan for these changes. Cal-Adapt enables Californians and energy sector stakeholders from any location within the state to view and work with primary climate change data that were previously only available in reports in limited locations.
Project Results
As of fall 2014, Cal-Adapt had been visited by more than 46,000 unique visitors from 163 counties and 50 U.S. states. Within California, the site has been visited by individuals from 573 different cities. Cal-Adapt has played a significant role in providing relevant information to communities that are developing Climate Action Plans, and at least eight plans already published have cited the site directly, as well as references in more than a dozen scholarly journal articles.
The Cal-Adapt site includes engaging map-based visualization tools for temperature, precipitation, snowpack, fire, and sea level rise projections based on hundreds of thousands of
2
data layers. All of the data hosted on Cal-Adapt are also available for download in a variety of formats.
Project Benefits
Cal-Adapt has played a significant role in helping Californian’s understand how climate change is projected to impact their state and local areas. It has benefited citizens who are interested to learn more about these challenges, local planners and technicians who must plan for adaptation measures that address climate change, and scientists who require access to a wide variety of data for their research.
3
CHAPTER 1: Introduction 1.1 Climate Change Challenges California has a complex physical geography, unique biodiversity, and a growing and diverse population. As the climate changes, and the state’s urban footprint continues to grow in the next century, the interplay between climate change and urbanization will aggravate the challenges faced by California citizens, local and state government officials, and planners.
For example, the state’s water resources are predicted to be vulnerable through changes in snow pack, timing and amount of precipitation, and increasing urban demand (Cayan et al., 2008b) (Figure 1). Extreme weather events, such as heat waves, are expected to increase in frequency (Knowlton et al., 2009). Climate change is also anticipated to compound the risk of catastrophic wildfire (Westerling and Bryant, 2008). Invasive species are likely to increase in range and impact on natural resources, as climate change creates new habitats and niches and eliminates existing ones (Loarie et al., 2008). In addition, the state’s coastal and bay areas are at risk of flooding due to a rising sea level (Cayan et al., 2008a).
These projected increases in human population density and changes in climate highlight the need to coordinate regional planning efforts to promote conservation while also meeting the needs of all Californians for reliable and clean water, healthy communities, and food.
1.2 Addressing the Challenges In anticipation of these challenges, the California Energy Commission’s Public Interest Energy Research (PIER) program has funded a variety of research projects throughout the state’s universities and research centers. These projects have generated, and continue to produce, a robust suite of data and findings related to climate change.
Although these projects have led to a formidable amount of publications and data, the vast majority of the information was, prior to Cal-Adapt, not accessible to non-scientists. This disconnect makes it difficult for practitioners to make scientifically informed decisions about potential adaptation measures that can be planned for their areas given the lack of readily available up-to-date information on what may be expected in the future.
Cal-Adapt (http://cal-adapt.org) was developed to provide an easy-to-use resource for researchers, decision makers, and the general public, to access this wealth of information produced by PIER scientists in order to help them better understand the risks posed by climate change. In turn, the localized analyses derived from this site can help to better inform effective climate change adaptation decisions and policies. Additionally, data available for download on Cal-Adapt can provide a basis for further analyses.
4
1.3 Audience Cal-Adapt’s target audience fits into three broad groups:
• General public and energy sector stakeholders interested in learning more about how climate change may affect California,
• Utility, city, and regional planners as resource managers who need access to local level climate data to inform their resilience strategies, and
• Research experts interested in accessing climate data in a variety of formats.
Throughout development of the site, members from each of these groups were consulted through interviews and surveys to better understand their needs. Predictably, the team found that the information and tools that the site provides must offer a range of uses from simple and informative to complex and comprehensive. The valuable insights provided by this diverse testing pool helped to enhance the site the needs of each audience were addressed by providing new data and features.
5
CHAPTER 2: Features and Data There are a variety of features available through the site that provide ways to help people visualize and understand the changes that are projected to affect California. In summary, Cal-Adapt is comprised of tools designed to foster data visualization, primary data access, and community participation. Though Cal-Adapt is a centralized resource, all of the data and information populating it has been contributed from PIER’s vast network of research centers and facilities around the state. Full attribution for each data set used in Cal-Adapt can be found on the site. As climate changes are not uniformly distributed, it is important to give users the ability to see how these changes may look in different locations.
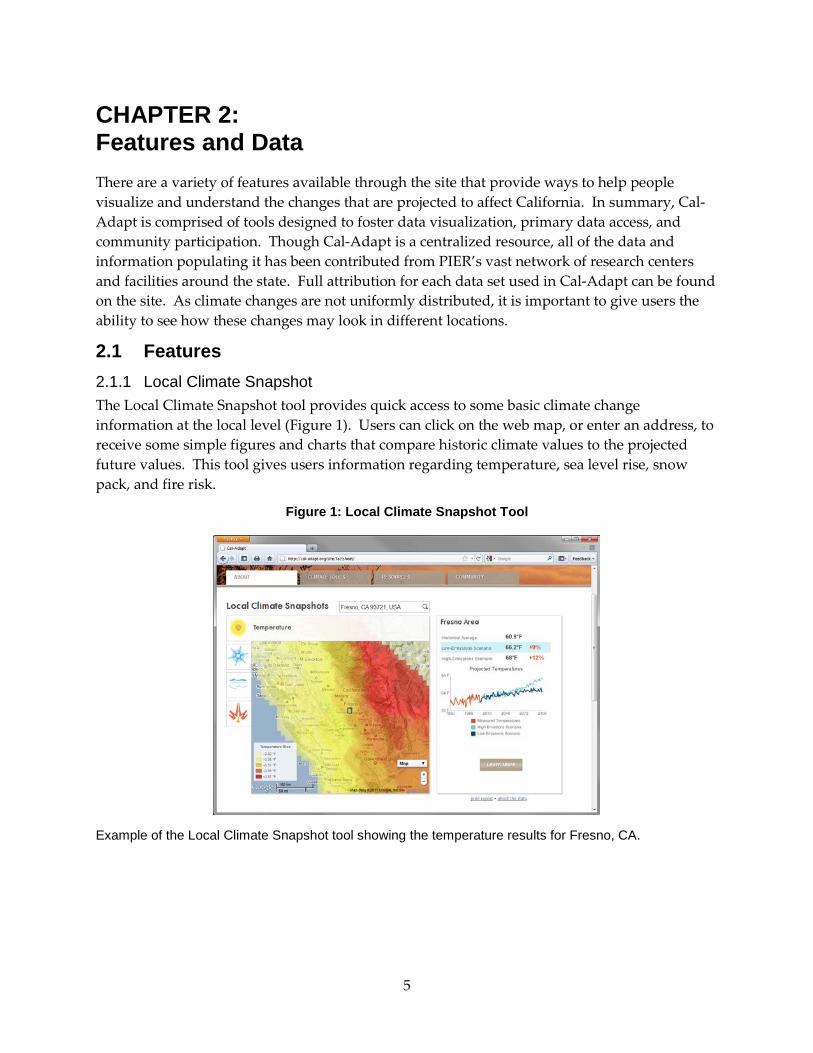
2.1 Features 2.1.1 Local Climate Snapshot The Local Climate Snapshot tool provides quick access to some basic climate change information at the local level (Figure 1). Users can click on the web map, or enter an address, to receive some simple figures and charts that compare historic climate values to the projected future values. This tool gives users information regarding temperature, sea level rise, snow pack, and fire risk.
Figure 1: Local Climate Snapshot Tool
Example of the Local Climate Snapshot tool showing the temperature results for Fresno, CA.
6
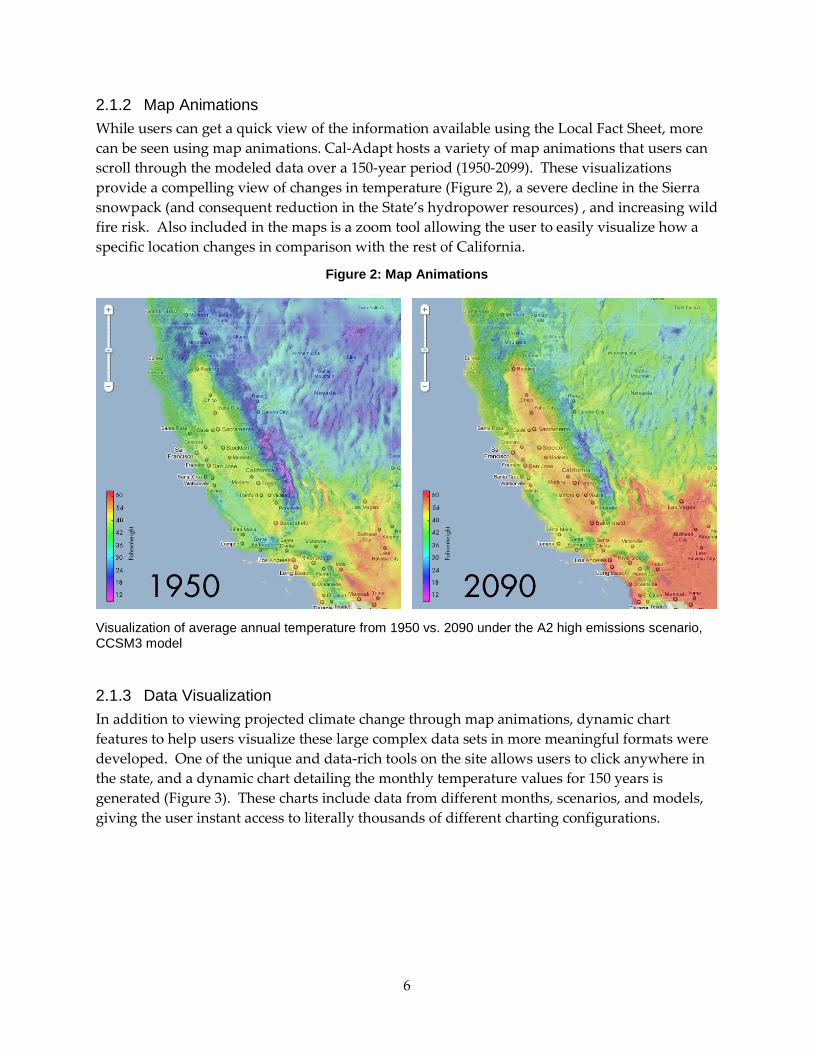
2.1.2 Map Animations While users can get a quick view of the information available using the Local Fact Sheet, more can be seen using map animations. Cal-Adapt hosts a variety of map animations that users can scroll through the modeled data over a 150-year period (1950-2099). These visualizations provide a compelling view of changes in temperature (Figure 2), a severe decline in the Sierra snowpack (and consequent reduction in the State’s hydropower resources) , and increasing wild fire risk. Also included in the maps is a zoom tool allowing the user to easily visualize how a specific location changes in comparison with the rest of California.
Figure 2: Map Animations
Visualization of average annual temperature from 1950 vs. 2090 under the A2 high emissions scenario, CCSM3 model
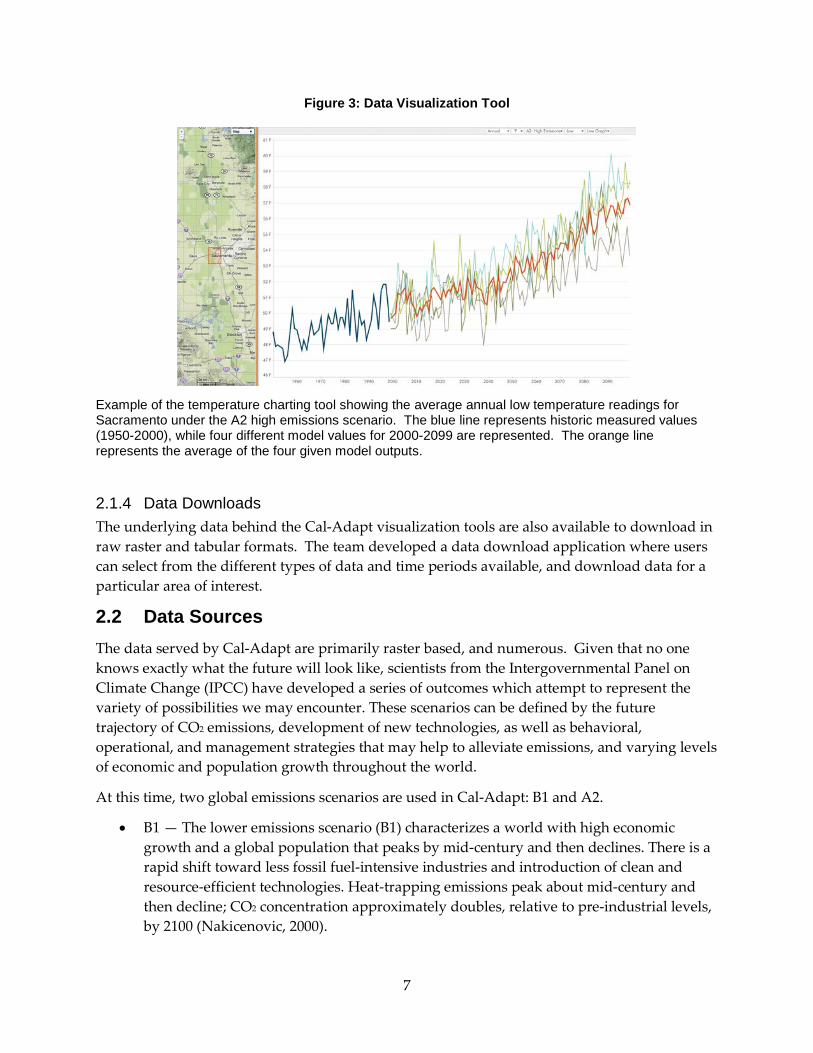
2.1.3 Data Visualization In addition to viewing projected climate change through map animations, dynamic chart features to help users visualize these large complex data sets in more meaningful formats were developed. One of the unique and data-rich tools on the site allows users to click anywhere in the state, and a dynamic chart detailing the monthly temperature values for 150 years is generated (Figure 3). These charts include data from different months, scenarios, and models, giving the user instant access to literally thousands of different charting configurations.
7
Figure 3: Data Visualization Tool
Example of the temperature charting tool showing the average annual low temperature readings for Sacramento under the A2 high emissions scenario. The blue line represents historic measured values (1950-2000), while four different model values for 2000-2099 are represented. The orange line represents the average of the four given model outputs.
2.1.4 Data Downloads The underlying data behind the Cal-Adapt visualization tools are also available to download in raw raster and tabular formats. The team developed a data download application where users can select from the different types of data and time periods available, and download data for a particular area of interest.
2.2 Data Sources The data served by Cal-Adapt are primarily raster based, and numerous. Given that no one knows exactly what the future will look like, scientists from the Intergovernmental Panel on Climate Change (IPCC) have developed a series of outcomes which attempt to represent the variety of possibilities we may encounter. These scenarios can be defined by the future trajectory of CO2 emissions, development of new technologies, as well as behavioral, operational, and management strategies that may help to alleviate emissions, and varying levels of economic and population growth throughout the world.
At this time, two global emissions scenarios are used in Cal-Adapt: B1 and A2.
• B1 — The lower emissions scenario (B1) characterizes a world with high economic growth and a global population that peaks by mid-century and then declines. There is a rapid shift toward less fossil fuel-intensive industries and introduction of clean and resource-efficient technologies. Heat-trapping emissions peak about mid-century and then decline; CO2 concentration approximately doubles, relative to pre-industrial levels, by 2100 (Nakicenovic, 2000).
8
• A2 — The medium-high emissions scenario (A2) projects continuous population growth and uneven economic and technological growth. The income gap between now-industrialized and developing parts of the world does not narrow. Heat-trapping emissions increase through the 21st century; atmospheric CO2 concentration approximately triples, relative to pre-industrial levels, by 2100 (Nakicenovic, 2000).
In addition to these emissions scenarios, several different General Circulation Models (GCM) have been developed by different organizations around the world. Each of these models attempts to capture an accurate portrayal of what the future global climate will look like based on a number of factors. UC San Diego’s Scripps Institute of Oceanography has downscaled a number of these models, using different statistical techniques, to make them more locally relevant to California.
Cal-Adapt offers four different models, including:
• NCAR - National Center for Atmospheric Research Parallel Climate Model (PCM1)
• CCSM - Community Climate System Model Version 3.0 (CCSM3)
• GFDL - Geophysical Fluids Dynamic Laboratory (GFDL) CM2.1
• CNRM - Centre National de Recherches Météorologiques
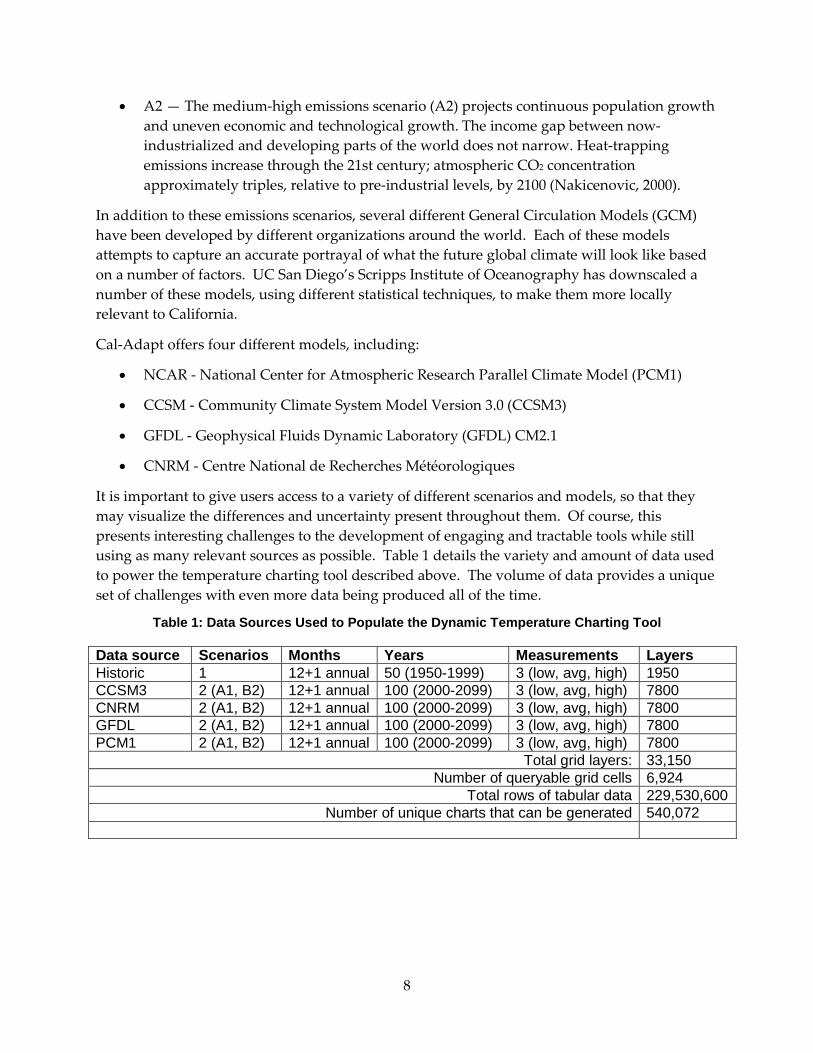
It is important to give users access to a variety of different scenarios and models, so that they may visualize the differences and uncertainty present throughout them. Of course, this presents interesting challenges to the development of engaging and tractable tools while still using as many relevant sources as possible. Table 1 details the variety and amount of data used to power the temperature charting tool described above. The volume of data provides a unique set of challenges with even more data being produced all of the time.
Table 1: Data Sources Used to Populate the Dynamic Temperature Charting Tool
Data source Scenarios Months Years Measurements Layers Historic 1 12+1 annual 50 (1950-1999) 3 (low, avg, high) 1950 CCSM3 2 (A1, B2) 12+1 annual 100 (2000-2099) 3 (low, avg, high) 7800 CNRM 2 (A1, B2) 12+1 annual 100 (2000-2099) 3 (low, avg, high) 7800 GFDL 2 (A1, B2) 12+1 annual 100 (2000-2099) 3 (low, avg, high) 7800 PCM1 2 (A1, B2) 12+1 annual 100 (2000-2099) 3 (low, avg, high) 7800
Total grid layers: 33,150 Number of queryable grid cells 6,924
Total rows of tabular data 229,530,600 Number of unique charts that can be generated 540,072
9
CHAPTER 3: Technology Methods Cal-Adapt crosscuts GIS, global change modeling, webGIS and participatory tools, in a spatial framework. Consequently a number of innovative web technologies were leveraged to provide useful information to a diverse audience of users, from general public to expert.
Cal-Adapt was developed using all free and open-source software (FOSS), hosted on virtual private servers (Steiniger and Bocher, 2009). Using Django, a flexible Python-based web framework, the team was able to weave together each of the site’s technology components to create a cohesive and unified user experience (Table 2).
MapServer provides the cartographic engine driving most of the map-based visualizations. Given the highly temporal nature of the data, MapServer's flexibility via parameter substitutions and support for WMS-T (Web Map Service-Time) have been a tremendous advantage as each HTTP GET request may contain time values, in addition to further optional parameters. Beyond support for web services such as Web Map Service (WMS), Web Feature Service (WFS) and Web Coverage Service (WCS), request modes provide access to dynamic image tiles or static map output used in the local climate snapshots and HTML templates to generate map legends.
NumPy, a Python package for scientific computing, provides the web application with quick access to the enormous wealth of data highlighted in the temperature chart example above. To support the graph-based tools, each model-scenario combination is saved as a NumPy binary file and can be read directly into the server’s memory as a multidimensional array. This format greatly simplifies access to individual raster cells and ad-hoc statistics based on arbitrary time slices, as Python's concise array slicing syntax makes it trivial to query 150 years of modeled data. Cal-Adapt also takes advantage of Memcached, a mechanism that allows client requests to be cached on the server, to reduce the amount of work the server must perform for subsequent requests for the same data.
To support a responsive and dynamic user interface, data requests and responses are communicated between server and client using Asynchronous JavaScript and XML (AJAX) calls, which in turn populate JavaScript-based visualization controls, such as Google Maps, Google Charts, and other JQuery widgets. For time-series animations, these JavaScript controls were extended to support smooth image transitions.
Building upon the wealth of innovation from the FOSS community has made the complex task of providing local access to a huge amount of data, and presenting these data in compelling ways, much more manageable.
10
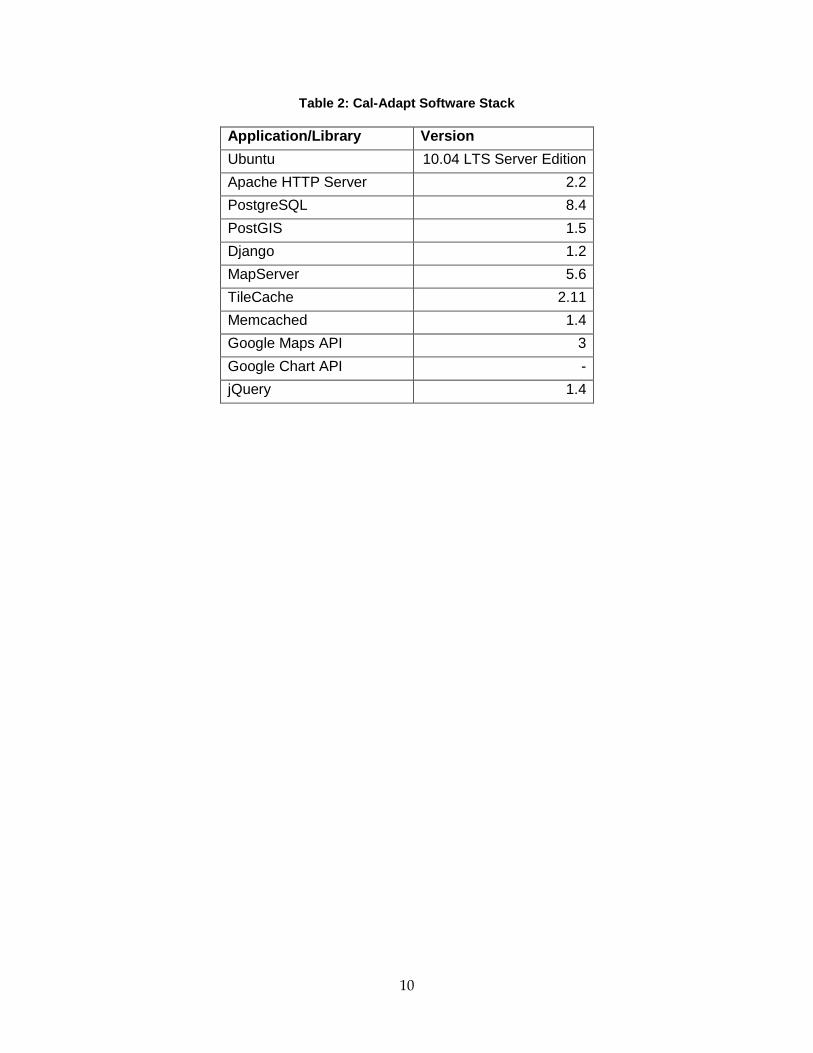
Table 2: Cal-Adapt Software Stack
Application/Library Version Ubuntu 10.04 LTS Server Edition Apache HTTP Server 2.2 PostgreSQL 8.4 PostGIS 1.5 Django 1.2 MapServer 5.6 TileCache 2.11 Memcached 1.4 Google Maps API 3 Google Chart API - jQuery 1.4
11
CHAPTER 4: Outreach For and Uses of Cal-Adapt As of fall 2014, Cal-Adapt has been visited by more than 46,000 unique visitors from all 50 U.S. states and 163 counties. Within California, the site has been visited by individuals from 573 different cities. Cal-Adapt has played a significant role in providing relevant information to communities that are developing Climate Action Plans, and at least eight plans already published have cited the site directly, as well as reference in more than a dozen scholarly journal articles.
Cal-Adapt is also a primary reference that is cited throughout the 2014 Safeguarding California Plan, an update to the 2009 California Climate Adaptation Strategy, for its role in providing relevant local information to communities developing new climate action plans.
4.1 Presentations In addition to its impact on the web, the site has been promoted throughout the state, including presentations at:
• DataEDGE Conference, Berkeley, May 30, 2013
• North Bay GIS User Group, Santa Rosa, May 22, 2013
• Caltrans, Sacramento, April 2, 2013
• Geomeetup, San Francisco, January 29, 2013
• Symposium on Sea-Level Rise in California, San Francisco, October 26, 2012
• California Energy Commission, Sacramento, June 28, 2012
• Department of Fish and Game, Sacramento, May 17, 2012
• CalGIS Conference, Sacramento, April 13, 2012
• ASPRS Annual Conference, Sacramento, March 21, 2012
• Vulnerability and Adaptation to Extreme Events in California in the Context of a Changing Climate: New Scientific Findings, Scripps, San Diego, December 13, 2011
• Urban Adaptation to Climate Change, USC, Los Angeles, November 18, 2011
• Southern California Coastal Waters Research Program, Costa Mesa, November 17, 2011
• Climate Change Symposium, UC Berkeley, October 6, 2011
• California Energy Commission, Sacramento, June 21, 2011
• Southern California Climate Adaptation Workshop, Los Angeles, May 2, 2011
12
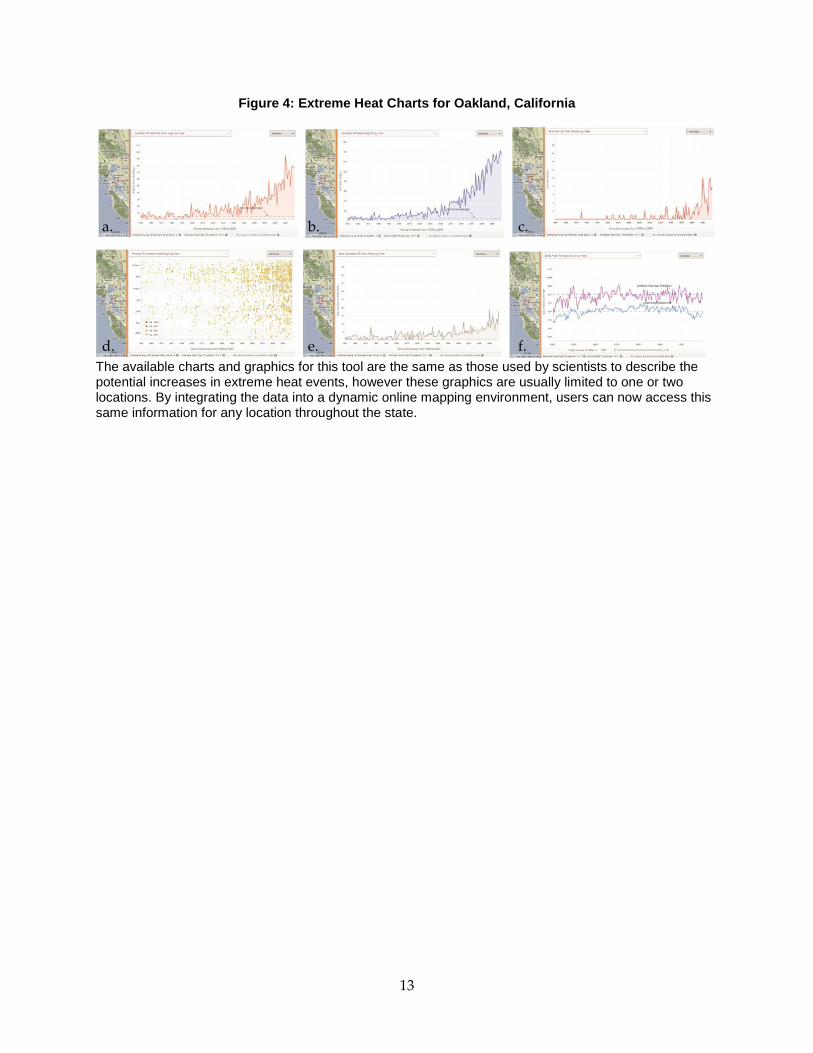
4.2 Example Targeted Application: Extreme Heat Tool An example of a targeted application to address a specific topic and community of users is the Extreme Heat Tool. One of the most serious threats to the public health of Californians, that has already presented a challenge to date, are extreme heat events. Extreme heat also poses a great challenge to California’s energy sector, exacerbating peak electricity demand. Both billing data and projected climate change portend substantial increases in peak residential electricity consumption due to climatic change (Aroonruengsawat 2009, Miller 2007). Climate models, developed by the Scripps Institution of Oceanography, project that extreme heat events will increase in frequency, intensity, and duration given future climate change.
Cal-Adapt features several different tools to visualize the projected increase in temperatures. However, at the time of the site’s initial launch these tools were limited to using only monthly temperature data. To visualize and understand extreme heat events, one must have access to projected temperatures at a daily time step. There are several thousand raster data layers per scenario and model at this temporal frequency. This enormous amount of data presents a processing challenge to provide a fast and dynamic visualization tool that can effectively describe the projected patterns of extreme heat events at a given location.
To address this need, the Cal-Adapt development team used the powerful and flexible open source stack described in Chapter 3. This setup allows for rapid access to the data that can then be used to populate a variety of charts and tables. After entering the tool (http://cal-adapt.org/temperature/heat/) the user is instructed to select a location on the map, and then is led through a series of visualizations that show (Figure 4):
a) Number of extreme heat days by year (1950-2099)
b) Number of warm nights by year (1950-2099)
c) Number of heat waves (1950-2099)
d) Timing of extreme heat days by year from April through October (1950-2099)
e) Maximum duration of heat waves by year (1950-2099)
f) Daily high temperatures by year between April and October (1950-2099)
13
Figure 4: Extreme Heat Charts for Oakland, California
The available charts and graphics for this tool are the same as those used by scientists to describe the potential increases in extreme heat events, however these graphics are usually limited to one or two locations. By integrating the data into a dynamic online mapping environment, users can now access this same information for any location throughout the state.
a. b. c.
d. e. f.
14
CHAPTER 5: Future Opportunities Cal-Adapt continues to be refined and improved with respect to utilization by target audiences. This section highlights new opportunities that are being explored.
5.1 New Features Given the vast amount of data available through the site, it is impossible for any single organization to build tools that might satisfy every potential use of the information. By developing an open application programming interface (API) to host the site’s data and tools the door will be open to developers in any organization to use Cal-Adapt’s wealth of resources in their own applications. In return, Cal-Adapt will host a showcase to promote tools that have been built by third party developers using the API.
Some examples of the types of new tools we hope may be built off of a Cal-Adapt API include:
• Story maps: Narrative maps that can guide a user through different climate change challenges facing California in a very simple and engaging format. Specific story maps could be developed to highlight unique challenges that may confront specific. communities and/or more broad scale challenges that may confront the state as a whole.
• Energy sector specific tools: Map and data based tools that can be made relevant to the energy sector, such tools to integrate projected changes into demand forecasting.
• Adaptation planning tools: Map and data based tools that can be programmed to make specific adaptation planning suggestions based on a range of different scenarios.
• Additional data combinations: Map- and data-based tools that can combine Cal-Adapt data with other organizations’ API’s highlighting additional data sets such as census or biodiversity data. When combined, these tools could advance our understanding of how projected climate change might affect different communities or environments.
5.2 New Data Hundreds of thousands of data layers are currently available through the site, and there will continue to be a need to add new data to the site, including data from the Fourth Climate Assessment which will bring about potentially millions more. Cal-Adapt should evolve to include new IPCC scenarios (RCP2.6, RCP8.5) as well as improved regional downscaling routines that offer more realistic portrayal of extreme events in California. However, given the abundance of studies that are based on previous IPCC (e.g., A2, B1) scenarios and/or earlier downscaling routines, it is important to continue to offer access to older datasets. It is essential to continually add new data, while also maintaining access to the original data, will present new challenges to keep the site fresh and accessible; however, the scalable nature in which the site was developed will help make this process more manageable as previous versions of the data will remain available through drop down options while new data is highlighted by default.
15
GLOSSARY
Term Definition
A2 IPCC title for the medium-high emissions scenario. A2 projects continuous population growth and uneven economic and technological growth. The income gap between now-industrialized and developing parts of the world does not narrow. Heat-trapping emissions increase through the 21st century; atmospheric CO2 concentration approximately triples, relative to pre-industrial levels, by 2100.
Adaptation Adjustments in natural or human systems in response to actual or expected climatic stimuli or their effects, aimed at minimizing harm or taking advantage of beneficial opportunities.
B1 IPCC title for the lower emissions scenario. B1 characterizes a world with high economic growth and a global population that peaks by mid-century and then declines. There is a rapid shift toward less fossil fuel-intensive industries and introduction of clean and resource-efficient technologies. Heat-trapping emissions peak about mid-century and then decline; CO2 concentration approximately doubles, relative to pre-industrial levels, by 2100
Impacts Consequences of climate change on natural and human systems. Depending on the consideration of adaptation, one can distinguish between potential impacts and residual impacts. Potential impacts are those that may occur given a projected change in climate, without considering adaptation.
IPCC Acronym for Intergovernmental Panel on Climate Change. IPCC is the leading international body for the assessment of climate change. It was established by the United Nations Environment Programme (UNEP) and the World Meteorological Organization (WMO) to provide the world with a clear scientific view on the current state of knowledge in climate change and its potential environmental and socio-economic impacts.
Projection The term "projection" is used in two senses in the climate change literature. In general usage, a projection can be regarded as any description of the future and the pathway leading to it. However, a more specific interpretation has been attached to the term "climate projection" by the IPCC when referring to model-derived estimates of future climate.
Raster A georeferenced GIS data format that consists of a matrix of cells (or pixels) organized into rows and columns (or a grid) where each cell contains a value representing information.
16
Scenario A coherent, internally consistent and plausible description of a possible future state of the world. It is not a forecast; rather, each scenario is one alternative image of how the future can unfold. A set of scenarios is often adopted to reflect, as well as possible, the range of uncertainty in projections. Other terms that have been used as synonyms for scenario are "characterization", "storyline" and "construction".
Tabular Data presented in a table or spreadsheet format. Tabular data can be read and analyzed using Excel or other spreadsheet applications.
Vulnerability Susceptibility to change or harm. The degree to which a system is exposed to, susceptible to, and (un)able to cope with and adapt to, the adverse effects of climate change, including climate variability and extremes.
17
REFERENCES
Aroonruengsawat, Anin, and Auffhammer, Maximilian. 2009. Impacts of Climate Change on Residential Electricity Consumption: Evidence from Billing Data. California Energy Commission, PIER Energy-Related Environmental Research Program. CEC-500-2009-018-D.
Cayan, D.R., Bromirski, P.D., Hayhoe, K., Tyree, M., Dettinger, M.D., Flick, R.E. Climate Change Projections of Sea Level Extremes along the California Coast. Climatic Change 87, S57–S73. 2008a.
Cayan, D.R., Maurer, E.P., Dettinger, M.D., Tyree, M., Hayhoe, K. Climate change scenarios for the California region. Climatic Change 87, 21-42. 2008b.
Knowlton, K., Rotkin-Ellman, M., King, G., Margolis, H.G., Smith, D., Solomon, G., Trent, R., English, P., 2009. The 2006 California heat wave: impacts on hospitalizations and emergency department visits. Environmental health perspectives 117, 61. 2009.
Loarie, S.R., Carter, B.E., Hayhoe, K., McMahon, S., Moe, R., Knight, C.A., Ackerly, D.D., 2008. Climate Change and the Future of California’s Endemic Flora PLOS 3, e2502. 2008.
Miller, Norman L., Jiming Jin, Katharine Hayhoe, and Maximilian Auffhammer. 2007. Climate Change, Extreme Heat, and Energy Demand in California. California Energy Commission, PIER Energy-Related Environmental Research Program. CEC-500-2007-023.
Nakicenovic, N.a.R.S., 2000. Special Report on Emissions Scenarios. Intergovernmental Panel on Climate Change. 2000.
Steiniger, S., Bocher, E., 2009. An overview on current free and open source desktop GIS developments. International Journal of Geographic Information Science 23, 1345-1370. 2009.
Westerling, A., Bryant, B. Climate change and wildfire in California. Climatic Change 87, 231-249. 2008.