Embed Size (px)
Citation preview
Visualizing Brand Associationsfrom Web Community Photos
Gunhee Kim∗
Carnegie Mellon UniversityPittsburgh, 15213 PA
Eric P. XingCarnegie Mellon University
Pittsburgh, 15213 [email protected]
ABSTRACTBrand Associations, one of central concepts in marketing,describe customers’ top-of-mind attitudes or feelings towarda brand. Thus, this consumer-driven brand equity oftenattains the grounds for purchasing products or services ofthe brand. Traditionally, brand associations are measuredby analyzing the text data from consumers’ responses tothe survey or their online conversation logs. In this paper,we propose to go beyond text data and leverage large-scaleonline photo collections contributed by the general public,which have not been explored so far. As a first technicalstep toward the study of photo-based brand associations,we aim to jointly achieve the following two visualizationtasks in a mutually-rewarding way: (i) detecting and visu-alizing core visual concepts associated with brands, and (ii)localizing the regions of brand in the images. With experi-ments on about five millions of images of 48 brands crawledfrom five popular online photo sharing sites, we demonstratethat our approach can discover complementary views on thebrand associations that are hardly mined from the text data.We also quantitatively show that our approach outperformsother candidate methods on the both visualization tasks.
Categories and Subject DescriptorsI.4.9 [Image processing and computer vision]: Appli-cations; J.4 [Computer Applications]: Social and behav-ioral sciences—Economics
KeywordsBrand associations; summarization and visualization of mul-timedia data; image segmentation
1. INTRODUCTIONBrand equity describes a set of values or assets linked to
a brand [1, 12]. It is one of core concepts in marketing
∗Gunhee Kim is now at Disney Research.
Permission to make digital or hard copies of all or part of this work for personal orclassroom use is granted without fee provided that copies are not made or distributedfor profit or commercial advantage and that copies bear this notice and the full citationon the first page. Copyrights for components of this work owned by others than theauthor(s) must be honored. Abstracting with credit is permitted. To copy otherwise, orrepublish, to post on servers or to redistribute to lists, requires prior specific permissionand/or a fee. Request permissions from [email protected]’14, February 24–28, 2014, New York, New York, USA.Copyright is held by the owner/author(s). Publication rights licensed to ACM.ACM 978-1-4503-2351-2/14/02 ...$15.00.http://dx.doi.org/10.1145/2556195.2556212.
since it is a key source of bearing the competitive advan-tage of a company over its competitors, boosting efficiencyand effectiveness of marketing programs, and attaining theprice premium due to increased customer satisfaction andloyalty, to name a few. A central component of brand eq-uity is brand associations, which are the set of associationsthat consumers perceive with the brand [12]. For example,the brand associations of Nike may include Tiger Woods,shoes, basketball, and so on. Its significance lies in that itis a customer-driven brand equity; that is, the brand as-sociations are directly connected to customers’ top-of-mindattitudes or feelings toward the brand, which provoke thereasons to preferentially purchase the products or servicesof the brand. For instance, if a customer strongly associatesNike with golf shirts, he may tend to first consider Nikeproducts over other competitors’ ones when he needs one.
Traditionally, measuring brand associations is a challeng-ing task because it should be built from direct consumerresponses to carefully designed questionnaires [2, 5, 23, 25].With the recent emergence of online social media, it hasbeen developed to indirectly leverage consumer-generateddata on online communities such as Weblogs, boards, andWiki. Beneficially, resources on such social media are ob-tainable inexpensively and almost instantaneously from alarge crowd of potential customers. One typical exampleof such practice is the Brand Association Map developedby Nielsen Online [2, 19], in which important concepts andthemes correlated with a given brand name are automati-cally extracted from the data of online conversations.
In this paper, in order to elicit the brand associations, wepropose to go beyond textual media, and take advantage oflarge-scale online photo collections, which have not been ex-plored so far. Admittedly, pictures can be inferior to mineusers’ subjective sentiments than texts (e.g . Nike is too ex-pensive). However, pictures can be a complementary infor-mation modality to show customers’ experiences regardingbrands within a natural context. With widespread availabil-ity of digital cameras and smartphones, people can freelytake pictures on any memorable moments, which includeexperiencing or purchasing products they like. In addition,many online tools enable people to easily share, comment,or bookmark the images of products that they wish to buy.
More specifically, as a first technical step to the study ofthe photo-based brand associations, we address the problemof jointly achieving the following two levels of visualizationtasks for brand associations. (See Fig.1).
(1) Detecting key pictorial concepts associated with brands:It has been a central problem in brand association research
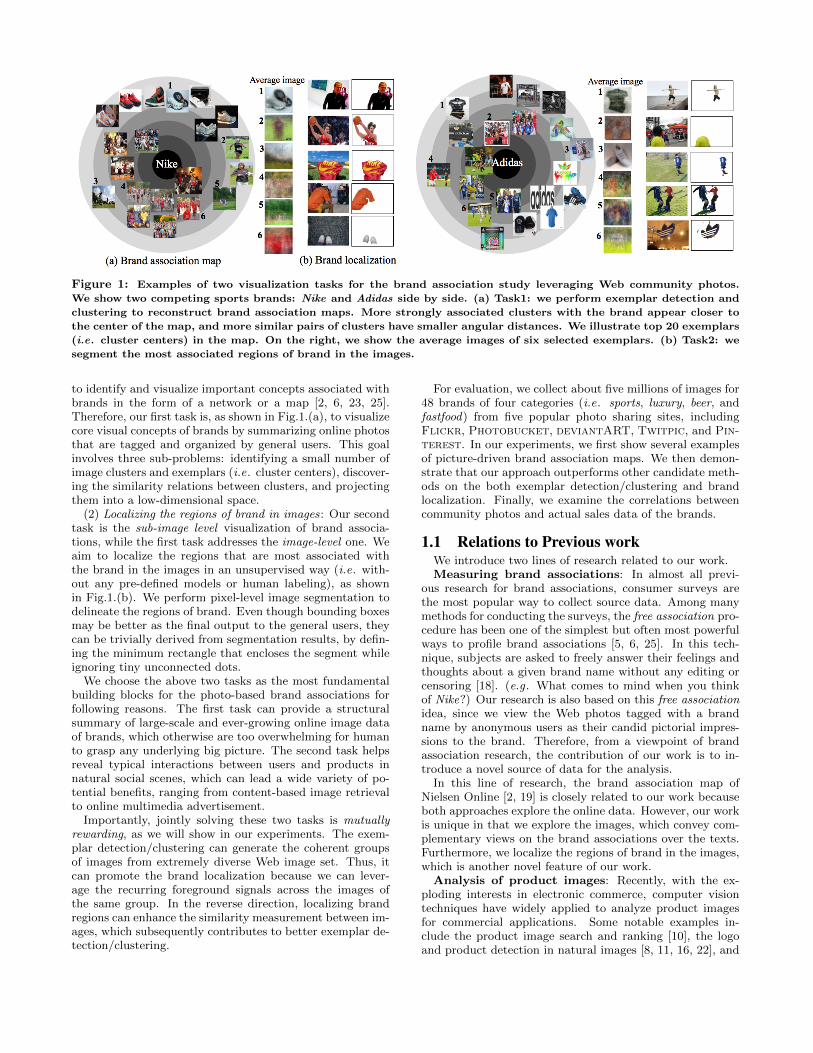
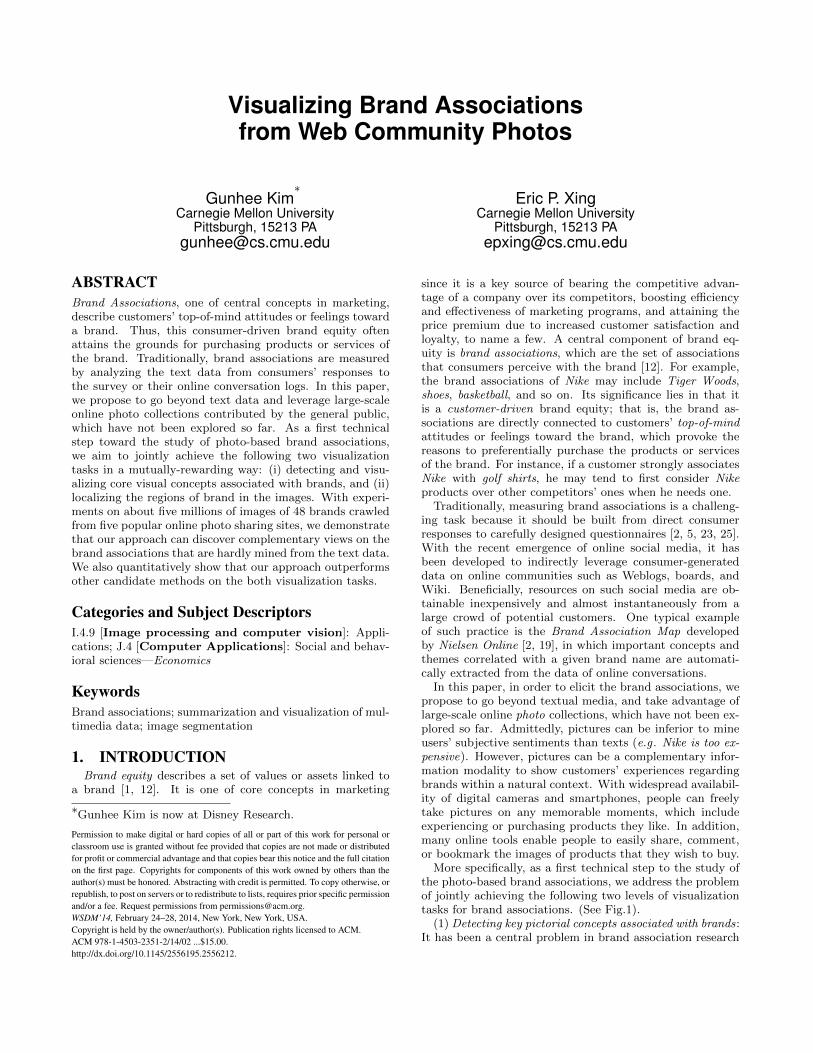
Figure 1: Examples of two visualization tasks for the brand association study leveraging Web community photos.
We show two competing sports brands: Nike and Adidas side by side. (a) Task1: we perform exemplar detection and
clustering to reconstruct brand association maps. More strongly associated clusters with the brand appear closer to
the center of the map, and more similar pairs of clusters have smaller angular distances. We illustrate top 20 exemplars
(i.e. cluster centers) in the map. On the right, we show the average images of six selected exemplars. (b) Task2: we
segment the most associated regions of brand in the images.
to identify and visualize important concepts associated withbrands in the form of a network or a map [2, 6, 23, 25].Therefore, our first task is, as shown in Fig.1.(a), to visualizecore visual concepts of brands by summarizing online photosthat are tagged and organized by general users. This goalinvolves three sub-problems: identifying a small number ofimage clusters and exemplars (i.e. cluster centers), discover-ing the similarity relations between clusters, and projectingthem into a low-dimensional space.
(2) Localizing the regions of brand in images: Our secondtask is the sub-image level visualization of brand associa-tions, while the first task addresses the image-level one. Weaim to localize the regions that are most associated withthe brand in the images in an unsupervised way (i.e. with-out any pre-defined models or human labeling), as shownin Fig.1.(b). We perform pixel-level image segmentation todelineate the regions of brand. Even though bounding boxesmay be better as the final output to the general users, theycan be trivially derived from segmentation results, by defin-ing the minimum rectangle that encloses the segment whileignoring tiny unconnected dots.
We choose the above two tasks as the most fundamentalbuilding blocks for the photo-based brand associations forfollowing reasons. The first task can provide a structuralsummary of large-scale and ever-growing online image dataof brands, which otherwise are too overwhelming for humanto grasp any underlying big picture. The second task helpsreveal typical interactions between users and products innatural social scenes, which can lead a wide variety of po-tential benefits, ranging from content-based image retrievalto online multimedia advertisement.
Importantly, jointly solving these two tasks is mutuallyrewarding, as we will show in our experiments. The exem-plar detection/clustering can generate the coherent groupsof images from extremely diverse Web image set. Thus, itcan promote the brand localization because we can lever-age the recurring foreground signals across the images ofthe same group. In the reverse direction, localizing brandregions can enhance the similarity measurement between im-ages, which subsequently contributes to better exemplar de-tection/clustering.
For evaluation, we collect about five millions of images for48 brands of four categories (i.e. sports, luxury, beer, andfastfood) from five popular photo sharing sites, includingFlickr, Photobucket, deviantART, Twitpic, and Pin-terest. In our experiments, we first show several examplesof picture-driven brand association maps. We then demon-strate that our approach outperforms other candidate meth-ods on the both exemplar detection/clustering and brandlocalization. Finally, we examine the correlations betweencommunity photos and actual sales data of the brands.
1.1 Relations to Previous workWe introduce two lines of research related to our work.Measuring brand associations: In almost all previ-
ous research for brand associations, consumer surveys arethe most popular way to collect source data. Among manymethods for conducting the surveys, the free association pro-cedure has been one of the simplest but often most powerfulways to profile brand associations [5, 6, 25]. In this tech-nique, subjects are asked to freely answer their feelings andthoughts about a given brand name without any editing orcensoring [18]. (e.g . What comes to mind when you thinkof Nike?) Our research is also based on this free associationidea, since we view the Web photos tagged with a brandname by anonymous users as their candid pictorial impres-sions to the brand. Therefore, from a viewpoint of brandassociation research, the contribution of our work is to in-troduce a novel source of data for the analysis.
In this line of research, the brand association map ofNielsen Online [2, 19] is closely related to our work becauseboth approaches explore the online data. However, our workis unique in that we explore the images, which convey com-plementary views on the brand associations over the texts.Furthermore, we localize the regions of brand in the images,which is another novel feature of our work.
Analysis of product images: Recently, with the ex-ploding interests in electronic commerce, computer visiontechniques have widely applied to analyze product imagesfor commercial applications. Some notable examples in-clude the product image search and ranking [10], the logoand product detection in natural images [8, 11, 16, 22], and
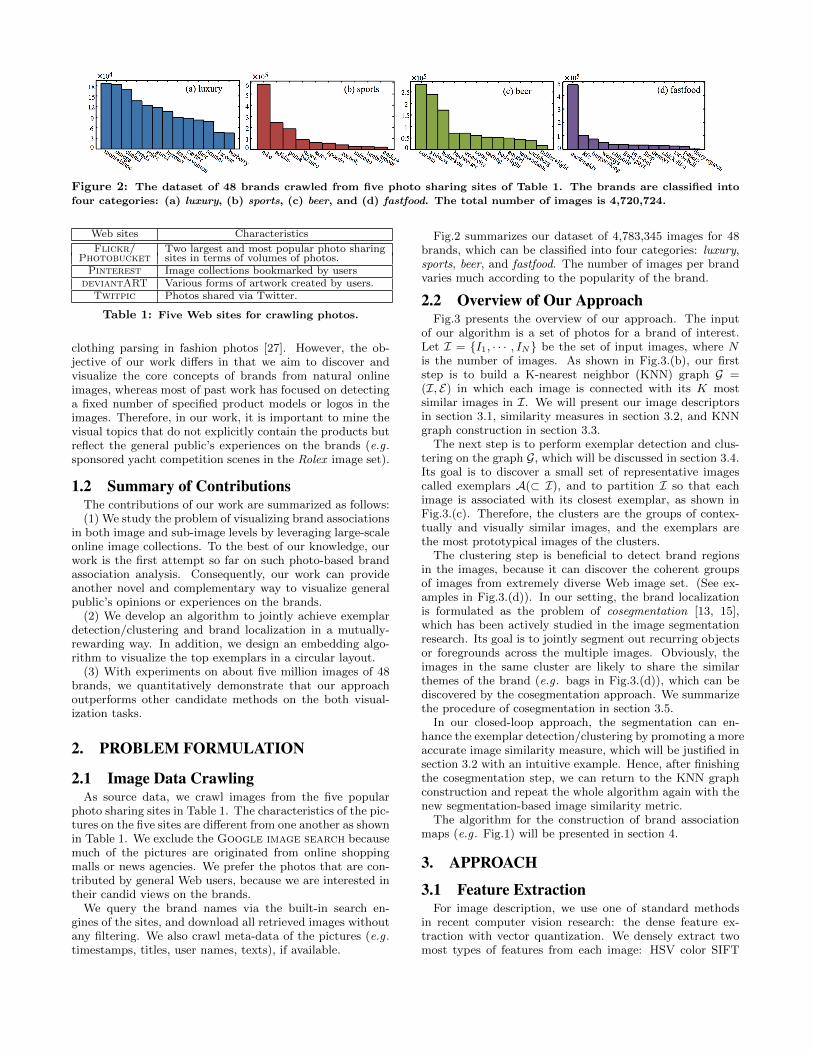
Figure 2: The dataset of 48 brands crawled from five photo sharing sites of Table 1. The brands are classified into
four categories: (a) luxury, (b) sports, (c) beer, and (d) fastfood. The total number of images is 4,720,724.
Web sites Characteristics
Flickr/ Two largest and most popular photo sharingPhotobucket sites in terms of volumes of photos.Pinterest Image collections bookmarked by users
deviantART Various forms of artwork created by users.Twitpic Photos shared via Twitter.
Table 1: Five Web sites for crawling photos.
clothing parsing in fashion photos [27]. However, the ob-jective of our work differs in that we aim to discover andvisualize the core concepts of brands from natural onlineimages, whereas most of past work has focused on detectinga fixed number of specified product models or logos in theimages. Therefore, in our work, it is important to mine thevisual topics that do not explicitly contain the products butreflect the general public’s experiences on the brands (e.g .sponsored yacht competition scenes in the Rolex image set).
1.2 Summary of ContributionsThe contributions of our work are summarized as follows:(1) We study the problem of visualizing brand associations
in both image and sub-image levels by leveraging large-scaleonline image collections. To the best of our knowledge, ourwork is the first attempt so far on such photo-based brandassociation analysis. Consequently, our work can provideanother novel and complementary way to visualize generalpublic’s opinions or experiences on the brands.
(2) We develop an algorithm to jointly achieve exemplardetection/clustering and brand localization in a mutually-rewarding way. In addition, we design an embedding algo-rithm to visualize the top exemplars in a circular layout.
(3) With experiments on about five million images of 48brands, we quantitatively demonstrate that our approachoutperforms other candidate methods on the both visual-ization tasks.
2. PROBLEM FORMULATION
2.1 Image Data CrawlingAs source data, we crawl images from the five popular
photo sharing sites in Table 1. The characteristics of the pic-tures on the five sites are different from one another as shownin Table 1. We exclude the Google image search becausemuch of the pictures are originated from online shoppingmalls or news agencies. We prefer the photos that are con-tributed by general Web users, because we are interested intheir candid views on the brands.
We query the brand names via the built-in search en-gines of the sites, and download all retrieved images withoutany filtering. We also crawl meta-data of the pictures (e.g .timestamps, titles, user names, texts), if available.
Fig.2 summarizes our dataset of 4,783,345 images for 48brands, which can be classified into four categories: luxury,sports, beer, and fastfood. The number of images per brandvaries much according to the popularity of the brand.
2.2 Overview of Our ApproachFig.3 presents the overview of our approach. The input
of our algorithm is a set of photos for a brand of interest.Let I = {I1, · · · , IN} be the set of input images, where Nis the number of images. As shown in Fig.3.(b), our firststep is to build a K-nearest neighbor (KNN) graph G =(I, E) in which each image is connected with its K mostsimilar images in I. We will present our image descriptorsin section 3.1, similarity measures in section 3.2, and KNNgraph construction in section 3.3.
The next step is to perform exemplar detection and clus-tering on the graph G, which will be discussed in section 3.4.Its goal is to discover a small set of representative imagescalled exemplars A(⊂ I), and to partition I so that eachimage is associated with its closest exemplar, as shown inFig.3.(c). Therefore, the clusters are the groups of contex-tually and visually similar images, and the exemplars arethe most prototypical images of the clusters.
The clustering step is beneficial to detect brand regionsin the images, because it can discover the coherent groupsof images from extremely diverse Web image set. (See ex-amples in Fig.3.(d)). In our setting, the brand localizationis formulated as the problem of cosegmentation [13, 15],which has been actively studied in the image segmentationresearch. Its goal is to jointly segment out recurring objectsor foregrounds across the multiple images. Obviously, theimages in the same cluster are likely to share the similarthemes of the brand (e.g . bags in Fig.3.(d)), which can bediscovered by the cosegmentation approach. We summarizethe procedure of cosegmentation in section 3.5.
In our closed-loop approach, the segmentation can en-hance the exemplar detection/clustering by promoting a moreaccurate image similarity measure, which will be justified insection 3.2 with an intuitive example. Hence, after finishingthe cosegmentation step, we can return to the KNN graphconstruction and repeat the whole algorithm again with thenew segmentation-based image similarity metric.
The algorithm for the construction of brand associationmaps (e.g . Fig.1) will be presented in section 4.
3. APPROACH
3.1 Feature ExtractionFor image description, we use one of standard methods
in recent computer vision research: the dense feature ex-traction with vector quantization. We densely extract twomost types of features from each image: HSV color SIFT
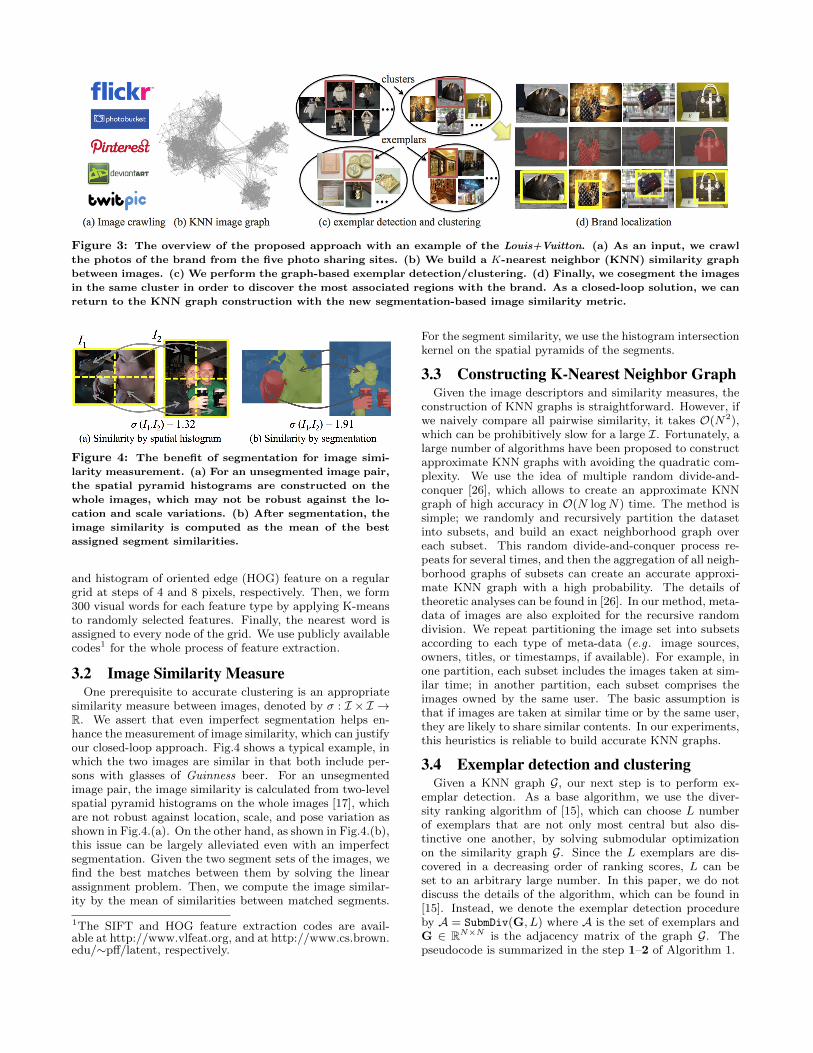
Figure 3: The overview of the proposed approach with an example of the Louis+Vuitton. (a) As an input, we crawl
the photos of the brand from the five photo sharing sites. (b) We build a K-nearest neighbor (KNN) similarity graph
between images. (c) We perform the graph-based exemplar detection/clustering. (d) Finally, we cosegment the images
in the same cluster in order to discover the most associated regions with the brand. As a closed-loop solution, we can
return to the KNN graph construction with the new segmentation-based image similarity metric.
Figure 4: The benefit of segmentation for image simi-
larity measurement. (a) For an unsegmented image pair,
the spatial pyramid histograms are constructed on the
whole images, which may not be robust against the lo-
cation and scale variations. (b) After segmentation, the
image similarity is computed as the mean of the best
assigned segment similarities.
and histogram of oriented edge (HOG) feature on a regulargrid at steps of 4 and 8 pixels, respectively. Then, we form300 visual words for each feature type by applying K-meansto randomly selected features. Finally, the nearest word isassigned to every node of the grid. We use publicly availablecodes1 for the whole process of feature extraction.
3.2 Image Similarity MeasureOne prerequisite to accurate clustering is an appropriate
similarity measure between images, denoted by σ : I × I →R. We assert that even imperfect segmentation helps en-hance the measurement of image similarity, which can justifyour closed-loop approach. Fig.4 shows a typical example, inwhich the two images are similar in that both include per-sons with glasses of Guinness beer. For an unsegmentedimage pair, the image similarity is calculated from two-levelspatial pyramid histograms on the whole images [17], whichare not robust against location, scale, and pose variation asshown in Fig.4.(a). On the other hand, as shown in Fig.4.(b),this issue can be largely alleviated even with an imperfectsegmentation. Given the two segment sets of the images, wefind the best matches between them by solving the linearassignment problem. Then, we compute the image similar-ity by the mean of similarities between matched segments.
1The SIFT and HOG feature extraction codes are avail-able at http://www.vlfeat.org, and at http://www.cs.brown.edu/∼pff/latent, respectively.
For the segment similarity, we use the histogram intersectionkernel on the spatial pyramids of the segments.
3.3 Constructing K-Nearest Neighbor GraphGiven the image descriptors and similarity measures, the
construction of KNN graphs is straightforward. However, ifwe naively compare all pairwise similarity, it takes O(N2),which can be prohibitively slow for a large I. Fortunately, alarge number of algorithms have been proposed to constructapproximate KNN graphs with avoiding the quadratic com-plexity. We use the idea of multiple random divide-and-conquer [26], which allows to create an approximate KNNgraph of high accuracy in O(N logN) time. The method issimple; we randomly and recursively partition the datasetinto subsets, and build an exact neighborhood graph overeach subset. This random divide-and-conquer process re-peats for several times, and then the aggregation of all neigh-borhood graphs of subsets can create an accurate approxi-mate KNN graph with a high probability. The details oftheoretic analyses can be found in [26]. In our method, meta-data of images are also exploited for the recursive randomdivision. We repeat partitioning the image set into subsetsaccording to each type of meta-data (e.g . image sources,owners, titles, or timestamps, if available). For example, inone partition, each subset includes the images taken at sim-ilar time; in another partition, each subset comprises theimages owned by the same user. The basic assumption isthat if images are taken at similar time or by the same user,they are likely to share similar contents. In our experiments,this heuristics is reliable to build accurate KNN graphs.
3.4 Exemplar detection and clusteringGiven a KNN graph G, our next step is to perform ex-
emplar detection. As a base algorithm, we use the diver-sity ranking algorithm of [15], which can choose L numberof exemplars that are not only most central but also dis-tinctive one another, by solving submodular optimizationon the similarity graph G. Since the L exemplars are dis-covered in a decreasing order of ranking scores, L can beset to an arbitrary large number. In this paper, we do notdiscuss the details of the algorithm, which can be found in[15]. Instead, we denote the exemplar detection procedureby A = SubmDiv(G, L) where A is the set of exemplars andG ∈ RN×N is the adjacency matrix of the graph G. Thepseudocode is summarized in the step 1–2 of Algorithm 1.
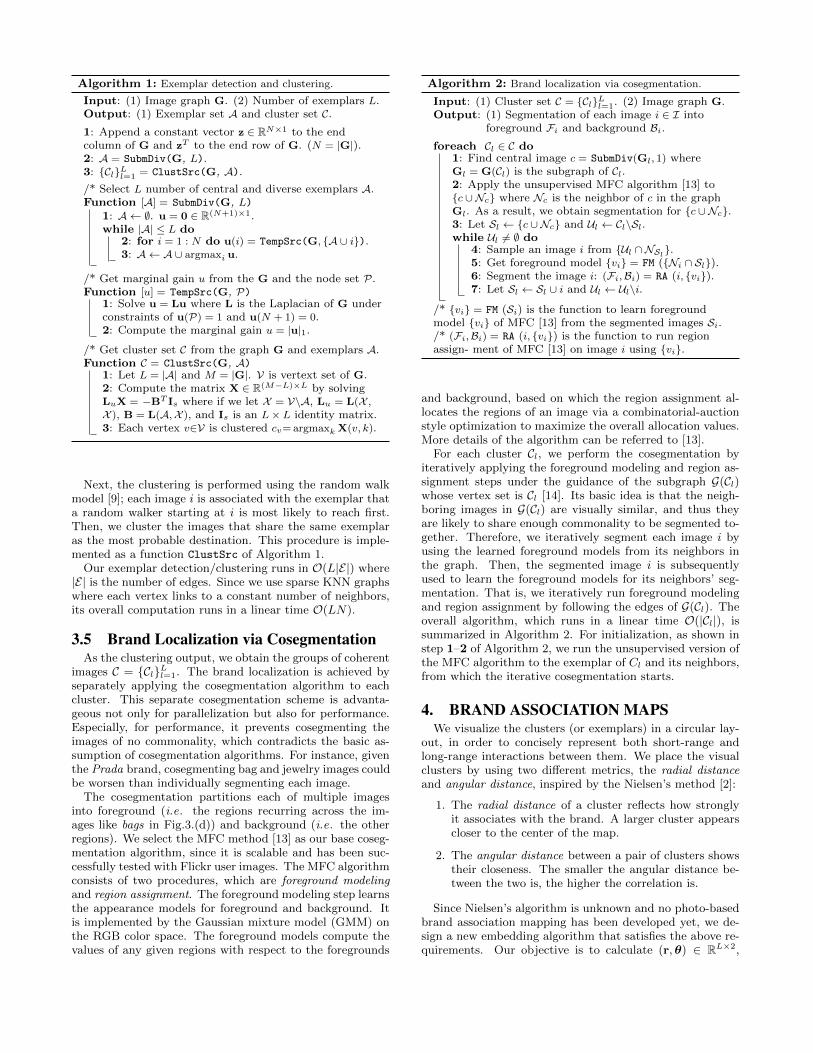
Algorithm 1: Exemplar detection and clustering.
Input: (1) Image graph G. (2) Number of exemplars L.Output: (1) Exemplar set A and cluster set C.1: Append a constant vector z ∈ RN×1 to the endcolumn of G and zT to the end row of G. (N = |G|).2: A = SubmDiv(G, L).3: {Cl}Ll=1 = ClustSrc(G, A).
/* Select L number of central and diverse exemplars A.Function [A] = SubmDiv(G, L)
1: A ← ∅. u = 0 ∈ R(N+1)×1.while |A| ≤ L do
2: for i = 1 : N do u(i) = TempSrc(G, {A ∪ i}).3: A ← A∪ argmaxi u.
/* Get marginal gain u from the G and the node set P.Function [u] = TempSrc(G, P)
1: Solve u = Lu where L is the Laplacian of G underconstraints of u(P) = 1 and u(N + 1) = 0.2: Compute the marginal gain u = |u|1.
/* Get cluster set C from the graph G and exemplars A.Function C = ClustSrc(G, A)
1: Let L = |A| and M = |G|. V is vertext set of G.2: Compute the matrix X ∈ R(M−L)×L by solvingLuX = −BT Is where if we let X = V\A, Lu = L(X ,X ), B = L(A,X ), and Is is an L× L identity matrix.3: Each vertex v∈V is clustered cv= argmaxk X(v, k).
Next, the clustering is performed using the random walkmodel [9]; each image i is associated with the exemplar thata random walker starting at i is most likely to reach first.Then, we cluster the images that share the same exemplaras the most probable destination. This procedure is imple-mented as a function ClustSrc of Algorithm 1.
Our exemplar detection/clustering runs in O(L|E|) where|E| is the number of edges. Since we use sparse KNN graphswhere each vertex links to a constant number of neighbors,its overall computation runs in a linear time O(LN).
3.5 Brand Localization via CosegmentationAs the clustering output, we obtain the groups of coherent
images C = {Cl}Ll=1. The brand localization is achieved byseparately applying the cosegmentation algorithm to eachcluster. This separate cosegmentation scheme is advanta-geous not only for parallelization but also for performance.Especially, for performance, it prevents cosegmenting theimages of no commonality, which contradicts the basic as-sumption of cosegmentation algorithms. For instance, giventhe Prada brand, cosegmenting bag and jewelry images couldbe worsen than individually segmenting each image.
The cosegmentation partitions each of multiple imagesinto foreground (i.e. the regions recurring across the im-ages like bags in Fig.3.(d)) and background (i.e. the otherregions). We select the MFC method [13] as our base coseg-mentation algorithm, since it is scalable and has been suc-cessfully tested with Flickr user images. The MFC algorithmconsists of two procedures, which are foreground modelingand region assignment. The foreground modeling step learnsthe appearance models for foreground and background. Itis implemented by the Gaussian mixture model (GMM) onthe RGB color space. The foreground models compute thevalues of any given regions with respect to the foregrounds
Algorithm 2: Brand localization via cosegmentation.
Input: (1) Cluster set C = {Cl}Ll=1. (2) Image graph G.Output: (1) Segmentation of each image i ∈ I into
foreground Fi and background Bi.foreach Cl ∈ C do
1: Find central image c = SubmDiv(Gl, 1) whereGl = G(Cl) is the subgraph of Cl.2: Apply the unsupervised MFC algorithm [13] to{c ∪Nc} where Nc is the neighbor of c in the graphGl. As a result, we obtain segmentation for {c ∪Nc}.3: Let Sl ← {c ∪Nc} and Ul ← Cl\Sl.while Ul 6= ∅ do
4: Sample an image i from {Ul ∩NSl}.5: Get foreground model {vi} = FM ({Ni ∩ Sl}).6: Segment the image i: (Fi,Bi) = RA (i, {vi}).7: Let Sl ← Sl ∪ i and Ul ← Ul\i.
/* {vi} = FM (Si) is the function to learn foregroundmodel {vi} of MFC [13] from the segmented images Si./* (Fi,Bi) = RA (i, {vi}) is the function to run regionassign- ment of MFC [13] on image i using {vi}.
and background, based on which the region assignment al-locates the regions of an image via a combinatorial-auctionstyle optimization to maximize the overall allocation values.More details of the algorithm can be referred to [13].
For each cluster Cl, we perform the cosegmentation byiteratively applying the foreground modeling and region as-signment steps under the guidance of the subgraph G(Cl)whose vertex set is Cl [14]. Its basic idea is that the neigh-boring images in G(Cl) are visually similar, and thus theyare likely to share enough commonality to be segmented to-gether. Therefore, we iteratively segment each image i byusing the learned foreground models from its neighbors inthe graph. Then, the segmented image i is subsequentlyused to learn the foreground models for its neighbors’ seg-mentation. That is, we iteratively run foreground modelingand region assignment by following the edges of G(Cl). Theoverall algorithm, which runs in a linear time O(|Cl|), issummarized in Algorithm 2. For initialization, as shown instep 1–2 of Algorithm 2, we run the unsupervised version ofthe MFC algorithm to the exemplar of Cl and its neighbors,from which the iterative cosegmentation starts.
4. BRAND ASSOCIATION MAPSWe visualize the clusters (or exemplars) in a circular lay-
out, in order to concisely represent both short-range andlong-range interactions between them. We place the visualclusters by using two different metrics, the radial distanceand angular distance, inspired by the Nielsen’s method [2]:
1. The radial distance of a cluster reflects how stronglyit associates with the brand. A larger cluster appearscloser to the center of the map.
2. The angular distance between a pair of clusters showstheir closeness. The smaller the angular distance be-tween the two is, the higher the correlation is.
Since Nielsen’s algorithm is unknown and no photo-basedbrand association mapping has been developed yet, we de-sign a new embedding algorithm that satisfies the above re-quirements. Our objective is to calculate (r,θ) ∈ RL×2,
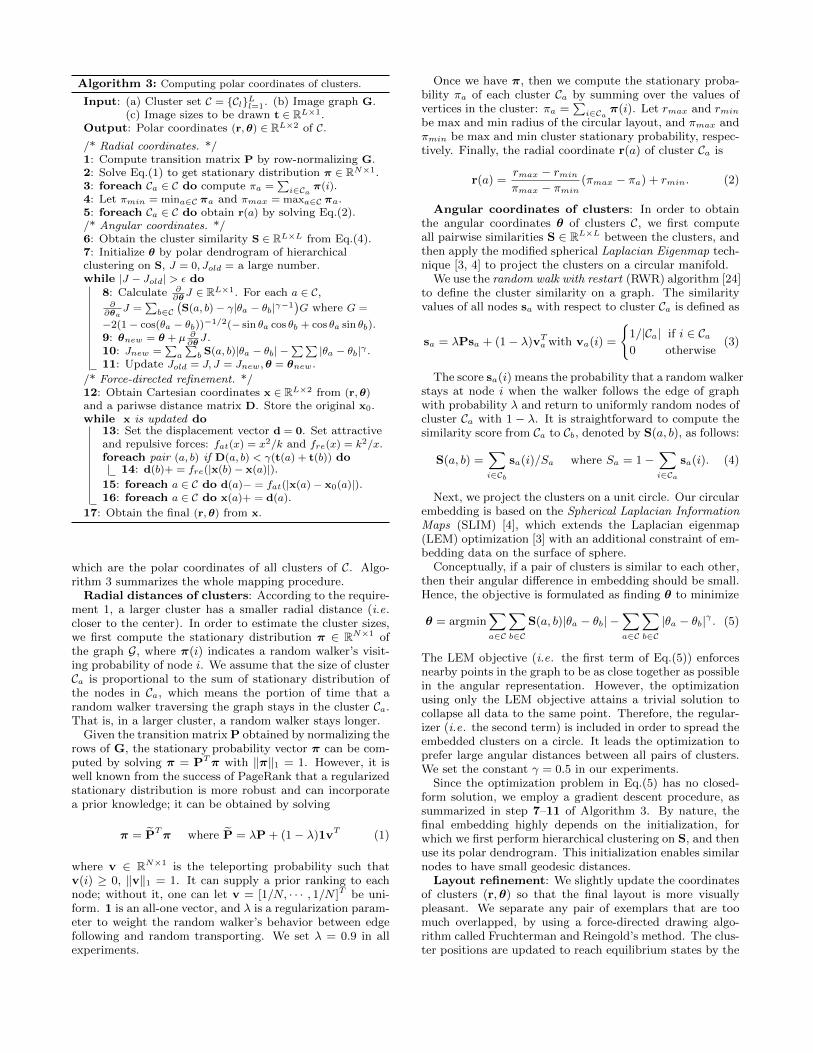
Algorithm 3: Computing polar coordinates of clusters.
Input: (a) Cluster set C = {Cl}Ll=1. (b) Image graph G.(c) Image sizes to be drawn t ∈ RL×1.
Output: Polar coordinates (r,θ) ∈ RL×2 of C./* Radial coordinates. */1: Compute transition matrix P by row-normalizing G.2: Solve Eq.(1) to get stationary distribution π ∈ RN×1.3: foreach Ca ∈ C do compute πa =
∑i∈Ca π(i).
4: Let πmin = mina∈C πa and πmax = maxa∈C πa.5: foreach Ca ∈ C do obtain r(a) by solving Eq.(2)./* Angular coordinates. */6: Obtain the cluster similarity S ∈ RL×L from Eq.(4).7: Initialize θ by polar dendrogram of hierarchicalclustering on S, J = 0, Jold = a large number.while |J − Jold| > ε do
8: Calculate ∂∂θJ ∈ RL×1. For each a ∈ C,
∂∂θa
J =∑b∈C
(S(a, b)− γ|θa − θb|γ−1
)G where G =
−2(1− cos(θa − θb))−1/2(− sin θa cos θb + cos θa sin θb).9: θnew = θ + µ ∂
∂θJ.
10: Jnew =∑a
∑b S(a, b)|θa − θb| −
∑∑|θa − θb|γ .
11: Update Jold = J, J = Jnew,θ = θnew.
/* Force-directed refinement. */12: Obtain Cartesian coordinates x ∈ RL×2 from (r,θ)and a pariwse distance matrix D. Store the original x0.while x is updated do
13: Set the displacement vector d = 0. Set attractiveand repulsive forces: fat(x) = x2/k and fre(x) = k2/x.foreach pair (a, b) if D(a, b) < γ(t(a) + t(b)) do
14: d(b)+ = fre(|x(b)− x(a)|).15: foreach a ∈ C do d(a)− = fat(|x(a)− x0(a)|).16: foreach a ∈ C do x(a)+ = d(a).
17: Obtain the final (r,θ) from x.
which are the polar coordinates of all clusters of C. Algo-rithm 3 summarizes the whole mapping procedure.
Radial distances of clusters: According to the require-ment 1, a larger cluster has a smaller radial distance (i.e.closer to the center). In order to estimate the cluster sizes,we first compute the stationary distribution π ∈ RN×1 ofthe graph G, where π(i) indicates a random walker’s visit-ing probability of node i. We assume that the size of clusterCa is proportional to the sum of stationary distribution ofthe nodes in Ca, which means the portion of time that arandom walker traversing the graph stays in the cluster Ca.That is, in a larger cluster, a random walker stays longer.
Given the transition matrix P obtained by normalizing therows of G, the stationary probability vector π can be com-puted by solving π = PTπ with ‖π‖1 = 1. However, it iswell known from the success of PageRank that a regularizedstationary distribution is more robust and can incorporatea prior knowledge; it can be obtained by solving
π = P̃Tπ where P̃ = λP + (1− λ)1vT (1)
where v ∈ RN×1 is the teleporting probability such thatv(i) ≥ 0, ‖v‖1 = 1. It can supply a prior ranking to eachnode; without it, one can let v = [1/N, · · · , 1/N ]T be uni-form. 1 is an all-one vector, and λ is a regularization param-eter to weight the random walker’s behavior between edgefollowing and random transporting. We set λ = 0.9 in allexperiments.
Once we have π, then we compute the stationary proba-bility πa of each cluster Ca by summing over the values ofvertices in the cluster: πa =
∑i∈Ca π(i). Let rmax and rmin
be max and min radius of the circular layout, and πmax andπmin be max and min cluster stationary probability, respec-tively. Finally, the radial coordinate r(a) of cluster Ca is
r(a) =rmax − rminπmax − πmin
(πmax − πa) + rmin. (2)
Angular coordinates of clusters: In order to obtainthe angular coordinates θ of clusters C, we first computeall pairwise similarities S ∈ RL×L between the clusters, andthen apply the modified spherical Laplacian Eigenmap tech-nique [3, 4] to project the clusters on a circular manifold.
We use the random walk with restart (RWR) algorithm [24]to define the cluster similarity on a graph. The similarityvalues of all nodes sa with respect to cluster Ca is defined as
sa = λPsa + (1− λ)vTa with va(i) =
{1/|Ca| if i ∈ Ca0 otherwise
(3)
The score sa(i) means the probability that a random walkerstays at node i when the walker follows the edge of graphwith probability λ and return to uniformly random nodes ofcluster Ca with 1 − λ. It is straightforward to compute thesimilarity score from Ca to Cb, denoted by S(a, b), as follows:
S(a, b) =∑i∈Cb
sa(i)/Sa where Sa = 1−∑i∈Ca
sa(i). (4)
Next, we project the clusters on a unit circle. Our circularembedding is based on the Spherical Laplacian InformationMaps (SLIM) [4], which extends the Laplacian eigenmap(LEM) optimization [3] with an additional constraint of em-bedding data on the surface of sphere.
Conceptually, if a pair of clusters is similar to each other,then their angular difference in embedding should be small.Hence, the objective is formulated as finding θ to minimize
θ = argmin∑a∈C
∑b∈C
S(a, b)|θa − θb| −∑a∈C
∑b∈C
|θa − θb|γ . (5)
The LEM objective (i.e. the first term of Eq.(5)) enforcesnearby points in the graph to be as close together as possiblein the angular representation. However, the optimizationusing only the LEM objective attains a trivial solution tocollapse all data to the same point. Therefore, the regular-izer (i.e. the second term) is included in order to spread theembedded clusters on a circle. It leads the optimization toprefer large angular distances between all pairs of clusters.We set the constant γ = 0.5 in our experiments.
Since the optimization problem in Eq.(5) has no closed-form solution, we employ a gradient descent procedure, assummarized in step 7–11 of Algorithm 3. By nature, thefinal embedding highly depends on the initialization, forwhich we first perform hierarchical clustering on S, and thenuse its polar dendrogram. This initialization enables similarnodes to have small geodesic distances.
Layout refinement: We slightly update the coordinatesof clusters (r,θ) so that the final layout is more visuallypleasant. We separate any pair of exemplars that are toomuch overlapped, by using a force-directed drawing algo-rithm called Fruchterman and Reingold’s method. The clus-ter positions are updated to reach equilibrium states by the
attractive and repulsive forces. The attractive forces en-courage the updated positions to be as similar to the orig-inal (r,θ) as possible, while the repulsive forces take partseverely overlapped exemplars. This refinement is summa-rized in step 12–17 of Algorithm 3.
5. EXPERIMENTSIn our experiments, we first present the examples of brand
association maps in section 5.1. Then, we quantitativelyevaluate the proposed approach from two technical perspec-tives: exemplar detection/clustering in section 5.2, and brandlocalization via image cosegmentation in section 5.3. Sincethe main goal of this paper is to achieve the two technicalvisualization tasks, we focus on validating the algorithmicperformance over other candidate methods instead of userstudy. Finally, we examine the correlation between our find-ings from community photos and the actual sales data ofbrands in section 5.4.
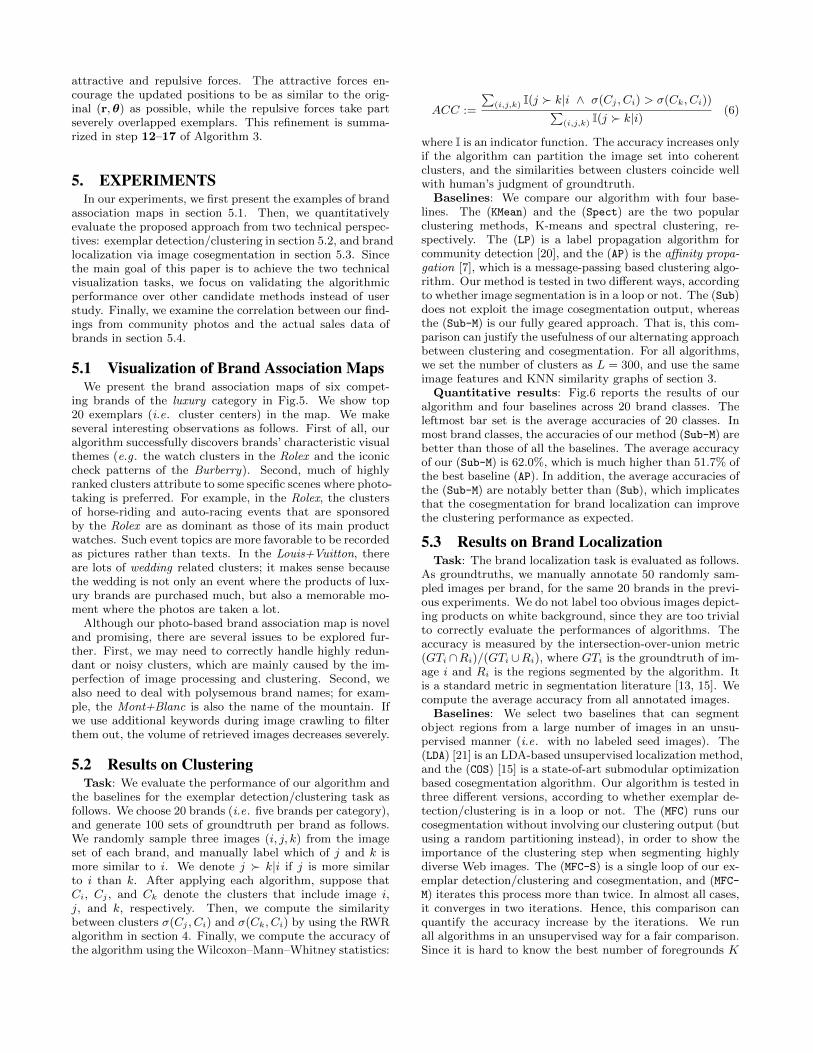
5.1 Visualization of Brand Association MapsWe present the brand association maps of six compet-
ing brands of the luxury category in Fig.5. We show top20 exemplars (i.e. cluster centers) in the map. We makeseveral interesting observations as follows. First of all, ouralgorithm successfully discovers brands’ characteristic visualthemes (e.g . the watch clusters in the Rolex and the iconiccheck patterns of the Burberry). Second, much of highlyranked clusters attribute to some specific scenes where photo-taking is preferred. For example, in the Rolex, the clustersof horse-riding and auto-racing events that are sponsoredby the Rolex are as dominant as those of its main productwatches. Such event topics are more favorable to be recordedas pictures rather than texts. In the Louis+Vuitton, thereare lots of wedding related clusters; it makes sense becausethe wedding is not only an event where the products of lux-ury brands are purchased much, but also a memorable mo-ment where the photos are taken a lot.
Although our photo-based brand association map is noveland promising, there are several issues to be explored fur-ther. First, we may need to correctly handle highly redun-dant or noisy clusters, which are mainly caused by the im-perfection of image processing and clustering. Second, wealso need to deal with polysemous brand names; for exam-ple, the Mont+Blanc is also the name of the mountain. Ifwe use additional keywords during image crawling to filterthem out, the volume of retrieved images decreases severely.
5.2 Results on ClusteringTask: We evaluate the performance of our algorithm and
the baselines for the exemplar detection/clustering task asfollows. We choose 20 brands (i.e. five brands per category),and generate 100 sets of groundtruth per brand as follows.We randomly sample three images (i, j, k) from the imageset of each brand, and manually label which of j and k ismore similar to i. We denote j � k|i if j is more similarto i than k. After applying each algorithm, suppose thatCi, Cj , and Ck denote the clusters that include image i,j, and k, respectively. Then, we compute the similaritybetween clusters σ(Cj , Ci) and σ(Ck, Ci) by using the RWRalgorithm in section 4. Finally, we compute the accuracy ofthe algorithm using the Wilcoxon–Mann–Whitney statistics:
ACC :=
∑(i,j,k) I(j � k|i ∧ σ(Cj , Ci) > σ(Ck, Ci))∑
(i,j,k) I(j � k|i)(6)
where I is an indicator function. The accuracy increases onlyif the algorithm can partition the image set into coherentclusters, and the similarities between clusters coincide wellwith human’s judgment of groundtruth.
Baselines: We compare our algorithm with four base-lines. The (KMean) and the (Spect) are the two popularclustering methods, K-means and spectral clustering, re-spectively. The (LP) is a label propagation algorithm forcommunity detection [20], and the (AP) is the affinity propa-gation [7], which is a message-passing based clustering algo-rithm. Our method is tested in two different ways, accordingto whether image segmentation is in a loop or not. The (Sub)does not exploit the image cosegmentation output, whereasthe (Sub-M) is our fully geared approach. That is, this com-parison can justify the usefulness of our alternating approachbetween clustering and cosegmentation. For all algorithms,we set the number of clusters as L = 300, and use the sameimage features and KNN similarity graphs of section 3.
Quantitative results: Fig.6 reports the results of ouralgorithm and four baselines across 20 brand classes. Theleftmost bar set is the average accuracies of 20 classes. Inmost brand classes, the accuracies of our method (Sub-M) arebetter than those of all the baselines. The average accuracyof our (Sub-M) is 62.0%, which is much higher than 51.7% ofthe best baseline (AP). In addition, the average accuracies ofthe (Sub-M) are notably better than (Sub), which implicatesthat the cosegmentation for brand localization can improvethe clustering performance as expected.
5.3 Results on Brand LocalizationTask: The brand localization task is evaluated as follows.
As groundtruths, we manually annotate 50 randomly sam-pled images per brand, for the same 20 brands in the previ-ous experiments. We do not label too obvious images depict-ing products on white background, since they are too trivialto correctly evaluate the performances of algorithms. Theaccuracy is measured by the intersection-over-union metric(GTi ∩Ri)/(GTi ∪Ri), where GTi is the groundtruth of im-age i and Ri is the regions segmented by the algorithm. Itis a standard metric in segmentation literature [13, 15]. Wecompute the average accuracy from all annotated images.
Baselines: We select two baselines that can segmentobject regions from a large number of images in an unsu-pervised manner (i.e. with no labeled seed images). The(LDA) [21] is an LDA-based unsupervised localization method,and the (COS) [15] is a state-of-art submodular optimizationbased cosegmentation algorithm. Our algorithm is tested inthree different versions, according to whether exemplar de-tection/clustering is in a loop or not. The (MFC) runs ourcosegmentation without involving our clustering output (butusing a random partitioning instead), in order to show theimportance of the clustering step when segmenting highlydiverse Web images. The (MFC-S) is a single loop of our ex-emplar detection/clustering and cosegmentation, and (MFC-M) iterates this process more than twice. In almost all cases,it converges in two iterations. Hence, this comparison canquantify the accuracy increase by the iterations. We runall algorithms in an unsupervised way for a fair comparison.Since it is hard to know the best number of foregrounds K
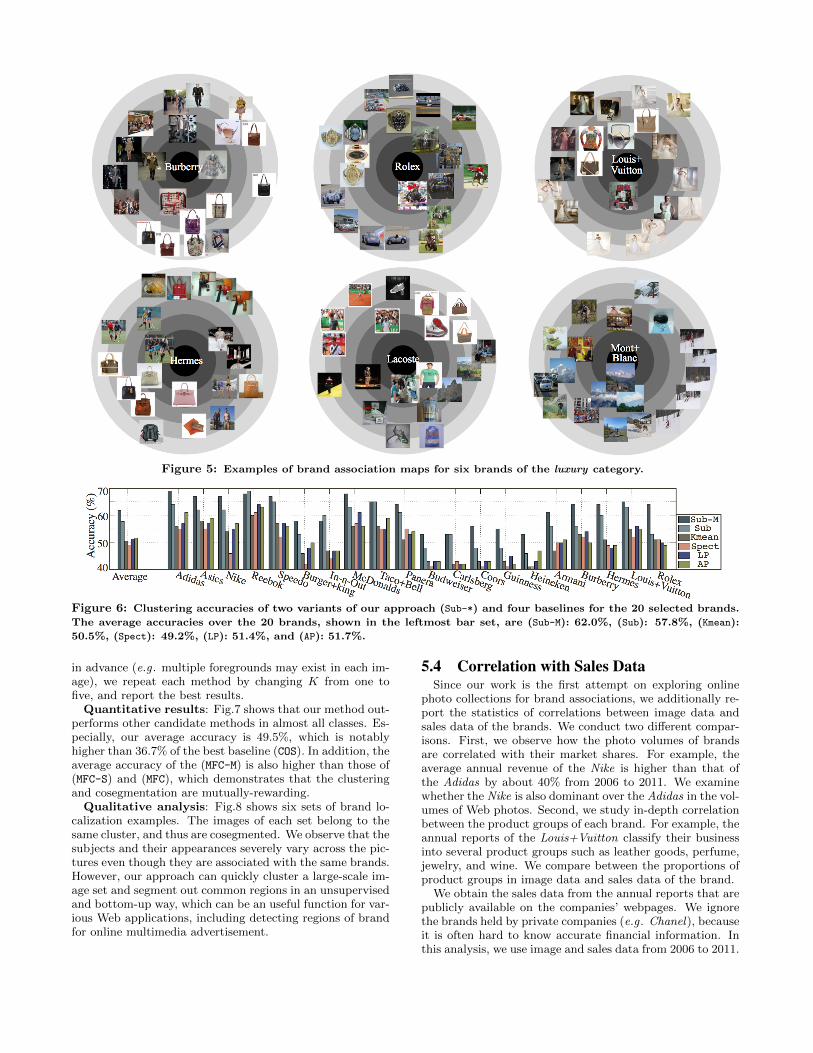
Figure 5: Examples of brand association maps for six brands of the luxury category.
Figure 6: Clustering accuracies of two variants of our approach (Sub-*) and four baselines for the 20 selected brands.
The average accuracies over the 20 brands, shown in the leftmost bar set, are (Sub-M): 62.0%, (Sub): 57.8%, (Kmean):
50.5%, (Spect): 49.2%, (LP): 51.4%, and (AP): 51.7%.
in advance (e.g . multiple foregrounds may exist in each im-age), we repeat each method by changing K from one tofive, and report the best results.
Quantitative results: Fig.7 shows that our method out-performs other candidate methods in almost all classes. Es-pecially, our average accuracy is 49.5%, which is notablyhigher than 36.7% of the best baseline (COS). In addition, theaverage accuracy of the (MFC-M) is also higher than those of(MFC-S) and (MFC), which demonstrates that the clusteringand cosegmentation are mutually-rewarding.
Qualitative analysis: Fig.8 shows six sets of brand lo-calization examples. The images of each set belong to thesame cluster, and thus are cosegmented. We observe that thesubjects and their appearances severely vary across the pic-tures even though they are associated with the same brands.However, our approach can quickly cluster a large-scale im-age set and segment out common regions in an unsupervisedand bottom-up way, which can be an useful function for var-ious Web applications, including detecting regions of brandfor online multimedia advertisement.
5.4 Correlation with Sales DataSince our work is the first attempt on exploring online
photo collections for brand associations, we additionally re-port the statistics of correlations between image data andsales data of the brands. We conduct two different compar-isons. First, we observe how the photo volumes of brandsare correlated with their market shares. For example, theaverage annual revenue of the Nike is higher than that ofthe Adidas by about 40% from 2006 to 2011. We examinewhether the Nike is also dominant over the Adidas in the vol-umes of Web photos. Second, we study in-depth correlationbetween the product groups of each brand. For example, theannual reports of the Louis+Vuitton classify their businessinto several product groups such as leather goods, perfume,jewelry, and wine. We compare between the proportions ofproduct groups in image data and sales data of the brand.
We obtain the sales data from the annual reports that arepublicly available on the companies’ webpages. We ignorethe brands held by private companies (e.g . Chanel), becauseit is often hard to know accurate financial information. Inthis analysis, we use image and sales data from 2006 to 2011.
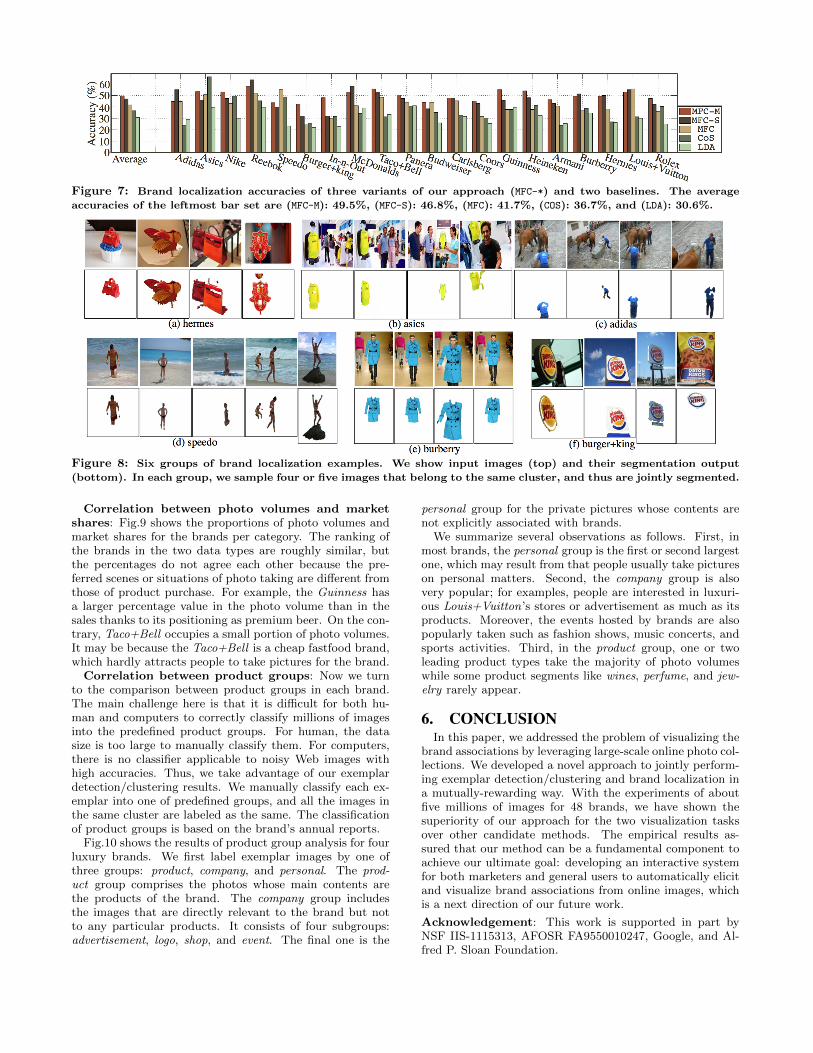
Figure 7: Brand localization accuracies of three variants of our approach (MFC-*) and two baselines. The average
accuracies of the leftmost bar set are (MFC-M): 49.5%, (MFC-S): 46.8%, (MFC): 41.7%, (COS): 36.7%, and (LDA): 30.6%.
Figure 8: Six groups of brand localization examples. We show input images (top) and their segmentation output
(bottom). In each group, we sample four or five images that belong to the same cluster, and thus are jointly segmented.
Correlation between photo volumes and marketshares: Fig.9 shows the proportions of photo volumes andmarket shares for the brands per category. The ranking ofthe brands in the two data types are roughly similar, butthe percentages do not agree each other because the pre-ferred scenes or situations of photo taking are different fromthose of product purchase. For example, the Guinness hasa larger percentage value in the photo volume than in thesales thanks to its positioning as premium beer. On the con-trary, Taco+Bell occupies a small portion of photo volumes.It may be because the Taco+Bell is a cheap fastfood brand,which hardly attracts people to take pictures for the brand.
Correlation between product groups: Now we turnto the comparison between product groups in each brand.The main challenge here is that it is difficult for both hu-man and computers to correctly classify millions of imagesinto the predefined product groups. For human, the datasize is too large to manually classify them. For computers,there is no classifier applicable to noisy Web images withhigh accuracies. Thus, we take advantage of our exemplardetection/clustering results. We manually classify each ex-emplar into one of predefined groups, and all the images inthe same cluster are labeled as the same. The classificationof product groups is based on the brand’s annual reports.
Fig.10 shows the results of product group analysis for fourluxury brands. We first label exemplar images by one ofthree groups: product, company, and personal. The prod-uct group comprises the photos whose main contents arethe products of the brand. The company group includesthe images that are directly relevant to the brand but notto any particular products. It consists of four subgroups:advertisement, logo, shop, and event. The final one is the
personal group for the private pictures whose contents arenot explicitly associated with brands.
We summarize several observations as follows. First, inmost brands, the personal group is the first or second largestone, which may result from that people usually take pictureson personal matters. Second, the company group is alsovery popular; for examples, people are interested in luxuri-ous Louis+Vuitton’s stores or advertisement as much as itsproducts. Moreover, the events hosted by brands are alsopopularly taken such as fashion shows, music concerts, andsports activities. Third, in the product group, one or twoleading product types take the majority of photo volumeswhile some product segments like wines, perfume, and jew-elry rarely appear.
6. CONCLUSIONIn this paper, we addressed the problem of visualizing the
brand associations by leveraging large-scale online photo col-lections. We developed a novel approach to jointly perform-ing exemplar detection/clustering and brand localization ina mutually-rewarding way. With the experiments of aboutfive millions of images for 48 brands, we have shown thesuperiority of our approach for the two visualization tasksover other candidate methods. The empirical results as-sured that our method can be a fundamental component toachieve our ultimate goal: developing an interactive systemfor both marketers and general users to automatically elicitand visualize brand associations from online images, whichis a next direction of our future work.
Acknowledgement: This work is supported in part byNSF IIS-1115313, AFOSR FA9550010247, Google, and Al-fred P. Sloan Foundation.
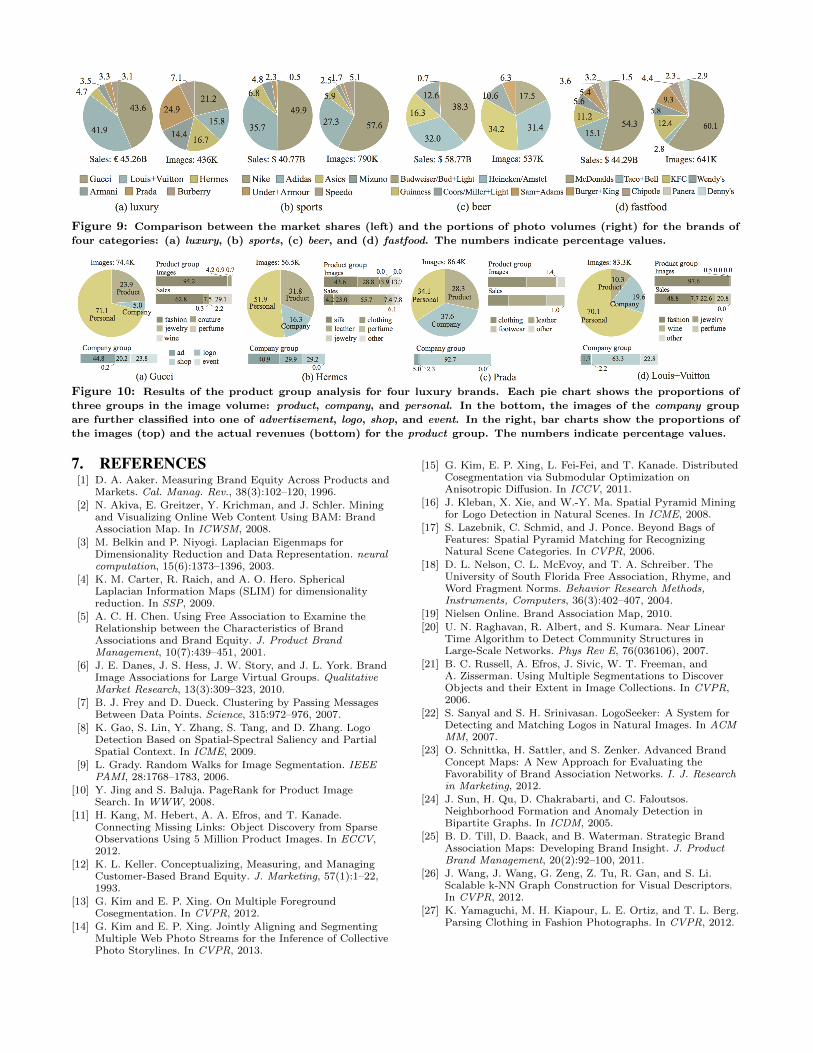
Figure 9: Comparison between the market shares (left) and the portions of photo volumes (right) for the brands of
four categories: (a) luxury, (b) sports, (c) beer, and (d) fastfood. The numbers indicate percentage values.
Figure 10: Results of the product group analysis for four luxury brands. Each pie chart shows the proportions of
three groups in the image volume: product, company, and personal. In the bottom, the images of the company group
are further classified into one of advertisement, logo, shop, and event. In the right, bar charts show the proportions of
the images (top) and the actual revenues (bottom) for the product group. The numbers indicate percentage values.
7. REFERENCES[1] D. A. Aaker. Measuring Brand Equity Across Products and
Markets. Cal. Manag. Rev., 38(3):102–120, 1996.[2] N. Akiva, E. Greitzer, Y. Krichman, and J. Schler. Mining
and Visualizing Online Web Content Using BAM: BrandAssociation Map. In ICWSM, 2008.
[3] M. Belkin and P. Niyogi. Laplacian Eigenmaps forDimensionality Reduction and Data Representation. neuralcomputation, 15(6):1373–1396, 2003.
[4] K. M. Carter, R. Raich, and A. O. Hero. SphericalLaplacian Information Maps (SLIM) for dimensionalityreduction. In SSP, 2009.
[5] A. C. H. Chen. Using Free Association to Examine theRelationship between the Characteristics of BrandAssociations and Brand Equity. J. Product BrandManagement, 10(7):439–451, 2001.
[6] J. E. Danes, J. S. Hess, J. W. Story, and J. L. York. BrandImage Associations for Large Virtual Groups. QualitativeMarket Research, 13(3):309–323, 2010.
[7] B. J. Frey and D. Dueck. Clustering by Passing MessagesBetween Data Points. Science, 315:972–976, 2007.
[8] K. Gao, S. Lin, Y. Zhang, S. Tang, and D. Zhang. LogoDetection Based on Spatial-Spectral Saliency and PartialSpatial Context. In ICME, 2009.
[9] L. Grady. Random Walks for Image Segmentation. IEEEPAMI, 28:1768–1783, 2006.
[10] Y. Jing and S. Baluja. PageRank for Product ImageSearch. In WWW, 2008.
[11] H. Kang, M. Hebert, A. A. Efros, and T. Kanade.Connecting Missing Links: Object Discovery from SparseObservations Using 5 Million Product Images. In ECCV,2012.
[12] K. L. Keller. Conceptualizing, Measuring, and ManagingCustomer-Based Brand Equity. J. Marketing, 57(1):1–22,1993.
[13] G. Kim and E. P. Xing. On Multiple ForegroundCosegmentation. In CVPR, 2012.
[14] G. Kim and E. P. Xing. Jointly Aligning and SegmentingMultiple Web Photo Streams for the Inference of CollectivePhoto Storylines. In CVPR, 2013.
[15] G. Kim, E. P. Xing, L. Fei-Fei, and T. Kanade. DistributedCosegmentation via Submodular Optimization onAnisotropic Diffusion. In ICCV, 2011.
[16] J. Kleban, X. Xie, and W.-Y. Ma. Spatial Pyramid Miningfor Logo Detection in Natural Scenes. In ICME, 2008.
[17] S. Lazebnik, C. Schmid, and J. Ponce. Beyond Bags ofFeatures: Spatial Pyramid Matching for RecognizingNatural Scene Categories. In CVPR, 2006.
[18] D. L. Nelson, C. L. McEvoy, and T. A. Schreiber. TheUniversity of South Florida Free Association, Rhyme, andWord Fragment Norms. Behavior Research Methods,Instruments, Computers, 36(3):402–407, 2004.
[19] Nielsen Online. Brand Association Map, 2010.
[20] U. N. Raghavan, R. Albert, and S. Kumara. Near LinearTime Algorithm to Detect Community Structures inLarge-Scale Networks. Phys Rev E, 76(036106), 2007.
[21] B. C. Russell, A. Efros, J. Sivic, W. T. Freeman, andA. Zisserman. Using Multiple Segmentations to DiscoverObjects and their Extent in Image Collections. In CVPR,2006.
[22] S. Sanyal and S. H. Srinivasan. LogoSeeker: A System forDetecting and Matching Logos in Natural Images. In ACMMM, 2007.
[23] O. Schnittka, H. Sattler, and S. Zenker. Advanced BrandConcept Maps: A New Approach for Evaluating theFavorability of Brand Association Networks. I. J. Researchin Marketing, 2012.
[24] J. Sun, H. Qu, D. Chakrabarti, and C. Faloutsos.Neighborhood Formation and Anomaly Detection inBipartite Graphs. In ICDM, 2005.
[25] B. D. Till, D. Baack, and B. Waterman. Strategic BrandAssociation Maps: Developing Brand Insight. J. ProductBrand Management, 20(2):92–100, 2011.
[26] J. Wang, J. Wang, G. Zeng, Z. Tu, R. Gan, and S. Li.Scalable k-NN Graph Construction for Visual Descriptors.In CVPR, 2012.
[27] K. Yamaguchi, M. H. Kiapour, L. E. Ortiz, and T. L. Berg.Parsing Clothing in Fashion Photographs. In CVPR, 2012.