Embed Size (px)
Citation preview

Creative User-Centered Design and Validation of
Visualizations
The Barcelona Supercomputing Center (BSC-CNS) is one of the most important scientific institutions based in Barcelona, specialises on High Performance Computing (HPC) and Big Data, offering infrastructure and
supercomputing services to local and European scientists, as well as generating knowledge and technology for giving it back to society.
MareNostrum
The only UX in the village
Hello!!
I’m Luz Calvo·
UX & Information Experience
UCD-What is it?User-Centered Design (UCD) is the process of designing a tool, such as a website, application, user interface or a visualization from the perspective of how it will be understood and used by
a human user.
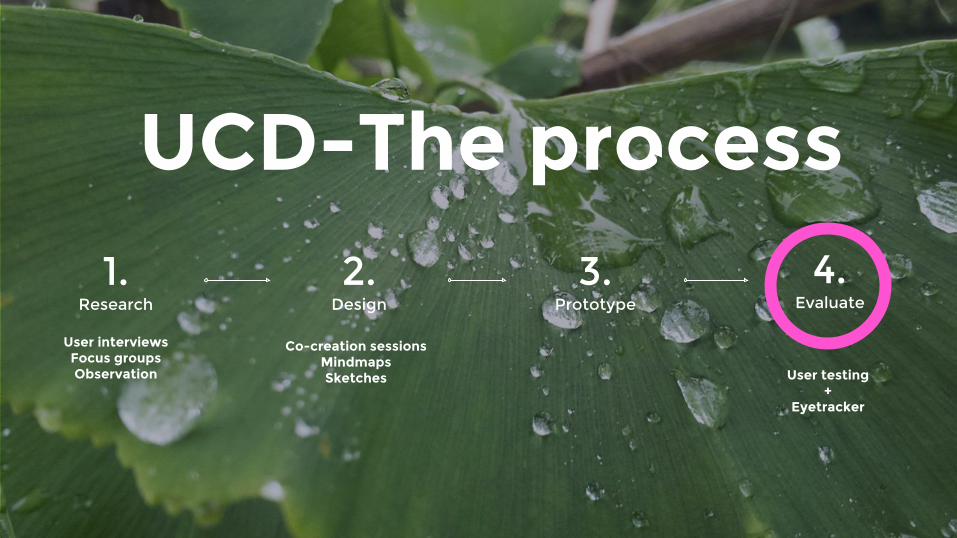
UCD-The process1.
Research
2.Design
4.Evaluate
3.Prototype
User interviewsFocus groupsObservation
Co-creation sessionsMindmapsSketches User testing
+Eyetracker

Things I’ve learned while not doing my
job
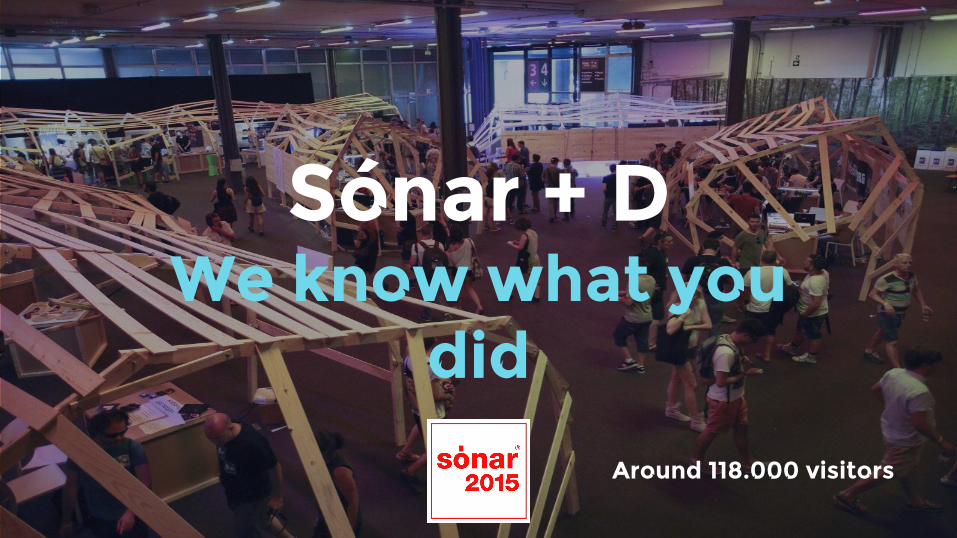
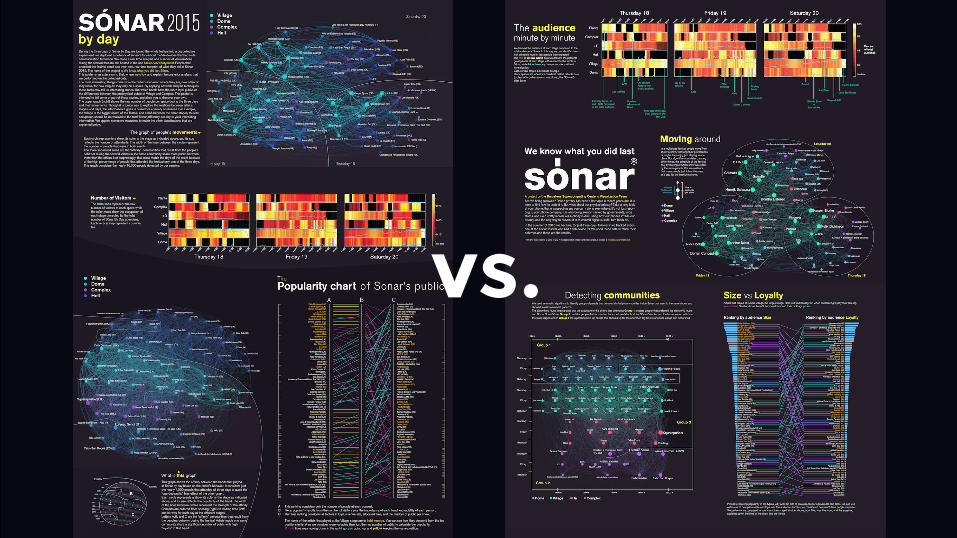
Sónar + DWe know what you
did
Around 118.000 visitors
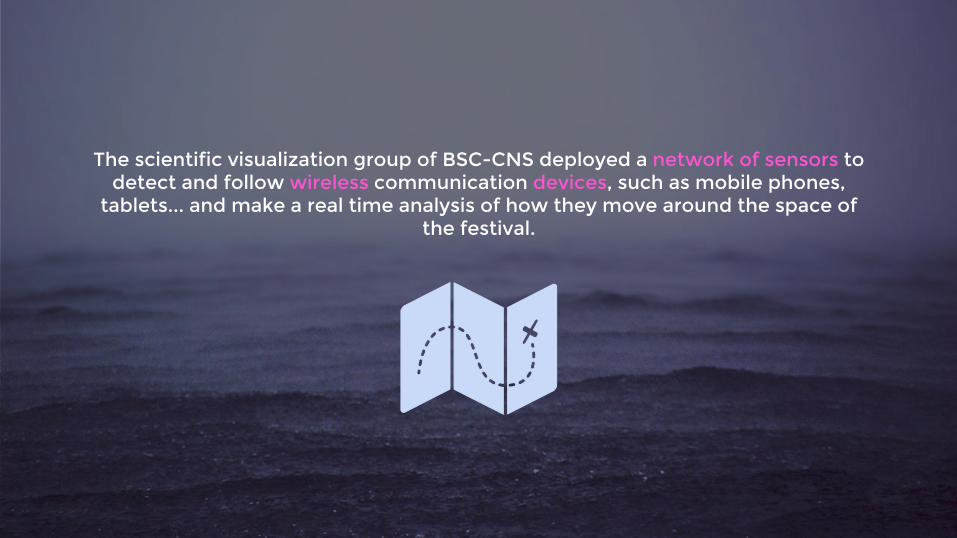
The scientific visualization group of BSC-CNS deployed a network of sensors to detect and follow wireless communication devices, such as mobile phones,
tablets... and make a real time analysis of how they move around the space of the festival.
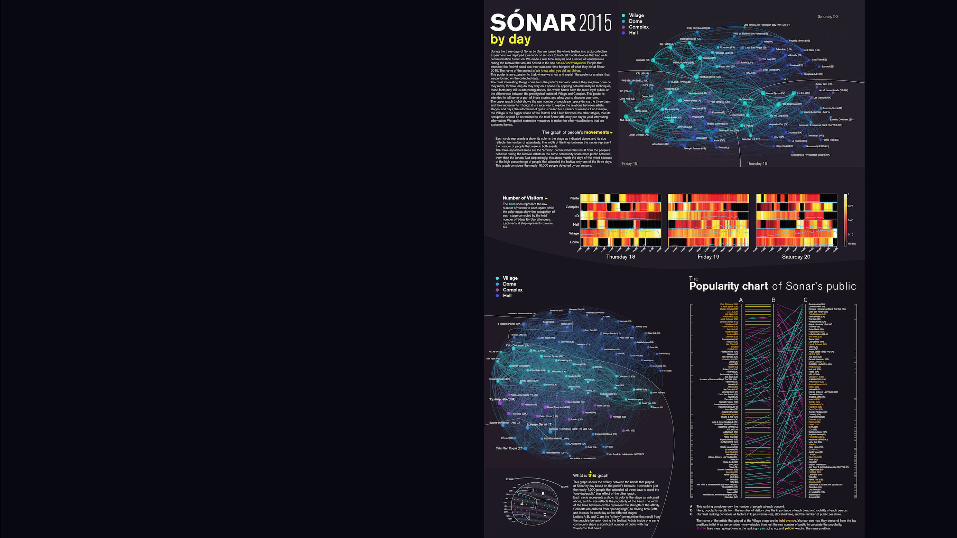

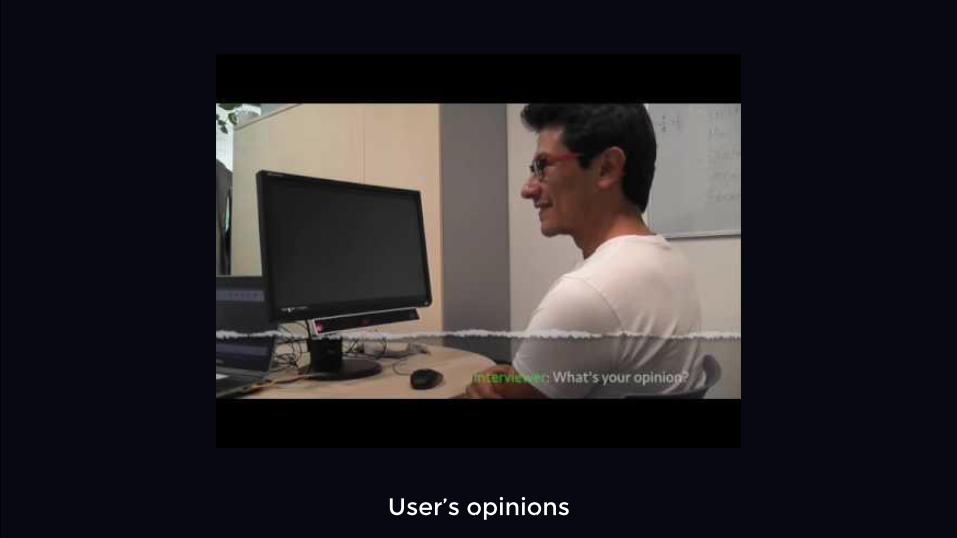
The results:The ugly truth
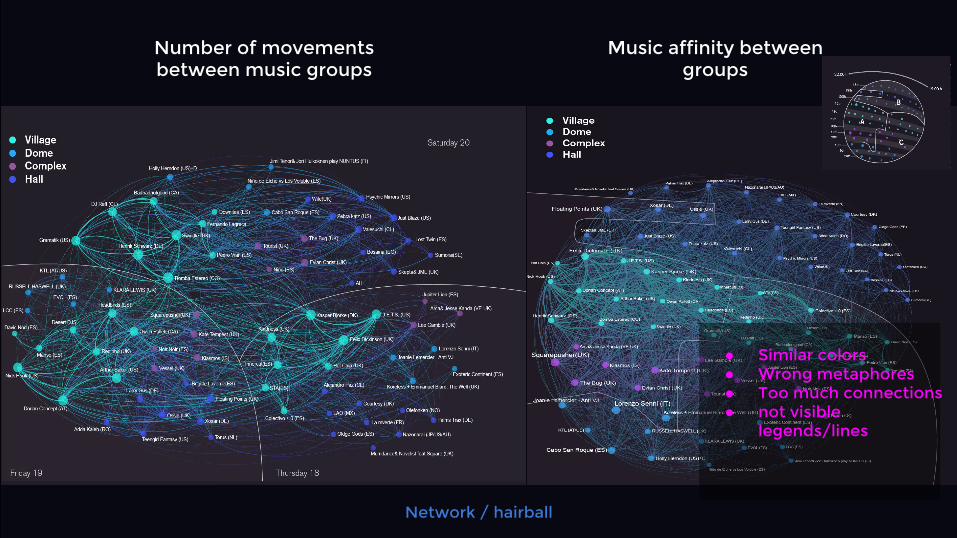
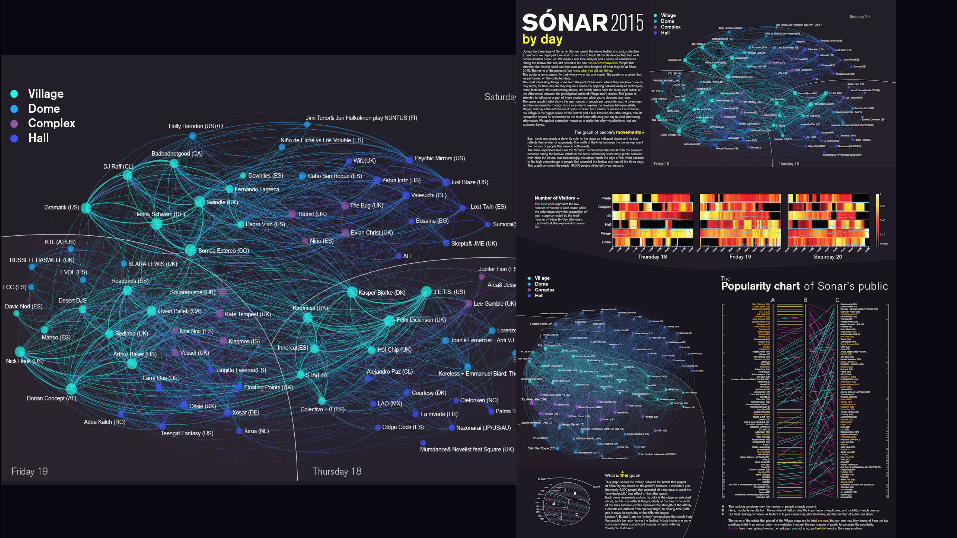
Number of movements between music groups
Music affinity between groups
● Similar colors● Wrong metaphores● Too much connections● not visible
legends/lines
Network / hairball
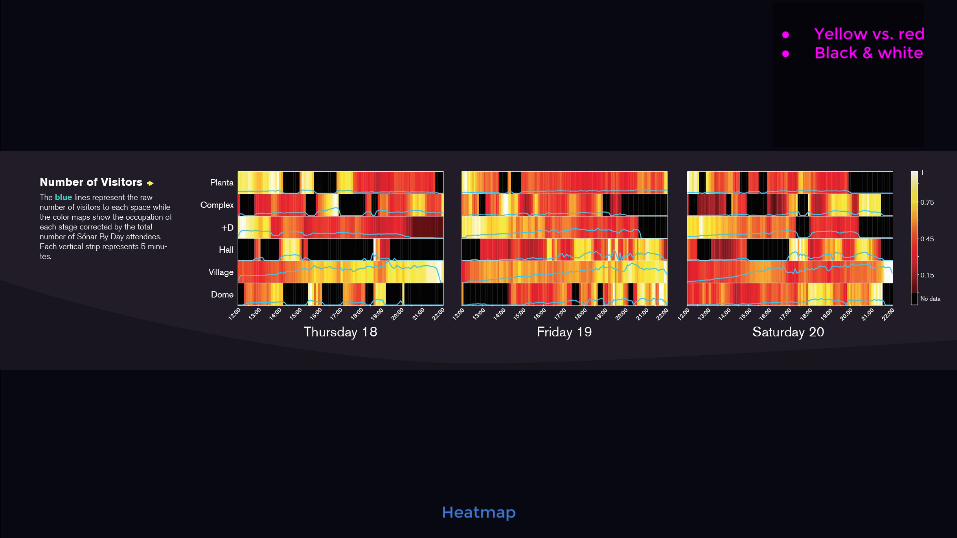
● Yellow vs. red● Black & white
Heatmap
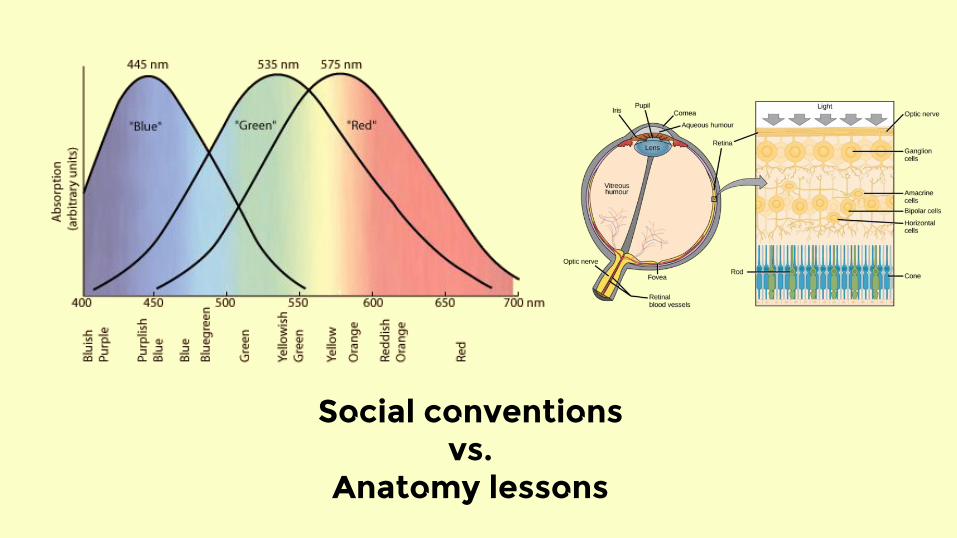
Social conventionsvs.
Anatomy lessons
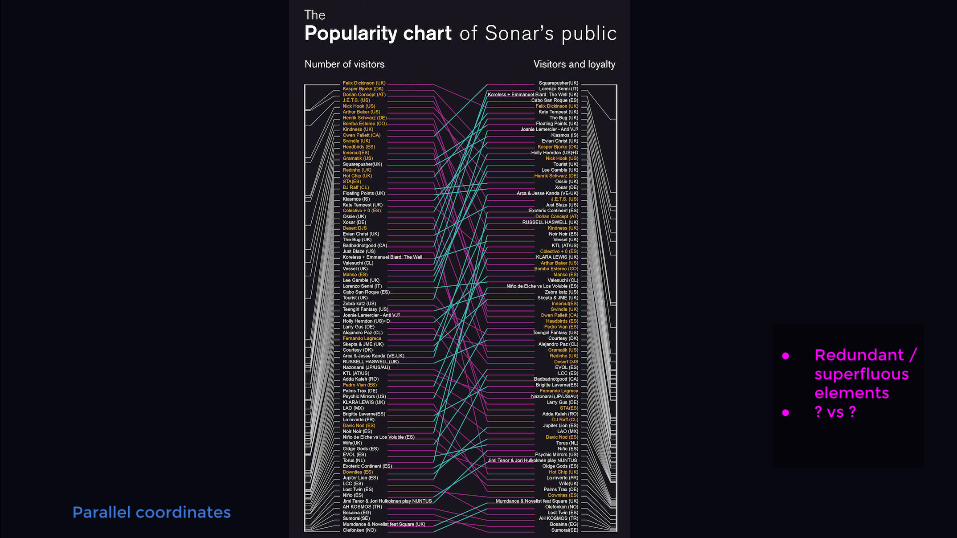
● Redundant / superfluous elements
● ? vs ?
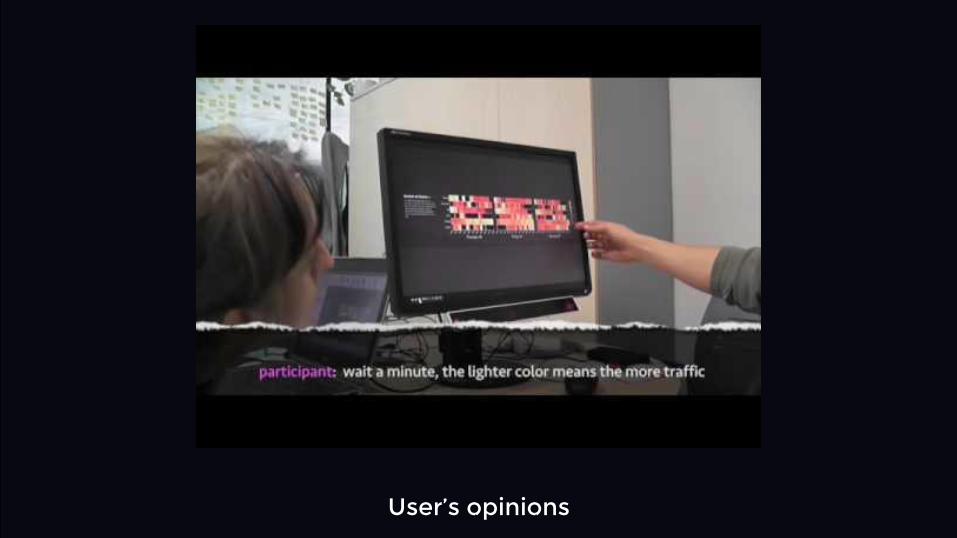
Parallel coordinates
vs.

How to deal with...
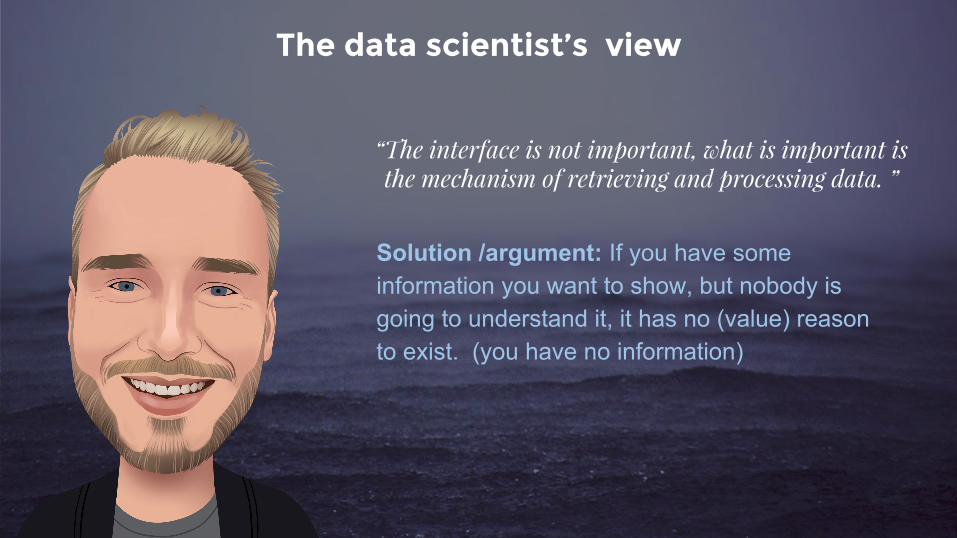
The data scientist’s view
“The interface is not important, what is important is the mechanism of retrieving and processing data. ”
Solution /argument: If you have some information you want to show, but nobody is going to understand it, it has no (value) reason to exist. (you have no information)
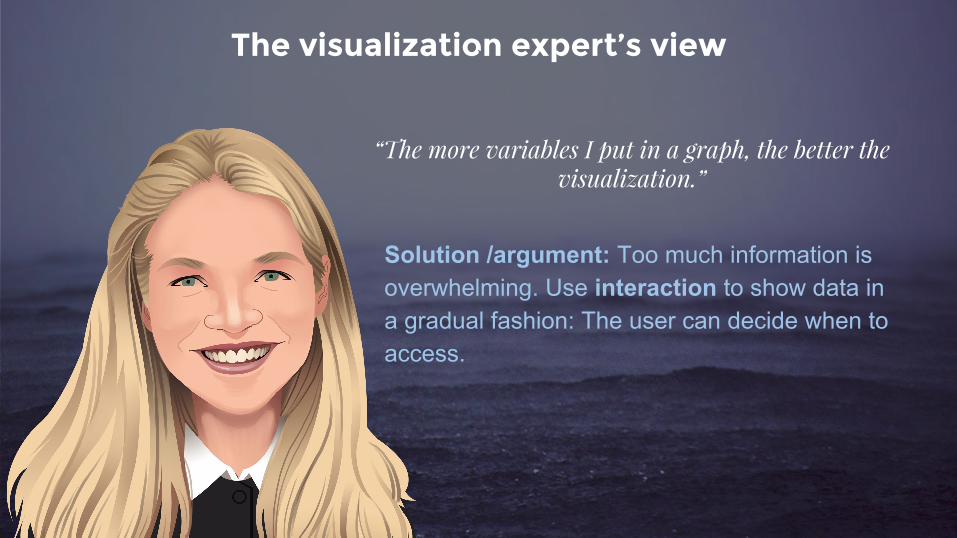
The visualization expert’s view
“The more variables I put in a graph, the better the visualization.”
Solution /argument: Too much information is overwhelming. Use interaction to show data in a gradual fashion: The user can decide when to access.
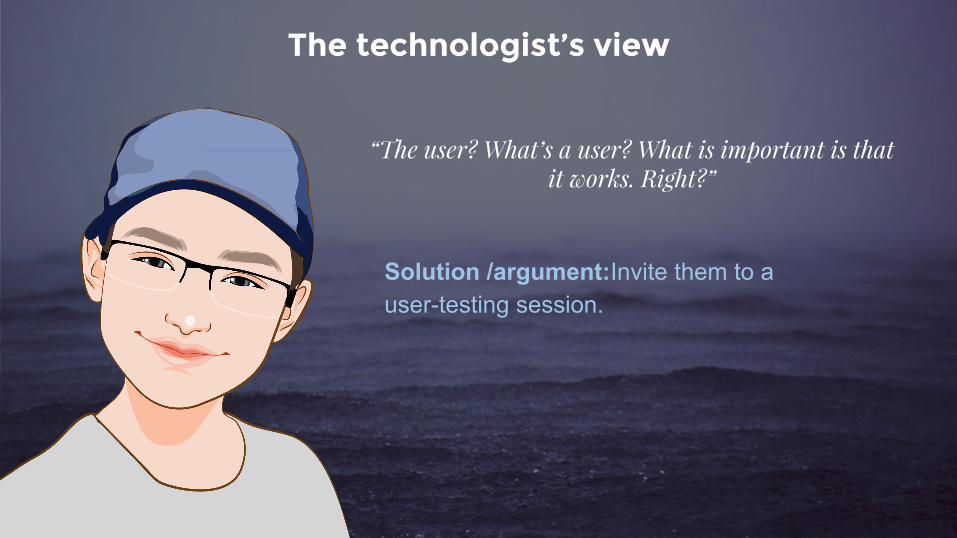
The technologist’s view
“The user? What’s a user? What is important is that it works. Right?”
Solution /argument:Invite them to a user-testing session.
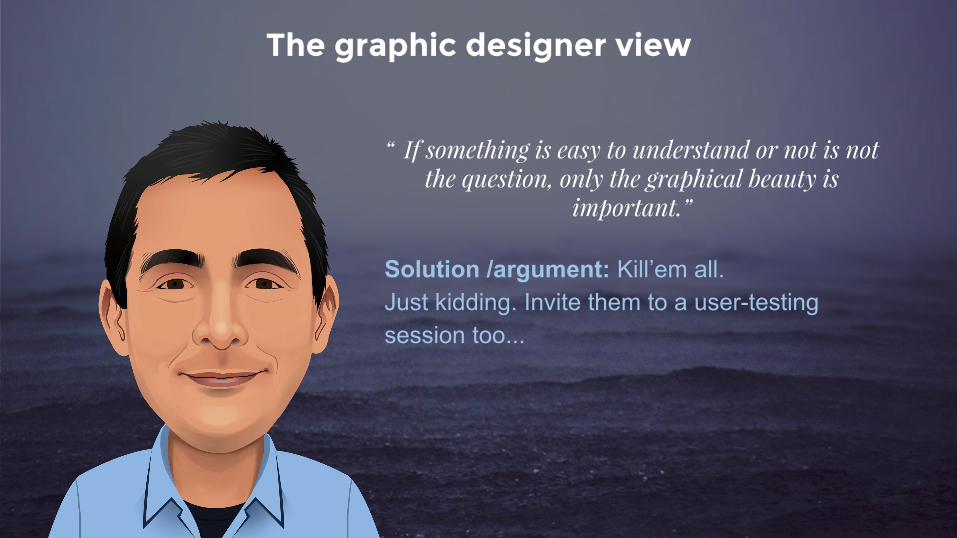
The graphic designer view
“ If something is easy to understand or not is not the question, only the graphical beauty is
important.”
Solution /argument: Kill’em all. Just kidding. Invite them to a user-testing session too...
Some thoughts
We are still learning...
![UCD User Interface Terminal - NTT Docomo...known as User-Centered Design (UCD)[1]. UCD-based development is one way of minimizing the common pitfalls of product/service providers,](https://img.pdfslide.us/doc/110x75/5fc12ef021d60d468f330ea4/ucd-user-interface-terminal-ntt-docomo-known-as-user-centered-design-ucd1.jpg)