Embed Size (px)
Citation preview

1
Transactions of JWRI, Vol.41 (2012), No. 2
Visualizations and Predictions of Welding Arcs†
TANAKA Manabu*, TASHIRO Shinichi**, TSUJIMURA Yoshihiro***
Abstract
This paper gives an instance of recent progress which has led to the capability of the visualization and prediction of welding arcs, though the dynamic observations of spectral image by a high speed digital video camera with a monochromator and also the calculations by numerical models. The dynamic observations lead to visualizations of metal vapor behavior in arc plasma and, for example, show the temperature minima at arc axis in GMA welding. Finally, we discuss plasma physics in welding arcs through numerical calculations, using the basic conservation equations of mass, energy, momentum, current and electron density of plasma physics. There is close interaction between the electrode, the arc plasma, the weld pool, and also the metal vapor, which constitute the welding process, and must be considered as a unified system.
KEY WORDS: (Arc), (Plasma), (Metal vapor), (Spectroscopic analysis), (Numerical calculation), (GMA), (Welding)
1. Introduction The progress of the numerical analysis in recent years greatly contributes to quantitative understanding of phenomenon in the arc welding. Especially, in Gas Tungsten Arc (GTA) welding, the numerical analysis model which enables to predict heat and mass transfer, weld shape and so on accurately was reported 1). However, in Gas Metal Arc (GMA) welding, a numerical analysis model which represents physical phenomenon accurately has not yet been developed. It is because metal transfer phenomenon consisting of melting at the tip of the welding wire, droplet formation and droplet detachment is very complex and the state of the arc changes greatly due to transport of metal vapor evaporated form the wire tip to the arc through plasma jet.
The metal vapor is evaporated only from the weld pool surface due to use of the non-consumable electrode in GTA welding. Because the metal vapor is swept away along the weld pool surface due to the plasma jet from the upper stream, inclusion of the metal vapor into the arc is little. Consequently, influence of the metal vapor on the arc properties is relatively small. Therefore, results of numerical analysis using the numerical model without consideration of influence of the metal vapor agree with actual phenomenon well.
On the other hand, in GMA welding, it is easily guessed that the inclusion of the metal vapor into the arc affects radiation loss, temperature distribution, electron
density distribution, current density distribution, heat flux distribution and so on dramatically and consequently changes the thermal efficiency to be important as welding heat source.
Although Ton suggested the possibility that the temperature of the arc near the arc axis decreased comparing with that apart from the arc axis due to influence of the metal vapor in GMA welding 2), it had not been confirmed up to recently because of difficulty of observation coming from the metal transfer.
Zielinska et al measured plasma temperature in GMA welding through comprehensive experimental study and confirmed the existence of the low temperature region suggested by Ton 3). They found that while the plasma temperature peaked apart from the arc axis and reached approximately 13,000K, the temperature decrease to 7,000K near the arc axis. Although large amount of the metal vapor near the arc axis was confirmed, quantitative measurement of the metal vapor concentration was not conducted.
After that, Rouffet et al showed that plasma temperature became approximately 8,000K near the arc axis through the experimental observation with Boltzmann plot method and confirmed the suggestion by Ton again 4). Furthermore, they succeeded in quantitative measurement of the metal vapor concentration and found that molar fraction of the metal vapor reached 0.7 near the arc axis. However, information about the metal vapor
† Received on December 17, 2012 * Professor ** Assistant professor *** Graduate School Student
Transactions of JWRI is published by Joining and Welding Research Institute, Osaka University, Ibaraki, Osaka 567-0047, Japan
2
concentration obtained from the experiments was only radial distribution at a height of the arc column. The overall phenomenon of GMA welding is not yet understood accurately.
This study aims to develop method for measuring dynamical variation of two-dimensional distribution of temperature and metal vapor concentration in the arc through optical measurement and to analyze behavior of the metal vapor in GMA welding. 2. Experimental
Figure 1 shows a schematic diagram of experimental setup consisting of a GMA welding torch, an inverter power source, a wire feeder, spectroscopes, high speed video cameras and a PC. The spectroscopes is Czerny-Turner type and has diffraction grating with wavelength resolution of 0.6nm. The recorded intensity distribution is converted to temperature distribution with Fowler-Milne method and Two-lines relative intensity method after Abel conversion. On the other hand, the metal vapor concentration is measured as follows. After measurement of plasma temperature, relative concentration distribution is obtained from intensity distribution of FeI line spectrum (538nm). Subsequently, GMA welding with argon-5%hydrogen shielding gas is conducted and time-averaged value of the electron density at a point on the arc axis is determined from Stark broadening of Hβ line (486.1nm). The time-averaged value of the metal vapor concentration at the point was calculated through relationship between the plasma temperature and the electron density assuming Local Thermodynamic Equilibrium (LTE). Based on the time-averaged metal vapor concentration, the relative concentration distribution is converted to an absolute concentration distribution. A frame rate is set to be 2000fps. The distance between the wire tip and the base metal surface is 25mm. The pure iron wire with diameter of 1.2mm and SS400 plate are employed as the anode and cathode, respectively. Pulsed welding current is used. The peak current, the base current, the averaged welding current and the arc voltage are 450A, 50A, 250A and 35V suitable for 1pulse-1drop. The shielding gas is pure argon and the gas flow rate is 20L/min.
Fig. 1 Schematic diagram of experimental setup 3. Results and discussion 3.1 Plasma temperature distribution
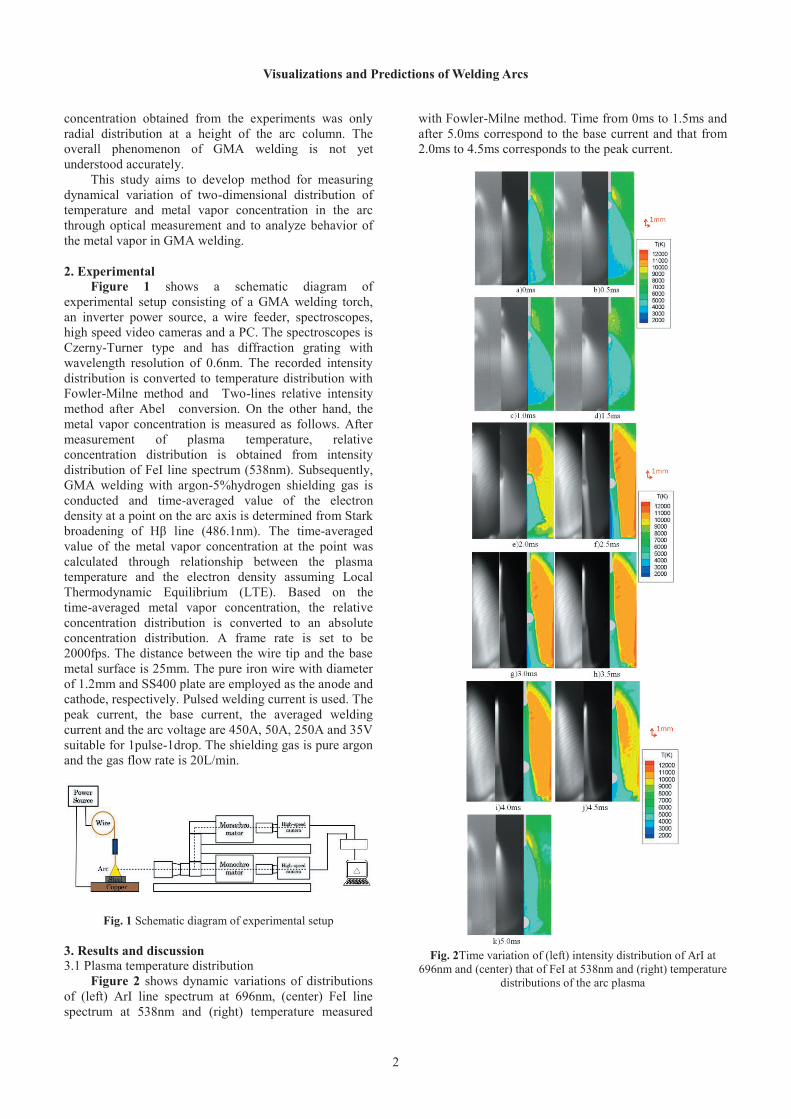
Figure 2 shows dynamic variations of distributions of (left) ArI line spectrum at 696nm, (center) FeI line spectrum at 538nm and (right) temperature measured
with Fowler-Milne method. Time from 0ms to 1.5ms and after 5.0ms correspond to the base current and that from 2.0ms to 4.5ms corresponds to the peak current.
Fig. 2Time variation of (left) intensity distribution of ArI at
696nm and (center) that of FeI at 538nm and (right) temperature distributions of the arc plasma
Visualizations and Predictions of Welding Arcs

3
Transactions of JWRI, Vol.41 (2012), No. 2
During the base current the temperature near the arc axis was between 3,000K and 5,000K and that apart from the arc axis was 6,000K and 8,000K. During the peak current, the temperature near the arc axis was between 4,000K and 7,000K and that apart from the arc axis was 10,000K and 12,000K.
Form these results, decrease in temperature near the arc axis shown by Rouffet 4) was confirmed and dynamic variation of the entire temperature distribution of the arc was presented. It was found that although the plasma temperature in GMA welding varied with the metal transfer and the welding current, the arc was basically classified into two region (low temperature region near the arc axis and high temperature region apart from the arc axis). 3.2 Behavior of metal vapor in plasma
Figure 3 shows dynamic variations of distributions of (left) ArI line spectrum at 696nm, (center) FeI line spectrum at 538nm and (right) metal vapor molar fraction in case of pulsed welding current.
During the base current between 0ms and 1.5ms, metal vapor molar fraction near the arc axis reached 100% and became metal vapor plasma in that region because dilution of the metal vapor caused by plasma jet was weakened due to decrease in plasma jet velocity.
On the other hand, during the peak current between 2.0ms and 4.5ms, although evaporation of the metal vapor from the droplet surface was enhanced, dilution of metal vapor caused by the plasma jet was prompted because of increase in plasma jet velocity. However, concentration of the metal vapor reaching approximately 100% molar fraction was maintained between the droplet and the base metal because of the existence of the droplet in metal transfer. The plasma jet velocity was decreased in the downstream region of the droplet since the stream of the plasma jet was prevented by the droplet. Consequently, it is considered that concentration of the metal vapor became high because of weakness of dilution due to the plasma jet in addition to evaporation of the metal vapor from the droplet surface.
Furthermore, molar fraction of the metal vapor near the arc axis reached 100% again in the base current at 5.0ms because dilution due to the plasma jet was weakened through decrease in the plasma jet velocity suddenly.
From the above results, behavior of the metal vapor is summarized as follows. The plasma jet to the base metal induced near the wire tip outflows along the base metal surface after change of the flow direction near the arc axis close to the base metal surface. The metal vapor evaporated from the droplet surface is transported to the arc due to the high speed plasma jet.
The concentration of the metal vapor depends on the plasma jet velocity and reaches approximately 100% molar fraction due to weakness of dilution of the metal vapor caused by the plasma jet during the base current.
On the other hand, concentration of the metal vapor becomes approximately 50% molar fraction during the
peak current because of the enhanced dilution. In addition, because of influence of the droplet in metal transfer, the concentration of the metal vapor in the downstream region of the droplet increases due to weakened dilution of the metal vapor caused by prevention of the plasma jet.
Fig. 3 Time variation of (left) intensity distribution of ArI
(696nm) and (center) that of FeI (538nm) and (right) Fe molar fraction distributions of arc plasma

4
Consequently, the plasma temperature decreases with increase in the concentration of the metal vapor. During the base current the temperature near the arc axis was between 3,000K and 5,000K and that apart from the arc axis was 6,000K and 8,000K. During the peak current, the temperature near the arc axis was between 4,000K and 7,000K and that apart from the arc axis was 10,000K and 12,000K. Therefore, in GMA welding, the arc is double structure which consists of low temperature region near the arc axis occupied mainly with the metal vapor and high temperature region apart from the arc axis occupied with the shielding gas as shown in Figure 4. 3.3 Physics of decrease in plasma temperature
In order to discuss physics of decrease in plasma temperature, numerical analysis was also conducted. The simulation model was described in detail in reference 5). The shielding gas is pure argon. Steady state is assumed. In this simulation, influence of difference of the metal vapor sources on concentration distribution was investigated.
Figure 5 shows distributions of metal vapor. In case of no metal vapor, naturally the metal vapor doesn’t exist in the arc. In case of the metal vapor evaporated from the weld pool, although the metal vapor is mixed to the arc, large part of the metal vapor was swept away along the weld pool surface to outside of the arc because the metal vapor source is in downstream of the high speed plasma jet. As a result, the metal vapor hardly flows into the arc. On the other hand, in case of the metal vapor evaporated from the wire tip, the metal vapor flows into the arc through the plasma jet because the metal vapor source is in upstream of the plasma jet. In case of the metal vapor evaporated from the wire tip and weld pool corresponding to the practical situation, it was seen that mainly the metal vapor from the wire tip was transported into the arc through the plasma jet
Figure 6 shows temperature distributions in the same conditions as Fig. 5. It was found that if the metal vapor was evaporated from the wire tip, the arc has double structure consisting of high temperature region apart from the arc axis and low temperature region near the arc axis as confirmed in the experiment. It is because the arc was cooled especially near the arc axis through the intensive radiation loss caused by high concentration of the metal vapor 6,7). This cooling effect was already predicted by Schnick 7) and was confirmed through the experiment and the simulation in this study.
Fig. 4 The structure of gas metal arc
Fig. 5 Distributions of metal vapor
Fig. 6 Distributions of temperature
4. Conclusions
Conclusions are summarized as follows: 1) In this study, time variations of distributions of plasma temperature and metal vapor concentration in GMA welding were visualized. 2) In GMA welding, the arc has double structure consisting of high temperature region apart from the arc axis and low temperature region near the arc axis due to influence of the metal vapor. 3) The metal vapor became dense under the droplet because the droplet in metal transfer affects the stream of the plasma jet. 4) The low temperature region near the arc axis occurred because the arc was cooled especially through the intensive radiation loss caused by high concentration of the metal vapor. References 1) M. Tanaka, K. Yamamoto, S. Tashiro, K. Nakata, E. Yamamoto, K. Yamazaki, K. Suzuki, A.B. Murphy and J.J. Lowke, J. Phys. D: Appl. Phys., 43 (2010) 434009. 2) H. Ton, J. Phys. D: Appl. Phys., 8 (1975) 922. 3) S. Zielinska, K. Musioł, K. Dzierzega, S. Pellerin, F.
Visualizations and Predictions of Welding Arcs

5
Transactions of JWRI, Vol.41 (2012), No. 2
Valensi, Ch de Izarra and F. Briand, Plasma Sources Science & Technology, 16 (2007) 832. 4) M.E. Rouffet, M. Wendt, G. Goett, R. Kozakov, H. Schoepp, K.D. Weltmann and D. Uhrlandt, J. Phys. D: Appl. Phys., 43 (2010) 434003. 5) M. Tanaka and J.J. Lowke, J. Phys. D: Appl. Phys., 40 (2007) R1. 6) S. Tashiro, M. Tanaka, K. Nakata, T. Iwao, F. Koshiisi,
K. Suzuki and K. Yamazaki, Sci. & Tech. Weld. Joing, 12 (2007) 202. 7) M. Schnick, U. Fussel, M. Hertel, A. Spille-Kohoff and A.B. Murphy, J. Phys. D: Appl. Phys., 43 (2010) 022001.