Embed Size (px)
Citation preview
Kristian Ekenes
Visualization with the ArcGIS API for JavaScript

Discover how to visualize geodata
in a meaningful way using the
ArcGIS API for JavaScript
One visualization cannot tell
the whole story

Renderers, symbols, etc.
API Overview

What can we visualize?• Where?
• What?
• How much?
• When?
• Multivariate

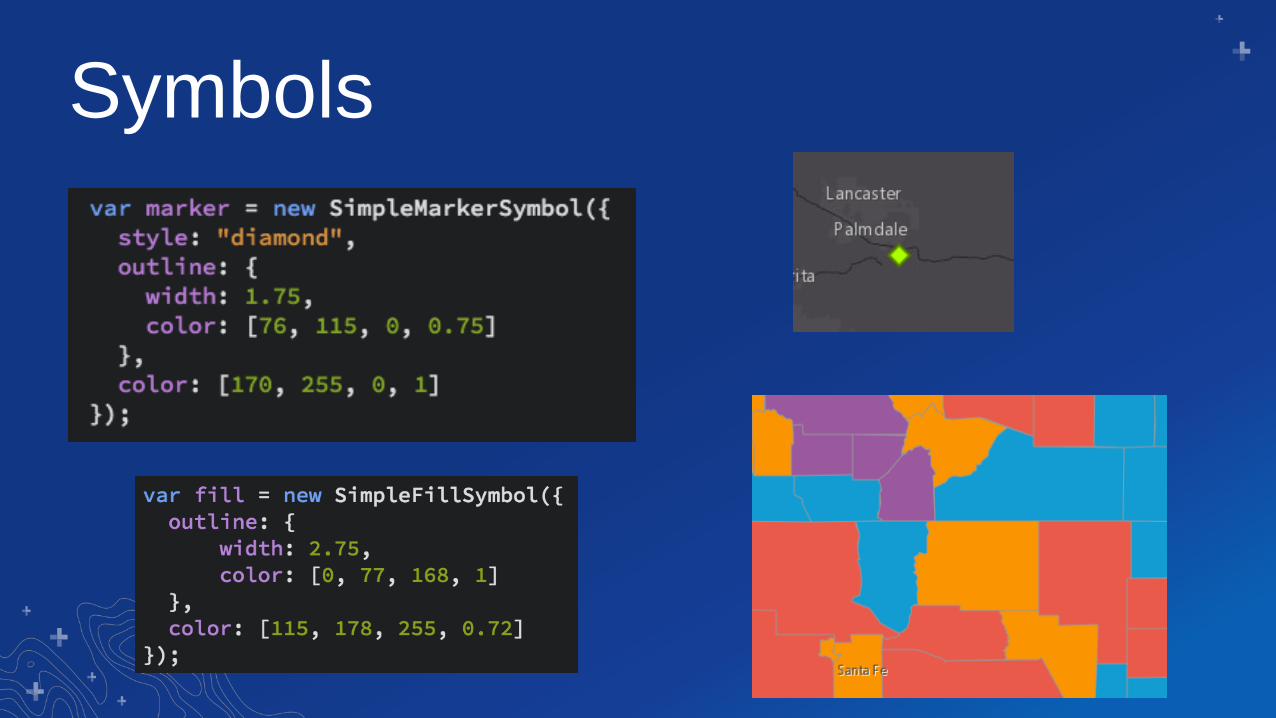
Symbols

Symbols
SimpleMarkerSymbol
based on geometry type
SimpleLineSymbol SimpleFillSymbol
Points Lines Polygons
PictureMarkerSymbolPictureFillSymbol
WebStyleSymbolCIMSymbol
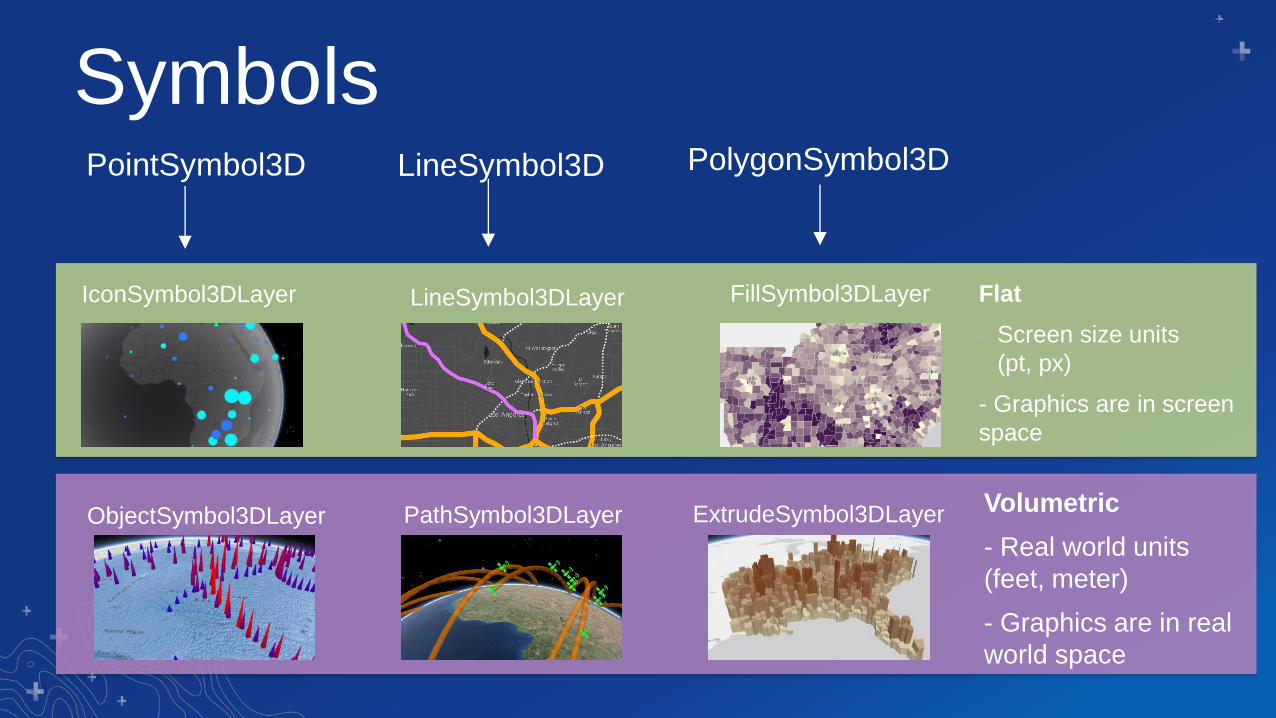
PointSymbol3D LineSymbol3D PolygonSymbol3D
IconSymbol3DLayer
ObjectSymbol3DLayer
LineSymbol3DLayer
PathSymbol3DLayer
FillSymbol3DLayer
ExtrudeSymbol3DLayer Volumetric
- Real world units
(feet, meter)
- Graphics are in real
world space
Flat
- Screen size units
(pt, px)
- Graphics are in screen
space
Symbols

MeshSymbol3D
FillSymbol3DLayer
Symbols
Symbols
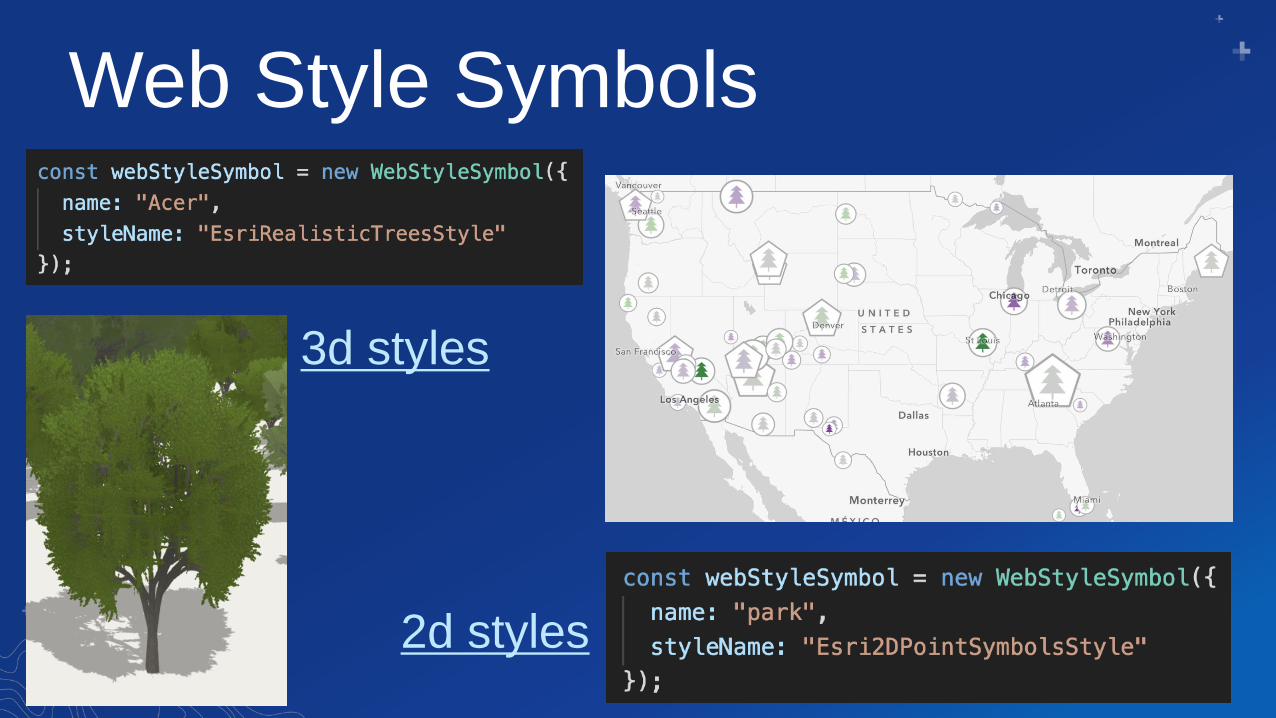
Web Style Symbols
3d styles
2d styles
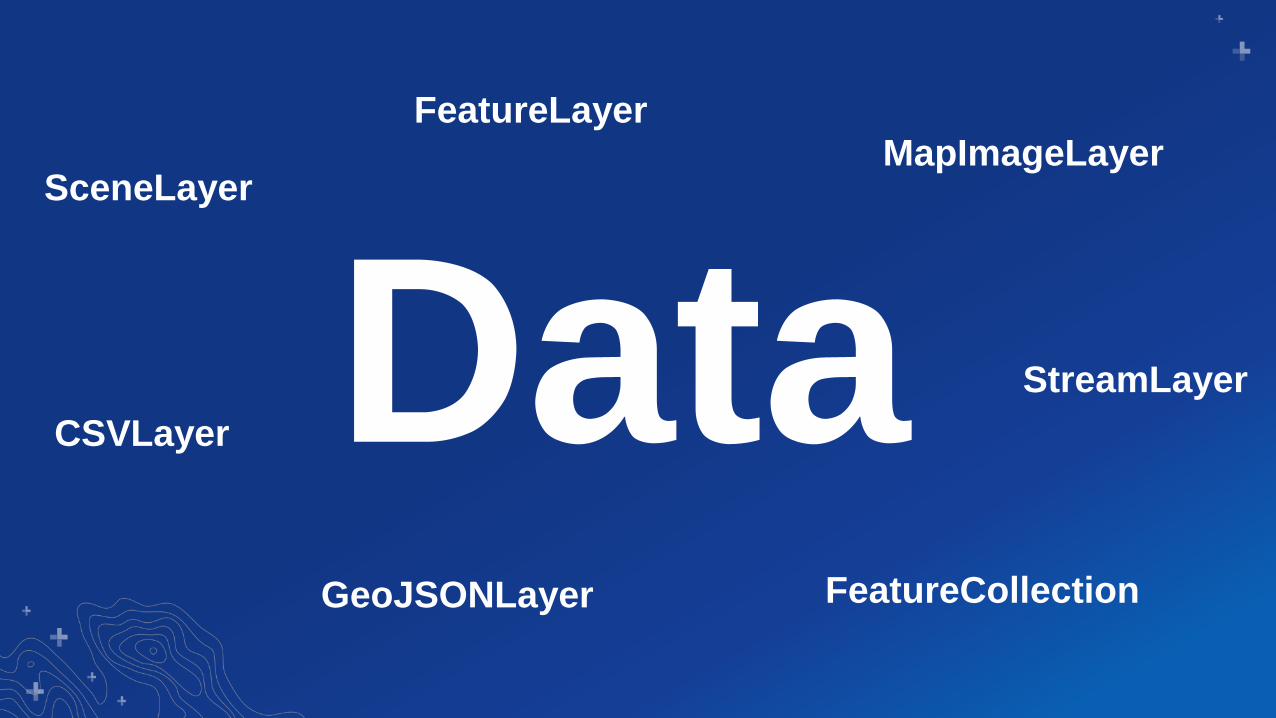
DataMapImageLayer
FeatureLayer
CSVLayer
StreamLayer
GeoJSONLayer FeatureCollection
SceneLayer
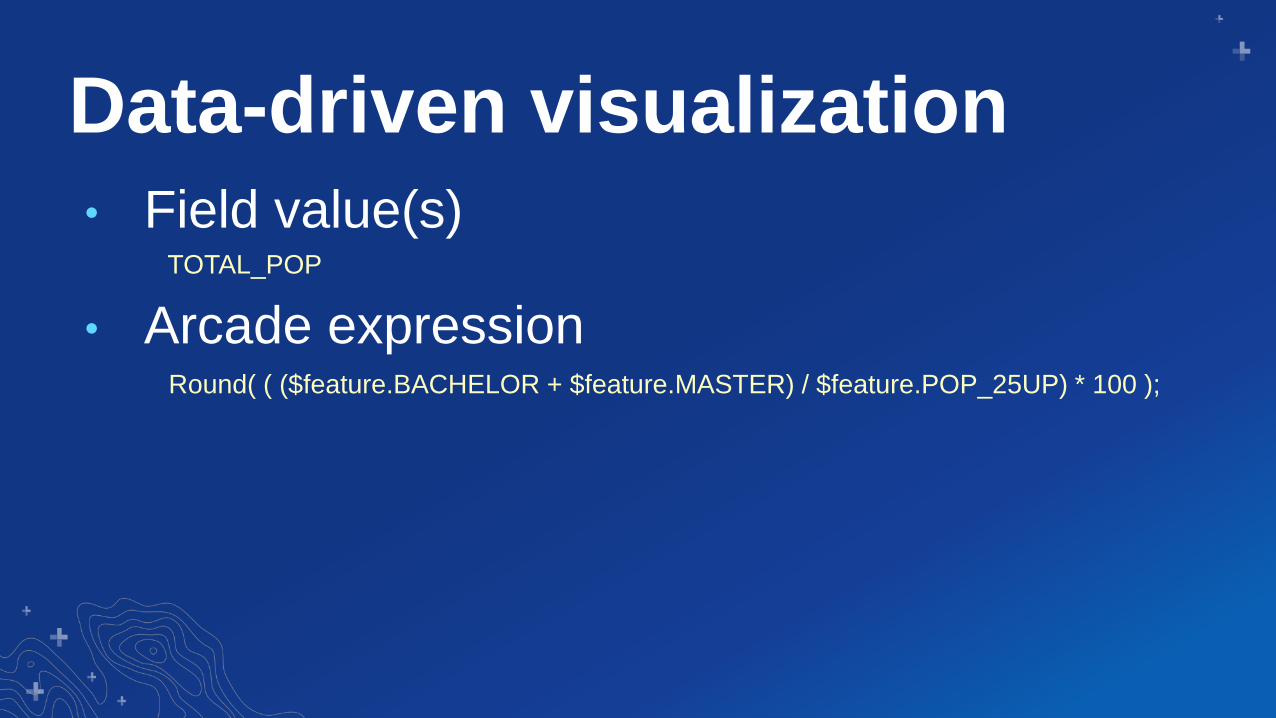
Data-driven visualization
• Field value(s)TOTAL_POP
• Arcade expressionRound( ( ($feature.BACHELOR + $feature.MASTER) / $feature.POP_25UP) * 100 );

Renderers

Renderers
Simple
UniqueValue
ClassBreaks
Heatmap

RenderersSimpleRenderer
UniqueValueRenderer
ClassBreaksRenderer
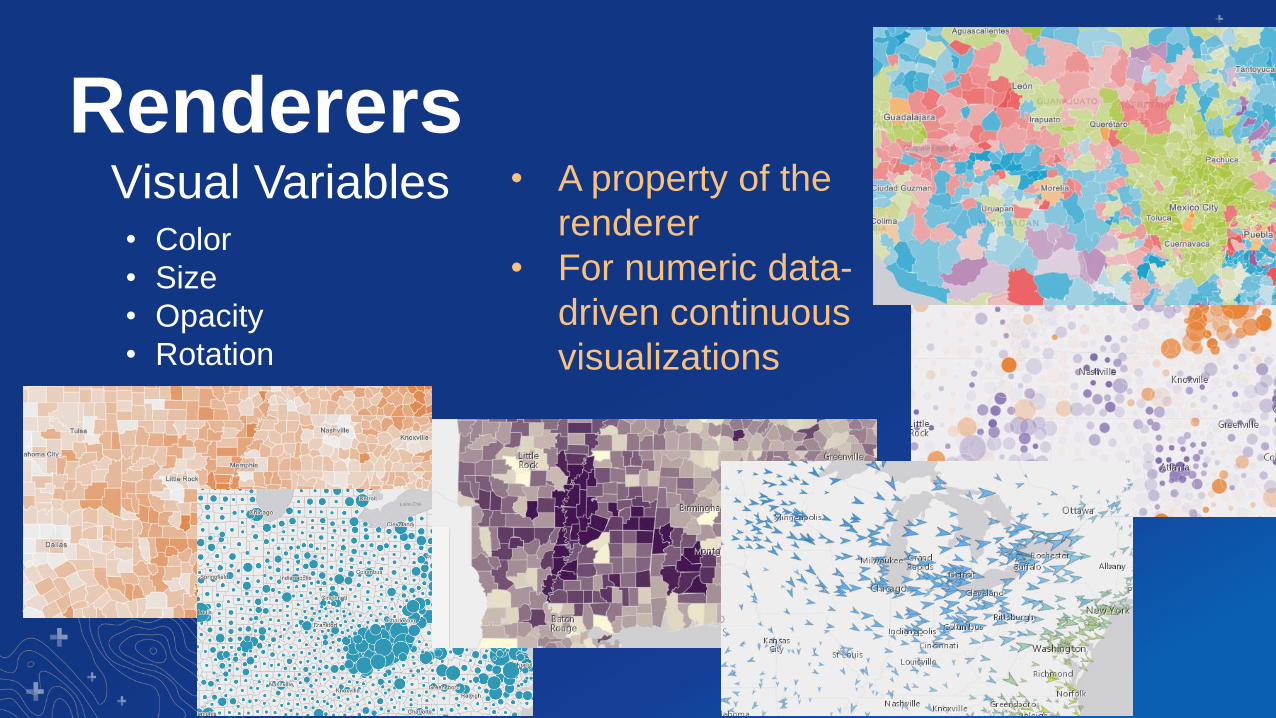
RenderersVisual Variables• Color
• Size
• Opacity
• Rotation
• A property of the
renderer
• For numeric data-
driven continuous
visualizations
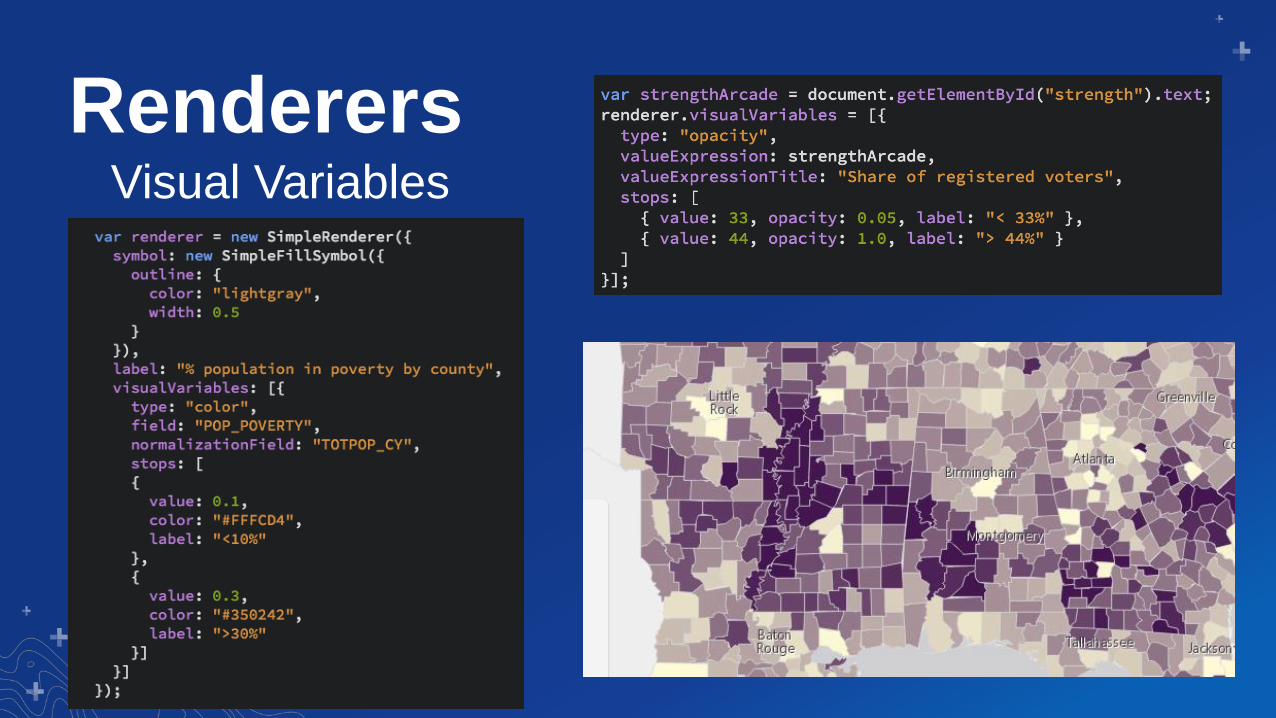
RenderersVisual Variables

Dot Density
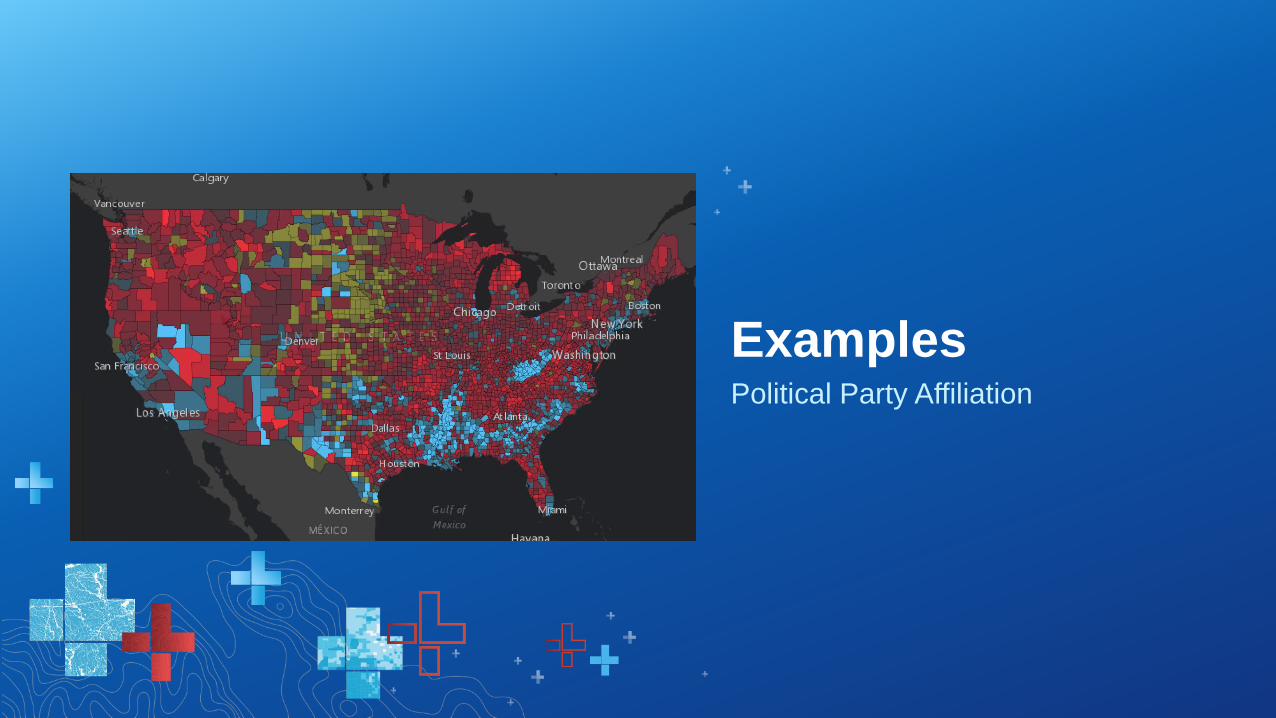
Political Party Affiliation
Examples

Symbol Size by Scale
ArcGIS blog: How and why to size symbols by scale in web maps

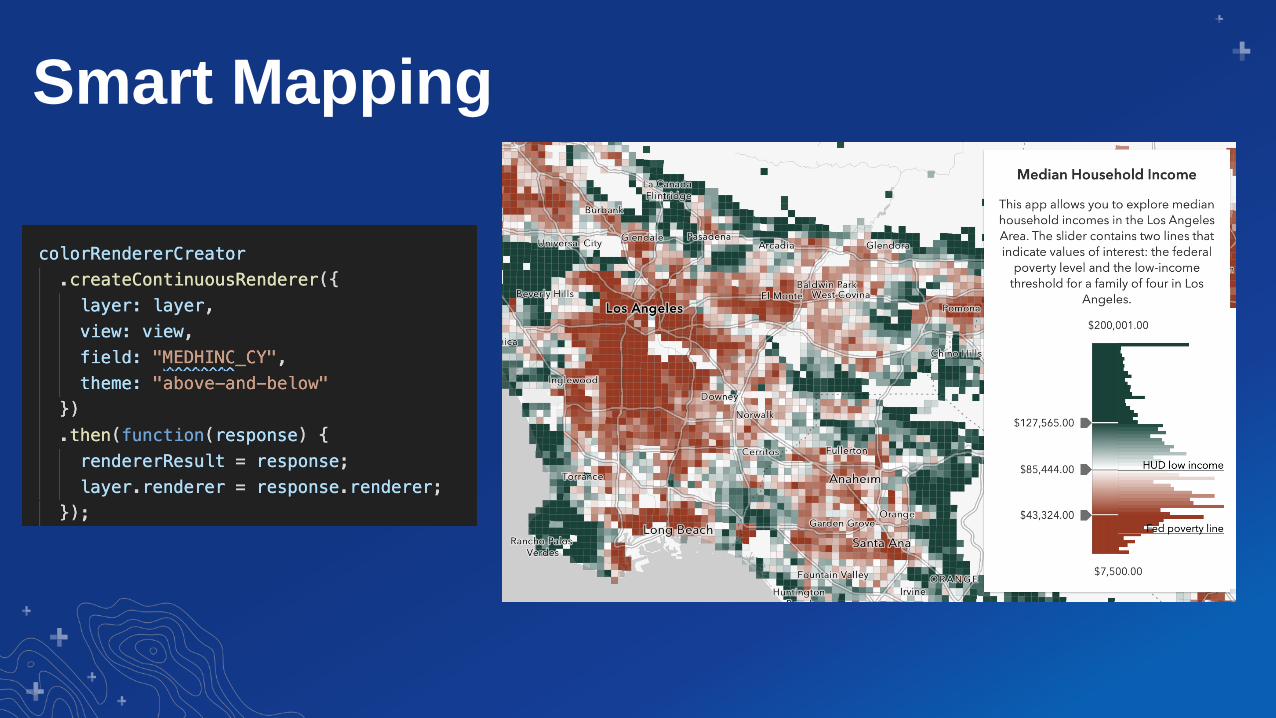
Smart Mapping

It’s all about…
• Statistics - Which breaks/stop
points make sense?
• Color – What colors work best
with my basemap? Should it be
above and below or high to
low?
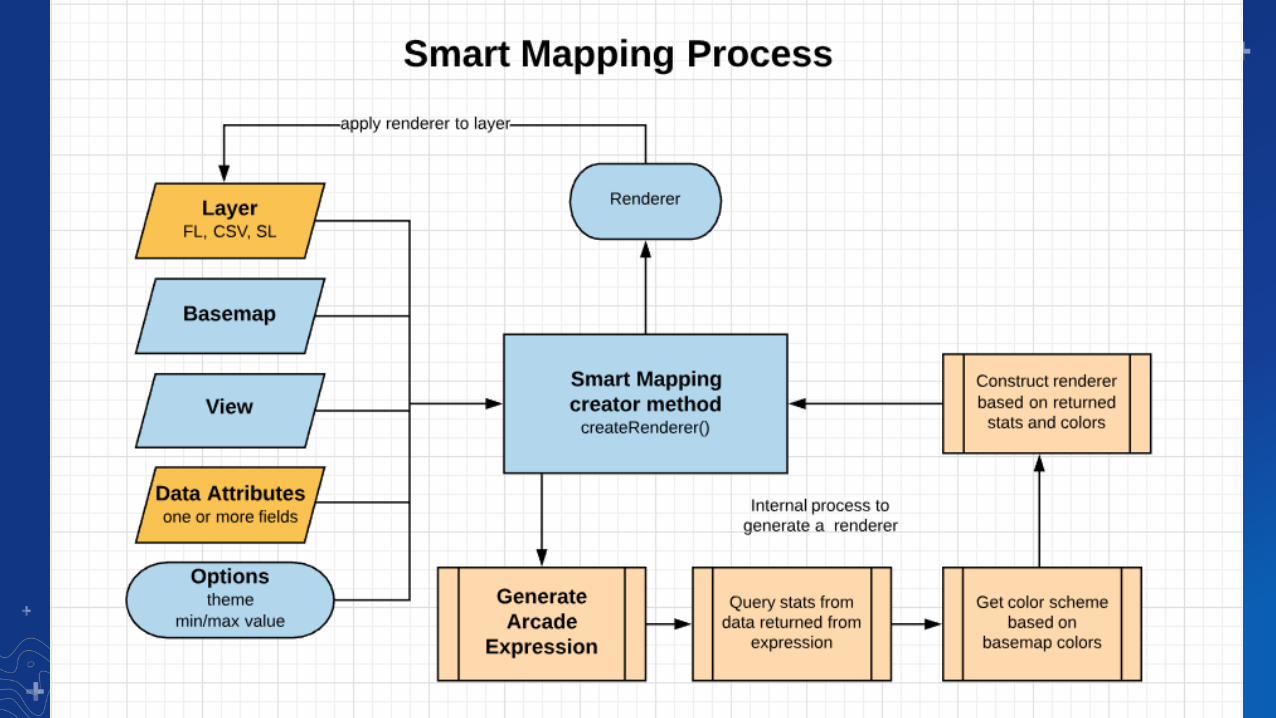
Smart Mapping
Class breaks are hard
Smart Mapping
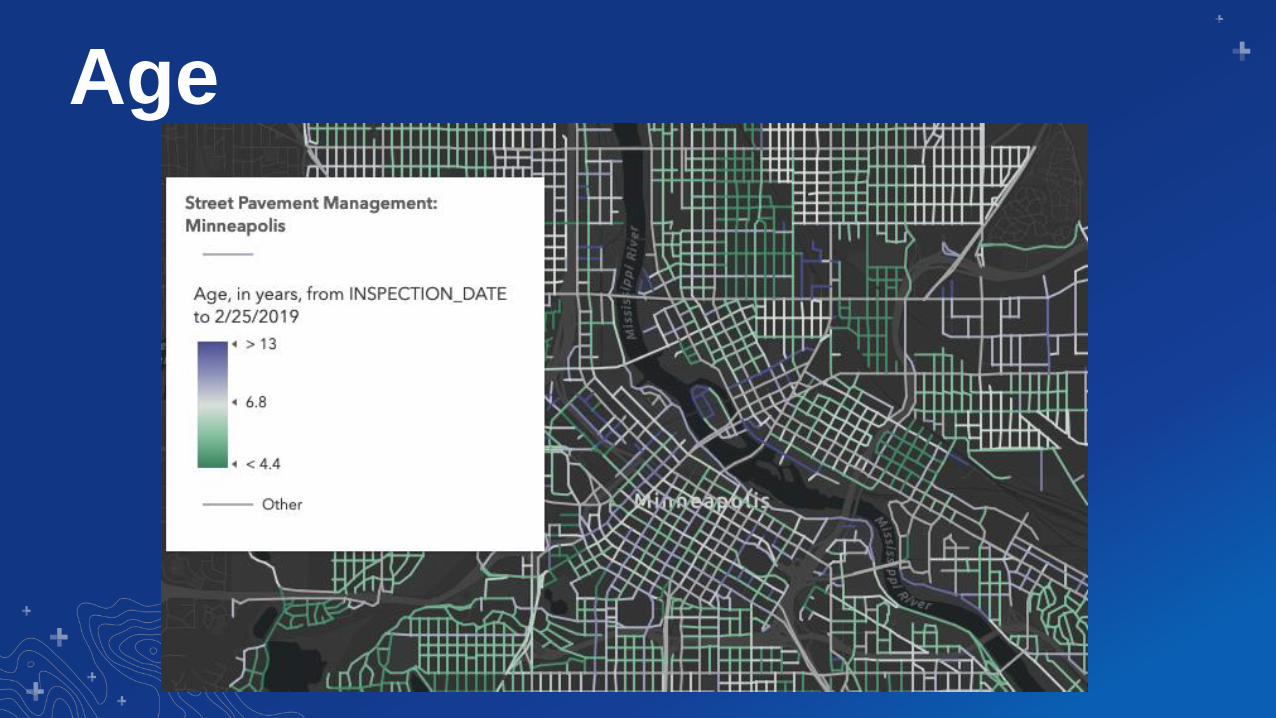
Age
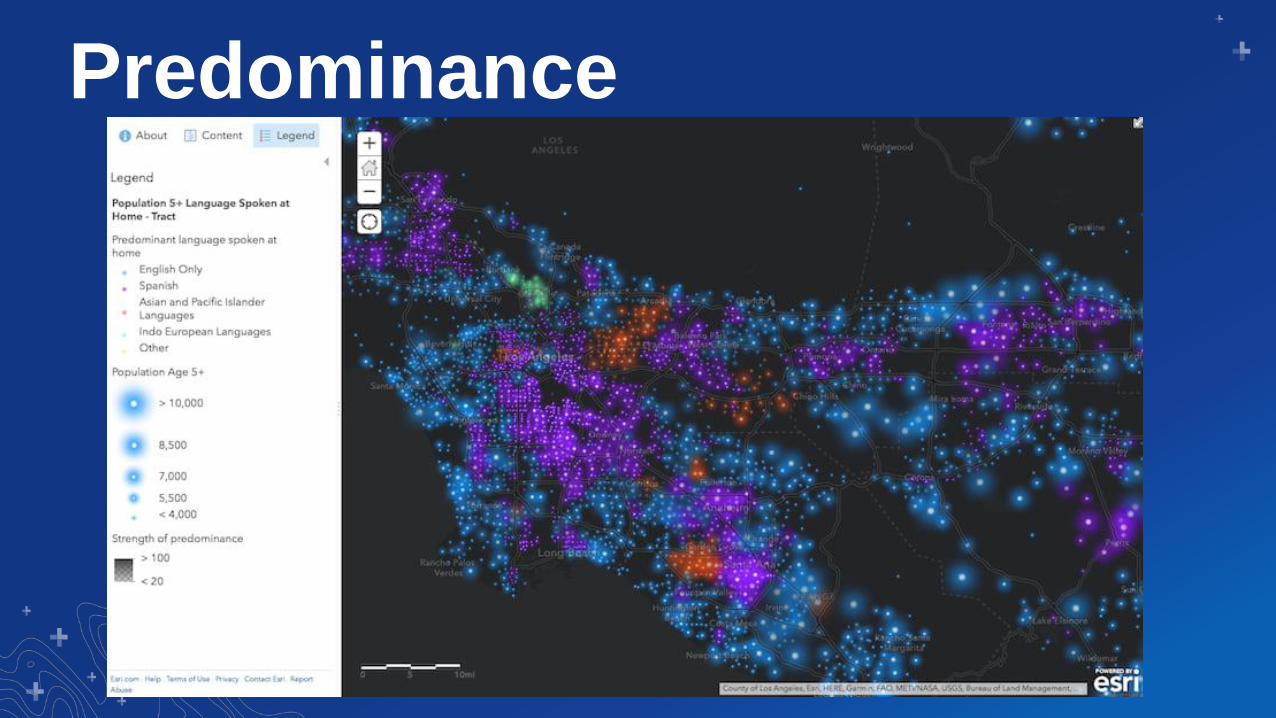
Predominance
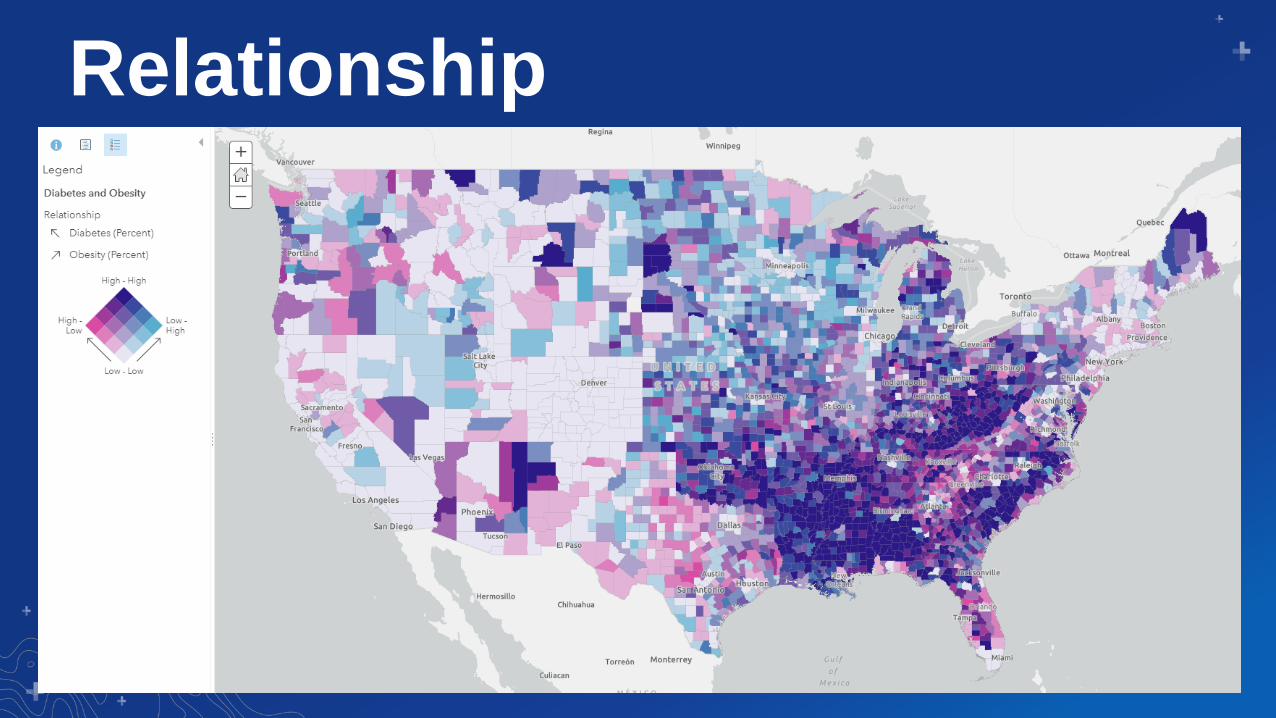
Relationship

Symbol Size by Scale
ArcGIS blog: How and why to size symbols by scale in web maps

Smart Mapping Sliders

Smart Mapping
Data Exploration
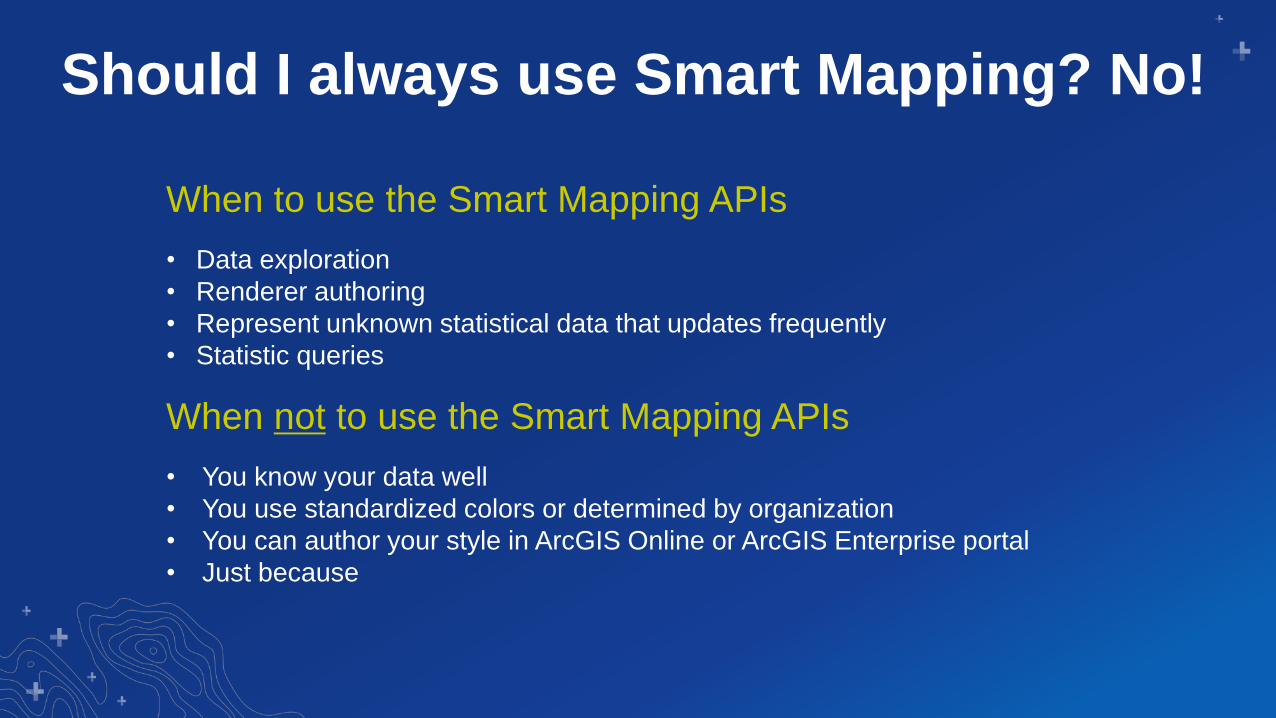
Should I always use Smart Mapping? No!
When to use the Smart Mapping APIs
• Data exploration
• Renderer authoring
• Represent unknown statistical data that updates frequently
• Statistic queries
When not to use the Smart Mapping APIs
• You know your data well
• You use standardized colors or determined by organization
• You can author your style in ArcGIS Online or ArcGIS Enterprise portal
• Just because

OK. I shouldn’t use the Smart Mapping
APIs... but I still need help with my
cartography. What should I do?
• You can author your style in ArcGIS Online or ArcGIS Enterprise portal and
take advantage of everything Smart Mapping has to offer.
• Read the Data Visualization guide pages!
• Esri color ramps
• Data visualization best practices
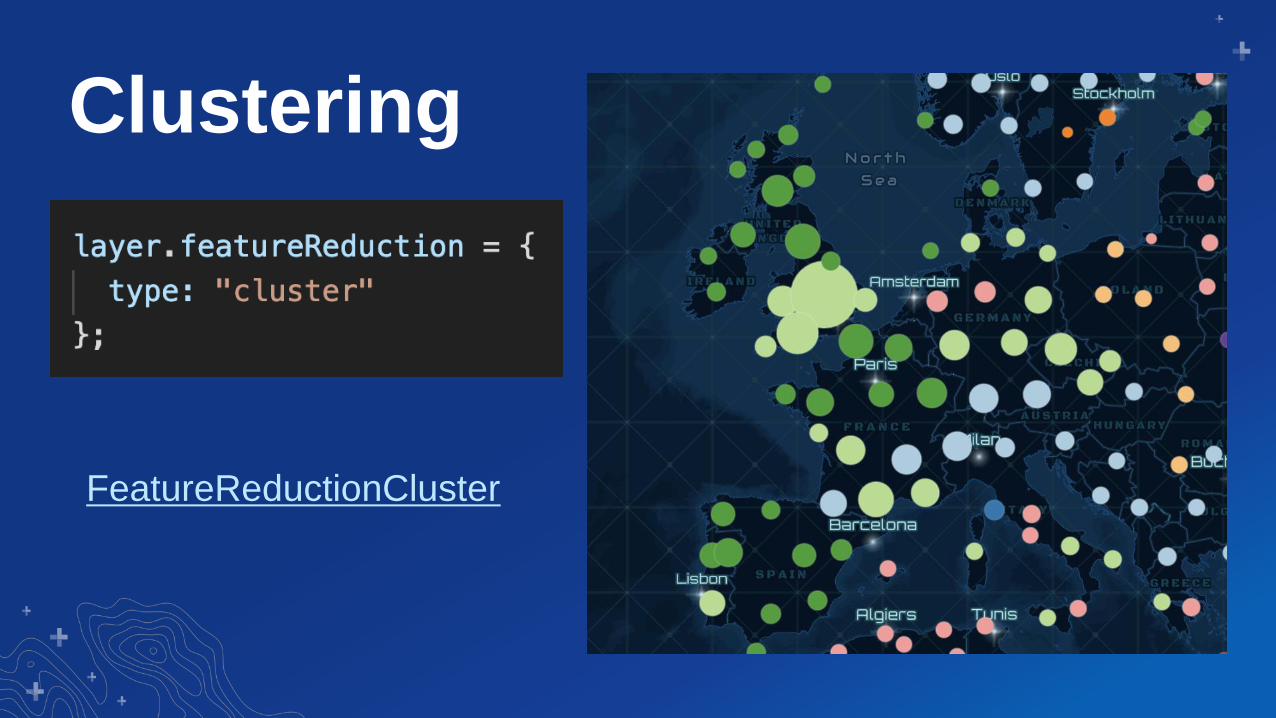
Clustering
FeatureReductionCluster

Faster visual updatesWebGL rendering

Web Styles, CIM,
client-side
processing
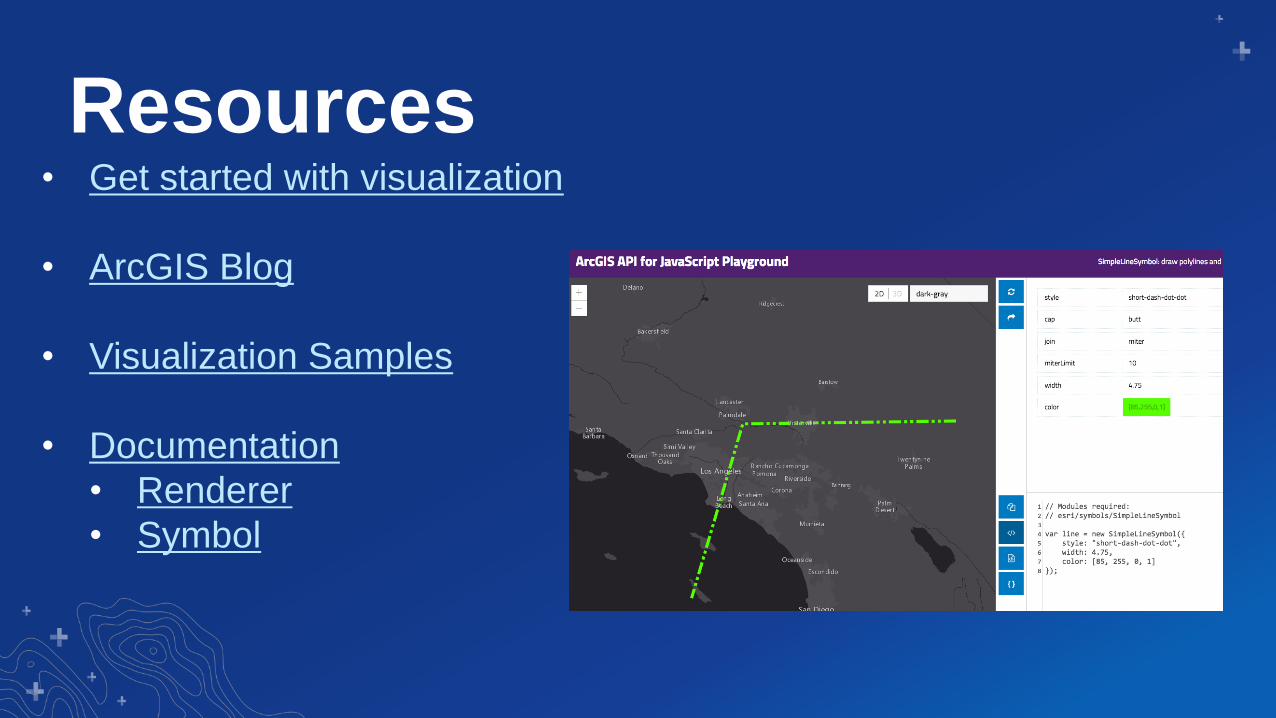
Resources• Get started with visualization
• ArcGIS Blog
• Visualization Samples
• Documentation
• Renderer
• Symbol
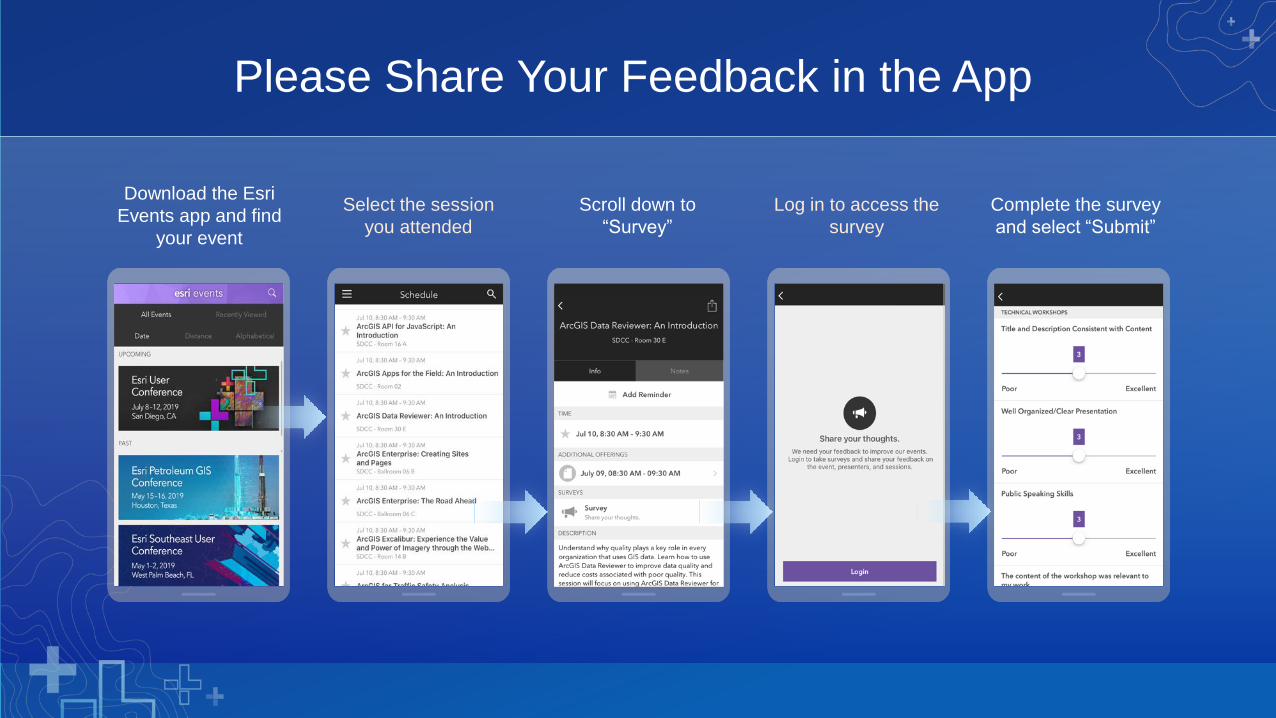
Download the Esri
Events app and find
your event
Select the session
you attended
Scroll down to
“Survey”
Log in to access the
survey
Complete the survey
and select “Submit”
Please Share Your Feedback in the App