Embed Size (px)
Citation preview
VISUALIZATION OF VGI DATA THROUGH THE NEW NASA WEB WORLD WIND
VIRTUAL GLOBE
M. A. Brovelli, C. E. Kilsedar *, G. Zamboni
Department of Civil and Environmental Engineering, Politecnico di Milano, Como Campus, Via Valleggio 11, 22100 Como -
(maria.brovelli, candaneylul.kilsedar, giorgio.zamboni)@polimi.it
Commission IV, WG IV/5
KEY WORDS: Data Collection, NASA World Wind, Free and Open Source Software, Volunteered Geographic Information,
Virtual Globes, Web, Crowdsourcing
ABSTRACT:
GeoWeb 2.0, laying the foundations of Volunteered Geographic Information (VGI) systems, has led to platforms where users can
contribute to the geographic knowledge that is open to access. Moreover, as a result of the advancements in 3D visualization, virtual
globes able to visualize geographic data even on browsers emerged. However the integration of VGI systems and virtual globes
has not been fully realized. The study presented aims to visualize volunteered data in 3D, considering also the ease of use aspects
for general public, using Free and Open Source Software (FOSS). The new Application Programming Interface (API) of NASA,
Web World Wind, written in JavaScript and based on Web Graphics Library (WebGL) is cross-platform and cross-browser, so that
the virtual globe created using this API can be accessible through any WebGL supported browser on different operating systems
and devices, as a result not requiring any installation or configuration on the client-side, making the collected data more usable to
users, which is not the case with the World Wind for Java as installation and configuration of the Java Virtual Machine (JVM) is
required. Furthermore, the data collected through various VGI platforms might be in different formats, stored in a traditional
relational database or in a NoSQL database. The project developed aims to visualize and query data collected through Open Data
Kit (ODK) platform and a cross-platform application, where data is stored in a relational PostgreSQL and NoSQL CouchDB
databases respectively.
1. INTRODUCTION
Delivering geographic information on Internet started soon
after the emergence of World Wide Web in early 1990s with
very primitive capabilities (Putz, 1994). However with the
emergence of Web 2.0 there has been changes in the way this
geographic information is delivered, which is coined by the
term GeoWeb 2.0. Web 2.0 is defined as a bi-directional
collaboration in which users are able to interact with and
provide information to sites and also see the information
provided by others, instead of a one-directional
communication of Web 1.0, where users merely view the
contents of sites (Goodchild, 2007a). GeoWeb 2.0, affected
by Web 2.0 being collaborative, is characterized by dynamic
2D maps and virtual globes, being participation-oriented,
user-centric, distributed, loosely coupled and rich. On the
other hand GeoWeb (or GeoWeb 1.0) is characterized by
static 2D map sites, being publishing-oriented, producer-
centric, centralized, closely coupled and basic (Maguire,
2007).
Another new term, Volunteered Geographic Information
(VGI) emerged with the birth of GeoWeb 2.0 and is
popularized by Goodchild (2007b). Goodchild argues that
humans may act as sensors, build and publish the content
themselves, using devices with sensors, for instance mobile
* Corresponding author
devices with GPS receivers. Humans in this scenario may
also use their camera to geo-tag multimedia content and
Internet connection to publish them. 1
However, there hasn’t been much research in realizing a VGI
platform, where the all the contributions from users are
visualized in three dimensions. As a result, this study focuses
on realizing this kind of platform in the most usable way
possible.
2. BACKGROUND
Through the transition from GeoWeb to GeoWeb 2.0, the 2D
static maps have been replaced by 2D dynamic maps and
virtual globes. Virtual globes can be considered not only as
3D, but also as 4D, adding time as the fourth dimension
(Brovelli et. al, 2013). Moreover, virtual globes became
accessible to developers through using the Application
Programming Interfaces (APIs) and as a result to everyone
being able to access the Internet, once restricted to only users
of highly specialized software tools and often accessible
only in scientific environments. There are many virtual
globes available to use with different properties. Firstly,
some of them requires a specific operating system to run,
while others can run on multiple operating systems given
that there are different releases for each operating system, or
they are platform independent. The platform independent
The International Archives of the Photogrammetry, Remote Sensing and Spatial Information Sciences, Volume XLI-B4, 2016 XXIII ISPRS Congress, 12–19 July 2016, Prague, Czech Republic
This contribution has been peer-reviewed. doi:10.5194/isprsarchives-XLI-B4-205-2016
205
virtual globes can be considered in two categories, one
written in Java, and the other written in JavaScript.
Considering the Java based virtual globes require installation
of Java Virtual Machine, JavaScript based ones can be
regarded even more usable in comparison of platform
independent virtual globes, as using a JavaScript based
virtual globe, the developed platform is accessible through
Web, in other words through all the browsers as long as Web
Graphics Library (WebGL) is supported.
Moreover, virtual globes can be distinguished by their
license type. Some of them are free and open source, while
others are closed, so the source code is not open to the public
and released with proprietary licenses. Some of the latter
require payment, while others require payment depending on
the features provided, or are freeware. As free and open
source virtual globes enable easily extend the code to
enhance the features, or add/remove features depending on
the project requirements, is more suitable for research-
oriented projects. In a previous work of (Brovelli et. al,
2013) virtual globes were examined in greater detail.
As a result, the best virtual globe that can be used are the
ones written in Java, or better JavaScript and free and open
source. In this study NASA Java World Wind, and NASA
Web World Wind is chosen to be used to realize the VGI
platform, where Java version provides some advanced
features that are not yet implemented in Web version, yet the
Web version is more usable for the general public.
3. DEVELOPED SYSTEMS
In this chapter three applications will be described and
compared, where the third application is the one that brings
together the strongest aspects of the other two. The first one,
PoliCrowd 2.0, is a system that enables collecting, managing
and visualizing data in 3D/4D. The volunteered data
submitted through mobile devices is visualized on a NASA
Java World Wind based virtual globe. However, the system
supports mobile devices only with Android operating system
and requires installation and configuration of Java Virtual
Machine. On the other hand, the second application is cross-
platform, which makes data collection possible using simply
browsers, or having the application for Android or iOS
operating system. Using this application it is also possible to
visualize the data in 2D. The third application aims to take
these two applications a step further and offer a system
where the virtual globe is more usable as its API is for
HTML5 and JavaScript, so that the virtual globe is available
on WebGL supported browsers, which makes it even more
usable than the PoliCrowd 2.0 platform, and displays the
data collected through both systems. All three applications
are developed using Free and Open Source Software
(FOSS).
3.1 NASA Java World Wind SDK based VGI platform
(PoliCrowd 2.0)
In the PoliCrowd 2.0 system data is submitted through
Android mobile devices and georeferenced, using the
devices’ positioning services, such as GPS. The data is
stored in a spatial database and published through standard
protocols. Using these protocols, the data is visualized in
3D/4D, and on the virtual globe users are able to manage the
data and create customized maps.
In this system Open Data Kit (ODK) suite is exploited for
realization of a VGI platform, that allows users to report
Points of Interest (POIs), using their Android mobile
devices. ODK is composed of three modules: ODK Build,
ODK Aggregate and ODK Collect. ODK Build is used to
design the survey form that users fill in. It is an HTML5 Web
application used to create simple forms, using drag and drop.
XLSForm can be used for designing more complex forms.
ODK Aggregate is server-side module of the ODK suite,
which provides blank forms to ODK Collect, accepts
compiled forms from it and stores the data submitted. It can
be installed on Google’s App Engine or on a local Apache
Tomcat server, backed with a MySQL or PostgreSQL
database server. Using ODK Aggregate, it is also possible to
administer the users. ODK Collect is the client-side module
of the ODK suite, where users fill blank forms. Users are
asked to provide information about a POI, where its location
is registered using GPS, with a possibility of adding
multimedia content (image, audio and video). It is also
possible to fill a form and send it when the Internet
connection is available.
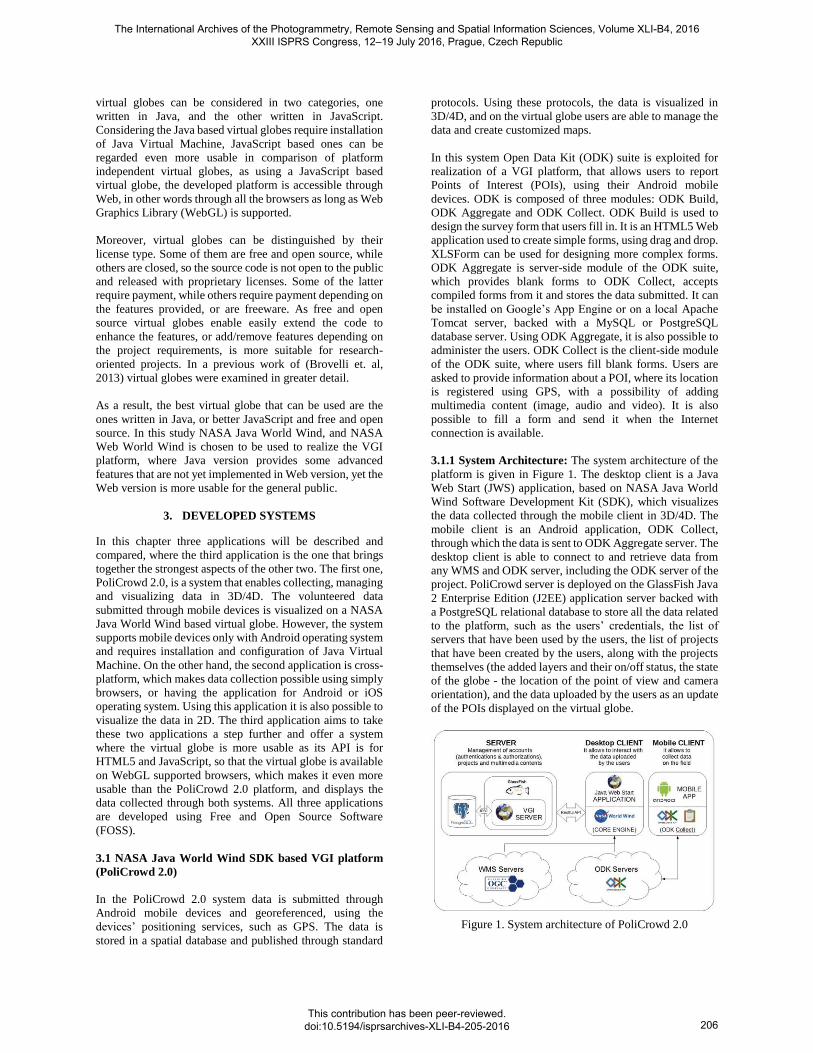
3.1.1 System Architecture: The system architecture of the
platform is given in Figure 1. The desktop client is a Java
Web Start (JWS) application, based on NASA Java World
Wind Software Development Kit (SDK), which visualizes
the data collected through the mobile client in 3D/4D. The
mobile client is an Android application, ODK Collect,
through which the data is sent to ODK Aggregate server. The
desktop client is able to connect to and retrieve data from
any WMS and ODK server, including the ODK server of the
project. PoliCrowd server is deployed on the GlassFish Java
2 Enterprise Edition (J2EE) application server backed with
a PostgreSQL relational database to store all the data related
to the platform, such as the users’ credentials, the list of
servers that have been used by the users, the list of projects
that have been created by the users, along with the projects
themselves (the added layers and their on/off status, the state
of the globe - the location of the point of view and camera
orientation), and the data uploaded by the users as an update
of the POIs displayed on the virtual globe.
Figure 1. System architecture of PoliCrowd 2.0
The International Archives of the Photogrammetry, Remote Sensing and Spatial Information Sciences, Volume XLI-B4, 2016 XXIII ISPRS Congress, 12–19 July 2016, Prague, Czech Republic
This contribution has been peer-reviewed. doi:10.5194/isprsarchives-XLI-B4-205-2016
206
3.1.2 Functionalities: After the first PoliCrowd, focused on
the cultural and tourism heritage of the Como city in
Northern Italy (Brovelli et al., 2014), PoliCrowd 2.0 is
developed, which is entirely general-purpose. PoliCrowd 2.0
platform allows users to create a new project that suits to the
specific topic of interest (environmental, social, educational,
cultural, scientific, etc.), and save the project in a catalogue
available for the whole community, by enabling users to
connect any WMS and ODK server and adding the layers
that are available and wished to be included in the project.
The first level of information consists of WMS layers, which
can be base layers, such as OpenStreetMap (OSM), the aerial
orthophotos and satellite imagery, thematic maps made
available through geoportals of institutional administrations,
such as INSPIRE and national geoportals, or any other WMS
compliant server. The second level of information is the
crowdsourced data stored in ODK Aggregate servers,
collected through ODK Collect mobile client.
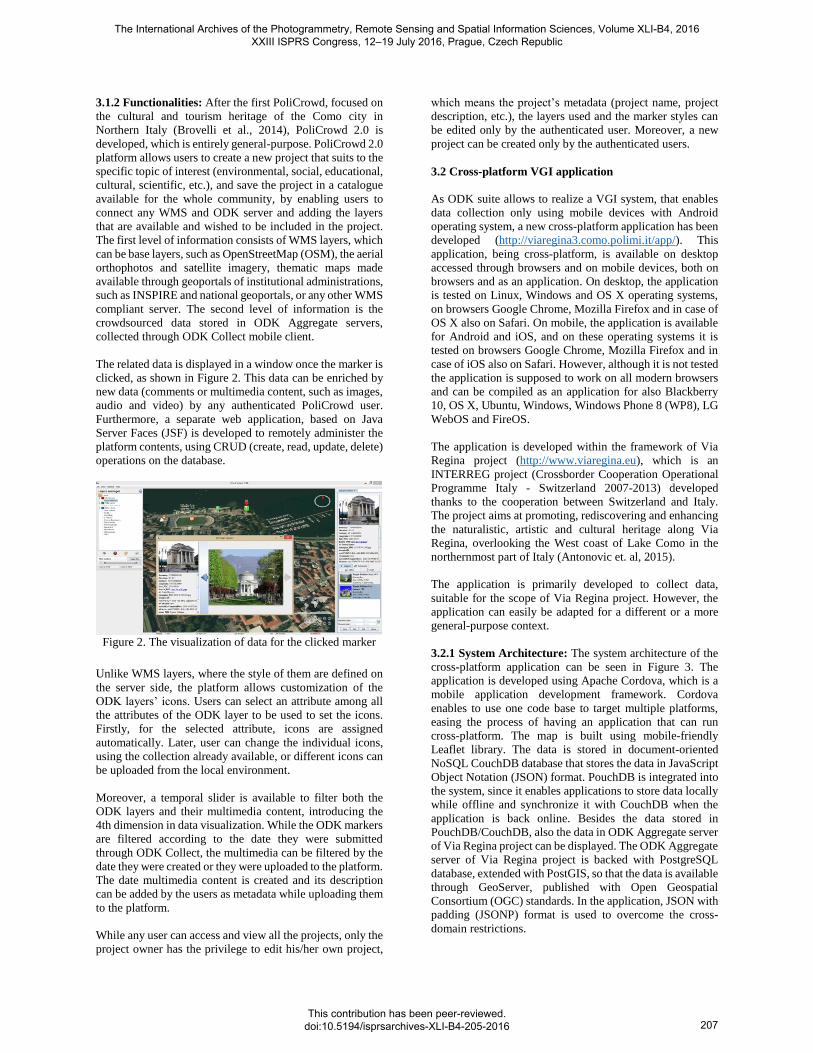
The related data is displayed in a window once the marker is
clicked, as shown in Figure 2. This data can be enriched by
new data (comments or multimedia content, such as images,
audio and video) by any authenticated PoliCrowd user.
Furthermore, a separate web application, based on Java
Server Faces (JSF) is developed to remotely administer the
platform contents, using CRUD (create, read, update, delete)
operations on the database.
Figure 2. The visualization of data for the clicked marker
Unlike WMS layers, where the style of them are defined on
the server side, the platform allows customization of the
ODK layers’ icons. Users can select an attribute among all
the attributes of the ODK layer to be used to set the icons.
Firstly, for the selected attribute, icons are assigned
automatically. Later, user can change the individual icons,
using the collection already available, or different icons can
be uploaded from the local environment.
Moreover, a temporal slider is available to filter both the
ODK layers and their multimedia content, introducing the
4th dimension in data visualization. While the ODK markers
are filtered according to the date they were submitted
through ODK Collect, the multimedia can be filtered by the
date they were created or they were uploaded to the platform.
The date multimedia content is created and its description
can be added by the users as metadata while uploading them
to the platform.
While any user can access and view all the projects, only the
project owner has the privilege to edit his/her own project,
which means the project’s metadata (project name, project
description, etc.), the layers used and the marker styles can
be edited only by the authenticated user. Moreover, a new
project can be created only by the authenticated users.
3.2 Cross-platform VGI application
As ODK suite allows to realize a VGI system, that enables
data collection only using mobile devices with Android
operating system, a new cross-platform application has been
developed (http://viaregina3.como.polimi.it/app/). This
application, being cross-platform, is available on desktop
accessed through browsers and on mobile devices, both on
browsers and as an application. On desktop, the application
is tested on Linux, Windows and OS X operating systems,
on browsers Google Chrome, Mozilla Firefox and in case of
OS X also on Safari. On mobile, the application is available
for Android and iOS, and on these operating systems it is
tested on browsers Google Chrome, Mozilla Firefox and in
case of iOS also on Safari. However, although it is not tested
the application is supposed to work on all modern browsers
and can be compiled as an application for also Blackberry
10, OS X, Ubuntu, Windows, Windows Phone 8 (WP8), LG
WebOS and FireOS.
The application is developed within the framework of Via
Regina project (http://www.viaregina.eu), which is an
INTERREG project (Crossborder Cooperation Operational
Programme Italy - Switzerland 2007-2013) developed
thanks to the cooperation between Switzerland and Italy.
The project aims at promoting, rediscovering and enhancing
the naturalistic, artistic and cultural heritage along Via
Regina, overlooking the West coast of Lake Como in the
northernmost part of Italy (Antonovic et. al, 2015).
The application is primarily developed to collect data,
suitable for the scope of Via Regina project. However, the
application can easily be adapted for a different or a more
general-purpose context.
3.2.1 System Architecture: The system architecture of the
cross-platform application can be seen in Figure 3. The
application is developed using Apache Cordova, which is a
mobile application development framework. Cordova
enables to use one code base to target multiple platforms,
easing the process of having an application that can run
cross-platform. The map is built using mobile-friendly
Leaflet library. The data is stored in document-oriented
NoSQL CouchDB database that stores the data in JavaScript
Object Notation (JSON) format. PouchDB is integrated into
the system, since it enables applications to store data locally
while offline and synchronize it with CouchDB when the
application is back online. Besides the data stored in
PouchDB/CouchDB, also the data in ODK Aggregate server
of Via Regina project can be displayed. The ODK Aggregate
server of Via Regina project is backed with PostgreSQL
database, extended with PostGIS, so that the data is available
through GeoServer, published with Open Geospatial
Consortium (OGC) standards. In the application, JSON with
padding (JSONP) format is used to overcome the cross-
domain restrictions.
The International Archives of the Photogrammetry, Remote Sensing and Spatial Information Sciences, Volume XLI-B4, 2016 XXIII ISPRS Congress, 12–19 July 2016, Prague, Czech Republic
This contribution has been peer-reviewed. doi:10.5194/isprsarchives-XLI-B4-205-2016
207
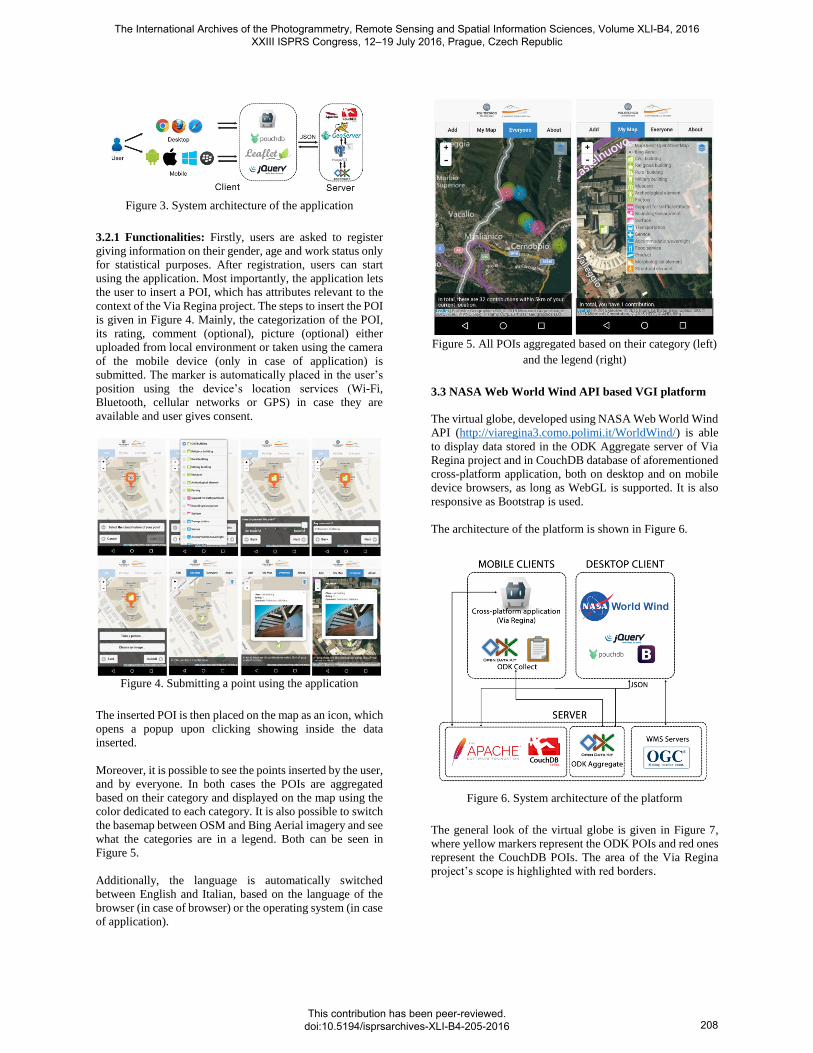
Figure 3. System architecture of the application
3.2.1 Functionalities: Firstly, users are asked to register
giving information on their gender, age and work status only
for statistical purposes. After registration, users can start
using the application. Most importantly, the application lets
the user to insert a POI, which has attributes relevant to the
context of the Via Regina project. The steps to insert the POI
is given in Figure 4. Mainly, the categorization of the POI,
its rating, comment (optional), picture (optional) either
uploaded from local environment or taken using the camera
of the mobile device (only in case of application) is
submitted. The marker is automatically placed in the user’s
position using the device’s location services (Wi-Fi,
Bluetooth, cellular networks or GPS) in case they are
available and user gives consent.
Figure 4. Submitting a point using the application
The inserted POI is then placed on the map as an icon, which
opens a popup upon clicking showing inside the data
inserted.
Moreover, it is possible to see the points inserted by the user,
and by everyone. In both cases the POIs are aggregated
based on their category and displayed on the map using the
color dedicated to each category. It is also possible to switch
the basemap between OSM and Bing Aerial imagery and see
what the categories are in a legend. Both can be seen in
Figure 5.
Additionally, the language is automatically switched
between English and Italian, based on the language of the
browser (in case of browser) or the operating system (in case
of application).
Figure 5. All POIs aggregated based on their category (left)
and the legend (right)
3.3 NASA Web World Wind API based VGI platform
The virtual globe, developed using NASA Web World Wind
API (http://viaregina3.como.polimi.it/WorldWind/) is able
to display data stored in the ODK Aggregate server of Via
Regina project and in CouchDB database of aforementioned
cross-platform application, both on desktop and on mobile
device browsers, as long as WebGL is supported. It is also
responsive as Bootstrap is used.
The architecture of the platform is shown in Figure 6.
Figure 6. System architecture of the platform
The general look of the virtual globe is given in Figure 7,
where yellow markers represent the ODK POIs and red ones
represent the CouchDB POIs. The area of the Via Regina
project’s scope is highlighted with red borders.
The International Archives of the Photogrammetry, Remote Sensing and Spatial Information Sciences, Volume XLI-B4, 2016 XXIII ISPRS Congress, 12–19 July 2016, Prague, Czech Republic
This contribution has been peer-reviewed. doi:10.5194/isprsarchives-XLI-B4-205-2016
208
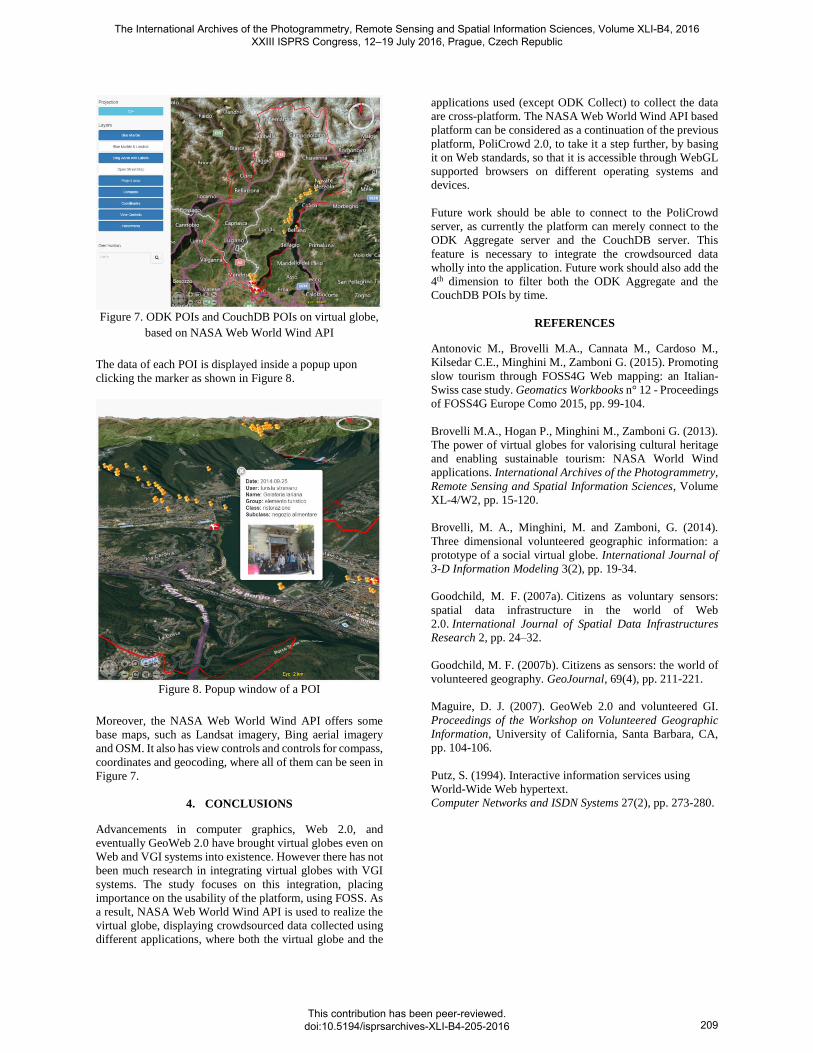
Figure 7. ODK POIs and CouchDB POIs on virtual globe,
based on NASA Web World Wind API
The data of each POI is displayed inside a popup upon
clicking the marker as shown in Figure 8.
Figure 8. Popup window of a POI
Moreover, the NASA Web World Wind API offers some
base maps, such as Landsat imagery, Bing aerial imagery
and OSM. It also has view controls and controls for compass,
coordinates and geocoding, where all of them can be seen in
Figure 7.
4. CONCLUSIONS
Advancements in computer graphics, Web 2.0, and
eventually GeoWeb 2.0 have brought virtual globes even on
Web and VGI systems into existence. However there has not
been much research in integrating virtual globes with VGI
systems. The study focuses on this integration, placing
importance on the usability of the platform, using FOSS. As
a result, NASA Web World Wind API is used to realize the
virtual globe, displaying crowdsourced data collected using
different applications, where both the virtual globe and the
applications used (except ODK Collect) to collect the data
are cross-platform. The NASA Web World Wind API based
platform can be considered as a continuation of the previous
platform, PoliCrowd 2.0, to take it a step further, by basing
it on Web standards, so that it is accessible through WebGL
supported browsers on different operating systems and
devices.
Future work should be able to connect to the PoliCrowd
server, as currently the platform can merely connect to the
ODK Aggregate server and the CouchDB server. This
feature is necessary to integrate the crowdsourced data
wholly into the application. Future work should also add the
4th dimension to filter both the ODK Aggregate and the
CouchDB POIs by time.
REFERENCES
Antonovic M., Brovelli M.A., Cannata M., Cardoso M.,
Kilsedar C.E., Minghini M., Zamboni G. (2015). Promoting
slow tourism through FOSS4G Web mapping: an Italian-
Swiss case study. Geomatics Workbooks n° 12 - Proceedings
of FOSS4G Europe Como 2015, pp. 99-104.
Brovelli M.A., Hogan P., Minghini M., Zamboni G. (2013).
The power of virtual globes for valorising cultural heritage
and enabling sustainable tourism: NASA World Wind
applications. International Archives of the Photogrammetry,
Remote Sensing and Spatial Information Sciences, Volume
XL-4/W2, pp. 15-120.
Brovelli, M. A., Minghini, M. and Zamboni, G. (2014).
Three dimensional volunteered geographic information: a
prototype of a social virtual globe. International Journal of
3D Information Modeling 3(2), pp. 19-34.
Goodchild, M. F. (2007a). Citizens as voluntary sensors:
spatial data infrastructure in the world of Web
2.0. International Journal of Spatial Data Infrastructures
Research 2, pp. 24–32.
Goodchild, M. F. (2007b). Citizens as sensors: the world of
volunteered geography. GeoJournal, 69(4), pp. 211-221.
Maguire, D. J. (2007). GeoWeb 2.0 and volunteered GI.
Proceedings of the Workshop on Volunteered Geographic
Information, University of California, Santa Barbara, CA,
pp. 104-106.
Putz, S. (1994). Interactive information services using
WorldWide Web hypertext.
Computer Networks and ISDN Systems 27(2), pp. 273-280.
The International Archives of the Photogrammetry, Remote Sensing and Spatial Information Sciences, Volume XLI-B4, 2016 XXIII ISPRS Congress, 12–19 July 2016, Prague, Czech Republic
This contribution has been peer-reviewed. doi:10.5194/isprsarchives-XLI-B4-205-2016
209