Embed Size (px)
Citation preview
Visualization of sound fields on vibrating steel beam using linear microphone array
ZDENĚK HAVRÁNEK
Department of Control and Instrumentation, Faculty of Electrical Engineering and Communication Brno University of Technology
Kolejni 4, 612 00 Brno CZECH REPUBLIC
Abstract: - This paper deals with real measurement results on simply supported steel beam producing sound field in short distance from the beam surface. Beam resonant frequencies can be calculated analytically, measured with classical piezoelectric transducers with information about acceleration on the beam, and also with microphone array and near-field acoustic holography calculation. The non-contact technique with microphone array measurement has many advantages in compare with classical measurement with accelerometers. Key-Words: acoustic holography, visualization of sound fields, beam vibrations, modal analysis. 1 Introduction
Analyses of vibrations of real structures are usually needed in technical diagnostics. Localization of sound sources and finding the position of impacting force which causes the vibrations of the structure is a difficult task, especially when this information is required quickly and has to be realistic, thus without any influence of measuring device upon the measured object.
The position information of nodes and antinodes are also very important information in modal analysis. From the distances of nodes, one can calculate resonant frequency of the beam (or any other structure) in real conditions. 2 Non-contact vibration analysis
Conventional modal analysis use classical vibration sensors – accelerometers. These sensors have significant influence on measured object due to their mass and also the procedure for evaluation of structural modes need more than one measurement point to obtain good results.
Non-contact vibration methods can avoid this disadvantage. Polular non-contact method for vibration analysis is Laser Doppler Vibrometry (LDV) using laser beam to measure position displacement of the point on the diagnosed surface. This method is very accurate, but the measurement setup is very expensive and time consuming, due to many points to measure. In compare with LDV there is another non-contact analysis method using array of microphones which measures acoustic pressure produced by vibrating surface. This method is faster in compare with LDV and provides more complex information about sound field above examined source. Its disadvantage is in less accuracy of analysing of surface vibration velocity. So it is often use for rough
visualization of sound field near sources and its localization. 2.1 Acoustic holography
Above mentioned method using array of microphones is also called acoustic holography and it uses holography algorithms for calculation of acoustic quantities very near the surface of vibrating sound source. As input data for holography calculation is sound pressure or velocity measured with microphones assembled regularly in rectangular matrix.
Another possibility of measuring acoustic field is using intensity probe, as the name of probe suggests - sound intensity measurement. The intensity probe can be used only in limited frequency band and its dynamic range is also not very wide. Other disadvantage is also higher price of the whole probe.
In classical holography the procedure for obtaining acoustic quantity, for example sound intensity very near examined surface, is divided into three steps.
The first step is to measure sound pressure field with microphone array in short time slot and then calculate frequency spectrum of the input signal. In the spectrum, the highest peak is the resonant frequency of the examined surface or frequency of main excitation force. For this frequency, amplitude and phase of the time signal can be calculated. After this step, one hologram with true pressure values in one frequency is obtained.
In the second step, pressure values are recalculated to the closer distance from the surface. This can be done by many methods presented in the papers [1, 3, 5]. The general equation for spatial transformation of sound fields is (1) and more details can be found in [1, 2].
( ) ( )[ ] ( )[ ]hxyxphyxyxxz zzkkGzyxpFFFFzyxpx
−= −− ,,,,,, 11 (1)
Proc. of the 6th WSEAS Int. Conf. on Signal Processing, Computational Geometry & Artificial Vision, Elounda, Greece, August 21-23, 2006 (pp170-173)
There are many improvements for acoustic holography calculation presented in last ten years. The most of them try to obtain better reconstruction accuracy of calculated acoustic quantities very close to the vibrating surface. One used in this paper is modification with recursive Wiener filtering [4], based on forward transformation of backward calculated pressure image field. In this modification, resulting sound pressure field in wavenumber domain is adjusted depending on the total difference between source pressure image and image after forward and backward calculation. Basic recursive formulation is (2).
( )11 −− ⋅−⋅+= zxpzhzxzx PGPSPP (2)
In eq. 2, Pz are pressure images in hologram zh and
calculated zx position, Gp is forward propagator (so called Green function). Wiener filter is represented by variable S. Recursive algorithm is denoted with -1 index on Pzx, where this means previous calculation result of pressure image in examined position near vibrating surface.
The last step is only inverse 2D spatial (Fourier) transformation to obtain one-time (in one hologram) pressure field values in the examined distance from the source.
2.2 Beam vibrations
Beam vibrations depend on the type of boundary conditions (free, simple supported, guide supported, etc), which determine the natural modal frequency. Modal frequencies are also varying on the beam material constants and dimensions. For natural frequencies of the free-guide supported steel beam (rod) one can use equation (3).
421
lmEIKf ii ′
=π
(3)
In the eq. 3, constant K represents the type of
mounting of the beam or rod, E is Young’s module, I is diameter parameter, m is unity weight of the beam and l is the length of the beam (in this case half the dimension). Theoretical natural frequencies have beean calculated and verified with classical setup with accelerometers and correction for this setup has been used (accelerometer mass correction). 2.3 Untraditional modal analysis
Main purpose of this paper is to present the method for non-contact modal analysis of guide supported steel beam. This beam is excited by the shaker to produce natural modes of the beam. Vibrations of the beam produce sound field near its surface. This field is
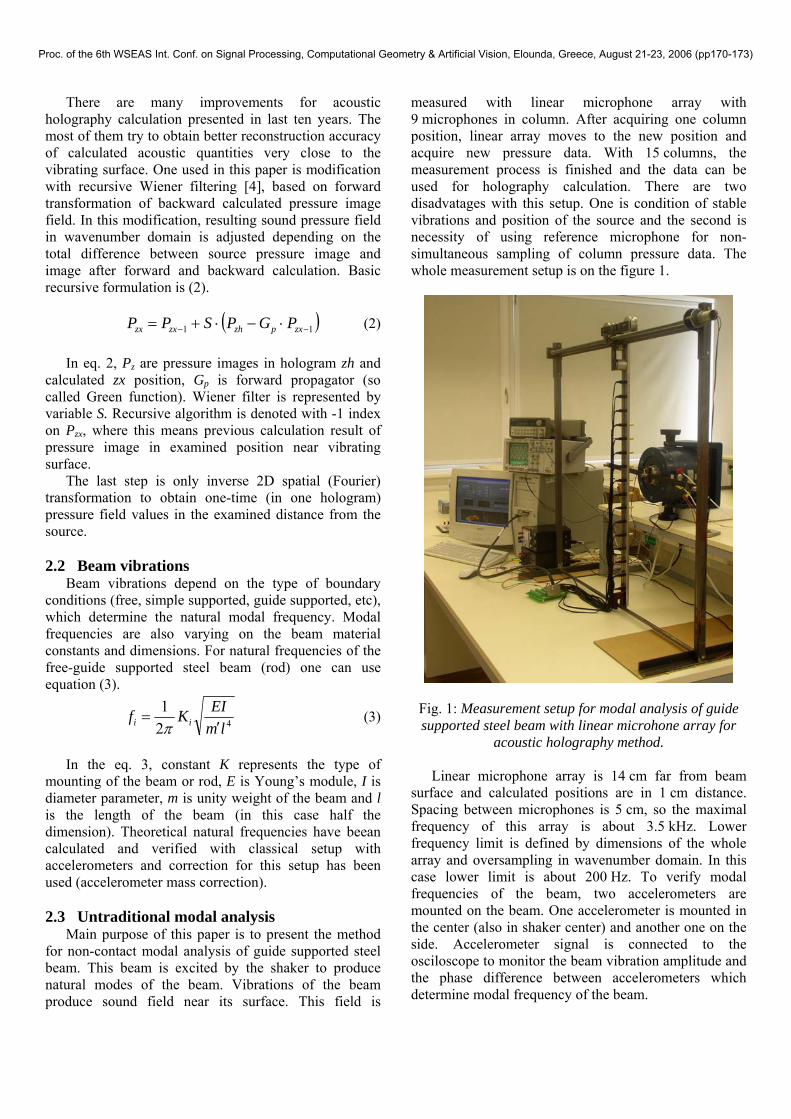
measured with linear microphone array with 9 microphones in column. After acquiring one column position, linear array moves to the new position and acquire new pressure data. With 15 columns, the measurement process is finished and the data can be used for holography calculation. There are two disadvatages with this setup. One is condition of stable vibrations and position of the source and the second is necessity of using reference microphone for non-simultaneous sampling of column pressure data. The whole measurement setup is on the figure 1.
Fig. 1: Measurement setup for modal analysis of guide supported steel beam with linear microhone array for
acoustic holography method.
Linear microphone array is 14 cm far from beam surface and calculated positions are in 1 cm distance. Spacing between microphones is 5 cm, so the maximal frequency of this array is about 3.5 kHz. Lower frequency limit is defined by dimensions of the whole array and oversampling in wavenumber domain. In this case lower limit is about 200 Hz. To verify modal frequencies of the beam, two accelerometers are mounted on the beam. One accelerometer is mounted in the center (also in shaker center) and another one on the side. Accelerometer signal is connected to the osciloscope to monitor the beam vibration amplitude and the phase difference between accelerometers which determine modal frequency of the beam.
Proc. of the 6th WSEAS Int. Conf. on Signal Processing, Computational Geometry & Artificial Vision, Elounda, Greece, August 21-23, 2006 (pp170-173)
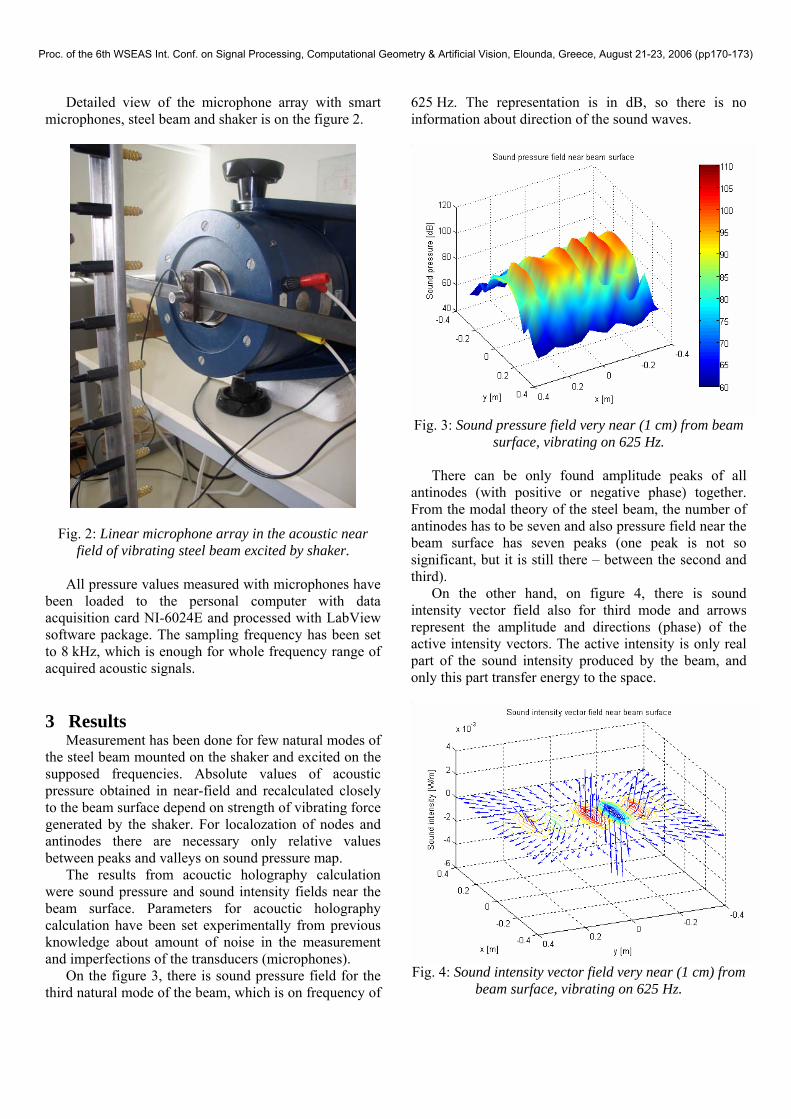
Detailed view of the microphone array with smart microphones, steel beam and shaker is on the figure 2.
Fig. 2: Linear microphone array in the acoustic near field of vibrating steel beam excited by shaker.
All pressure values measured with microphones have
been loaded to the personal computer with data acquisition card NI-6024E and processed with LabView software package. The sampling frequency has been set to 8 kHz, which is enough for whole frequency range of acquired acoustic signals.
3 Results Measurement has been done for few natural modes of
the steel beam mounted on the shaker and excited on the supposed frequencies. Absolute values of acoustic pressure obtained in near-field and recalculated closely to the beam surface depend on strength of vibrating force generated by the shaker. For localozation of nodes and antinodes there are necessary only relative values between peaks and valleys on sound pressure map.
The results from acouctic holography calculation were sound pressure and sound intensity fields near the beam surface. Parameters for acouctic holography calculation have been set experimentally from previous knowledge about amount of noise in the measurement and imperfections of the transducers (microphones).
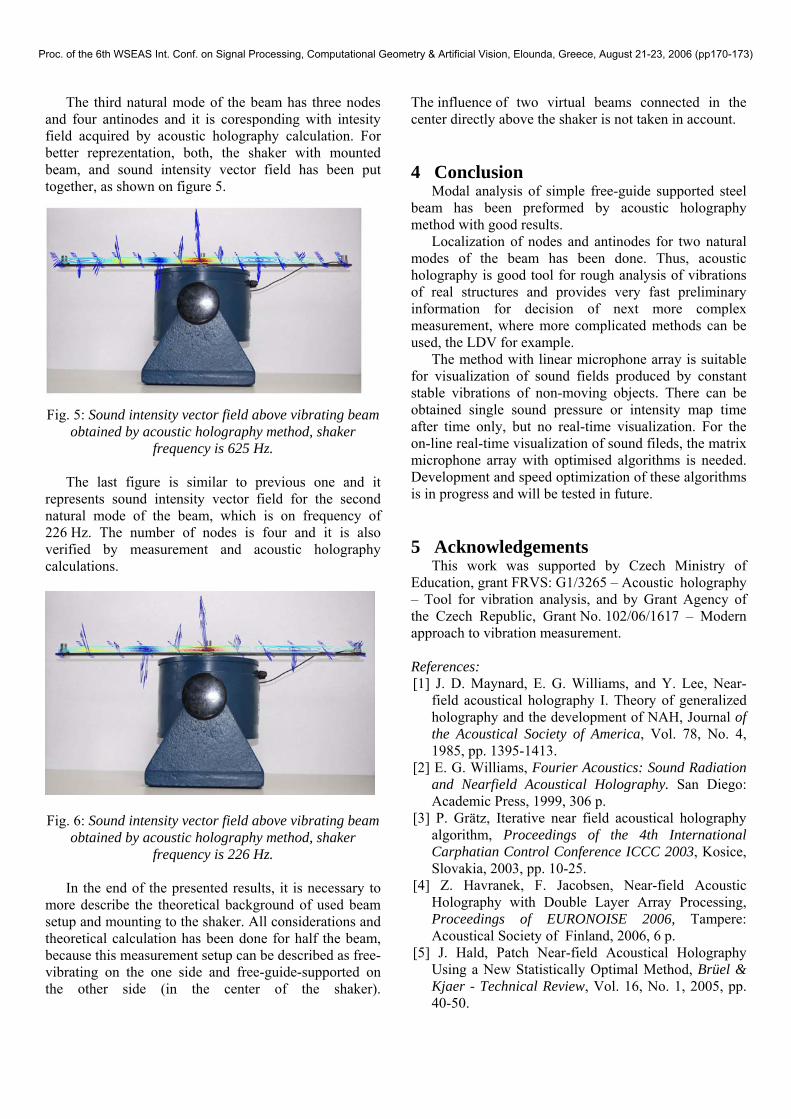
On the figure 3, there is sound pressure field for the third natural mode of the beam, which is on frequency of
625 Hz. The representation is in dB, so there is no information about direction of the sound waves.
Fig. 3: Sound pressure field very near (1 cm) from beam
surface, vibrating on 625 Hz.
There can be only found amplitude peaks of all antinodes (with positive or negative phase) together. From the modal theory of the steel beam, the number of antinodes has to be seven and also pressure field near the beam surface has seven peaks (one peak is not so significant, but it is still there – between the second and third).
On the other hand, on figure 4, there is sound intensity vector field also for third mode and arrows represent the amplitude and directions (phase) of the active intensity vectors. The active intensity is only real part of the sound intensity produced by the beam, and only this part transfer energy to the space.
Fig. 4: Sound intensity vector field very near (1 cm) from beam surface, vibrating on 625 Hz.
Proc. of the 6th WSEAS Int. Conf. on Signal Processing, Computational Geometry & Artificial Vision, Elounda, Greece, August 21-23, 2006 (pp170-173)
The third natural mode of the beam has three nodes and four antinodes and it is coresponding with intesity field acquired by acoustic holography calculation. For better reprezentation, both, the shaker with mounted beam, and sound intensity vector field has been put together, as shown on figure 5.
Fig. 5: Sound intensity vector field above vibrating beam
obtained by acoustic holography method, shaker frequency is 625 Hz.
The last figure is similar to previous one and it
represents sound intensity vector field for the second natural mode of the beam, which is on frequency of 226 Hz. The number of nodes is four and it is also verified by measurement and acoustic holography calculations.
Fig. 6: Sound intensity vector field above vibrating beam
obtained by acoustic holography method, shaker frequency is 226 Hz.
In the end of the presented results, it is necessary to
more describe the theoretical background of used beam setup and mounting to the shaker. All considerations and theoretical calculation has been done for half the beam, because this measurement setup can be described as free-vibrating on the one side and free-guide-supported on the other side (in the center of the shaker).
The influence of two virtual beams connected in the center directly above the shaker is not taken in account.
4 Conclusion Modal analysis of simple free-guide supported steel
beam has been preformed by acoustic holography method with good results.
Localization of nodes and antinodes for two natural modes of the beam has been done. Thus, acoustic holography is good tool for rough analysis of vibrations of real structures and provides very fast preliminary information for decision of next more complex measurement, where more complicated methods can be used, the LDV for example.
The method with linear microphone array is suitable for visualization of sound fields produced by constant stable vibrations of non-moving objects. There can be obtained single sound pressure or intensity map time after time only, but no real-time visualization. For the on-line real-time visualization of sound fileds, the matrix microphone array with optimised algorithms is needed. Development and speed optimization of these algorithms is in progress and will be tested in future. 5 Acknowledgements
This work was supported by Czech Ministry of Education, grant FRVS: G1/3265 – Acoustic holography – Tool for vibration analysis, and by Grant Agency of the Czech Republic, Grant No. 102/06/1617 – Modern approach to vibration measurement. References: [1] J. D. Maynard, E. G. Williams, and Y. Lee, Near-
field acoustical holography I. Theory of generalized holography and the development of NAH, Journal of the Acoustical Society of America, Vol. 78, No. 4, 1985, pp. 1395-1413.
[2] E. G. Williams, Fourier Acoustics: Sound Radiation and Nearfield Acoustical Holography. San Diego: Academic Press, 1999, 306 p.
[3] P. Grätz, Iterative near field acoustical holography algorithm, Proceedings of the 4th International Carphatian Control Conference ICCC 2003, Kosice, Slovakia, 2003, pp. 10-25.
[4] Z. Havranek, F. Jacobsen, Near-field Acoustic Holography with Double Layer Array Processing, Proceedings of EURONOISE 2006, Tampere: Acoustical Society of Finland, 2006, 6 p.
[5] J. Hald, Patch Near-field Acoustical Holography Using a New Statistically Optimal Method, Brüel & Kjaer - Technical Review, Vol. 16, No. 1, 2005, pp. 40-50.
Proc. of the 6th WSEAS Int. Conf. on Signal Processing, Computational Geometry & Artificial Vision, Elounda, Greece, August 21-23, 2006 (pp170-173)