Embed Size (px)
Citation preview
1
Application Note
Visualization of protein sequence features using JavaScript and
SVG with pViz.js
Kiran Mukhyala*, Alexandre Masselot*,+ Department of Bioinformatics and Computational Biology, Genentech Inc., 1 DNA Way, MS 93, South San Fran-
cisco, CA 94080.
ABSTRACT
Summary: pViz.js is a visualization library for displaying protein
sequence features in a web browser. By simply providing a se-
quence and the locations of its features, this lightweight yet versatile
JavaScript library renders an interactive view of the protein features.
Interactive exploration of protein sequence features over the web is
a common need in Bioinformatics. Although many websites have
developed viewers to display these features, their implementations
are usually focused on data from a specific source or use case.
Some of these viewers can be adapted to fit other use cases but are
not designed to be reusable. pViz makes it very easy to display
features as boxes aligned to a protein sequence with zooming func-
tionality but also includes predefined renderings for secondary struc-
ture and post-translational modifications. The library is designed to
further customize this view. We demonstrate such applications of
pViz using two examples: a proteomic data visualization tool with an
embedded viewer for displaying features on protein structure, and a
tool to visualize the results of the variant_effect_predictor tool from
Ensembl.
Availability: pViz.js is a JavaScript library, available on github at
https://github.com/Genentech/pviz. This site includes examples and
functional applications, installation instructions and usage documen-
tation. A Readme file, which explains how to use pViz with exam-
ples, is available as Supplementary Material A.
Contact: [email protected]
1 INTRODUCTION
Visualization of protein features such as protein domains, post-
translational modifications or sequence polymorphisms is critical for
interpretation and analysis of proteomic data. Interactive visualiza-
tion of multiple sources of protein features allows for integrated data
analysis and hypothesis generation.
A number of tools have previously been developed that enable visu-
alization of protein features. Some websites include custom views
that are tightly integrated with the website (ex. nextProt (Lane et al.,
2012), Interpro (Quevillion et al., 2005), PFAM (Punta et al., 2012),
Protein Data Bank (Berman et al., 2000) etc. among many others).
Distributed Annotation System (DAS) client tools like the DASPro-
*Authors contributed equally to the project, +to whom correspondence
should be addressed.
teinFeatureViewer component of BioJS (Gomez et. al., 2013) and
Jalview (Waterhouse AM et. al., 2009) offer limited flexibility to cus-
tomize the view or data sources since data needs to be served by a
DAS server or uploaded by the user. Most others tools, like Protter
(Omasits U et al., 2013), are Java tools that have dependency on a
particular version of Java, require servers for hosting the application
and are not designed to be customized or incorporated into a third
party website. Tools for customizing the data sources, user interac-
tions or styling of protein features are limited for developers of web-
based visualizations.
pViz.js (pViz) makes it easy to display protein sequence features
on a web page. Knowledge of HTML and basic JavaScript is all that
is required to use the library. Basic usage involves including the
library within a script tag in HTML, and writing a few lines of code.
Given a sequence and a list of positioned features, the library dis-
plays the sequence and the features aligned to it. Features are laid
out so as not to overlap each other, allowing zoom, interaction and
customization. Developing pViz as a core library allows it to be used
as a component of other third party libraries or web pages allowing
for application specific customization.
2 METHODS
pViz requires writing JavaScript code to create a protein features
view. JavaScript is a popular language for developing interactive
web applications and is widely used in bioinformatics. This pro-
grammatic approach allows for flexibility in customizing the data
sources, display and interactions. pViz is built upon other commodity
libraries including backbone.js (http://backbonejs.org), d3.js
(http://d3js.org), bootstrap (http://getbootstrap.com), and jQuery
(http://jquery.com), which are bundled in the pViz distribution.
A view in pViz is built by creating a SeqEntry object, containing a
sequence and a list of features (see figure 1A for a working exam-
ple). Sequence features have start and end positions and can have
several optional attributes: a) type, which is used for setting display
and interaction behavior (e.g. “Phosphorylation”, "Helix", "PTM" or
“SNP”), b) category, which groups features and displays them on a
separate track, (e.g. "secondary structure" or "domain" and c) group,
which allows features in the same category separated by their
group, (e.g. “experiment”, “predicted”). Additional attributes can be
attached to a feature, such as text to be displayed or a quantification
measure, which can be used to customize the display. Sequences
Associate Editor: Dr. John Hancock
© The Author (2014). Published by Oxford University Press. All rights reserved. For Permissions, please email: [email protected]
Bioinformatics Advance Access published August 21, 2014 at Florida Institute of T
echnology on August 23, 2014
http://bioinformatics.oxfordjournals.org/
Dow
nloaded from
2
and features typically come from many different sources. pViz sup-
ports FASTA, DAS and PSI/PEFF (Proteomics Standards Initiative,
PSI Extended Fasta Format).
pViz also supports display of multiple proteins. This can be useful
when a simple summary of all features in a set of proteins is desired
before presenting features on a single protein. It is this ability of the
library to let developers adapt it to their needs that makes pViz a
powerful tool. Both the display (size, shape or color) and interaction
(the action performed on a mouse event) for each feature type can
be customized based on the needs. Display can be defined via the
cascading style sheets (CSS) rules or explicit construction of graph-
ical widgets in Scalable Vector Graphics (SVG). Although customiz-
ing SVG is more complex, it is supported by the d3.js library, which
allows constructing virtually any type of graphical widget.
Interactivity is a key feature of pViz. The default implementation
allows zooming on the sequence and one can define behaviors
triggered by a mouse click or hover position on the sequence or
features. Standalone examples of these functionalities are included
in the distribution. To demonstrate these capabilities, we describe
two sample applications included in the pViz distribution.
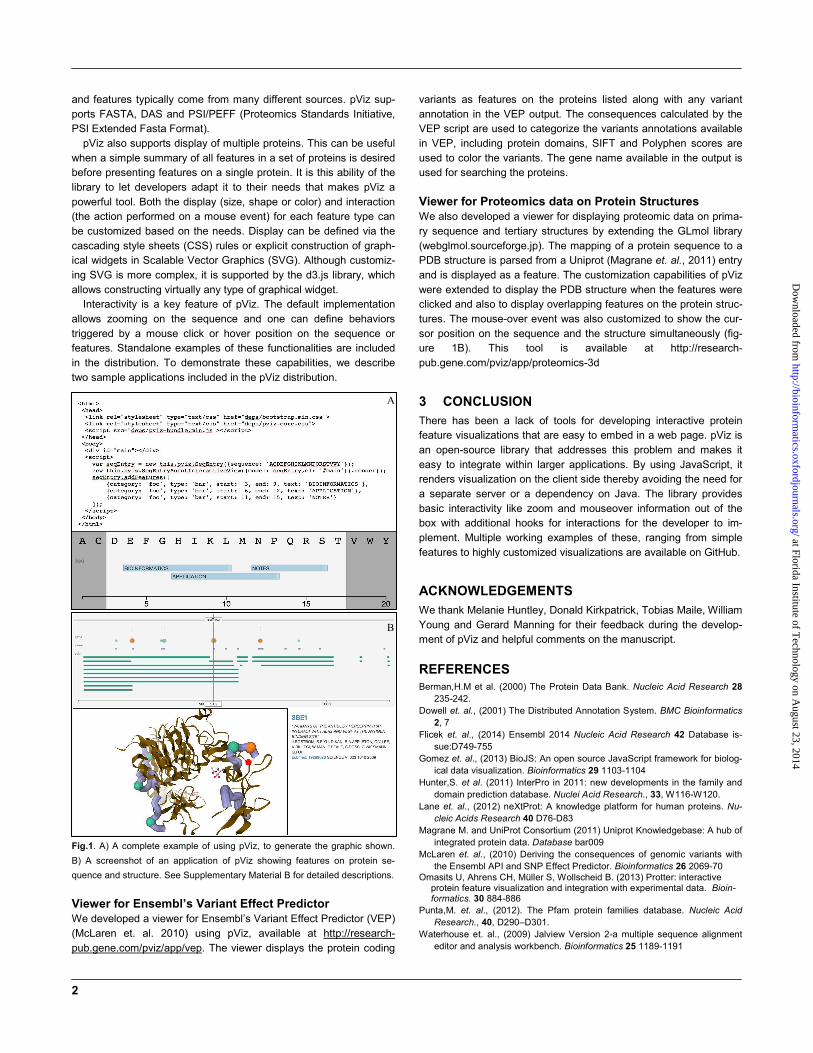
Fig.1. A) A complete example of using pViz, to generate the graphic shown.
B) A screenshot of an application of pViz showing features on protein se-
quence and structure. See Supplementary Material B for detailed descriptions.
Viewer for Ensembl’s Variant Effect Predictor
We developed a viewer for Ensembl’s Variant Effect Predictor (VEP)
(McLaren et. al. 2010) using pViz, available at http://research-
pub.gene.com/pviz/app/vep. The viewer displays the protein coding
variants as features on the proteins listed along with any variant
annotation in the VEP output. The consequences calculated by the
VEP script are used to categorize the variants annotations available
in VEP, including protein domains, SIFT and Polyphen scores are
used to color the variants. The gene name available in the output is
used for searching the proteins.
Viewer for Proteomics data on Protein Structures
We also developed a viewer for displaying proteomic data on prima-
ry sequence and tertiary structures by extending the GLmol library
(webglmol.sourceforge.jp). The mapping of a protein sequence to a
PDB structure is parsed from a Uniprot (Magrane et. al., 2011) entry
and is displayed as a feature. The customization capabilities of pViz
were extended to display the PDB structure when the features were
clicked and also to display overlapping features on the protein struc-
tures. The mouse-over event was also customized to show the cur-
sor position on the sequence and the structure simultaneously (fig-
ure 1B). This tool is available at http://research-
pub.gene.com/pviz/app/proteomics-3d
3 CONCLUSION
There has been a lack of tools for developing interactive protein
feature visualizations that are easy to embed in a web page. pViz is
an open-source library that addresses this problem and makes it
easy to integrate within larger applications. By using JavaScript, it
renders visualization on the client side thereby avoiding the need for
a separate server or a dependency on Java. The library provides
basic interactivity like zoom and mouseover information out of the
box with additional hooks for interactions for the developer to im-
plement. Multiple working examples of these, ranging from simple
features to highly customized visualizations are available on GitHub.
ACKNOWLEDGEMENTS
We thank Melanie Huntley, Donald Kirkpatrick, Tobias Maile, William
Young and Gerard Manning for their feedback during the develop-
ment of pViz and helpful comments on the manuscript.
REFERENCES
Berman,H.M et al. (2000) The Protein Data Bank. Nucleic Acid Research 28
235-242.
Dowell et. al., (2001) The Distributed Annotation System. BMC Bioinformatics
2, 7
Flicek et. al., (2014) Ensembl 2014 Nucleic Acid Research 42 Database is-
sue:D749-755
Gomez et. al., (2013) BioJS: An open source JavaScript framework for biolog-
ical data visualization. Bioinformatics 29 1103-1104
Hunter,S. et al. (2011) InterPro in 2011: new developments in the family and
domain prediction database. Nuclei Acid Research., 33, W116-W120.
Lane et. al., (2012) neXtProt: A knowledge platform for human proteins. Nu-
cleic Acids Research 40 D76-D83
Magrane M. and UniProt Consortium (2011) Uniprot Knowledgebase: A hub of
integrated protein data. Database bar009
McLaren et. al., (2010) Deriving the consequences of genomic variants with
the Ensembl API and SNP Effect Predictor. Bioinformatics 26 2069-70
Omasits U, Ahrens CH, Müller S, Wollscheid B. (2013) Protter: interactive protein feature visualization and integration with experimental data. Bioin-formatics. 30 884-886
Punta,M. et. al., (2012). The Pfam protein families database. Nucleic Acid
Research., 40, D290–D301.
Waterhouse et. al., (2009) Jalview Version 2-a multiple sequence alignment
editor and analysis workbench. Bioinformatics 25 1189-1191
A
B
at Florida Institute of Technology on A
ugust 23, 2014http://bioinform
atics.oxfordjournals.org/D
ownloaded from


![[MS-SVG]: Internet Explorer Scalable Vector Graphics (SVG ...interoperability.blob.core.windows.net/web/MS-SVG/[MS-SVG].pdf · Internet Explorer Scalable Vector Graphics (SVG) Standards](https://img.pdfslide.us/doc/110x75/5a6fc5167f8b9ac0538b6194/ms-svg-internet-explorer-scalable-vector-graphics-svg-interoperabilityblobcorewindowsnetwebms-svgms-svgpdfpdf.jpg)