Embed Size (px)
Citation preview

1
Centre for Advanced Spatial Analysis, University College LondonCentre for Advanced Spatial Analysis
Visualising Cities Through Visualising Cities Through Models, Maps & MachinesModels, Maps & Machines
Michael BattyMichael BattyUniversity College LondonUniversity College London
[email protected]@jmichaelbatty
Visualizing Information in Complex Environments
ASSyST-FuturICT, Torino Italy 17-18 November 2011
http://www.complexcity.info/
Centre for Advanced Spatial Analysis, University College LondonCentre for Advanced Spatial Analysis
Outline
A Little Bit of History: The Origins of Visual Computing:
Five Snapshots: Different Perspectives on the City
• Symbolic Modelling: Land Use Transportation: The System
• Scientific Visualisation: Abstracting the Symbolic System but tomorrow the sessions will detail this in some depth – here is simply a taster
• Iconic Modelling: Virtual London
• Representational and Data Modelling: Web2, Online Maps, Crowdsourcing
• Representational Modelling: Fine Scale Motion and Sensing

2
Centre for Advanced Spatial Analysis, University College LondonCentre for Advanced Spatial Analysis
We should not be surprised that computers are everywhere as right at the beginning, their originators and the philosophers of computation told us they were “ universal machines”
Alan Turing in 1936: “It is possible to invent a single machine which can be used to compute any computable sequence.”
Alan Turing in 1948: “A man provided with paper, pencil, and rubber, and subject to strict discipline, is in effect a universal machine.
Alan Turing in 1952: “I believe that at the end of the century the use of words and general educated opinion will have altered so much that one will be able to speak of machines
thinking without expecting to be contradicted.
Centre for Advanced Spatial Analysis, University College LondonCentre for Advanced Spatial Analysis
And They Can Draw Pictures: A Little Bit of History: The Beginnings of Visual Computing
Whirlwind at MIT

3
Centre for Advanced Spatial Analysis, University College LondonCentre for Advanced Spatial Analysis
Centre for Advanced Spatial Analysis, University College LondonCentre for Advanced Spatial Analysis
The earliest computer movie I found in

4
Centre for Advanced Spatial Analysis, University College LondonCentre for Advanced Spatial Analysis
The first computer movie of urban development we have discovered was produced in 1967 at Michigan State University in East Lansing by Alan Schmidt
Centre for Advanced Spatial Analysis, University College LondonCentre for Advanced Spatial Analysis

5
Centre for Advanced Spatial Analysis, University College LondonCentre for Advanced Spatial Analysis
Line Printers – Before the age of interactive graphics
Centre for Advanced Spatial Analysis, University College LondonCentre for Advanced Spatial Analysis
Early versions of interactive graphics that I worked on in Melbourne in 1982 and then the development of a WATFor77 version in 1986. It is primitive and not nice to look at …
But the 1986 version is better and it still runs on this computer, just …. Let me show you

6
Centre for Advanced Spatial Analysis, University College LondonCentre for Advanced Spatial Analysis
From a VAX Terminal – A Raster 1982 From a Sun Workstation – Simple Windows - 1991
And then we moved fast to workstations and entered the world of graphics that we take for granted today
Centre for Advanced Spatial Analysis, University College LondonCentre for Advanced Spatial Analysis
Enough of History although we ignore it at our peril
Let me move on to
Visualisation, Interaction and Communication
Despite the technology, the focus in computing has become
• Interactive, spontaneous, immediate.
• visual, iconic, participative.
• communicative, remote, networked ……..
Currently our representations and simulations are being rapidly developed as I will show

7
Centre for Advanced Spatial Analysis, University College LondonCentre for Advanced Spatial Analysis
My first example: how do we model the city symbolically, mathematically.
Let me explain what we are doing about simulating the impact of climate change on London as part of the Tyndall Centre’s research on cities. I will quickly sketch it but no time to show the model running
We are building a land use transport model as part of a process of integrated assessment. The key issue is that the model is interactive, immediate, visual and communicates ideas to other professionals involved in the process.
Centre for Advanced Spatial Analysis, University College LondonCentre for Advanced Spatial Analysis

8
Centre for Advanced Spatial Analysis, University College LondonCentre for Advanced Spatial Analysis
Building scenarios visually in the presence of stakeholders – a dialogue
Centre for Advanced Spatial Analysis, University College LondonCentre for Advanced Spatial Analysis
Exporting data and predictions to external software on the fly

9
Centre for Advanced Spatial Analysis, University College LondonCentre for Advanced Spatial Analysis
The new model is bigger and we are developing a web 2 version all in open source software
Centre for Advanced Spatial Analysis, University College LondonCentre for Advanced Spatial Analysis
The LTUMi Eclipse RCP can look like

10
Centre for Advanced Spatial Analysis, University College LondonCentre for Advanced Spatial Analysis
Centre for Advanced Spatial Analysis, University College LondonCentre for Advanced Spatial Analysis
My second example: is based on scientific visualisation which is rather different from this representational visualisation of the system itself
There are many examples where we can visualise the various outcomes from a symbolic model in non‐representational terms – as statistical visualisations, utilising the whole panoply of diagrams and charts that one sees in the work of people like Tufte
Let me show some examples, our work on systems of cities, using power laws to represent the frequency of sizes

11
Centre for Advanced Spatial Analysis, University College LondonCentre for Advanced Spatial Analysis
We can plot the relative volatility of notion of cities with thepower law envelope using the idea of a rank clock
The ‘morphology’ of the rank clock should tell us something – i.e. the increase in cities, the volatility of ranks and so on.
Centre for Advanced Spatial Analysis, University College LondonCentre for Advanced Spatial Analysis
The rudimentary software for this in on our web site athttp://www.casa.ucl.ac.uk/software/rank.aspAnd here is an animation of the US clock ..

12
Centre for Advanced Spatial Analysis, University College LondonCentre for Advanced Spatial Analysis
My third example: how do we model the city iconically, visually.
Fifty years ago iconic models were barely conceived as very being digital but our Virtual London model is now a routine digital ‘architects’ model of the physical form of the city.
It is built in 3D‐GIS, ArcGIS, ported in and out of CAD and Games software, into Google Earth, Second Life, and so on.
We use it as our test bed for multimedia. This is linked to much of our representational and multimedia work that I will tell you about later.
Centre for Advanced Spatial Analysis, University College LondonCentre for Advanced Spatial Analysis
What can we do with the model, flood it, visualise land use, simulate pollution, test the impact of high buildings

13
Centre for Advanced Spatial Analysis, University College LondonCentre for Advanced Spatial Analysis
2D to 3D: GIS to CAD and back and on the web
Centre for Advanced Spatial Analysis, University College LondonCentre for Advanced Spatial Analysis

14
Centre for Advanced Spatial Analysis, University College LondonCentre for Advanced Spatial Analysis
movie
Centre for Advanced Spatial Analysis, University College LondonCentre for Advanced Spatial Analysis
Moving it into related media
Into games engines, virtual worlds, and into back into the material world by printing the model e.g.

15
Centre for Advanced Spatial Analysis, University College LondonCentre for Advanced Spatial AnalysisWe can show a movie of this
Centre for Advanced Spatial Analysis, University College LondonCentre for Advanced Spatial Analysis

16
Centre for Advanced Spatial Analysis, University College LondonCentre for Advanced Spatial AnalysisReal and Virtual Design Studios
Centre for Advanced Spatial Analysis, University College LondonCentre for Advanced Spatial Analysis
Our recent forays are into Second LifeSecond Life where maps from our geodemographics project are being ported as ‘geographic media’ into these virtual worlds ……

17
Centre for Advanced Spatial Analysis, University College LondonCentre for Advanced Spatial Analysis
Let me show you some movies from our recent work with virtual worlds which we are rapidly developing for geographic information and virtual cities ‐ worlds within world, illustrating the essential notion that geographic information, indeed any information can generate insights into real worlds from dialogues in virtual worlds
Second Life Basic Demo
Centre for Advanced Spatial Analysis, University College LondonCentre for Advanced Spatial Analysis
Let me show you some movies from our recent work with virtual worlds which we are rapidly developing for geographic information and virtual cities - worlds within world, illustrating the essential notion that geographic information, indeed any information can generate insights into real worlds from dialogues in virtual worlds
Second Life Build Demo
18
Centre for Advanced Spatial Analysis, University College LondonCentre for Advanced Spatial Analysis
Hard Copy from Soft Copy: Printing Bits of Virtual London
Centre for Advanced Spatial Analysis, University College LondonCentre for Advanced Spatial Analysis
My fourth example: is all about representation in terms of data and maps and web 2 – how to present all of this, in Google maps and other open data
The Google Map Creator creates Google Maps websites from thematic data contained in shapefiles.It effectively layers your map on top of a Google Map or the Google Map

19
Centre for Advanced Spatial Analysis, University College LondonCentre for Advanced Spatial Analysis
We can do the same sort of thing in 3D of course with GEarthCreator – the key is to convert the shapefiles to KML files – and there are many other maphacks using similar open map bases like Open Street Map
From all of this we have devised an open resource for maps called MapTubeMapTube
Centre for Advanced Spatial Analysis, University College LondonCentre for Advanced Spatial Analysis

20
Centre for Advanced Spatial Analysis, University College LondonCentre for Advanced Spatial Analysis
MapTube: a kind of YouTube + Napster
Let me explain: every time someone downloads our software, there is a high probability they make a map.
As it sits on a common base – a Google Map – if they create the map of some place and someone else creates another map of the same place, it would be nice if we or they could compare them as layers
However, in the UK map bases are copyrighted – you can done for copying OS map data and it is serious –
So we ask the user not to put their map created from our software on our site, but to give us their URL where their map is and thus MapTube is a bunch of pointers to URLs ‐this is what it looks like with demo
Centre for Advanced Spatial Analysis, University College LondonCentre for Advanced Spatial Analysis
www.maptube.org

21
Centre for Advanced Spatial Analysis, University College LondonCentre for Advanced Spatial Analysis
Centre for Advanced Spatial Analysis, University College LondonCentre for Advanced Spatial Analysis
Here are some of the user map data in/on MapTube
1. Knife Crime Update, 2. SC IMD Score, 3. SEC IMD Score, 4. PCT Obesity, 5.NO2 Bristol, 6. AGFC Wildlife
1 2 3 4 5 1 2 3 4 5 66
7. Southeast IMD, 8. Southeast IMD (LSOA), 9. Wild Land Quality Scotland, 10.NSSeC L8 (never worked)%, 11. CO2 index
The data behind the knife crimes map (1) has been in the news the last few days after it emerged that the Government had manipulated the data.
7 8 9 10 7 8 9 10 1111
22
Centre for Advanced Spatial Analysis, University College LondonCentre for Advanced Spatial Analysis
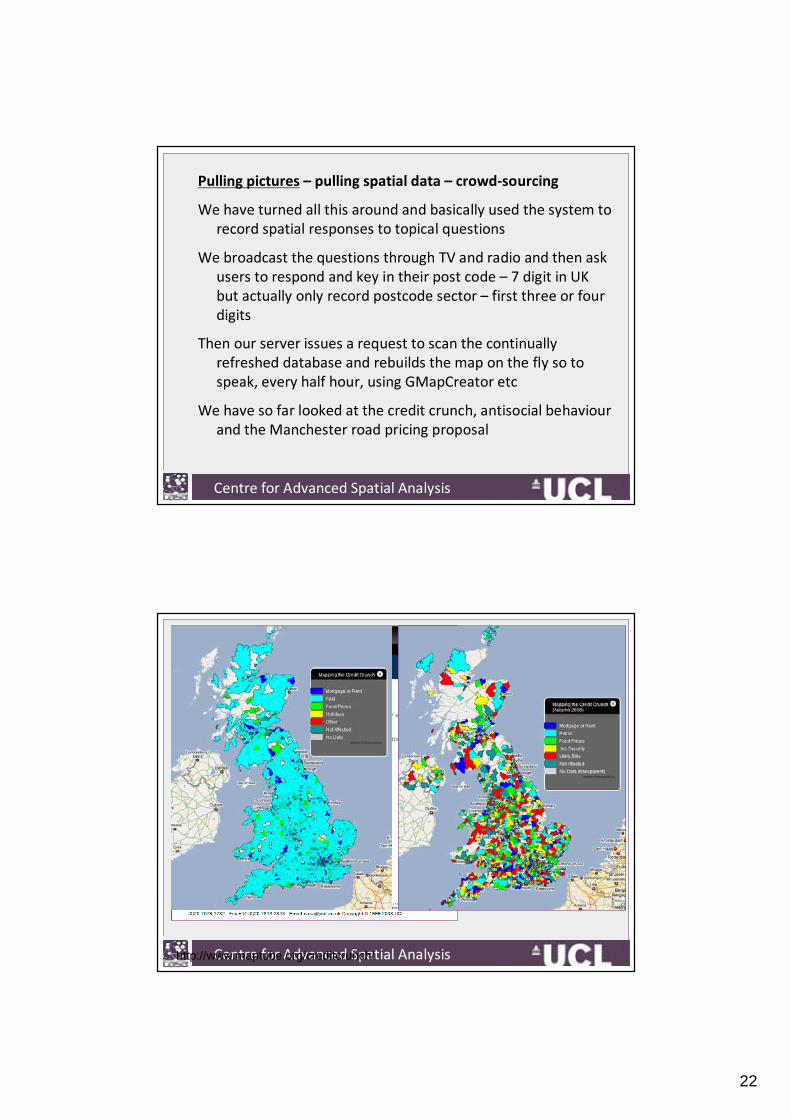
Pulling pictures – pulling spatial data – crowd‐sourcing
We have turned all this around and basically used the system to record spatial responses to topical questions
We broadcast the questions through TV and radio and then ask users to respond and key in their post code – 7 digit in UK but actually only record postcode sector – first three or four digits
Then our server issues a request to scan the continually refreshed database and rebuilds the map on the fly so to speak, every half hour, using GMapCreator etc
We have so far looked at the credit crunch, antisocial behaviourand the Manchester road pricing proposal
Centre for Advanced Spatial Analysis, University College LondonCentre for Advanced Spatial Analysishttp://www.maptube.org/creditcrunch/
23,475 responsesApril, May, June 2008
A new credit crunch survey started in October and currently has 3,802 responses.

23
Centre for Advanced Spatial Analysis, University College LondonCentre for Advanced Spatial Analysis
http://www.maptube.org/lookeast
July, August, September 20086,902 responses
BBC Look East: Anti‐Social Behaviour
Centre for Advanced Spatial Analysis, University College LondonCentre for Advanced Spatial Analysis
Manchester Congestion Charge15,902 responsesOctober to December 2008

24
Centre for Advanced Spatial Analysis, University College LondonCentre for Advanced Spatial Analysis
My fifth and last example: is representational again – how to present all of this, in Google maps as we have seen, and also in terms of motion, sensing
Our EPSRC CAPABLE project involves us in representing and modelling movements at the small scale, pedestrian movements, children walking to school, and using energy.
The project is about communicating these ideas to ourselves and to the wider constituency that is involved in these issues – walkability, obesity, safety.
Centre for Advanced Spatial Analysis, University College LondonCentre for Advanced Spatial Analysis
I have backups as the network here runs slow but let me try to show you these examples from our web site, first www.casa.ucl.ac.uk
But in case I can’t…

25
Centre for Advanced Spatial Analysis, University College LondonCentre for Advanced Spatial Analysis
Enough of me and onto the real stuff…how do we do this stuff, how do we present and communicate it to ourselves and to others.
Centre for Advanced Spatial Analysis, University College LondonCentre for Advanced Spatial Analysis
And like everyone else we are working with geocodes data from social networks
Many traffic data sets – Oyster card data, bikes data, taxi cab GPS and so on but here we will look at Tweets – the Tweet‐o‐Meter

26
Centre for Advanced Spatial Analysis, University College LondonCentre for Advanced Spatial Analysis
New York London Paris Moscow
Centre for Advanced Spatial Analysis, University College LondonCentre for Advanced Spatial Analysis
London
Heathrow
Kingston
Purley
Croydon
Colindale
Enfield
Barking
1
10
100
1000
1 10 100 1000 10000
0
200
400
600
800
1000
1200
1400
1600
1800
0 4 8 12 16 20 24
Time by 24 Hour Clock
Num
ber
of T
we
ets
1.4
1.5
1.6
1.7
1.8
1.9
2
2.1
Zip
f Par
ame
ter

27
Centre for Advanced Spatial Analysis, University College LondonCentre for Advanced Spatial Analysis
A lot of material I know, A lot of material I know, but to paint a picture, an impressionismbut to paint a picture, an impressionism
Questions, Discussion?Questions, Discussion?
www.complexcity.info