Embed Size (px)
Citation preview

SP Power Systems Limited Registered Office: 1 Atlantic Quay Glasgow G2 8SP Registered in Scotland No. 215841 Vat No. GB 659 3720 08
In collaboration with
Project Progress Report
[Internal]
June 2015
For enquiries please contact: Priyanka Mohapatra VISOR Project Manager SP Energy Networks Email: [email protected] Telephone: 0044 (0)1416142789
Visualisation of Real Time System Dynamics using Enhanced Monitoring
(VISOR)
VISOR Project Progress Report June 2015
2
Table of Contents
1 Executive Summary .............................................................................................................................. 4
1.1 Project Highlights .................................................................................................................... 4
1.2 Project Risks ............................................................................................................................ 7
1.2.1 Technical and Roll-Out Risks ........................................................................................... 7
1.2.2 Project Management Risks ............................................................................................. 7
1.2.3 Summary of Learning Outcomes ..................................................................................... 7
2 Project Manager’s Report .................................................................................................................... 9
2.1 Project Progress Summary ...................................................................................................... 9
2.2 Monitoring and Management of Constraints ....................................................................... 10
2.2.1 B6 Display Specification ................................................................................................ 10
2.2.2 System Disturbance Monitoring (SDM) Specification ................................................... 11
2.3 Waveform Measurement Unit and Server Installation ........................................................ 12
2.4 [CONFIDENTIAL] Report on PMU based line parameter estimation and variability (WP 2.1,
March 2015) ...................................................................................................................................... 14
2.5 System SSO Behaviour Report and VISOR Workshop ........................................................... 15
2.6 WMU and WAMS SAT ........................................................................................................... 17
2.7 Knowledge Sharing and Stakeholder Engagement ............................................................... 17
2.8 Outlook to the Next Reporting Period .................................................................................. 18
3 Consistency with full submission ....................................................................................................... 20
4 Risk Management (Confidential) ....................................................................................................... 21
4.1 Project Management Risks ................................................................................................... 21
4.1.1 Key Project Management Risk ...................................................................................... 21
4.2 Technical Risks ...................................................................................................................... 23
4.2.1 Key Technical and Roll-Out Risks .................................................................................. 23
5 Successful Delivery Reward Criteria (SDRC) ....................................................................................... 25
6 Learning Outcomes ............................................................................................................................ 27
6.1 Project Management ............................................................................................................ 27
6.2 Technical Learning ................................................................................................................ 28
6.2.1 System Commissioning Learning .................................................................................. 28

VISOR Project Progress Report June 2015
3
6.2.2 WAMS Based Alarming on the Proximity of Electrical and Torsional Modes ............... 28
6.2.3 Limitations of Existing Software Tools for Sub-Synchronous Oscillation Studies ......... 29
6.2.4 Necessity for Base Lining PMU performance ................................................................ 29
6.2.5 Hybrid State Estimation ................................................................................................ 30
6.2.6 Potential Synergy with the NIC Funded EFCC project ................................................... 30
7 Business Case Update ........................................................................................................................ 32
8 Bank Account ..................................................................................................................................... 33
9 Intellectual Property Rights (IPR) Confidential .............................................................................. 35
10 Other ................................................................................................................................................ 36
11 Accuracy Assurance Statement ........................................................................................................ 37
12 Appendices ....................................................................................................................................... 38
12.1 Appendix 1 VISOR SharePoint link and description ............................................................. 38
12.2 Appendix 2 Project Risk Register (Confidential) ................................................................. 39
12.3 Appendix 3 Bank Account Statement (Confidential) .......................................................... 40

VISOR Project Progress Report June 2015
4
1 Executive Summary
SP Transmission (SPT), supported by other the transmission licensees and the academic partner, made a full proposal submission for Visualisation of Real Time System Dynamics with Enhanced Monitoring (VISOR), under the Network Innovation Competition (NIC) mechanism in 2013. Ofgem approved the proposal and issued the Project Direction on the 19th of December 2013. The project commenced in January 2014 and is due to conclude in March 2017.
The VISOR project will showcase the role of an enhanced Wide Area Monitoring System (WAMS) in overcoming the challenges faced by the GB power system as it moves toward a low carbon future. It will create the first WAMS for the GB network and will also mark the first deployment of new Waveform Measurement Units (WMUs), which generate 200 frames per second data for the detection of sub-synchronous oscillations (SSO), anywhere in the world.
VISOR will create the first WAMS to collate, store, visualise and analyse synchronised measurements in real-time from across all three of the GB TOs. The WAMS will incorporate wide area synchronised phasor measurements produced at a rate of 50 frames per second that will provide unparalleled monitoring and understanding of the dynamic behaviour of the GB system, when compared to unsynchronised SCADA data that is sampled at one frame per second.
VISOR will focus upon the following key areas that are expected to be of the most benefit to the GB system in the short to medium term:
Real-time monitoring and alarming of sub-synchronous oscillations in the range 0.002Hz to 46Hz,
Dynamic model validation using post mortem analysis of WAMS data,
Hybrid state estimation using Phasor Measurement Unit (PMU) and SCADA data, and,
The potential use of angle based security limits to increase power flow on the B6 boundary between Scotland and England.
.
1.1 Project Highlights
This is the third progress report and covers six months of the project delivery December 2014 - June
2015, “the reporting period”.
The project delivery so far is in line with the original proposal regarding project programme,
resources, budget, risk management, intellectual property rights (IPR) and knowledge sharing, and
over the reporting period, supporting evidence for the following Successful Delivery Reward Criteria
(SDRC) have been delivered on schedule:
SDRC 9.1.1:
Visualisation of multiple SSO information sources at data centre
Baseline and comparator report for SSO behaviour (first in series of three annual reports
of this kind)
SDRC 9.3.1:

VISOR Project Progress Report June 2015
5
Report on PMU based line parameter estimation and variability (WP 2.1, March 2015)
SDRC 9.1 and 9.3 are scheduled to be fully met in 2016 and 2017 pending completion of other
elements of supporting evidence.
The Project Delivery Team (PDT) has successfully undertaken the following activities during the
reporting period:
VISOR WMU installations completed at Hutton (NGET) and Eccles, Hunterston (SPEN) -
significantly ahead of schedule.
WAMS server installation and firewall configuration completed at Wokingham (NGET) and
Kirkintilloch (SPEN)
WAMS & WMU SAT successfully completed at NGET on the 11th and 12th of May and at SPEN
on the 14th and 15th of May.
Contract placed with Verizon to establish communication MPLS link between Kirkintilloch
(SPEN) and Wokingham (NGET) and IPSEC link between Perth (SSE) and Wokingham (NGET).
Demonstration of Sub-Synchronous Oscillation (SSO) application at Wokingham and
Kirkintilloch: collection, analysis and visualisation of wide-area SSO information.
MPLS link successfully placed between Kirkintilloch PDC (SPEN) and Wokingham Data Hub
(NGET).
Additional WMU installations planned for 2015 at Stella-West, Connor’s Quay, Grain (NGET)
and Torness, Auchencrosh-Coylton (SPEN).
B6 boundary specification and SDM specification were submitted by Psymetrix and reviewed
by project delivery team.
The following reports were produced by Psymetrix based on actual system data from NGET
and SPEN (Jan 14-Mar 15)
Report on PMU based line parameter estimation and variability
System Performance Review incorporating:
WAMS Infrastructure performance
Power System Oscillatory behaviour: baseline & events
Power System Disturbances
These reports were thoroughly reviewed by project delivery team and forwarded to project
steering board for approval. External versions of these reports will be published at
http://www.visor-project.org.uk/ by the end of June.
The System Performance Review (Jan 14-Mar 15) was discussed in detail at a workshop held
on the 14th and 15th of April, 2015 at Psymetrix, Edinburgh.
NGET facilitated ECM workspace for Project VISOR to have common SharePoint for
documents management and version control.
VISOR PDT collaboratively made efforts to capture all significant learning outcomes
generated in this period in a co-ordinated manner to enable us to articulate all significant
learnings in future progress reports.

VISOR Project Progress Report June 2015
6
The GB wide WAMS deployment overview Paper synopsis submitted for VISOR & Smart Frequency
Control (EFCC) project VISOR is shown in Figure 1.
Figure 1 VISOR WAMS Deployment Overview

VISOR Project Progress Report June 2015
7
1.2 Project Risks
There are currently no uncontrolled risks that could impede the achievement of any of the SDRCs
outlined in the Project Direction, or which could cause the Project to deviate from the Full
Submission. We monitor risks on a continuous basis, including the potential risks that were
documented in the Full Submission. These are described in detail in section 4.
1.2.1 Technical and Roll-Out Risks
The following technical risks were encountered during commissioning and system analysis for
project VISOR from December’14 to June’15:
• At SPEN and NGET firewall configurations required to enable UDP data transmission
from Substation to PDC proved to be challenging. Additional approval was required
from business IT security department causing delay in receiving WMU data.
• At NGET the on-going changes to business communications infrastructure required
VISOR PDT to go through various approval procedures to integrate VISOR infrastructure
with business.
• Analysis of system data measured at currently installed PMUs on SPT and NGET
transmission network highlighted many data quality issues. NGET and SPT were aware of
many of the issues and ongoing mitigation actions are continuing to progress. The
quality of reports generated during this period was adversely affected by these issues.
1.2.2 Project Management Risks
• The most significant project management risk in this period is an ongoing risk of
different levels of progress amongst TOs. Whilst NGET and SPT have significantly
progressed and completed hardware and software installation. SSE still has not
commenced WAMS installations. This poses a huge risk to the successful and timely
delivery of project VISOR.
Further details of Risk Management including Technical Risk and Project Management Risk can be
found in Section 4 of this document.
1.2.3 Summary of Learning Outcomes
Successful WMU installations are now complete at Eccles, Hunterston (SPT) and Hutton (two
circuits) (NGET). WAMS PDCs are now receiving data from pre-existing PMUs (50Hz) and newly
installed WMUs (200Hz). The WAMS SAT was successfully carried out at NGET and SPT. There have
been many key learning outcomes regarding WAMS installations in this period. During the WAMS
commissioning and configuration phase, both at NGET and SPT, various issues related to
communications infrastructure, data quality and cyber security emerged. Some of the issues were
unprecedented and others could have been identified and catered for earlier provided the TOs had
more information regarding the nature of infrastructure changes and level of accuracy required for
successful WAMS deployment.
Significant learning outcomes were also generated from the two reports based on actual system
data for project VISOR. The Line Parameter Estimation report proved that the new algorithm

VISOR Project Progress Report June 2015
8
developed under this project produces better quality results than any other algorithm currently
being studied or used for the same purpose. The SSO System Behaviour report provided an insight
into the series of dynamic interactions in the system leading to or following an actual system event
and/or state change.
The aforementioned reports also reiterated that poor data quality/availability can adversely affect
the quality of results and, in the long term if not properly addressed, can be a major issue in a
successful WAMS rollout. The reports successfully predicted various factors that could be
responsible for poor data quality. These are now being addressed in line with pre-existing activities
to review and improve the quality of monitoring data. Detailed system data and event analysis was
carried out during the system data workshop at Edinburgh on the 14th and 15th of April, 2015.
NGET and SPT have performed an audit on their existing PMUs to analyse these issues further.
Manufacturers of the installed PMUs at NGET and SPT have been contacted regarding issues that can
be fixed with simple firmware updates and crystal oscillators for improving GPS signal management.
Some issues, for example, poor data availability caused by communication delays in NGET networks,
are being managed through ongoing network changes and upgrades. Monthly data checks are also
to be carried out by the VISOR team to ensure that the data quality is maintained throughout the
period of assessment and beyond, so that it does not degrade the quality of results presented in key
reports.
A key learning outcome of this exercise has been that the business needs to invest time and capital
to improve infrastructure and adapt network management policies for better communication
reliability and accuracy. A significant shift is observed in the nature of infrastructure requirements
for modern power grid monitoring solutions when compared to previous business as usual
approaches (e.g. SCADA and dial-up Fault Recorder connections), and these requirements need to be
handled in a timely manner to avoid delays in the project delivery phase.
Effective management and ensuring progress in project deliverables in project VISOR is simplified by
the efficient project delivery team. Members of the PDT have taken up tasks in a dedicated and
responsible manner and have timely delivered, leading to successful achievement of key project
milestones. PDT members have also regularly assessed risks and raised them with the project
manager. Mitigation measures were planned and implemented for individual risks and project
delivery delays were avoided by fast tracking actions as and when required.
The knowledge sharing and effective engagement with stakeholders can be found in our
presentations at the IET Birmingham Conference (21st of April, 2015) and All-Energy Conference (6-
7th of May, 2015).

VISOR Project Progress Report June 2015
9
2 Project Manager’s Report This section highlights the VISOR projects key activities, milestones, risks and learning over the
reporting period (December 2014-June 2015).
2.1 Project Progress Summary
VISOR remains on course for a satisfactory delivery over this reporting period regarding the project
programme. The significant achievements during the reporting period are:
WAMS & WMU SAT successfully completed at NGET on the 11th and 12th of May and at SPEN on the 14th and 15th of May. Psymetrix also conducted an additional SSO demonstration for stakeholders in combination with the SAT.
Demonstration of Sub-Synchronous Oscillation (SSO) application at Wokingham and Kirkintilloch: collection, analysis and visualisation of wide-area SSO information.
MPLS link successfully placed between Kirkintilloch PDC (SPEN) and Wokingham Data Hub (NGET).
Reports were produced by Psymetrix based on actual system data from NGET and SPEN (Jan 14-Mar 15)
Report on PMU based line parameter estimation and variability
System Performance Review incorporating:
WAMS Infrastructure performance
Power System Oscillatory behaviour: baseline & events
Power System Disturbances
The conclusions from the System Performance Review (Jan 14-Mar 15) and subsequent follow-on actions were discussed in detail at a workshop held on the 14th and 15th of April, 2015 at Psymetrix, Edinburgh.
WAMS SAT successfully completed at NGET on the 11th and 12th of May and at SPEN on the 14th and 15th of May. Psymetrix also conducted an additional SSO demonstration for stakeholders in combination with the SAT.
To achieve these milestones, the following key pre condition elements had been completed:
VISOR WMU installations completed at Hutton (NGET) and Eccles, Hunterston (SPEN).
WAMS server installation and firewall configuration completed at Wokingham (NGET) and Kirkintilloch (SPEN).
Contract placed with Verizon to establish communication MPLS link between Kirkintilloch (SPEN) and Wokingham (NGET) and IPSEC link between Perth (SSE) and Wokingham (NGET).
VISOR Project Progress Report June 2015
10
Other achievements include:
B6 boundary specification and SDM specification were submitted by Psymetrix and reviewed and approved by project delivery team.
The next tranche of WMU installations has been planned for 2015 at Stella-West, Connor’s Quay (NGET) and Torness, Auchencrosh-Coylton (SPEN). Additional WMU units have been ordered for NGET installations.
Following the System Performance Report, audits of existing PMU installations have been carried out
at NGET and SPT as a first step in investigating data quality issues. Some subsequent steps have
already been taken to address some of the issues highlighted. In addition to the positive technical
contributions named above, three elements set out in SDRC were completed, regarding visualisation
of SSO data at PDCs, use of system data for accurate line parameter estimation and system data
analysis for NGET and SPT from Jan’14-Mar’15.
2.2 Monitoring and Management of Constraints
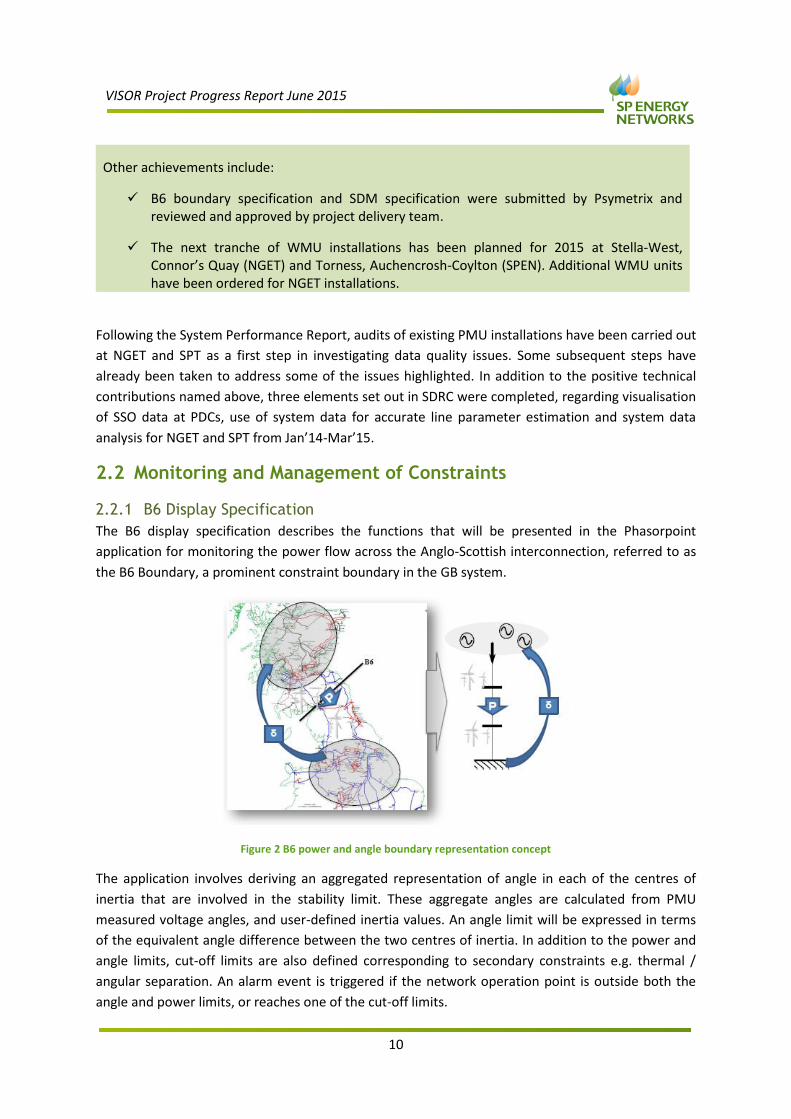
2.2.1 B6 Display Specification
The B6 display specification describes the functions that will be presented in the Phasorpoint
application for monitoring the power flow across the Anglo-Scottish interconnection, referred to as
the B6 Boundary, a prominent constraint boundary in the GB system.
Figure 2 B6 power and angle boundary representation concept
The application involves deriving an aggregated representation of angle in each of the centres of
inertia that are involved in the stability limit. These aggregate angles are calculated from PMU
measured voltage angles, and user-defined inertia values. An angle limit will be expressed in terms
of the equivalent angle difference between the two centres of inertia. In addition to the power and
angle limits, cut-off limits are also defined corresponding to secondary constraints e.g. thermal /
angular separation. An alarm event is triggered if the network operation point is outside both the
angle and power limits, or reaches one of the cut-off limits.

VISOR Project Progress Report June 2015
11
Figure 3 Live and Historical Display
The key advantages of including angle in constraint management include:
Dynamic limits are more closely related to the area angle movement than to the power
through a cut-set. Both first-swing (transient) and damping limits are physically related to
the following phenomena:
Effective impedance between the areas: Angle increases with weakening of corridor between
areas
Loading of the interconnection lines Angles increase with power interchange between areas
Distribution of power within the connecting areas: Angles increase as greater proportion of
power far from the boundary
2.2.2 System Disturbance Monitoring (SDM) Specification
The System Disturbance Monitoring: Disturbance Characterisation (SDM: DC) application utilises
PMU voltage angle and frequency data to detect, localise and characterise system disturbances such
as line trips and generation losses. The application uses the principle that during a transient
disturbance, the frequency and angle of the power system move more rapidly close to the source of
the disturbance.
The end result in the first moments after the disturbance (e.g. 0.5 seconds) is:
Very rapid angle movement near the disturbed bus.
Larger, faster angle movement at the station buses close to the disturbed bus.
Smaller angle movement at generators further from the disturbed bus.
Initial acceleration or deceleration greater close to the disturbance.
VISOR Project Progress Report June 2015
12
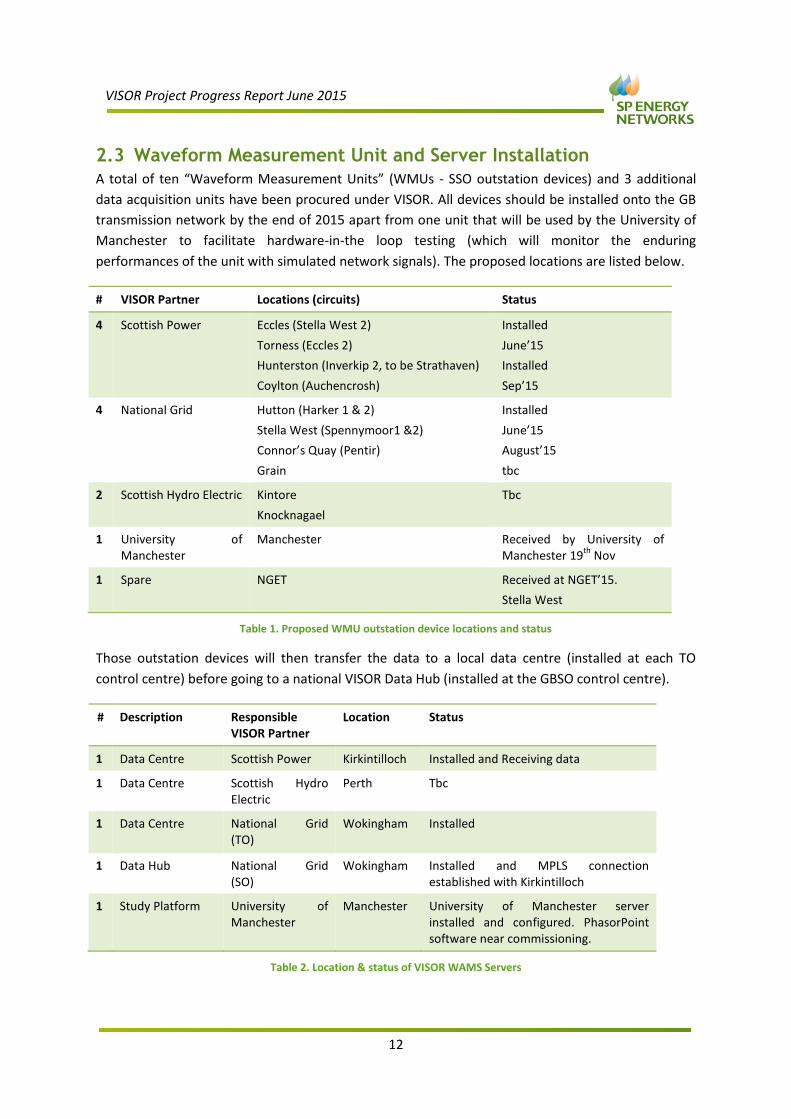
2.3 Waveform Measurement Unit and Server Installation
A total of ten “Waveform Measurement Units” (WMUs - SSO outstation devices) and 3 additional
data acquisition units have been procured under VISOR. All devices should be installed onto the GB
transmission network by the end of 2015 apart from one unit that will be used by the University of
Manchester to facilitate hardware-in-the loop testing (which will monitor the enduring
performances of the unit with simulated network signals). The proposed locations are listed below.
# VISOR Partner Locations (circuits) Status
4 Scottish Power Eccles (Stella West 2)
Torness (Eccles 2)
Hunterston (Inverkip 2, to be Strathaven)
Coylton (Auchencrosh)
Installed
June’15
Installed
Sep’15
4 National Grid Hutton (Harker 1 & 2)
Stella West (Spennymoor1 &2)
Connor’s Quay (Pentir)
Grain
Installed
June’15
August’15
tbc
2 Scottish Hydro Electric Kintore
Knocknagael
Tbc
1 University of Manchester
Manchester Received by University of Manchester 19
th Nov
1 Spare NGET Received at NGET’15.
Stella West
Table 1. Proposed WMU outstation device locations and status
Those outstation devices will then transfer the data to a local data centre (installed at each TO
control centre) before going to a national VISOR Data Hub (installed at the GBSO control centre).
# Description Responsible VISOR Partner
Location Status
1 Data Centre Scottish Power Kirkintilloch Installed and Receiving data
1 Data Centre Scottish Hydro Electric
Perth Tbc
1 Data Centre National Grid (TO)
Wokingham Installed
1 Data Hub National Grid (SO)
Wokingham Installed and MPLS connection established with Kirkintilloch
1 Study Platform University of Manchester
Manchester University of Manchester server installed and configured. PhasorPoint software near commissioning.
Table 2. Location & status of VISOR WAMS Servers

VISOR Project Progress Report June 2015
13
Figure 4 Schematic and geographical views of the VISOR WAMS
VISOR Project Progress Report June 2015
14
2.4 [CONFIDENTIAL] Report on PMU based line parameter
estimation and variability (WP 2.1, March 2015)
The computation of transmission line parameters in real time is one of the potential benefits of
phasor measurement systems applied at both line ends. Several applications depend on accurate
knowledge of line resistance, inductance and capacitance. Work has shown that uncertainties in
parameters can cause significant degradation in the output of state estimators, affecting the results
of dependent applications. Calculation of fault levels, power flows and losses, together with
contingency analysis and voltage stability assessment can also benefit from line parameter accuracy.
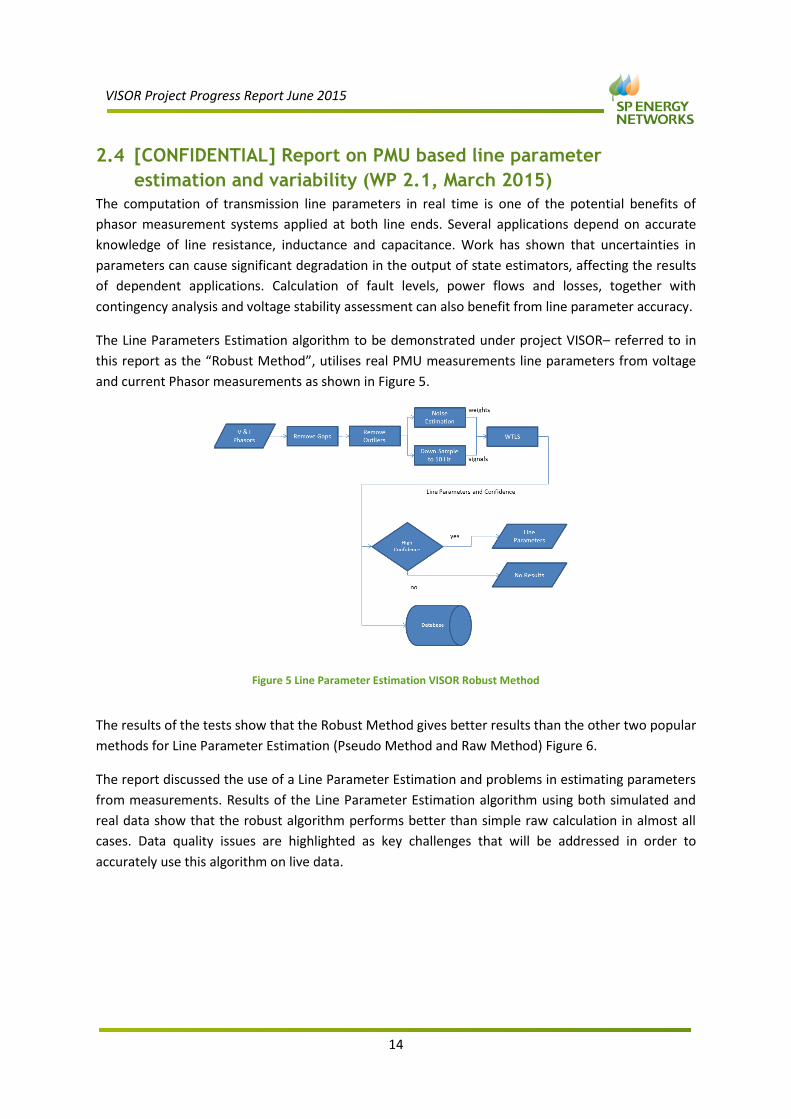
The Line Parameters Estimation algorithm to be demonstrated under project VISOR– referred to in
this report as the “Robust Method”, utilises real PMU measurements line parameters from voltage
and current Phasor measurements as shown in Figure 5.
Figure 5 Line Parameter Estimation VISOR Robust Method
The results of the tests show that the Robust Method gives better results than the other two popular
methods for Line Parameter Estimation (Pseudo Method and Raw Method) Figure 6.
The report discussed the use of a Line Parameter Estimation and problems in estimating parameters
from measurements. Results of the Line Parameter Estimation algorithm using both simulated and
real data show that the robust algorithm performs better than simple raw calculation in almost all
cases. Data quality issues are highlighted as key challenges that will be addressed in order to
accurately use this algorithm on live data.

VISOR Project Progress Report June 2015
15
Figure 6 Line Parameter Estimation Results
2.5 System SSO Behaviour Report and VISOR Workshop
Project VISOR successfully delivered the 1st System Performance Review and associated Technical
Workshop in March and April 2015 respectively. The Performance Review analysed collected PMU
data for the period of 2014-2015 and WMU data for period of March 2015 collected from NGET and
SPEN. Significant learnings generated from both the report and workshop are highlighted below:
VISOR Project Progress Report June 2015
16
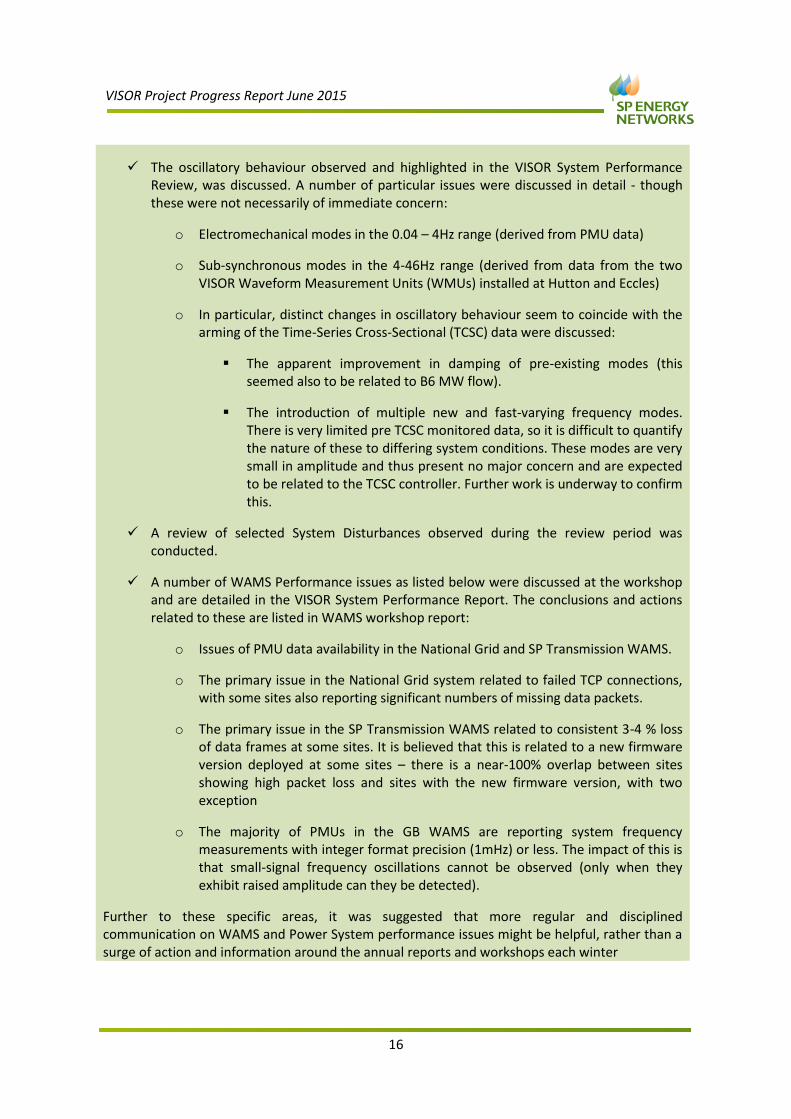
The oscillatory behaviour observed and highlighted in the VISOR System Performance Review, was discussed. A number of particular issues were discussed in detail - though these were not necessarily of immediate concern:
o Electromechanical modes in the 0.04 – 4Hz range (derived from PMU data)
o Sub-synchronous modes in the 4-46Hz range (derived from data from the two VISOR Waveform Measurement Units (WMUs) installed at Hutton and Eccles)
o In particular, distinct changes in oscillatory behaviour seem to coincide with the arming of the Time-Series Cross-Sectional (TCSC) data were discussed:
The apparent improvement in damping of pre-existing modes (this seemed also to be related to B6 MW flow).
The introduction of multiple new and fast-varying frequency modes. There is very limited pre TCSC monitored data, so it is difficult to quantify the nature of these to differing system conditions. These modes are very small in amplitude and thus present no major concern and are expected to be related to the TCSC controller. Further work is underway to confirm this.
A review of selected System Disturbances observed during the review period was conducted.
A number of WAMS Performance issues as listed below were discussed at the workshop and are detailed in the VISOR System Performance Report. The conclusions and actions related to these are listed in WAMS workshop report:
o Issues of PMU data availability in the National Grid and SP Transmission WAMS.
o The primary issue in the National Grid system related to failed TCP connections, with some sites also reporting significant numbers of missing data packets.
o The primary issue in the SP Transmission WAMS related to consistent 3-4 % loss of data frames at some sites. It is believed that this is related to a new firmware version deployed at some sites – there is a near-100% overlap between sites showing high packet loss and sites with the new firmware version, with two exception
o The majority of PMUs in the GB WAMS are reporting system frequency measurements with integer format precision (1mHz) or less. The impact of this is that small-signal frequency oscillations cannot be observed (only when they exhibit raised amplitude can they be detected).
Further to these specific areas, it was suggested that more regular and disciplined communication on WAMS and Power System performance issues might be helpful, rather than a surge of action and information around the annual reports and workshops each winter
VISOR Project Progress Report June 2015
17
2.6 WMU and WAMS SAT
The WMU and WAMS server SAT was successfully completed at NGET, Wokingham on the 11th and
12th of May and at SPEN, Cambuslang (connected to Kirkintilloch) on the 14th and 15th of May. The
SAT procedures were signed by respective PDT members from NGET and SPEN and are available for
review.
The WMU and WAMS SAT is an important milestone in VISOR project delivery as it proves the
technology readiness level of the hardware and software procured for implementing GB WAMS
system and mitigates the risk of time delays and financial impact on the project.
2.7 Knowledge Sharing and Stakeholder Engagement
The VISOR Team has a strong commitment in knowledge sharing and effective stakeholder
engagement. This is to ensure that VISOR can adopt the latest technology advancements, share the
lessons learned by/with other stakeholders, facilitate new entry to the market and disseminate the
key learning captured along the VISOR delivery.
During the project period, the PDT have presented the VISOR project updates and learning at the following events:
1. Presentation at IET Preparing for the Grid of the Future Event, Birmingham, 21st April 2015 http://www.theiet.org/events/2015/215421.cfm https://tv.theiet.org/?videoid=6753
2. All Energy Conference, Glasgow, 7th May, 2015 http://www.all-energy.co.uk/
3. Presentation at IET Synthetic Inertia Breakfast Event, Birmingham, 14th May, 2015 http://www.theiet.org/events/2015/217904.cfm
4. Presentation at 1st International Symposium on Smart Grid Methods, Tools and Technologies, Jinan, 18th – 20th May 2015 http://idclab.sdu.edu.cn/sgmtt/
In the forthcoming period, the PDT have confirmed slots to provide VISOR project updates and learning at the following events:
1. Paper and Presentation at PAC World Glasgow, 29th June – 2nd July 2015 http://conference.pacw.org/
2. Presentation at IEEE General Meeting, Denver, 26th – 30th July 2015 http://www.pes-gm.org/2015/
3. Paper and Presentation at APAP Conference, Nanjing, 20th -26th Sept 2015 4. Paper and Presentation at Cigre Study Colloquium B5, Nanjing, 20th 26th Sept 2015
http://www.cigre-scb5-nanjing2015.com/registration.php 5. Journal Paper describing VISOR in Special Issue of Modern Power Systems and Clean
Energy (MPCE) – http://www.mpce.info/ch/index.aspx 6. SGTech Europe Smart Grid conference, , Amsterdam, 22
nd – 24
th Sept, 2015
http://www.sgtech-europe.com/ 7. LCNI Conference 2015, Liverpool, 24 – 26/11
http://www.lcniconference.org/ 8. Cigre 2016 , VISOR and SMART Frequency Control projects
http://www.cigre.org/Events/Session/Session-2016

VISOR Project Progress Report June 2015
18
Further ahead, the following tasks are targeted to produce knowledge dissemination of the VISOR project updates to the wider audience:
1. Submit Paper for IEEE General Meeting 2016 2. Submit Journal Paper on Laboratory Testing of Synchronised Measurement Device
Performance 3. Submit Journal Paper on Line Parameter Estimation 4. Organise Stakeholder Engagement Event, Aug-Sept 2015
2.8 Outlook to the Next Reporting Period
The milestones set for next reporting period in VISOR project direction are as follows:
9.4.1 Display incorporating power, angle and associated thresholds (WP 3.3, Dec 2015)
VISOR PDT has successfully defined the B6 boundary display specification outlining the requirement
and details of display to be developed as a part of the project delivery incorporating power, angle
and associated thresholds. A prototype of the live and historical display is shown in Figure 7. The
current progress in developing this specification is indicative of the project being on track to deliver
this milestone on time.
Figure 7 Live and Historical Display
9.5.1 System commissioning report (WP 4A, Dec 2015)
The system commissioning of WMUs, WAMS server and communication links has generated significant learning regarding processes, risks and challenges involved in large scale installations like that in project VISOR. The interaction of the innovation and project delivery team with the business planning, procurement and operations team is particularly of interest and needs to evaluate for future innovation projects. The key challenge during commissioning is communication and understanding of the system requirements between key parties involved. The time scale of innovation projects and the nature of services required needs to be better understood and

VISOR Project Progress Report June 2015
19
appreciated. The VISOR commissioning report will capture all aspects of engineering involved, aforementioned challenges and give an insight into VISOR PDT’s planning and risk mitigation strategies for successful project delivery. 9.5.1 Visualisation of data in SPT, NGET, SHE Transmission including real-time and historic (WP 4A,
Dec 2015)
This milestone has been partially achieved by visualisation of real time and historic data at SPT and
NGET. SSE is still to achieve this milestone; however current progress is indicative of this milestone
to be completed on time.
9.6.1 Presentations and show-casing at the annual innovation conferences (WP 5.4, Dec 2015)
Project VISOR will be presented under network resilience and network performance category at the annual LCNI conference to be held at Liverpool from the 24th – 26th of November’2015. In addition to achieving the above mentioned milestones VISOR PDT also plans to concentrate its efforts on working on various action items generated from VISOR workshop and system report to improve the quality of real-time monitoring data (PMUs) in GB and thus improve quality of learning generated through this project. Additional sites have also been identified by NGET (Grain) where SSO is a potential issue due to interactions when operating HVDC links adjacent to wind-farms and thermal plant. Although not initially planned in project VISOR, monitoring of Grain will represent the importance of WAMS in GB and generate qualitative knowledge for GB SO, using this enhanced capability, this will provide reference data against which we can compare monitored results from B6.
Top Tail Engagement, Southampton, 17-18th Nov

VISOR Project Progress Report June 2015
20
3 Consistency with full submission Eighteen months into the project delivery, VISOR has been consistent with the original full
submission with regards to resources allocation, project management and project programme.
These consistencies demonstrate the level of detail of the original submission, robust project
management currently in place and set a solid foundation for the future delivery.
VISOR Project Progress Report June 2015
21
4 Risk Management (Confidential) In the case of VISOR, the complicated technical nature and multiple interfaces between TO/SO,
project partners and suppliers presents the most significant challenges. The VISOR Project Delivery
Team has taken a proactive approach of reviewing the risk register regularly (during the monthly
PDT meeting), allocating clear ownership of each risk, and putting in place appropriate mitigation
measures. In addition, there is a mechanism within the project management team to highlight and
act on any new risks in a timely and efficient manner in monthly PDT meetings.
For project delivery, the involvement and corresponding interfaces between each project partner
and suppliers are critical to the success of the project. Dedicated project managers have been
appointed within each organisation to coordinate the project delivery resources and identify risks.
Identified risks should take into account the interfaces and governance within each organisation. The
following details the key risks identified and addressed in the past six months.
4.1 Project Management Risks
4.1.1 Key Project Management Risk
The most significant project management risk during this reporting period was commitment,
coordination and communication with SHETL. This risk is still apparent and can be referenced in
every stage of the development over the past eighteen months: the latest evidence is the
installation of servers and outstation devices. SHE Transmission are planning to install WMUs and
WAMs in June 2015, approximately 6 months behind NG TO and SO and SSE’s infrastructure
requirements, physical location and data sources have been agreed. This poses a huge risk on the
outcome of all other work packages – a lack of data will significantly affect the potential benefits of
algorithms/applications]. Such an imbalance of delivery pace poses a direct risk of meeting two
specific elements of SDRC 9.5, Successful deployment of the supporting infrastructure of the VISOR
project:
System commissioning report (WP 4A, Dec 2015)
Visualisation of data in SPT, NGET, SHE Transmission including
real-time and historic (WP 4A, Dec 2015)
Pro-active engagement activities have been undertaken with SSE, including a dedicated visit to the
organisation, and NGET and SPT have provided additional support to SHETL through teleconferences
dedicated to address issues with WAMS installations. NGET and SPT continue to extend support to
SSE and ready to assist SSE throughout the installation process.
A summary of the other project management risks affecting the project during the reporting period,
and beyond, are tabulated in Table 3.

VISOR Project Progress Report June 2015
22
Table 3. Project Management risks to the project during the reporting period
Risk Description Mitigation Action
Coordination of project partners to the project programme: SHETL’s progress in installation and commissioning two PMU and one WAMS within their network poses direct risks to two elements of SDRC 9.5. Delay incurred in gathering and analysing WMU data also affects the quality of system analysis carried out in VISOR.
Continual support and assistance shared amongst project partners to ensure project programme remains sound.
Identification of risks to project programme highlighted at weekly PDT meetings, or sooner.
Integration of innovation into business as usual activities: Uncertainty surrounding the true benefits of phasor information will hinder the roll-out into BaU
Benefits of phasor meansurements must be thoroughly assessed and reported upon.
Internal knowledge dissemination throughout vital to ensure benefits of project are widely known
Ongoing prioritisation for system access to install monitors and modify existing PMUs: Installation and modification of hardware in transmission substations typically require an outage, and therefore need significant advanced planning to ensure delays are kept to a minimum.
Sites works are arranged to piggy-back on ongoing schemes to manage system access restrictions.
Establishing communication links between Datacenters in Scotland and England: The following risks were identified in order to deliver necessary communication between SPT and NGET caused delays to project programme
Lead time and complexity in provisioning communication links with multiple vendors causing delay to the overall schedules of the project
Lack of coordination between IT departments between TOs to design and deliver communication infrastructure
Coordination of service providers in commissioning network links due to contractual constraints causing delays of installation of the MPLS between data hub and SPEN Datacenter
Closer coordination between project partners to ensure IT departments are engaged ahead of schedule to minimise possibility of future delays
Skilled resource availability: Restrictions on developer and test resources at Psymetrix for software application development
Key functional requirements will be developed first to meet OFGEM SDRCs.
Addition of new Alstom developer resources from outside of Edinburgh office.
Use of Edinburgh Power systems team staff to assist with testing.

VISOR Project Progress Report June 2015
23
As GUI implementation is very resource intensive, new applications could be demonstrated earlier via an off-line tool run in Matlab.
Delayed acquisition of measurement data affecting report deliverables: Delays in receiving historical phasor data from project partners may lead to delay in production of reporting analysis.
Ongoing dialog with project partner IT personnel to streamline data transfer process.
4.2 Technical Risks The following technical risks were encountered during commissioning and system analysis for
project VISOR from December’14 to June’15
4.2.1 Key Technical and Roll-Out Risks
The reliability and quality of the data transfer between the measurement units and the WAMS
applications is currently the key technical risk. Throughout the reporting period, successful
advancements have been made to improve the quality of the data transfer and the learning from
which will be used to support the successful deliver and commissioning of future WAMS
infrastructure across the three measurement regions.
A summary of the other technical risks affecting the project during the reporting period, and beyond,
are tabulated in Table 4.
Table 4. Technical risks to the project during the reporting period
Risk Description Mitigation Action
Server performance with increased data volumes Performance impact of new applications (e.g. VLF, LF Source Location) on server load may be heavier than anticipated.
The performance of the servers need to be monitored on a continual basis as more WMUs are installed on the network
Data quality and availability affecting accuracy and development of applications VLF and LF Source Location, the data quality and availability issues observed so far will likely make detection of background oscillations difficult, however raised amplitude events will still be detectable.
The availability of higher quality data from new WMUs and a subset of the existing PMUs (if communications issues are resolved) will mitigate the effects of this.
Firmware upgrades to network and substation equipment which, on the basis of upgrades completed so far, appear to be significantly reducing data loss.
Configuration of data transfer and firewall Firewall configurations required to enable UDP data transmission from Substation to PDC proved
Closer coordination between project partners to ensure IT departments are engaged ahead of schedule to

VISOR Project Progress Report June 2015
24
to be challenging to obtain approval from business IT security department causing delay in receiving WMU data. NGET the on-going changes to business communications infrastructure required VISOR PDT to go through various approval procedures to integrate VISOR infrastructure with business
minimise possibility of future delays
Provision of necessary Service Provider : The IS needs and prioritisation of Smartgrid solutions like VISOR are still evolving in terms of service level agreements and flexibility within the incumbent service providers.
Closer working and involvement of the service providers to ensure they understand the requirements and purpose of these new applications.
Limitations laboratory access to PMU types (Hardware and Firmware): The University of Manchester does include a WMU and PMUs from a variety of manufacturers however, it does not have access to the two PMU types that are predominantly used in the VISOR WAMS.
PDT consider this to be a minor concern and will review on ongoing basis
Constraints on Size of Laboratory Test Signals: The size of the signal files that can be played back using the Omicron software (Advanced Transplay) is limited, and may limit the range of cases that can be used to test the devices in the laboratory, particularly when attempting to capture fast system dynamics.
PDT consider this to be a minor concern and will review on ongoing basis

VISOR Project Progress Report June 2015
25
5 Successful Delivery Reward Criteria (SDRC) The Successful Delivery Reward Criteria set out in the Project Direction links with the Project
Milestone and the identified targets directly. This SDRC can be used to check the progress of the
project delivery and position the progress against the original proposal. Error! Reference source not
ound. lists all the required evidences in line with VISOR project direction for reporting period Dec’14
– June’15.
Successful Delivery Reward criterion Evidence
9.1. Successful delivery of Sub-Synchrononous Oscillation (SSO) monitoring prior to start of Series Compensation commissioning. It is important that the project delivers an SSO monitoring capability in time to capture a baseline of the SSO frequency range performance before the series compensation is commissioned. The changes in behaviour can then be assessed against known historic behaviour. The components that should be delivered for success in this domain are:
Validation of SSO substation equipment
Installation, commissioning of SSO substation equipment & communication to central location
Integration to visualisation of SSO geographically
9.1.1
SSO Device qualification report (WP 4C, Dec 2014)
Visualisation of multiple SSO information sources at data centre (WP 1A, prior to the commissioning of series compensation reinforcement)
Baseline and comparator report for SSO
behaviour (WP 1, March 2015, March 2016, March 2017)
9.3 Successful model validation activity completion The definition of transient stability limits in particular is highly dependent on the quality of the static and dynamic equipment models, the design of control systems, and interpretation and resolution of problems occurring in the grid. It is essential therefore that the models and their associated parameters can be demonstrated to be sufficiently accurate to be fit for purpose. The components of the model validation activities will include:
Line parameter estimation for key circuits using PMU data
Oscillation analysis validation to quantify observed damping against simulated
Transient stability simulations to reconstruct observed disturbances
9.3.1
Report on PMU based line parameter estimation and variability (WP 2.1, March 2015)
Report on accuracy of simulation models for small-signal and large-signal against naturally occurring events (WP 2.2-2.3, Dec 2016)
Table 5. VISOR SDRC Update, Dec’15 June’15
VISOR Project Progress Report June 2015
26
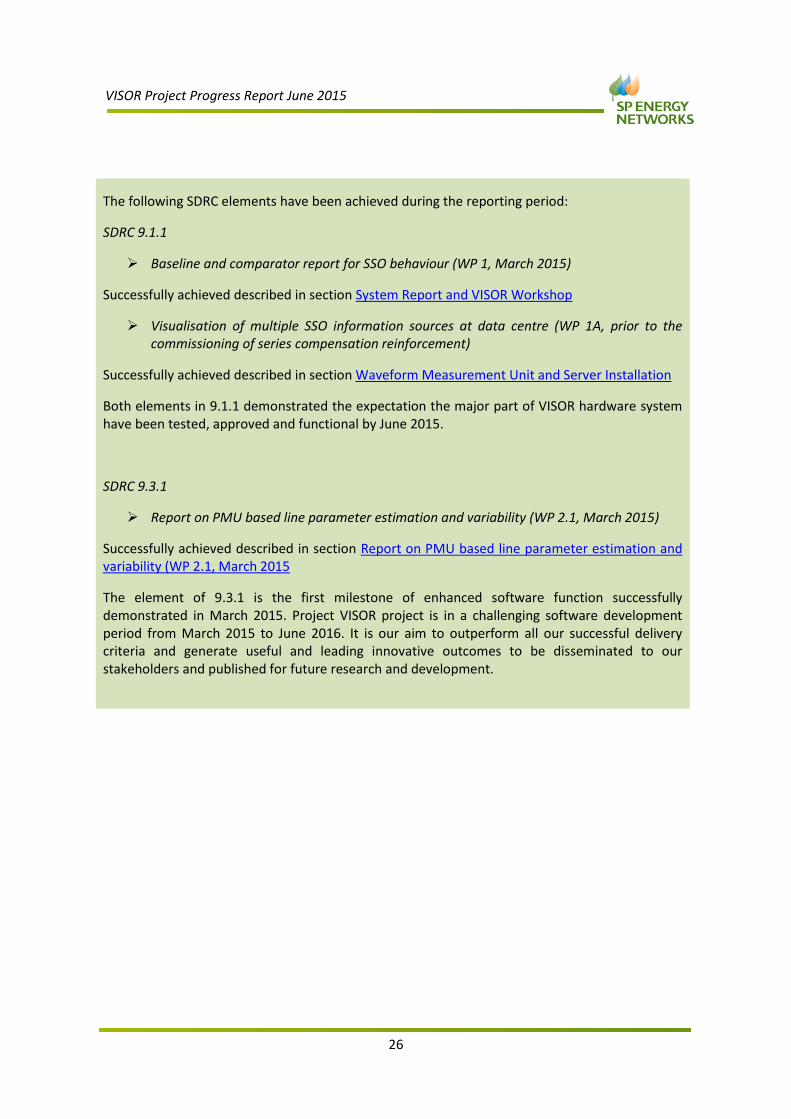
The following SDRC elements have been achieved during the reporting period:
SDRC 9.1.1
Baseline and comparator report for SSO behaviour (WP 1, March 2015)
Successfully achieved described in section System Report and VISOR Workshop
Visualisation of multiple SSO information sources at data centre (WP 1A, prior to the commissioning of series compensation reinforcement)
Successfully achieved described in section Waveform Measurement Unit and Server Installation
Both elements in 9.1.1 demonstrated the expectation the major part of VISOR hardware system have been tested, approved and functional by June 2015.
SDRC 9.3.1
Report on PMU based line parameter estimation and variability (WP 2.1, March 2015)
Successfully achieved described in section Report on PMU based line parameter estimation and variability (WP 2.1, March 2015
The element of 9.3.1 is the first milestone of enhanced software function successfully demonstrated in March 2015. Project VISOR project is in a challenging software development period from March 2015 to June 2016. It is our aim to outperform all our successful delivery criteria and generate useful and leading innovative outcomes to be disseminated to our stakeholders and published for future research and development.
VISOR Project Progress Report June 2015
27
6 Learning Outcomes Following the Authority formal approval in December 2013, VISOR made good progresses regarding
project partner collaboration agreement, project management and governance establishment,
procurement and knowledge sharing. There are challenges and risks (as detailed in the section above
and the Risk Register in Appendix 2) along the development, and lessons are derived from every
aspect.
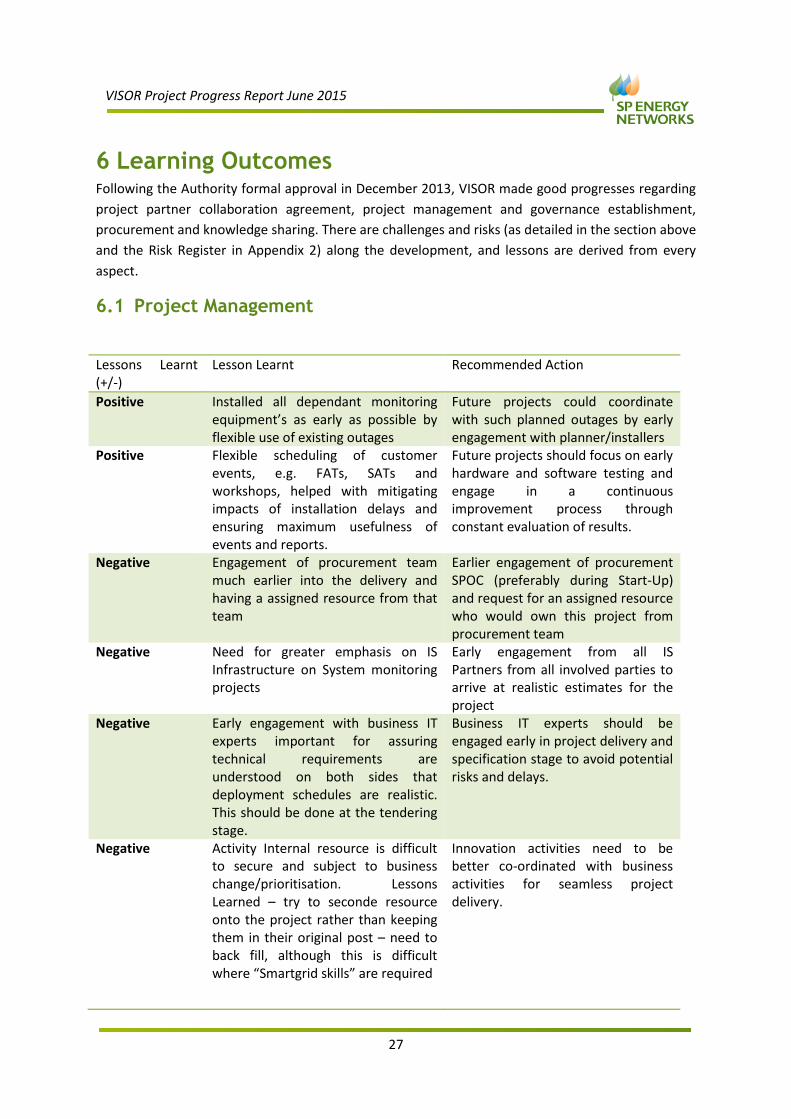
6.1 Project Management
Lessons Learnt (+/-)
Lesson Learnt Recommended Action
Positive Installed all dependant monitoring equipment’s as early as possible by flexible use of existing outages
Future projects could coordinate with such planned outages by early engagement with planner/installers
Positive Flexible scheduling of customer events, e.g. FATs, SATs and workshops, helped with mitigating impacts of installation delays and ensuring maximum usefulness of events and reports.
Future projects should focus on early hardware and software testing and engage in a continuous improvement process through constant evaluation of results.
Negative Engagement of procurement team much earlier into the delivery and having a assigned resource from that team
Earlier engagement of procurement SPOC (preferably during Start-Up) and request for an assigned resource who would own this project from procurement team
Negative Need for greater emphasis on IS Infrastructure on System monitoring projects
Early engagement from all IS Partners from all involved parties to arrive at realistic estimates for the project
Negative Early engagement with business IT experts important for assuring technical requirements are understood on both sides that deployment schedules are realistic. This should be done at the tendering stage.
Business IT experts should be engaged early in project delivery and specification stage to avoid potential risks and delays.
Negative Activity Internal resource is difficult to secure and subject to business change/prioritisation. Lessons Learned – try to seconde resource onto the project rather than keeping them in their original post – need to back fill, although this is difficult where “Smartgrid skills” are required
Innovation activities need to be better co-ordinated with business activities for seamless project delivery.

VISOR Project Progress Report June 2015
28
6.2 Technical Learning
6.2.1 System Commissioning Learning
The ambitious engineering target set in VISOR requires innovative and coordinated approach. From
the hardware development perspective, the initial tendering procedure during the proposal stage
(back in 2013 and Feb 2014) introduced the topic to the market. The project team was informed the
potential suppliers and identified the data acquisition frequency range. Detailed functional
specifications were included in the contract.
The specifications post contract award has been governed by a robust technical review procedure.
By the end of 2014, the following specifications to enable the detection of SSO have been approved:
Enhancement Specification: 200Hz IEEE C37.118 stream processing
Application Specification: Sub-Synchronous Oscillations
Communication infrastructure between outstation device and the local data hub (within each TO)
and between the TOs (including GBSO) is the key enabler of the VISOR demonstration. The Wide
Area Network for the communication between the SPT Hub, the SHE Hub and the VISOR Data Hub
will be supported by National Grid through its share of the NIC funding.
In order to support the data transfer rate between the SPT, and SHE T WAMS and the NG WAMS
Data Hub, there will be a 2Mbps non redundant MPLS link between NG and each of the Scottish TOs.
This should provide the bandwidth required to support the needs of the project.
An IPSec tunnel over the internet was initially considered, but it has been concluded that this would
not be reliable enough or support sufficient bandwidth to guarantee reliable data transfer. OPTEL
services have also been considered for this project, but don’t currently support connections.
Therefore the project intends to use Verizon as the WAN supplier between Wokingham and
Kirkintilloch, and Inveralmond House.
6.2.2 WAMS Based Alarming on the Proximity of Electrical and Torsional Modes
The University of Manchester has been using model based studies to perform research into the
development of WAMS based tools for assessing the likelihood of a system being exposed to
dangerous subsynchronous interactions (e.g. SSR). During this research it has been found that some
of the traditional measures used to determine if there is a risk of these dangerous interactions
occurring are unsuitable for use as part of a WAMS based strategy for assessing the threat posed by
subsynchronous interactions. This is primarily due to the contrast between the requirements of a
WAMS based strategy and the planning/design based solutions traditionally used to mitigate
subsynchronous interactions. For example, when assessing the potential threat of SSR (interaction
between an electrical RLC mode complement and a torsional mode) when deploying series
compensation in a power system, the literature states that if frequency scan results indicate a
reactance dip (an indicator of an electrical RLC mode) within +/- 3 Hz of a known torsional mode
further studies should be performed. This approach, whilst well suited to guiding the necessary

VISOR Project Progress Report June 2015
29
planning studies is far too conservative to apply as part of a WAMS based solution, e.g. it has been
observed to result in an electrical RLC mode being classed as interacting with multiple torsional
modes simultaneously. EMTP simulations include models of the entire non-linear system, so do not
make the same assumptions as the simplified tools used to guide planning studies. As such, they can
be used to precisely define bands around a torsional mode in which electrical mode complements
would pose a threat and based on this create WAMS based alarms. However, the increased
computational requirements mean that it is not possible to run EMTP simulations for large systems
so new solutions must be explored.
Furthermore, it has been identified that the susceptibility of Subsynchronous interactions for any
generator with series capacitors, apart from being dependant on the electrical and mechanical mode
proximity, is also a function of the negative damping of the electrical system for a given torsional
mode. This is important as for any exchange of energy between the mechanical and electrical system
to be sustained the damping of the torsional modes need to be poor, this damping is usually found
by comparing the mechanical and electrical damping of any given mode. Mechanical damping is
usually provided by the generator manufacture and this is usually provided in the form of mode
damping. However, for SSR studies both mechanical mode damping and electrical mode damping
are required. Therefore, the modal inertias and frequencies must be estimated for each torsional
mode to allow the corresponding electrical damping to be estimated. However, mechanical mode
damping and the modal frequencies are seldom known accurately, unless the machine is tested
directly. Most manufactures can provide only an estimate of the machine modal damping for each
subsynchronous mode and a close approximation of the modal frequencies. In the absence of direct
testing this uncertainty in the modal frequency can be accommodated by calculating the negative
damping for a frequency range around the estimated modal frequency.
6.2.3 Limitations of Existing Software Tools for Sub-Synchronous Oscillation
Studies
The predominant analytical techniques reported in the literature for the study of SSR are Frequency
scan, Eigenvalue analysis and EMTP simulations. DIgSILENT PowerFactory has shown limitations in
both Frequency Scan and Modal analysis. Modal analysis results for a given scenario have been
observed to differ grossly from the EMTP simulation results, such that the applicability of the Modal
analysis application within DIgSILENT PowerFactory has deemed unsuitable for the SSR studies
performed within VISOR and for the estimation of mode damping. To overcome this modal analysis
could be performed by using EMTP simulation to initialize the system model and then perform the
necessary eigen analysis in Matlab. However, the computational requirements of this process will
mean that it will prove to be unsuitable for the study of systems with more than approximately 10 to
20 buses.
6.2.4 Necessity for Base Lining PMU performance
When performing the initial laboratory testing, it became increasingly apparent that the response of
each PMU was highly specific and the lessons learned for one PMU could not be readily transferred
to another, despite the existence of standards on the measurement performance of PMUs.
Therefore, in the absence of proper base lining of the devices for constructed signals, any trends
VISOR Project Progress Report June 2015
30
perceived or conclusions drawn based on complex, dynamic (oscillatory) test signals from the VISOR
WAMS could be misleading. Consequently, tests corresponding to the ‘Dynamic compliance
standards’ as provided by IEEE C37.118.1a-2014 and further tests tailored to the needs of
monitoring power system oscillations would help baseline each devices performance against small
signals which would help improve the generalization of device performances/capabilities. These
tests will be undertaken before further device performance evaluations and will form part of an
attempt to characterise the response of each PMU in terms of the filtering applied. For example, the
PMUs in the laboratory that are P-class should be better at detecting the oscillations or transients
than their M-class counterparts; however, the filters used may distort the subsynchronous
waveform and require post-processing to identify the true oscillatory modes within the signal.
Therefore, it has become clear that when deploying any WAMS applications it is important to
understand the PMU performance it will require, the extent to which the PMUs in the system can
provide this and if any compensation of the PMU data will be required.
6.2.5 Hybrid State Estimation
The Hybrid State Estimation (HSE) work package within VISOR was intended to study the benefits of
combining phasor data (a direct measurement of the state of the monitored bus, voltage magnitude
and phase) and existing SCADA data (Voltage magnitudes and power injections/flows) to form a
hybrid state estimator that can improve the accuracy of the state estimate, the speed that the
iterative estimator converges a solution and the stability/reliability of this convergence. After
conversations within the project delivery team it was decided that using a hybrid state estimator to
improve the stability of convergence would offer the most benefit, as it would reduce the likelihood
of no state estimate being available to the system operator. Therefore, the study of HSE will be
limited to integrated HSEs (which combine the phasor and SCADA data into a single calculation). The
other forms of HSE proposed in the literature were deemed unsuitable either because they could
not improve the stability of convergence or because they had requirements that were not consistent
with the goal of the VISOR project to demonstrate WAMS applications that can be of benefit to the
GB system today.
Furthermore, whilst disseminating knowledge from the VISOR project at an international
conference, conversations with researchers, outside of the VISOR project, revealed that
opportunities exist to use phasor measurements to improve the performance of state estimation
without replacing the existing state estimator with a hybrid state estimator. The study of this use of
phasor data for pre-processing is now being considered by the researchers delivering the Hybrid
State Estimation work package, as it may offer opportunities for WAMS to play a role in improving
the performance of state estimation in the near term.
6.2.6 Potential Synergy with the NIC Funded EFCC project
The NIC funded EFCC project will address the use of WAMS based, closed loop control to deliver fast,
coordinated frequency control from various new service providers (e.g. battery storage), or smart
frequency control, to overcome the challenges posed by the anticipated reduction and variability in
system inertia. Researchers from The University of Manchester are involved in both VISOR and EFCC
and it is important that the lessons learned are shared between projects to help maximise the

VISOR Project Progress Report June 2015
31
benefit offered by these projects. For example, EFCC will consider the WAMS requirements for wide
area, closed loop control and the knowledge generated within that work could help inform the
WAMS testing (end to end and device testing) performed within VISOR or the roll out
recommendations made in the VISOR close down report.

VISOR Project Progress Report June 2015
32
7 Business Case Update We are not aware of any developments that have taken place since the issue of the Project Direction
that affect the business case for the Project.
VISOR Project Progress Report June 2015
33
8 Bank Account In line with Section 8 of the NIC Governance Document, a dedicated bank account was made
available by SPTL to act as the Project Bank Account. Upon receipt of Funding Direction from the
Authority, NGET (as the GBSO) will make equal monthly transfers, for the entirety of the Regulatory
Year commencing 1 April 2014 such that the total amount transferred over the Regulatory Year
commencing 1 April 2014 equals the net amount set out in Table 2 in the Funding Direction. The
enclosed bank statement confirms the compliance with this requirement.
It can be confirmed that the expenditure of each organisation is in line with the original plan.
The official bank statement can be seen at: Appendix 3

VISOR Project Progress Report June 2015
34

VISOR Project Progress Report June 2015
35
9 Intellectual Property Rights (IPR) Confidential Knowledge transfer is one of the key aims of the NIC. The benefits of a project are maximised by the
ability of other Network Licensees to learn from the project. In recognition of this, VISOR complies
with the Ofgem default position regarding the IPR ownership. It is also part of the strategy (and
made clear in the supplier’s agreement) that the supplier can only own the IPR which they
independently create.

VISOR Project Progress Report June 2015
36
10 Other N/A

VISOR Project Progress Report June 2015
37
11 Accuracy Assurance Statement I therefore confirm that processes in place and steps taken to prepare the PPR are sufficiently robust
and that the information provided is accurate and complete.
Signature: __________________
Name (Print): __________________
Title: __________________
Date: __________________
Signature: __________________
Name (Print): __________________
Title: __________________
Date: __________________

VISOR Project Progress Report June 2015
38
12 Appendices
12.1 Appendix 1 VISOR SharePoint link and description

VISOR Project Progress Report June 2015
39
12.2 Appendix 2 Project Risk Register (Confidential)

VISOR Project Progress Report June 2015
40
12.3 Appendix 3 Bank Account Statement (Confidential)
In line with the funding direction, a dedicated bank account was set to receive Ofgem NIC funding, as well as the financial contribution from SPT as the
funding licensee. NGET, in its capacity as GBSO, is to credit the funding on monthly basis until April, 2015 according to NIC funding direction.
The following bank statement demonstrated the funding received by 5th May 2015.