Embed Size (px)
Citation preview
TICS-1215; No. of Pages 10
Visual working memory capacity:from psychophysics and neurobiologyto individual differencesSteven J. Luck1 and Edward K. Vogel2
1 Center for Mind and Brain and Department of Psychology, University of California, Davis, 267 Cousteau Place, Davis, CA 95618, USA2 Department of Psychology, University of Oregon, Straub Hall, Eugene, OR 97403, USA
Review
Glossary
Cell assembly: set of neurons that together represent a single item (e.g., a set
of red-selective neurons and a set of vertical-selective neurons that together
represent a red vertical bar).
Complex span tasks: tasks that assess working memory capacity by requiring
subjects to switch back and forth between a memory encoding task and a
processing task. In the operation span task, for example, subjects see a simple
mathematics problem followed by a word that is to be stored in memory. In
each trial, a sequence of these pairs is presented and subjects are asked to
recall the words at the end of the trial. Memory span is quantified in terms of
the number of words that can be recalled at the end of the trial.
Contralateral delay activity: sustained ERP response during the delay period of
a visual working memory task that is observed over the hemisphere
contralateral to the items being maintained in memory.
Event-related potential: ERPs are specific event-related brain responses that
are embedded within the electroencephalogram (EEG). They arise from the
summed postsynaptic potentials of many thousands of neurons and are
conducted through the brain and skull to the scalp, where they can be recorded
noninvasively via surface electrodes.
Functional magnetic resonance imaging: this technique takes advantage of the
different magnetic properties of oxygenated and deoxygenated hemoglobin to
localize changes in blood flow that are triggered by changes in neural activity.
K: number of items stored in working memory on a given trial type.
Kmax: maximum number of items that a given individual can store in working
memory. This is a measure of working memory capacity.
Pmem: probability that a given item is present in memory at the time of a test.
Set size: number of items in an array.
Single-unit recordings: recordings of the action potentials of individual
neurons via the tip of an electrode placed just outside the cell body of a neuron.
Visual working memory capacity is of great interestbecause it is strongly correlated with overall cognitiveability, can be understood at the level of neural circuits,and is easily measured. Recent studies have shown thatcapacity influences tasks ranging from saccade targetingto analogical reasoning. A debate has arisen over wheth-er capacity is constrained by a limited number of discreterepresentations or by an infinitely divisible resource, butthe empirical evidence and neural network models cur-rently favor a discrete item limit. Capacity differsmarkedly across individuals and groups, and recent re-search indicates that some of these differences reflecttrue differences in storage capacity whereas others re-flect variations in the ability to use memory capacityefficiently.
The rise of visual working memoryFor many decades, the concept of working memory capaci-ty has played a central role in large-scale theories ofcognition [1,2] and in explaining individual differencesin cognitive ability [3]. Originally, research on workingmemory was dominated by verbal paradigms, such as digitspan tasks, which require participants to repeat back aseries of digits, and complex span tasks, in which partici-pants must alternate between two tasks that requireprocessing of information and storing of items in memory[4]. However, the past 15-year period has seen an explo-sion of research on visual working memory (VWM, asdefined in Box 1; see Glossary).
In this article, we review some of the key findings of thisresearch, focusing on the cognitive and neural mechanismsof VWM capacity and on individual and group differencesin VWM capacity. We begin by asking why vision needs aworking memory system. We then discuss whether capaci-ty is constrained by a limit on the number of discrete itemsthat can be represented or by a limit on a resource that canbe divided among large numbers of items. We then discusshow and why capacity varies among individuals and be-tween groups. Finally, we discuss the neural mechanismsthat may determine VWM capacity. Our overall perspec-tive is that limits on VWM capacity reflect the broader
1364-6613/$ – see front matter
� 2013 Elsevier Ltd. All rights reserved. http://dx.doi.org/10.1016/j.tics.2013.06.006
Corresponding author: Luck, S.J. ([email protected]).
problem of maintaining multiple active representations innetworks of interconnected neurons. This problem can besolved by maintaining a limited number of discrete repre-sentations, which then impacts almost every aspect ofcognitive function.
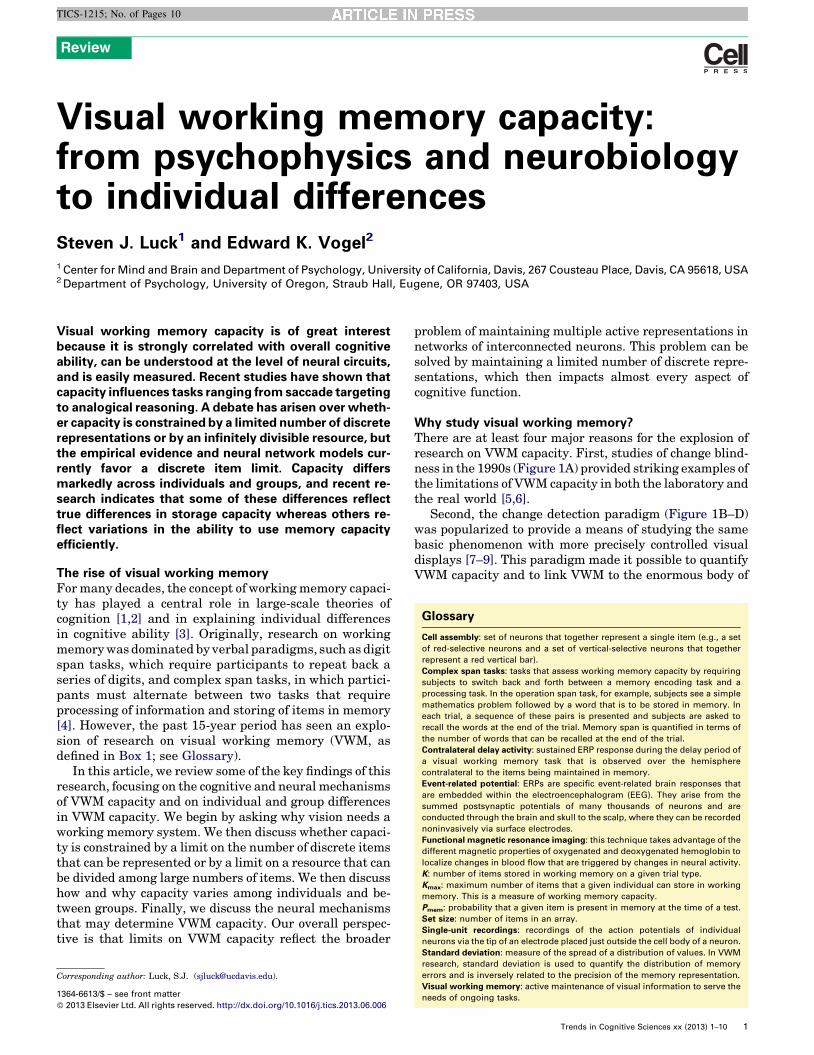
Why study visual working memory?There are at least four major reasons for the explosion ofresearch on VWM capacity. First, studies of change blind-ness in the 1990s (Figure 1A) provided striking examples ofthe limitations of VWM capacity in both the laboratory andthe real world [5,6].
Second, the change detection paradigm (Figure 1B–D)was popularized to provide a means of studying the samebasic phenomenon with more precisely controlled visualdisplays [7–9]. This paradigm made it possible to quantifyVWM capacity and to link VWM to the enormous body of
Standard deviation: measure of the spread of a distribution of values. In VWM
research, standard deviation is used to quantify the distribution of memory
errors and is inversely related to the precision of the memory representation.
Visual working memory: active maintenance of visual information to serve the
needs of ongoing tasks.
Trends in Cognitive Sciences xx (2013) 1–10 1
Box 1. What is visual working memory?
The term working memory is used in many different ways and it is
therefore important for researchers to define exactly what they
mean when they use this term. In this article, we define VWM as the
active maintenance of visual information to serve the needs of
ongoing tasks. We are not suggesting that this is the only valid
definition of VWM. Instead, this definition is intended to provide a
clear statement of the scope of the memory system that we address
in this review. We also believe that it reflects the typical usage of the
term by researchers who come from a vision science perspective.
Our definition has three key components. First, to qualify as VWM,
it is not sufficient that the information was acquired through the
visual modality; the representation of the information must be
visual in nature. If the observer stores a verbal or amodal conceptual
representation of the sensory input, we no longer consider it to be a
visual memory. Second, VWM is based on active maintenance. That
is, a VWM representation is maintained by a change in sustained,
energy-requiring neural activity rather than by a change in synaptic
strength (which can be verified with physiological recordings). This
distinguishes VWM representations from passively stored, longer-
term memories. Third, the representations must be used in the
service of broader cognitive tasks. This is the ‘‘workin’’ part of VWM.
Review Trends in Cognitive Sciences xxx xxxx, Vol. xxx, No. x
TICS-1215; No. of Pages 10
research on vision [10]. Moreover, this task is so simplethat even pigeons can do it [11].
Third, estimates of VWM capacity have excellent psycho-metric properties when optimal methods are used [12,13].For example, a 10-min change localization task yielded test–retest reliability of 0.77 for testing episodes separated by 1.5years [13]. In addition, VWM capacity is highly correlatedwith measures of broad cognitive function, accounting for
Set size (N)
Item
s in
mem
ory
(K)
0 4 8 120
1
2
3
4
5100
75
50
%Correct %Correct
K K
Set size (N)
% C
orre
ct
% C
orre
ct
0 4 8
100
75
50
(A)
(C) (D)
Version 1240 ms
Blank80 ms
Version 2240 ms
Bla80 m
Figure 1. (A) Example of a change blindness task. Many cycles are required before an
permission of Oxford University Press, USA. (B) Example of a change detection task [8]. A
is either identical to the sample array or differs in one feature of one of the objects, a
variant, a change is always present and the subject indicates which item has changed [47
assuming a slot model. Accuracy (% correct) is perfect when the set size (N) is less than K
the changed item will be present in memory for N/Kmax trials, and subjects will fail to d
decrease systematically as N increases above Kmax. By taking into account guessing, i
memory (K) for each set size [80–83]. (D) Data from an actual experiment with college
(Kmax) measured in a 10-min change localization task and a measure of broad cognitive
both schizophrenia patients and matched controls [13]. The correlations were similar i
2
43% of individual differences in a global fluid intelligence[14] and 46% of individual differences in overall perfor-mance on a broad battery of cognitive tasks (Figure 1E)[13]. These high correlations are particularly striking giventhat the change detection paradigm provides a relativelysimple measure of VWM capacity, with little or no impact oflong-term memory when canonical task parameters areused. Specifically, there is little or no effect of proactiveinterference [15] (but see [16,17]) or medial temporal lobelesions [18] (but see [19]) with canonical parameters.
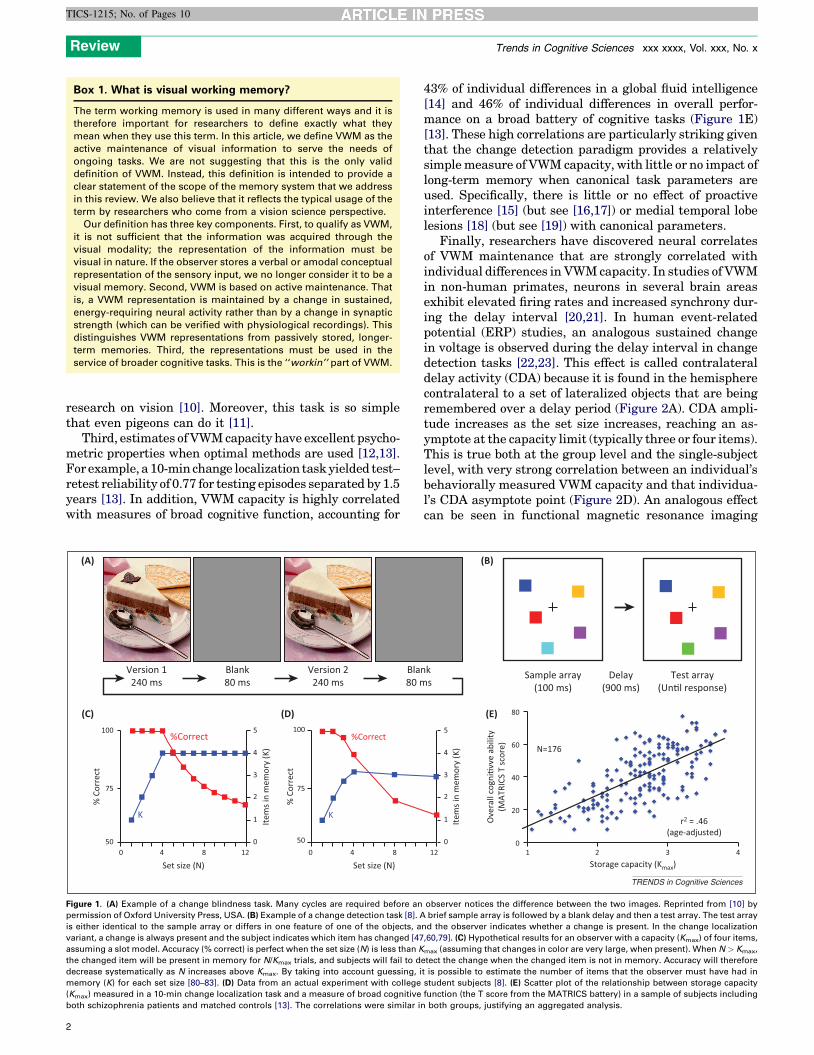
Finally, researchers have discovered neural correlatesof VWM maintenance that are strongly correlated withindividual differences in VWM capacity. In studies of VWMin non-human primates, neurons in several brain areasexhibit elevated firing rates and increased synchrony dur-ing the delay interval [20,21]. In human event-relatedpotential (ERP) studies, an analogous sustained changein voltage is observed during the delay interval in changedetection tasks [22,23]. This effect is called contralateraldelay activity (CDA) because it is found in the hemispherecontralateral to a set of lateralized objects that are beingremembered over a delay period (Figure 2A). CDA ampli-tude increases as the set size increases, reaching an as-ymptote at the capacity limit (typically three or four items).This is true both at the group level and the single-subjectlevel, with very strong correlation between an individual’sbehaviorally measured VWM capacity and that individua-l’s CDA asymptote point (Figure 2D). An analogous effectcan be seen in functional magnetic resonance imaging
Sample array(100 ms)
Delay(900 ms)
Test array(Un�l response)
Ove
rall
cogn
i�vv
e ab
ility
(MAT
RICS
T sc
ore)
Item
s in
mem
ory
(K)
12Storage capacity (Kmax)
0
1
2
3
4
5
(B)
nks
N=176
r2 = .46(age-adjusted)
0
20
40
60
80
1 2 3 4
(E)
TRENDS in Cognitive Sciences
observer notices the difference between the two images. Reprinted from [10] by
brief sample array is followed by a blank delay and then a test array. The test array
nd the observer indicates whether a change is present. In the change localization
,60,79]. (C) Hypothetical results for an observer with a capacity (Kmax) of four items,
max (assuming that changes in color are very large, when present). When N > Kmax,
etect the change when the changed item is not in memory. Accuracy will therefore
t is possible to estimate the number of items that the observer must have had in
student subjects [8]. (E) Scatter plot of the relationship between storage capacity
function (the T score from the MATRICS battery) in a sample of subjects including
n both groups, justifying an aggregated analysis.
10
0
+3
-200ms
-3
500 1000
ContralateralKey:
Ipsilateral
-0.25
-0.5
-0.75
-1
-0.5
-1
-1.5
-2
-2.5
-3
2 3 41 2 3 4
6 8 10Memory array size
200 ms 100 ms 900 ms 2000 ms
300-400 msSOA
Memoryarray
Reten�oninterval
Testarray
Meancapacity
Increasefrom2 to 4items
Memory capacity
(C) (D)
(A) (B)
Mea
n am
plitu
de (i
n m
icro
volts
)
TRENDS in Cognitive Sciences
Figure 2. (A) Event-related potential (ERP) paradigm for recording contralateral delay activity (CDA) [22]. Subjects are instructed to remember the colors of the items on the
side indicated by the arrow and report whether a color has changed on that side in the test array. (B) ERP waveforms from ipsilateral versus contralateral electrode sites
relative to the side of the array that was encoded into memory. Time zero is the onset of the test array, and the CDA is the difference in voltage between the ipsilateral and
contralateral waveforms during the delay period. Note the negative direction of the y-axis. (C) CDA amplitude as a function of the number of items on the side to be
remembered, averaged over subjects. Note that CDA amplitude reaches an asymptote near the average working memory capacity limit. (D) Scatter plot for individual
subjects, showing that individual differences in working memory capacity (Kmax) are correlated with differences in the CDA asymptote (quantified as the difference in CDA
amplitude between set sizes of N = 2 and N = 4).
Review Trends in Cognitive Sciences xxx xxxx, Vol. xxx, No. x
TICS-1215; No. of Pages 10
(fMRI) studies, where the signal in the intraparietal sulcus(IPS) during the delay period increases as the set sizeincreases, reaching an asymptote at the individual sub-ject’s VWM capacity [24,25].
The role of working memory in visionVisual information is typically acquired during short per-iods of fixation (usually 200–500 ms in duration) separatedby saccadic eye movements that temporarily suppressprocessing and then shift the retinal image. Some kindof memory is needed to bridge the temporal gaps andspatial shifts created by eye movements [26]. Seminalresearch by Irwin and colleagues [27,28] demonstratedthat iconic memory does not survive eye movements butthat VWM can be used to link the pre-saccade representa-tion of an object at one retinal location with the post-saccade representation of that object in a different retinallocation. More recent research has shown that the target ofan upcoming eye movement is automatically stored inVWM, and after the eye movement this VWM representa-tion is compared with the newly fixated object [29]. Inaddition, eye movements may be biased toward objectsthat match the current contents of VWM [30], and even thesimplest saccades are faster if the saccade target matchesthe current contents of VWM [31].
VWM also plays a key role in higher-level visual tasks,demonstrating that it is truly a working memory. Forexample, when the target for a visual search task is cuedin a trial-by-trial manner, the cue is stored in VWM,leading to a CDA in the interval between the cue andthe search array [32]. In this situation, search performanceis impaired if VWM is filled to capacity by a secondaryobject memory task [33]. However, after several trials ofsearching for the same target, the CDA disappears [32].Moreover, search performance is no longer impaired by aconcurrent VWM load when the target remains the sameon trial after trial [34]. These results indicate that the‘search template’ is transferred from VWM into a longer-term memory store when the target remains constant overseveral trials.
It is natural to assume that the sole purpose of workingmemory is to store items that are no longer present, butrecent research indicates that the same system is also usedto represent information that is currently visible. Forexample, both VWM capacity limits and neural indicesof VWM activation have been observed in tasks in whichthe items remain visible throughout the trial, such asvisual search [35,36] and multiple object tracking[37,38]. A recent study took this a step further and showedthat when observers were asked to remember the colors of
3
Review Trends in Cognitive Sciences xxx xxxx, Vol. xxx, No. x
TICS-1215; No. of Pages 10
items in a static array that remained visible for the entiretrial, their VWM capacity was indistinguishable fromtrials in which the items disappeared during a 1-s reten-tion period [39]. Moreover, the CDA was the same wheth-er or not the stimuli were visible during the retentionperiod, indicating that the same neural mechanisms areused to represent visual objects whether or not they arecurrently visible. Together, these findings suggest thatVWM may not really be a memory system per se, but mayinstead be a general-purpose visual representation sys-tem that can, when necessary, maintain information overshort delays.
The nature of VWM capacity limitations: slots versusresourcesWhen memory for simple, highly discriminable coloredsquares is tested, the typical college student has a capacityof only three to four objects’ worth of information [40].What is the nature of this limit? Object complexity plays aclear role: task performance is less accurate for complexobjects than for simple objects in most cases [41,42].
Res
Prob
abili
ty d
ensit
y
Sample array(100 ms)
Delay(900 ms)
Cue/response display(un�l response)
-180 -120 -6
0.005
0.000
0.010
0.015
0.020
Sample array(200 ms)
Delay(1000 ms)
Cue/response display(un�l response)
(A)
(B)
(E) (F)
(C)
Not inmemory
Con�nuous resource D
You see this Do you remember this?
1 2 3 10
12
14
16
18
20
SD
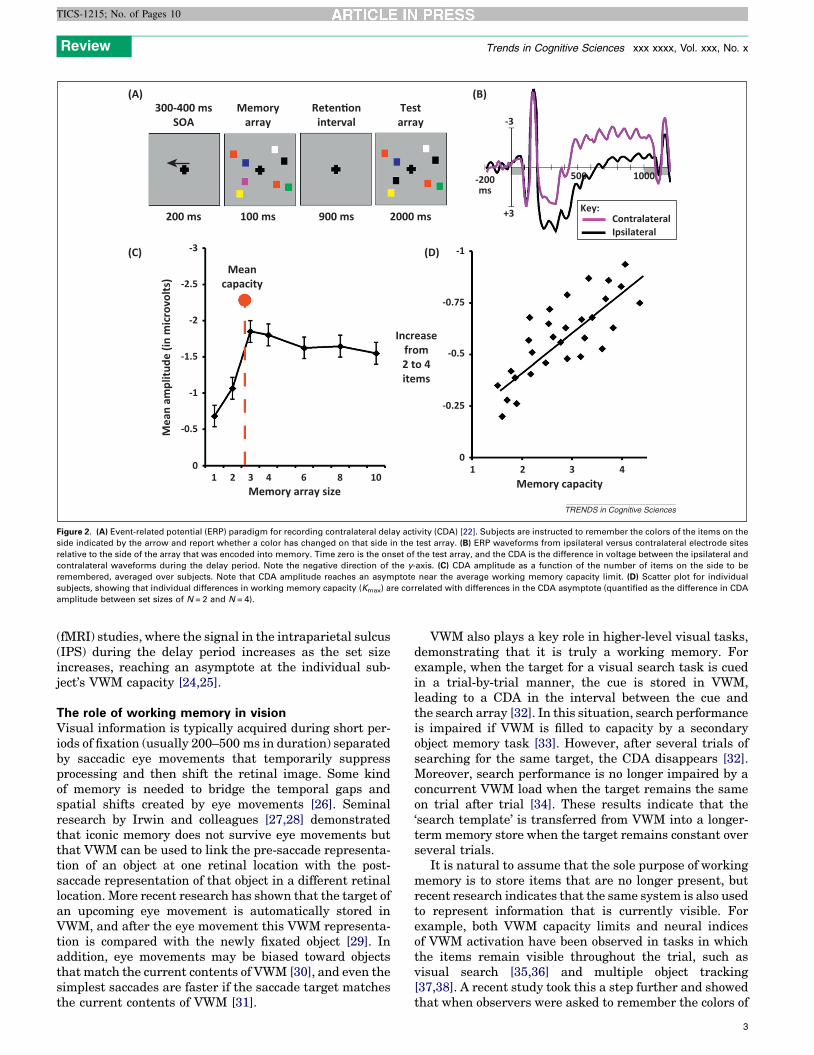
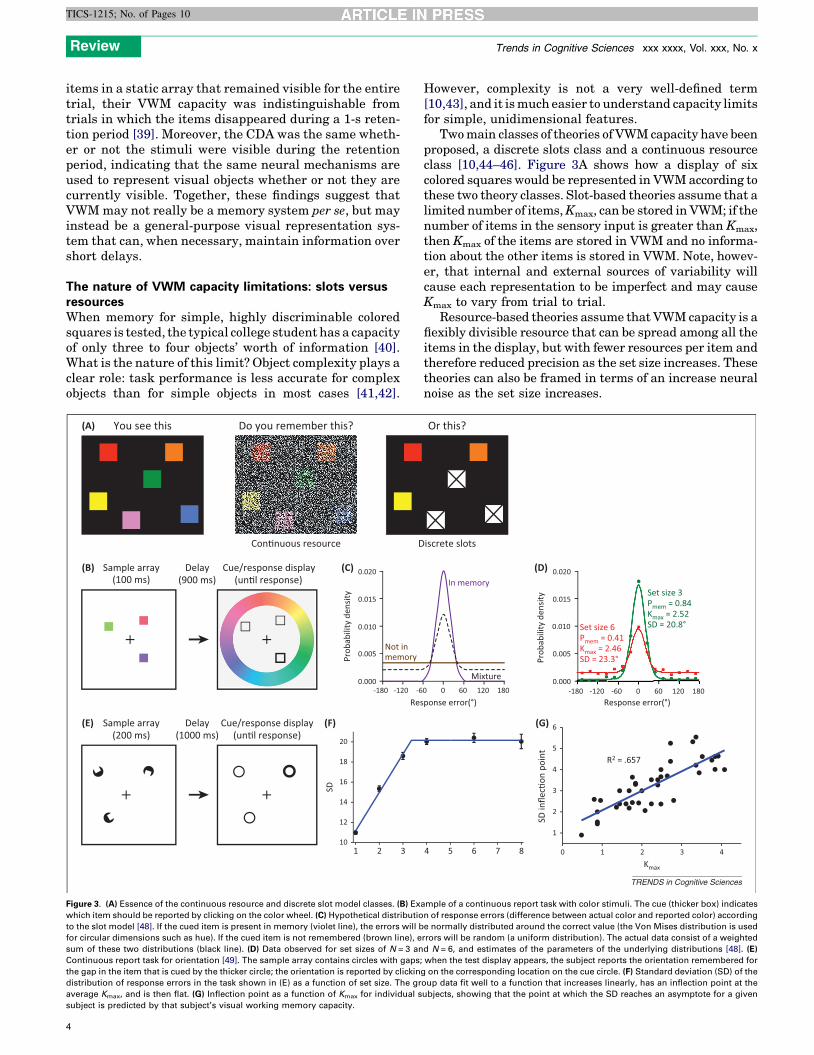
Figure 3. (A) Essence of the continuous resource and discrete slot model classes. (B) Ex
which item should be reported by clicking on the color wheel. (C) Hypothetical distributio
to the slot model [48]. If the cued item is present in memory (violet line), the errors will b
for circular dimensions such as hue). If the cued item is not remembered (brown line), e
sum of these two distributions (black line). (D) Data observed for set sizes of N = 3 an
Continuous report task for orientation [49]. The sample array contains circles with gaps;
the gap in the item that is cued by the thicker circle; the orientation is reported by clickin
distribution of response errors in the task shown in (E) as a function of set size. The gr
average Kmax, and is then flat. (G) Inflection point as a function of Kmax for individual s
subject is predicted by that subject’s visual working memory capacity.
4
However, complexity is not a very well-defined term[10,43], and it is much easier to understand capacity limitsfor simple, unidimensional features.
Two main classes of theories of VWM capacity have beenproposed, a discrete slots class and a continuous resourceclass [10,44–46]. Figure 3A shows how a display of sixcolored squares would be represented in VWM according tothese two theory classes. Slot-based theories assume that alimited number of items, Kmax, can be stored in VWM; if thenumber of items in the sensory input is greater than Kmax,then Kmax of the items are stored in VWM and no informa-tion about the other items is stored in VWM. Note, howev-er, that internal and external sources of variability willcause each representation to be imperfect and may causeKmax to vary from trial to trial.
Resource-based theories assume that VWM capacity is aflexibly divisible resource that can be spread among all theitems in the display, but with fewer resources per item andtherefore reduced precision as the set size increases. Thesetheories can also be framed in terms of an increase neuralnoise as the set size increases.
ponse error(°)0 0 60 120 180
Response error(°)
Prob
abili
ty d
ensit
y
-180 -120 -60 0
0.005
0.000
0.010
0.015
0.020
60 120 180
(G)
(D)In memory
Mixture
Set size 6Pmem = 0.41Kmax = 2.46SD = 23.3°
Set size 3Pmem = 0.84Kmax = 2.52SD = 20.8°
iscrete slots
Or this?
4 5 6 7 8 0 1 2 3 4
1
2
3
4
5
6
Kmax
R2 = .657
SD in
flec�
on p
oint
TRENDS in Cognitive Sciences
ample of a continuous report task with color stimuli. The cue (thicker box) indicates
n of response errors (difference between actual color and reported color) according
e normally distributed around the correct value (the Von Mises distribution is used
rrors will be random (a uniform distribution). The actual data consist of a weighted
d N = 6, and estimates of the parameters of the underlying distributions [48]. (E)
when the test display appears, the subject reports the orientation remembered for
g on the corresponding location on the cue circle. (F) Standard deviation (SD) of the
oup data fit well to a function that increases linearly, has an inflection point at the
ubjects, showing that the point at which the SD reaches an asymptote for a given
Review Trends in Cognitive Sciences xxx xxxx, Vol. xxx, No. x
TICS-1215; No. of Pages 10
Evidence of discrete slots from continuous report
experiments
The most obvious way to distinguish between these classesof theories is to determine whether VWM representationsbecome less precise as the set size increases, and this is mosteasily assessed with the continuous report paradigm shownin Figure 3B [47,48]. Each trial begins with a sample array,followed by a retention interval and then a test display. Thetest display includes a cue at one location, and the observerclicks on a color wheel to report the color remembered for thecued item. If the cued item is present in memory, the colorreported should be close to the actual color (i.e., the magni-tude of the error will be small), and the distribution of errormagnitudes over many trials would be expected to be ap-proximately normal (Figure 3C). The width of this distribu-tion (quantified as the standard deviation, SD) is inverselyrelated to the precision of the memory representation. Thesame method can be used for other feature dimensions, suchas orientation [49] (but see [50]) and shape [48].
When the set size exceeds the number of items that can bestored in VWM (Kmax), the cued item will not be present inmemory on a subset of trials. When this happens, theobserver will guess randomly, leading to a uniform distri-bution of errors (Figure 3C). Because the data from a set oftrials may contain a mixture of in-memory and out-of-mem-ory trials, the observed distribution of errors will consist of amixture of a normal distribution (from in-memory trials)and a uniform distribution (from out-of-memory trials). Thisis equivalent to a normal distribution that has been shiftedvertically by an amount that is related to the probability thatthe cued item was absent from memory. From the observedmixture, it is possible to derive two key VWM parameters:Pmem, the probability that the cued item was present inmemory; and SD, the width of the normal distribution. Thenumber of items being held in memory for a given set size (K)is simply Pmem � set size.
Figure 3D shows that increasing the set size from N = 3to N = 6 leads to a large vertical shift in the distribution ofresponses, with no substantial change in the width of thenormal portion of the distribution [48]. Thus, an increase inthe set size appears to decrease the probability that thecued item is present in memory (Pmem) without changingthe precision (SD) of the representation. These data areconsistent with discrete slot models and are incompatiblewith most resource-based models.
Although precision did not change significantly betweenset sizes of N = 3 and N = 6, precision did improve when theset size was reduced to less than three items. This is bestillustrated by a study in which subjects remembered orien-tation information rather than color information (Figure 3E)[49]. SD increased linearly as the set size increased up to apoint and then reached an asymptote (Figure 3F). Interest-ingly, the inflection point in this bilinear function wasclosely related to VWM capacity (Figure 3G). These resultssuggest that resources can be shared among items until amaximum number of items (Kmax) is reached [49,51].
Evidence of continuous resources
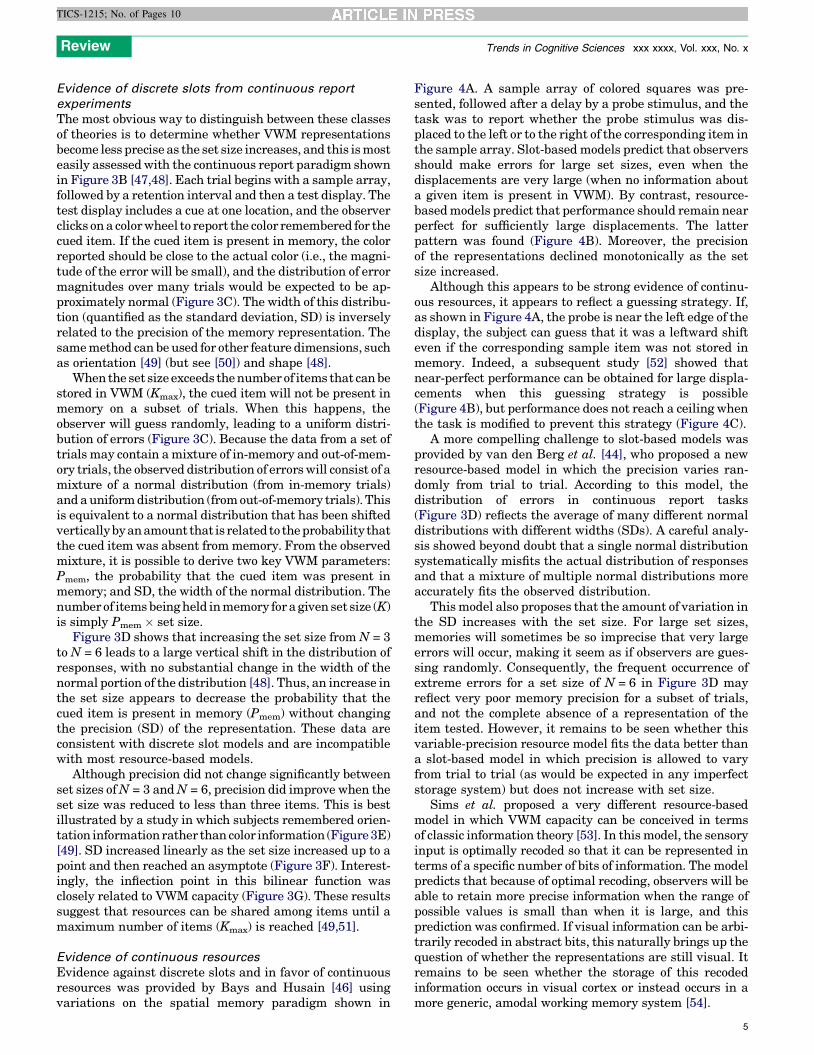
Evidence against discrete slots and in favor of continuousresources was provided by Bays and Husain [46] usingvariations on the spatial memory paradigm shown in
Figure 4A. A sample array of colored squares was pre-sented, followed after a delay by a probe stimulus, and thetask was to report whether the probe stimulus was dis-placed to the left or to the right of the corresponding item inthe sample array. Slot-based models predict that observersshould make errors for large set sizes, even when thedisplacements are very large (when no information abouta given item is present in VWM). By contrast, resource-based models predict that performance should remain nearperfect for sufficiently large displacements. The latterpattern was found (Figure 4B). Moreover, the precisionof the representations declined monotonically as the setsize increased.
Although this appears to be strong evidence of continu-ous resources, it appears to reflect a guessing strategy. If,as shown in Figure 4A, the probe is near the left edge of thedisplay, the subject can guess that it was a leftward shifteven if the corresponding sample item was not stored inmemory. Indeed, a subsequent study [52] showed thatnear-perfect performance can be obtained for large displa-cements when this guessing strategy is possible(Figure 4B), but performance does not reach a ceiling whenthe task is modified to prevent this strategy (Figure 4C).
A more compelling challenge to slot-based models wasprovided by van den Berg et al. [44], who proposed a newresource-based model in which the precision varies ran-domly from trial to trial. According to this model, thedistribution of errors in continuous report tasks(Figure 3D) reflects the average of many different normaldistributions with different widths (SDs). A careful analy-sis showed beyond doubt that a single normal distributionsystematically misfits the actual distribution of responsesand that a mixture of multiple normal distributions moreaccurately fits the observed distribution.
This model also proposes that the amount of variation inthe SD increases with the set size. For large set sizes,memories will sometimes be so imprecise that very largeerrors will occur, making it seem as if observers are gues-sing randomly. Consequently, the frequent occurrence ofextreme errors for a set size of N = 6 in Figure 3D mayreflect very poor memory precision for a subset of trials,and not the complete absence of a representation of theitem tested. However, it remains to be seen whether thisvariable-precision resource model fits the data better thana slot-based model in which precision is allowed to varyfrom trial to trial (as would be expected in any imperfectstorage system) but does not increase with set size.
Sims et al. proposed a very different resource-basedmodel in which VWM capacity can be conceived in termsof classic information theory [53]. In this model, the sensoryinput is optimally recoded so that it can be represented interms of a specific number of bits of information. The modelpredicts that because of optimal recoding, observers will beable to retain more precise information when the range ofpossible values is small than when it is large, and thisprediction was confirmed. If visual information can be arbi-trarily recoded in abstract bits, this naturally brings up thequestion of whether the representations are still visual. Itremains to be seen whether the storage of this recodedinformation occurs in visual cortex or instead occurs in amore generic, amodal working memory system [54].
5
Sample array(1000 ms)
Delay(500 ms)
Probe(250 ms)
Response
Le�wardor
rightwardshi�?
(A)
(B) (C)
0.0
0.2
0.4
0.6
0.8
1.0
0.0
0.2
0.4
0.6
0.8
1.0
Prob
abili
ty o
f rig
htw
ard
resp
onse 8−items
−10 −5 0 5 10Displacement in degrees
−10 −5 0 5 10Displacement in degrees
Prob
abili
ty o
f rig
htw
ard
resp
onse 8−items
TRENDS in Cognitive Sciences
Figure 4. (A) Spatial visual working memory (VWM) paradigm of Bays and Husain [46]. Observers report whether the probe is displaced leftward or rightward relative to the
corresponding sample item. (B) Results from a set size of N = 8 in a replication experiment [52]. The x-axis shows the displacement of the probe relative to the original item,
with negative values indicating leftward and positive values indicating rightward displacement. The y-axis shows the probability that the subject reports rightward
displacement. When the displacement was large, subjects were nearly perfect: they nearly always reported rightward displacement for a large rightward displacement and
almost never reported rightward displacement for a large leftward displacement. Bays and Husain argued that this nearly perfect memory for large displacements for a set
size of N = 8 is strong evidence against the slot model and in favor of the resource model, but later research showed that these results could be explained by a guessing
strategy [52]. (C) Results when the task was changed slightly to eliminate the guessing strategy. Observers were no longer nearly perfect for large displacements. Panels (B)
and (C) are reprinted from [52] with kind permission from Springer Science and Business Media.
Review Trends in Cognitive Sciences xxx xxxx, Vol. xxx, No. x
TICS-1215; No. of Pages 10
Another possibility is that VWM capacity limits are aby-product of competition between similar representations[55,56]. However, this would predict that capacity would belower when the items to be remembered are similar to eachother, which is inconsistent with the available evidence[41,57].
Additional evidence of discrete slots
Converging evidence from multiple experimental para-digms will be needed to distinguish between the broadclasses of slot-based and resource-based models. The datafrom set size manipulations such as those shown in Figures3 and 4 are not yet conclusive, but three additionalapproaches have provided evidence in favor of discreteslots.
First, Rouder et al. recorded confidence judgments fromobservers in a change detection task so that receiveroperating characteristic (ROC) curves could be constructed[45]. When large change magnitudes are used, the all-or-none storage posited by slot models should lead to a linearROC curve, whereas low-resolution memory representa-tions would lead to a bowed ROC curve. The ROC curvesobserved were close to linear, supporting the slot modelassumption of all-or-none memory encoding.
Second, Zhang and Luck combined the color wheelparadigm shown in Figure 3B with a spatial cuing manip-ulation [48]. The sample array contained two items alongwith a spatial cue, which could be valid, invalid, or neutral.
6
Resource-based models would predict that precision wouldbe very high on valid trials, intermediate on neutral trials,and very low on invalid trials (because the invalidly cuedobjects should have ‘just a few drops’ of resources). Slot-based models, however, predict that precision should bethe same on neutral and invalid trials(because it is notpossible to have ‘just a few drops’ of resources in thesemodels). Instead, the probability of having any represen-tation at all should decline for invalid trials. This is exactlywhat was found.
Third, a more recent study tested whether observerscould trade precision for capacity, increasing the number ofitems stored in VWM beyond the typical Kmax by decreas-ing the precision of the representations [58]. Observerswere never able to increase Kmax by reducing precision,even when given monetary incentives to do so. This isstrong evidence against the idea that resources can beallocated flexibly to increase the number of VWM repre-sentations.
Fourth, if observers devoted all of their resources to theitems in the display, regardless of whether one or 20 itemswere present, then it is difficult to explain why ERP andfMRI measures of VWM delay activity increase as the setsize increases from one up to the individual observer’s Kmax
and then reach an asymptote [22,24]. Resource modelswould instead predict that delay period activity shouldbe constant as long as observers are devoting all theirresources to the task.
Review Trends in Cognitive Sciences xxx xxxx, Vol. xxx, No. x
TICS-1215; No. of Pages 10
Multiple sources of evidence therefore support the ideaof discrete slots. However, state-of-the-art resource models[44,53] have not yet had an opportunity to explain theseother results. Thus, significant progress is being made andmany specific models have been ruled out, but additionalresearch will be needed to provide definitive evidencedistinguishing between these two broad classes of model.
Individual and group differences in visual workingmemory capacityAs discussed earlier, VWM capacity is a stable individualdifference and is impressively correlated with measures ofhigher cognitive function (Figure 1E). In addition, substan-tial differences in VWM capacity can be observed acrossgroups. For example, Kmax is lower in people with schizo-phrenia than in healthy control subjects [59,60], with avery large effect size (Cohen’s d) of 1.11 in a study of 99patients and 77 controls [13]. Moreover, the reduction inKmax accounted for approximately 40% of the impairmentfor a measure of broad intellectual function in the patientgroup. Assuming that reduced capacity actually causesreduced intellectual function (Box 2), this finding suggeststhat 40% of the cognitive deficit in people with schizophre-nia could be eliminated by a treatment that normalizestheir VWM capacity.
Several studies have attempted to determine the causesunderlying individual and group differences in VWM capac-ity. Among healthy young adults, Vogel and colleaguesfound that differences in VWM capacity can be attributedto differences in attentional processes that are responsiblefor filtering out irrelevant information. For example, whengiven arrays containing both relevant and irrelevantobjects, low-capacity individuals tend to encode irrelevantinformation into VWM to a greater extent than high-capaci-ty individuals do [23]. An fMRI study indicated that thisreflects impaired connectivity among prefrontal cortex, the
Box 2. Outstanding questions
� Debate is continuing about whether VWM is best conceived as a
set of discrete slot-like representations or as a flexible continuous
resource. Substantial progress has been made and many specific
models have been ruled out by the data. However, creative new
experimental designs and analytical procedures are needed
before we can definitively distinguish between these broad theory
classes.
� Most models assume that trial-by-trial variations in memory (e.g.,
the distribution of errors shown in Figure 2D, in main text) reflect
neural noise. However, much of this variance could instead reflect
systematic differences across trials (e.g., differences in the specific
stimuli being remembered). The source of this variance is
therefore an important issue for future research.
� Studies of individual differences typically assume that having
more memory capacity causes people to perform better on
broader tests of cognitive ability. However, the direction of
causation may actually be in the opposite direction. That is,
smarter people may figure out better ways to perform working
memory tasks. Determining the actual direction of causality will
be vitally important in future research.
� If variations in VWM capacity actually cause variations in overall
cognitive ability, then the next obvious question is whether it is
possible to improve VWM capacity and thereby improve overall
cognitive ability. This is currently a hot topic among working
memory researchers, but no clear answer has yet emerged.
basal ganglia, and parietal cortex [61]. In addition, recoveryis slower in low-capacity individuals than in high-capacityindividuals after attention is captured by irrelevant infor-mation [62]. Thus, differences in Kmax among healthy youngadults may not reflect the capacity of VWM per se, but mayinstead reflect variations in filtering processes that controlthe encoding of information into VWM.
Although attentional differences explain the bulk of thebetween-subject variability in VWM capacity amonghealthy college students, other factors appear to contributeto group differences. For example, Kmax is lower in patientswith Parkinson’s disease than in healthy control subjects,but only part of this can be explained by impaired filtering;these patients also appear to have lower VWM storagecapacity per se [63]. Similarly, Kmax declines in aging, asdoes filtering efficiency, but the timing of the filteringefficiency differences between younger and older adultsis not the same as that for differences between low- andhigh-Kmax younger adults[64,65].
In addition, the lower Kmax exhibited by schizophreniapatients does not appear to reflect impaired filtering at all.First, schizophrenia patients show the same ability toexclude irrelevant distractor items as control subjects do[60]. Second, CDA amplitude is actually greater in schizo-phrenia patients than in control subjects when a singleobject is stored in memory, but is lower in patients com-pared to controls when three or five items must be stored[66]. This difference was observed even in subsets ofpatients and controls with equivalent Kmax values. Thepatient impairment may reflect a tendency to hyperfocuson a small number of items, directly reducing VWM capac-ity. Schizophrenia patients may also tend to hyperfocus onperceptually salient information: they exhibit impairedfiltering [67] and slowed disengagement [68] when facedwith high-salience distractors.
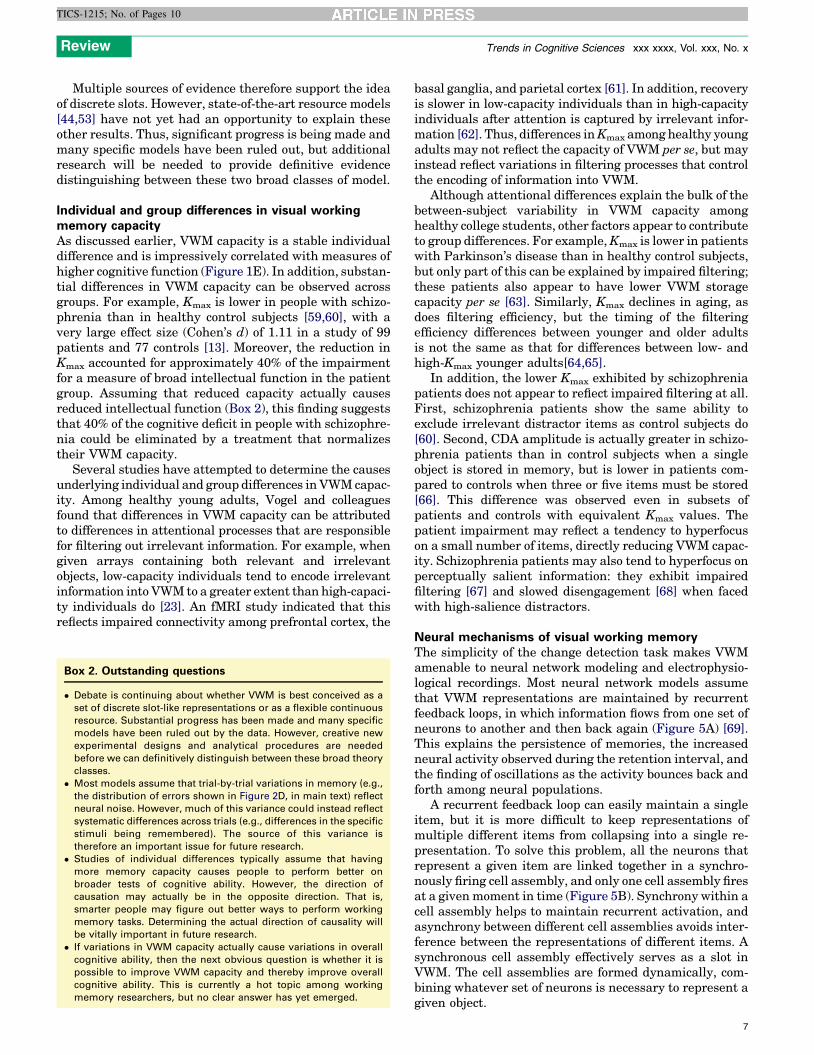
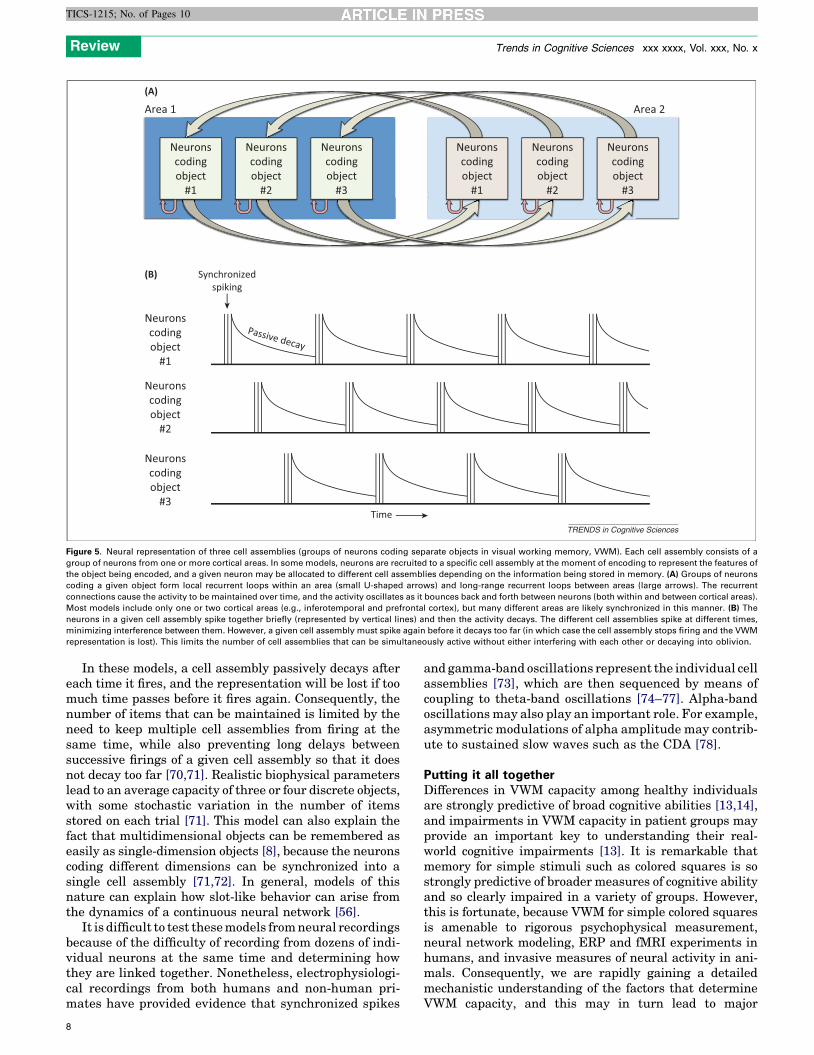
Neural mechanisms of visual working memoryThe simplicity of the change detection task makes VWMamenable to neural network modeling and electrophysio-logical recordings. Most neural network models assumethat VWM representations are maintained by recurrentfeedback loops, in which information flows from one set ofneurons to another and then back again (Figure 5A) [69].This explains the persistence of memories, the increasedneural activity observed during the retention interval, andthe finding of oscillations as the activity bounces back andforth among neural populations.
A recurrent feedback loop can easily maintain a singleitem, but it is more difficult to keep representations ofmultiple different items from collapsing into a single re-presentation. To solve this problem, all the neurons thatrepresent a given item are linked together in a synchro-nously firing cell assembly, and only one cell assembly firesat a given moment in time (Figure 5B). Synchrony within acell assembly helps to maintain recurrent activation, andasynchrony between different cell assemblies avoids inter-ference between the representations of different items. Asynchronous cell assembly effectively serves as a slot inVWM. The cell assemblies are formed dynamically, com-bining whatever set of neurons is necessary to represent agiven object.
7
Neuronscodingobject
#1
Neuronscodingobject
#1
Neuronscodingobject
#2
Neuronscodingobject
#2
Neuronscodingobject
#3
Neuronscodingobject
#3
Neuronscodingobject
#1
Neuronscodingobject
#2
Neuronscodingobject
#3
Synchronizedspiking
Passive decay
Area 1 Area 2
(B)
(A)
TimeTRENDS in Cognitive Sciences
Figure 5. Neural representation of three cell assemblies (groups of neurons coding separate objects in visual working memory, VWM). Each cell assembly consists of a
group of neurons from one or more cortical areas. In some models, neurons are recruited to a specific cell assembly at the moment of encoding to represent the features of
the object being encoded, and a given neuron may be allocated to different cell assemblies depending on the information being stored in memory. (A) Groups of neurons
coding a given object form local recurrent loops within an area (small U-shaped arrows) and long-range recurrent loops between areas (large arrows). The recurrent
connections cause the activity to be maintained over time, and the activity oscillates as it bounces back and forth between neurons (both within and between cortical areas).
Most models include only one or two cortical areas (e.g., inferotemporal and prefrontal cortex), but many different areas are likely synchronized in this manner. (B) The
neurons in a given cell assembly spike together briefly (represented by vertical lines) and then the activity decays. The different cell assemblies spike at different times,
minimizing interference between them. However, a given cell assembly must spike again before it decays too far (in which case the cell assembly stops firing and the VWM
representation is lost). This limits the number of cell assemblies that can be simultaneously active without either interfering with each other or decaying into oblivion.
Review Trends in Cognitive Sciences xxx xxxx, Vol. xxx, No. x
TICS-1215; No. of Pages 10
In these models, a cell assembly passively decays aftereach time it fires, and the representation will be lost if toomuch time passes before it fires again. Consequently, thenumber of items that can be maintained is limited by theneed to keep multiple cell assemblies from firing at thesame time, while also preventing long delays betweensuccessive firings of a given cell assembly so that it doesnot decay too far [70,71]. Realistic biophysical parameterslead to an average capacity of three or four discrete objects,with some stochastic variation in the number of itemsstored on each trial [71]. This model can also explain thefact that multidimensional objects can be remembered aseasily as single-dimension objects [8], because the neuronscoding different dimensions can be synchronized into asingle cell assembly [71,72]. In general, models of thisnature can explain how slot-like behavior can arise fromthe dynamics of a continuous neural network [56].
It is difficult to test these models from neural recordingsbecause of the difficulty of recording from dozens of indi-vidual neurons at the same time and determining howthey are linked together. Nonetheless, electrophysiologi-cal recordings from both humans and non-human pri-mates have provided evidence that synchronized spikes
8
and gamma-band oscillations represent the individual cellassemblies [73], which are then sequenced by means ofcoupling to theta-band oscillations [74–77]. Alpha-bandoscillations may also play an important role. For example,asymmetric modulations of alpha amplitude may contrib-ute to sustained slow waves such as the CDA [78].
Putting it all togetherDifferences in VWM capacity among healthy individualsare strongly predictive of broad cognitive abilities [13,14],and impairments in VWM capacity in patient groups mayprovide an important key to understanding their real-world cognitive impairments [13]. It is remarkable thatmemory for simple stimuli such as colored squares is sostrongly predictive of broader measures of cognitive abilityand so clearly impaired in a variety of groups. However,this is fortunate, because VWM for simple colored squaresis amenable to rigorous psychophysical measurement,neural network modeling, ERP and fMRI experiments inhumans, and invasive measures of neural activity in ani-mals. Consequently, we are rapidly gaining a detailedmechanistic understanding of the factors that determineVWM capacity, and this may in turn lead to major
Review Trends in Cognitive Sciences xxx xxxx, Vol. xxx, No. x
TICS-1215; No. of Pages 10
advances in understanding individual and group differ-ences in broader cognitive function.
AcknowledgmentsThis study was supported by grants from the National Institute of MentalHealth (R01MH076226 and R01MH065034 to S.J.L. and R01MH087214to E.K.V.) and the Office of Naval Research (N000141210972 to E.K.V.).We thank Ed Awh and Wei Ji Ma for many interesting discussions ofthese issues and Andy Yonelinas for comments on the manuscript.
References1 Anderson, J.R. et al. (1997) ACT-R: a theory of higher level cognition and
its relation to visual attention. Hum. Comput. Interact. 12, 439–4622 Meyer, D.E. and Kieras, D.E. (1997) A computational theory of
executive cognitive processes and multiple-task performance: part 1.Basic mechanisms. Psychol. Rev. 104, 3–65
3 Kyllonen, P.C. and Christal, R.E. (1990) Reasoning ability is (littlemore than) working-memory capacity?! Intelligence 14, 389–433
4 Engle, R.W. et al. (1999) Working memory, short-term memory, andgeneral fluid intelligence: a latent-variable approach. J. Exp. Psychol.Gen. 128, 309–331
5 Simons, D.J. and Levin, D.T. (1997) Change blindness. Trends Cogn.Sci. 1, 261–267
6 Simons, D.J. and Rensink, R.A. (2005) Change blindness: past, present,and future. Trends Cogn. Sci. 9, 16–20
7 Phillips, W.A. (1974) On the distinction between sensory storage andshort-term visual memory. Percept. Psychophys. 16, 283–290
8 Luck, S.J. and Vogel, E.K. (1997) The capacity of visual workingmemory for features and conjunctions. Nature 390, 279–281
9 Irwin, D.E. (1991) Information integration across saccadic eyemovements. Cogn. Psychol. 23, 420–456
10 Luck, S.J. (2008) Visual short-term memory. In Visual Memory (Luck,S.J. and Hollingworth, A., eds), pp. 43–85, Oxford University Press
11 Gibson, B. et al. (2011) Qualitative similarities in the visual short-termmemory of pigeons and people. Psychonom. Bull. Rev. 18, 979–984
12 Kyllingsbaek, S. and Bundesen, C. (2009) Changing change detection:improving the reliability of measures of visual short-term memorycapacity. Psychonom. Bull. Rev. 16, 1000–1010
13 Johnson, M.K. et al. (2013) The relationship between working memorycapacity and broad measures of cognitive ability in healthy adults andpeople with schizophrenia. Neuropsychology 27, 220–229
14 Fukuda, K. et al. (2010) Quantity, not quality: the relationship betweenfluid intelligence and working memory capacity. Psychonom. Bull. Rev.17, 673–679
15 Lin, P-H. and Luck, S.J. (2012) Proactive interference does notmeaningfully distort visual working memory capacity estimates inthe canonical change detection task. Front. Psychol. 3, 42
16 Hartshorne, J.K. (2008) Visual working memory capacity and proactiveinterference. PLoS ONE 3, e2716
17 Shipstead, Z. and Engle, R.W. (2013) Interference within the focus ofattention: working memory tasks reflect more than temporarymaintenance. J. Exp. Psychol. Learn. Mem. Cogn. 39, 277–289
18 Jeneson, A. et al. (2012) Visual working memory capacity and themedial temporal lobe. J. Neurosci. 32, 3584–3589
19 Olson, I.R. et al. (2006) Working memory for conjunctions relies on themedial temporal lobe. J. Neurosci. 26, 4596–4601
20 Fuster, J.M. and Jervey, J.P. (1982) Neuronal firing in theinferotemporal cortex of the monkey in a visual memory task.J. Neurosci. 2, 361–375
21 Miller, E.K. and Desimone, R. (1991) A neural mechanism for workingand recognition memory in inferior temporal cortex. Science 254,1377–1379
22 Vogel, E.K. and Machizawa, M.G. (2004) Neural activity predictsindividual differences in visual working memory capacity. Nature428, 748–751
23 Vogel, E.K. et al. (2005) Neural measures reveal individual differencesin controlling access to working memory. Nature 438, 500–503
24 Todd, J.J. and Marois, R. (2005) Posterior parietal cortex activitypredicts individual differences in visual short-term memorycapacity. Cogn. Affect. Behav. Neurosci. 5, 144–155
25 Todd, J.J. and Marois, R. (2004) Capacity limit of visual short-termmemory in human posterior parietal cortex. Nature 428, 751–754
26 Henderson, J.M. (2008) Eye movements and visual memory. In VisualMemory (Luck, S.J. and Hollingworth, A., eds), pp. 87–121, OxfordUniversity Press
27 Irwin, D.E. (1992) Memory for position and identity across eyemovements. J. Exp. Psychol. Learn. Mem. Cogn. 18, 307–317
28 Irwin, D.E. and Andrews, R.V. (1996) Integration and accumulation ofinformation across saccadic eye movements. In Attention andPerformance XVI (Inui, T. and McClelland, J.L., eds), pp. 125–155,MIT Press
29 Hollingworth, A. et al. (2008) Understanding the function of visualshort-term memory: transsaccadic memory, object correspondence,and gaze correction. J. Exp. Psychol. Gen. 137, 163–181
30 Mannan, S.K. et al. (2010) Early oculomotor capture by new onsetsdriven by the contents of working memory. Vis. Res. 50, 1590–1597
31 Hollingworth, A. et al. (2013) Visual working memory modulates rapideye movements to simple onset targets. Psychol. Sci. 24, 790–796
32 Carlisle, N.B. et al. (2011) Attentional templates in visual workingmemory. J. Neurosci. 31, 9315–9322
33 Woodman, G.F. et al. (2007) The role of working memoryrepresentations in the control of attention. Cereb. Cortex 17, i118–i124
34 Woodman, G.F. et al. (2001) Visual search remains efficient whenvisual working memory is full. Psychol. Sci. 12, 219–224
35 Luria, R. and Vogel, E.K. (2011) Visual search demands dictatereliance on working memory storage. J. Neurosci. 31, 6199–6207
36 Anderson, D.E. et al. (2013) A common discrete resource for visualworking memory and visual search. Psychol. Sci. 24, 929–938
37 Drew, T. et al. (2011) Delineating the neural signatures of trackingspatial position and working memory during attentive tracking. J.Neurosci. 31, 659–668
38 Drew, T. and Vogel, E.K. (2008) Neural measures of individualdifferences in selecting and tracking multiple moving objects. J.Neurosci. 28, 4183–4191
39 Tsubomi, H. et al. (2013) Neural limits to representing objects stillwithin view. J. Neurosci. 33, 8257–8263
40 Vogel, E.K. and Awh, E. (2008) How to exploit diversity for scientificgain: using individual differences to constrain cognitive theory. Curr.Dir. Psychol. Sci. 17, 171–176
41 Awh, E. et al. (2007) Visual working memory represents a fixed numberof items regardless of complexity. Psychol. Sci. 18, 622–628
42 Alvarez, G.A. and Cavanagh, P. (2004) The capacity of visual short-term memory is set both by information load and by number of objects.Psychol. Sci. 15, 106–111
43 Brady, T.F. et al. (2011) A review of visual memory capacity: beyondindividual items and toward structured representations. J. Vis. 11, 4
44 van den Berg, R. et al. (2012) Variability in encoding precision accountsfor visual short-term memory limitations. Proc. Natl. Acad. Sci. U.S.A.109, 8780–8785
45 Rouder, J.N. et al. (2008) An assessment of fixed-capacity modelsof visual working memory. Proc. Natl. Acad. Sci. U.S.A. 105,5975–5979
46 Bays, P.M. and Husain, M. (2008) Dynamic shifts of limited workingmemory resources in human vision. Science 321, 851–854
47 Wilken, P. and Ma, W.J. (2004) A detection theory account of changedetection. J. Vis. 4, 1120–1135
48 Zhang, W. and Luck, S.J. (2008) Discrete fixed-resolutionrepresentations in visual working memory. Nature 453, 233–235
49 Anderson, D.E. et al. (2011) Precision in visual working memoryreaches a stable plateau when individual item limits are exceeded.J. Neurosci. 31, 1128–1138
50 Anderson, D.E. and Awh, E. (2012) The plateau in mnemonicresolution across large set sizes indicates discrete resource limits invisual working memory. Atten. Percept. Psychophys. 74, 891–910
51 Xu, Y. and Chun, M.M. (2006) Dissociable neural mechanismssupporting visual short-term memory for objects. Nature 440, 91–95
52 Thiele, J.E. et al. (2011) On perfect working-memory performance withlarge numbers of items. Psychonom. Bull. Rev. 18, 958–963
53 Sims, C.R. et al. (2012) An ideal observer analysis of visual workingmemory. Psychol. Rev. 119, 807–830
54 Saults, J.S. and Cowan, N. (2007) A central capacity limit to thesimultaneous storage of visual and auditory arrays in workingmemory. J. Exp. Psychol. Gen. 136, 663–684
55 Franconeri, S.L. et al. (2013) Flexible cognitive resources: competitivecontent maps for attention and memory. Trends Cogn. Sci. 17, 134–141
9
Review Trends in Cognitive Sciences xxx xxxx, Vol. xxx, No. x
TICS-1215; No. of Pages 10
56 Wei, Z. et al. (2012) From distributed resources to limited slots inmultiple-item working memory: a spiking network model withnormalization. J. Neurosci. 32, 11228–11240
57 Lin, P-H. and Luck, S.J. (2008) The influence of similarity on visualworking memory representations. Vis. Cogn. 17, 356–372
58 Zhang, W. and Luck, S.J. (2011) The number and quality ofrepresentations in working memory. Psychol. Sci. 22, 1434–1441
59 Gold, J.M. et al. (2003) Working memory for visual features andconjunctions in schizophrenia. J. Abnorm. Psychol. 112, 61–71
60 Gold, J.M. et al. (2006) Intact attentional control of working memoryencoding in schizophrenia. J. Abnorm. Psychol. 115, 658–673
61 McNab, F. and Klingberg, T. (2008) Prefrontal cortex and basal gangliacontrol access to working memory. Nat. Neurosci. 11, 103–107
62 Fukuda, K. and Vogel, E.K. (2009) Human variation in overridingattentional capture. J. Neurosci. 29, 8726–8733
63 Lee, E-Y. et al. (2010) Visual working memory deficits in patients withParkinson’s disease are due to both reduced storage capacity andimpaired ability to filter out irrelevant information. Brain 133,2677–2689
64 Jost, K. et al. (2011) Are old adults just like low working memory youngadults? Filtering efficiency and age differences in visual workingmemory. Cereb. Cortex 21, 1147–1154
65 Cashdollar, N. et al. (2013) Prolonged disengagement from attentionalcapture in normal aging. Psychol. Aging 28, 77–86
66 Leonard, C.J. et al. (2013) Toward the neural mechanisms of reducedworking memory capacity in schizophrenia. Cereb. Cortex 23, 1582–1592
67 Hahn, B. et al. (2010) Failure of schizophrenia patients to overcomesalient distractors during working memory encoding. Biol. Psychiatry68, 603–609
68 Mayer, J.S. et al. (2012) Impaired contingent attentional capturepredicts reduced working memory capacity in schizophrenia. PLoSONE 7, e48586
69 Deco, G. and Rolls, E.T. (2008) Neural mechanisms of visual memory: aneurocomputational perspective. In Visual Memory (Luck, S.J. andHollingworth, A., eds), pp. 247–289, Oxford University Press
10
70 Lisman, J.E. and Idiart, M.A.P. (1995) Storage of 7�2 short-termmemories in oscillatory subcycles. Science 267, 1512–1515
71 Raffone, A. and Wolters, G. (2001) A cortical mechanism for binding invisual working memory. J. Cogn. Neurosci. 13, 766–785
72 Luck, S.J. and Vogel, E.K. (1998) Response from Luck and Vogel.Trends Cogn. Sci. 2, 78–80
73 Pesaran, B. et al. (2002) Temporal structure in neuronal activity duringworking memory in macaque parietal cortex. Nat. Neurosci. 5, 805–811
74 Liebe, S. et al. (2012) Theta coupling between V4 and prefrontal cortexpredicts visual short-term memory performance. Nat. Neurosci. 15,456–462 S451–452
75 Lee, H. et al. (2005) Phase locking of single neuron activity to thetaoscillations during working memory in monkey extrastriate visualcortex. Neuron 45, 147–156
76 Sauseng, P. et al. (2009) Brain oscillatory substrates of visual short-term memory capacity. Curr. Biol. 19, 1846–1852
77 Siegel, M. et al. (2009) Phase-dependent neuronal coding of objects inshort-term memory. Proc. Natl. Acad. Sci. U.S.A. 106, 21341–21346
78 van Dijk, H. et al. (2013) Modulations in oscillatory activity withamplitude asymmetry can produce cognitively relevant event-related responses. Proc. Natl. Acad. Sci. U.S.A. 107, 900–90510.1073/pnas.0908821107
79 Hyun, J-S. et al. (2009) The comparison of visual working memoryrepresentations with perceptual inputs. J. Exp. Psychol. Hum. Percept.Perform. 35, 1140–1160
80 Pashler, H. (1988) Familiarity and visual change detection. Percept.Psychophys. 44, 369–378
81 Cowan, N. et al. (2005) On the capacity of attention: its estimation andits role in working memory and cognitive aptitudes. Cogn. Psychol. 51,42–100
82 Rouder, J.N. et al. (2011) How to measure working memory capacity inthe change detection paradigm. Psychonom. Bull. Rev. 18, 324–330
83 Morey, R.D. and Morey, C.C. (2011) WoMMBAT: A user interface forhierarchical Bayesian estimation of working memory capacity. Behav.Res. Methods 43, 1044–1065