Embed Size (px)
Citation preview
Seediscussions,stats,andauthorprofilesforthispublicationat:http://www.researchgate.net/publication/279303627
VisualvsFullyAutomaticHistogram-BasedAssessmentofIdiopathicPulmonaryFibrosis(IPF)ProgressionUsingSequentialMultidetectorComputedTomography(MDCT).
ARTICLEinPLOSONE·JANUARY2015
ImpactFactor:3.53·DOI:10.1371/journal.pone.0130653·Source:PubMed
DOWNLOADS
2
VIEWS
4
14AUTHORS,INCLUDING:
DavideColombi
AziendaUnitaSanitariaLocalediPiacenza
8PUBLICATIONS4CITATIONS
SEEPROFILE
OliverWeinheimer
UniversitätHeidelberg
43PUBLICATIONS379CITATIONS
SEEPROFILE
MariaTeodoraBuzan
IuliuHaţieganuUniversityofMedicineandP…3PUBLICATIONS0CITATIONS
SEEPROFILE
Availablefrom:MariaTeodoraBuzan
Retrievedon:15July2015
RESEARCH ARTICLE
Visual vs Fully Automatic Histogram-BasedAssessment of Idiopathic Pulmonary Fibrosis(IPF) Progression Using SequentialMultidetector Computed Tomography(MDCT)Davide Colombi1,2,3*, Julien Dinkel2,3,4, Oliver Weinheimer2,3, Berenike Obermayer3,Teodora Buzan2,3,5, Diana Nabers6, Claudia Bauer2,7, Ute Oltmanns2,7, Karin Palmowski2,7,Felix Herth2,7, Hans Ulrich Kauczor2,3, Nicola Sverzellati1, Michael Kreuter2,7☯*, ClausPeter Heussel2,3☯
1 Department of Surgical Sciences, Section of Diagnostic Imaging at University of Parma, Parma, Italy,2 Translational Lung Research Centre (TLRC), Member of the German Center for Lung Research (DZL),Heidelberg, Germany, 3 Department of Diagnostic and Interventional Radiology, University of Heidelberg,Heidelberg, Germany, 4 Department of Clinical Radiology, University of Munich, Munich, Germany,5 Department of Pneumology, Iuliu Hatieganu University of Medicine and Pharmacy in Cluj-Napoca, Cluj-Napoca, Romania, 6 Division of Medical and Biological Informatics (E130), German Cancer ResearchCenter (DFKZ), Heidelberg, Germany, 7 Department of Pneumology and respiratory critical care medicine,Center for interstitial and rare lung diseases, Thoraxklinik at University of Heidelberg, Heidelberg, Germany
☯ These authors contributed equally to this work.* [email protected] (MK); [email protected] (DC)
Abstract
Objectives
To describe changes over time in extent of idiopathic pulmonary fibrosis (IPF) at multidetec-
tor computed tomography (MDCT) assessed by semi-quantitative visual scores (VSs) and
fully automatic histogram-based quantitative evaluation and to test the relationship between
these two methods of quantification.
Methods
Forty IPF patients (median age: 70 y, interquartile: 62-75 years; M:F, 33:7) that underwent
2 MDCT at different time points with a median interval of 13 months (interquartile: 10-17
months) were retrospectively evaluated. In-house software YACTA quantified automatically
lung density histogram (10th-90th percentile in 5th percentile steps). Longitudinal changes in
VSs and in the percentiles of attenuation histogram were obtained in 20 untreated patients
and 20 patients treated with pirfenidone. Pearson correlation analysis was used to test the
relationship between VSs and selected percentiles.
PLOS ONE | DOI:10.1371/journal.pone.0130653 June 25, 2015 1 / 17
OPEN ACCESS
Citation: Colombi D, Dinkel J, Weinheimer O,Obermayer B, Buzan T, Nabers D, et al. (2015) Visualvs Fully Automatic Histogram-Based Assessment ofIdiopathic Pulmonary Fibrosis (IPF) ProgressionUsing Sequential Multidetector ComputedTomography (MDCT). PLoS ONE 10(6): e0130653.doi:10.1371/journal.pone.0130653
Editor: Joshua M. Hare, University of Miami MillerSchool of Medicine, UNITED STATES
Received: January 2, 2015
Accepted: May 22, 2015
Published: June 25, 2015
Copyright: © 2015 Colombi et al. This is an openaccess article distributed under the terms of theCreative Commons Attribution License, which permitsunrestricted use, distribution, and reproduction in anymedium, provided the original author and source arecredited.
Data Availability Statement: All relevant data arewithin the paper.
Funding: This study was supported by grants fromthe Dietmar Hopp Stiftung, the Bundesministerium fürBildung und Forschung (BMBF) to the GermanCenter for Lung Research (DZL) (82DZL00401,82DZL00402, 82DZL00404), the DeutscheForschungsgemeinschaft, and the Ruprecht-Karls-Universität Heidelberg within the funding programOpen Access Publishing.
Results
In follow-up MDCT, visual overall extent of parenchymal abnormalities (OE) increased in
median by 5 %/year (interquartile: 0 %/y; +11 %/y). Substantial difference was found
between treated and untreated patients in HU changes of the 40th and of the 80th percen-
tiles of density histogram. Correlation analysis between VSs and selected percentiles
showed higher correlation between the changes (Δ) in OE and Δ 40th percentile (r=0.69;p<0.001) as compared to Δ 80th percentile (r=0.58; p<0.001); closer correlation was found
between Δ ground-glass extent and Δ 40th percentile (r=0.66, p<0.001) as compared to Δ
80th percentile (r=0.47, p=0.002), while the Δ reticulations correlated better with the Δ 80th
percentile (r=0.56, p<0.001) in comparison to Δ 40th percentile (r=0.43, p=0.003).
Conclusions
There is a relevant and fully automatically measurable difference at MDCT in VSs and in
histogram analysis at one year follow-up of IPF patients, whether treated or untreated: Δ
40th percentile might reflect the change in overall extent of lung abnormalities, notably of
ground-glass pattern; furthermore Δ 80th percentile might reveal the course of reticular
opacities.
IntroductionIdiopathic pulmonary fibrosis (IPF) is a progressive and irreversible interstitial lung disease(ILD) of unknown etiology with a heterogeneous clinical course [1]. Notably, IPF is the mostcommon form of idiopathic interstitial pneumonias with a median survival of 2.5–3.5 yearsafter diagnosis [2]. Recently, pirfenidone, an orally active, small molecule that inhibits synthesisof pro-fibrotic and inflammatory mediators, was approved for the treatment of patients withmild to moderate IPF in the European Union and other countries, as it demonstrated a signifi-cant reduction of disease progression and a potential survival benefit [3, 4]. Furthermore,another drug, nintedanib, showed efficacy in the treatment of IPF [5]. However, given the vari-able course of the disease and the potential adverse effects associated with the substantial costsof these treatments, it is crucial to objectively assess the progression of IPF, in order to identifynatural course and treatment effectiveness both in clinical practice and during clinical trials.
Although predictive markers of response to therapy are still missing, pulmonaryimpairment, symptoms, and serial imaging changes are widely used in monitoring patients.Forced vital capacity (FVC) and diffusing capacity of the lung for carbon monoxide (DLCO)are both recommended in monitoring IPF [1]. However, FVC quantification is sometimeschallenging in patients with dyspnea and cough and it might be demanding to differentiatebetween significant changes that represent disease progression and measurement variability[1, 6]. In addition DLCO is affected by underlying pulmonary vasculopathy and emphysema[1, 7, 8].
In contrast, multidetector computed tomography (MDCT) is a potential alternative toassess “in vivo” the progression of the disease [9]. Despite several MDCT features can beobserved in fibrotic interstitial lung disease (reticular pattern, traction bronchiectasis, groundglass opacity, and honeycombing), agreement between readers about the presence and extentof these basic patterns is variable [10–13]. Quantitative computed tomography has the poten-tial advantages of objectivity and ability to identify features that are not visually recognizable.
MDCT Automatic Assessment of Disease Extent Progression in IPF
PLOSONE | DOI:10.1371/journal.pone.0130653 June 25, 2015 2 / 17
Competing Interests: Colombi D received a supportfor travel to meetings for the study from Intermune.Oltmanns U received payment for educationalpresentation from European Respiratory Society andfees for both meetings and presentation atcongresses from Intermune. Palmowski K receivedmeetings expenses from Intermune. Herth F is boardmember of Novartis, Astra Zeneca, Grifols, BerlinChemie, Chiesi, Pulmonx, and PneumRx; he alsoreceived fees for lectures from the same companies.Kauczor HU is board member of Siemens; he alsoreceived fees for lectures and educationalpresentations from Bracco, Novartis, Siemens,Boehringer, and Bayer. Sverzellati N received fees forlectures and educational presentation fromIntermune, Boeringher, Astrazeneca, Pfizer, andChiesi. Kreuter M received a grant from DietmarHopp Stiftung; he is also a consultant for Intermuneand he received fees for lectures and educationalpresentations from Boehringer and Intermune.Heussel CP is a consultant of Pfizer, BoheringerIngelheim, Gilead, Intermune, and Fresenius; he alsoreceived research funding from Siemens, Pfizer, andBoheringer Ingelheim as well as fees for lecturesfrom Gilead, MSD, Pfizer, Intermune, BoheringerIngelheim, and Novartis. This does not alter theauthors' adherence to PLOS ONE policies on sharingdata and materials. For the remaining authors nocompeting interests were declared.
Histogram-based measurements showed moderate correlation with functional impairmentand demonstrated significant changes at one-year follow-up, indicating disease progression[14–16]. In chronic obstructive pulmonary disease (COPD), the 15th percentile of lung densityhistogram is regarded as a useful tool in detecting patients with emphysema [17]. It is thereforehypothesized, that in patients suffering from IPF, specific percentiles of lung density histogrammight reflect the extension of MDCT abnormalities and might be considered a biomarker ofdisease evolution.
The purposes of this study were to describe the changes over time in the extent of parenchy-mal abnormalities assessed on chest MDCT by both semi-quantitative visual scores (VSs) andautomatic histogram-based quantitative analysis and to test the relationship between these twomethods of quantification of lung abnormalities in patients suffering from IPF.
Materials and Methods
PatientsAll procedures were in accordance with the declaration of Helsinki. MDCTs were performedon clinical indication. Informed written consent for examination was obtained from allpatients. Clinical records of 256 patients suffering from IPF admitted to our center for intersti-tial and rare lung disease between August 2006 and December 2013 were reviewed retrospec-tively. The retrospective analysis was approved by the ethics committee of the medical schoolof the University of Heidelberg (IRB approval number S-318/2013). All patient records wereanonymized and de-identified prior to analysis.
The diagnosis of IPF was confirmed in each patient by a multidisciplinary team discus-sion meeting (pulmonologists, radiologists, and pathologists experienced in the diagnosisand treatment of IPF) and was based on a review of clinical data, chest MDCT, and histologi-cal assessment of lung biopsies. IPF was diagnosed according to the current consensus state-ment of the American thoracic society/European respiratory society/Japanese respiratorysociety/Latin American Thoracic Association (ATS/ERS/JRS/ALAT) for patients with firstdiagnosis after 2011, whereas prior cases were diagnosed following the previous guidelines[1, 18]. Individual therapeutic schemes were selected on the basis of the interdisciplinarystatement.
Demographic and clinical data of the study population are shown in Table 1. A total of 40patients that underwent 2 technically identical MDCT examinations on the same scanner sepa-rated by an interval of at least 6 months (median interval between initial and follow-up MDCT:13 months; interquartile: 10 months; 17 months) were enrolled consecutively. In order to assesswhether the range of detectable differences over time in MDCT lung density histogram wasmeasureable, a random population of 20 patients treated with pirfenidone, an anti-fibroticdrug licensed for mild to moderate IPF, and another 20 patients not treated with this drug wascomposed [19]. The interval time between the initial MDCT and the beginning of the pirfeni-done therapy did not exceed about 1/3 of the interval between the initial and the follow-upMDCT scans. Pirfenidone was not clinically indicated for several reasons in the remaining 20patients [19]. To perform an accurate evaluation in longitudinal changes of lung attenuationhistograms, were excluded patients in which initial and follow-up MDCT scans were obtainedusing different scanner, contrast application (i.e initial contrast-enhanced MDCT and not con-trast-enhanced follow-up scan), or reconstructed with different algorithms (i.e filtered backprojection vs. iterative) [20]. Details about medical treatment between initial and follow-upMDCTs are shown in Table 1.
MDCT Automatic Assessment of Disease Extent Progression in IPF
PLOSONE | DOI:10.1371/journal.pone.0130653 June 25, 2015 3 / 17
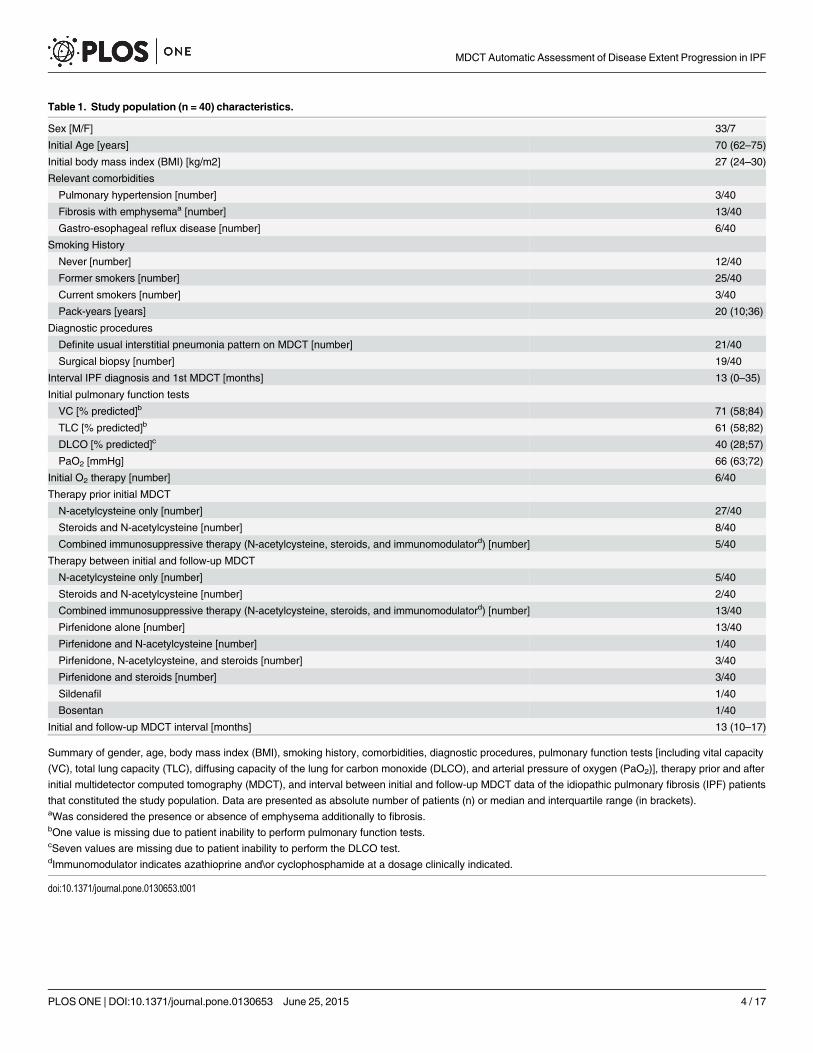
Table 1. Study population (n = 40) characteristics.
Sex [M/F] 33/7
Initial Age [years] 70 (62–75)
Initial body mass index (BMI) [kg/m2] 27 (24–30)
Relevant comorbidities
Pulmonary hypertension [number] 3/40
Fibrosis with emphysemaa [number] 13/40
Gastro-esophageal reflux disease [number] 6/40
Smoking History
Never [number] 12/40
Former smokers [number] 25/40
Current smokers [number] 3/40
Pack-years [years] 20 (10;36)
Diagnostic procedures
Definite usual interstitial pneumonia pattern on MDCT [number] 21/40
Surgical biopsy [number] 19/40
Interval IPF diagnosis and 1st MDCT [months] 13 (0–35)
Initial pulmonary function tests
VC [% predicted]b 71 (58;84)
TLC [% predicted]b 61 (58;82)
DLCO [% predicted]c 40 (28;57)
PaO2 [mmHg] 66 (63;72)
Initial O2 therapy [number] 6/40
Therapy prior initial MDCT
N-acetylcysteine only [number] 27/40
Steroids and N-acetylcysteine [number] 8/40
Combined immunosuppressive therapy (N-acetylcysteine, steroids, and immunomodulatord) [number] 5/40
Therapy between initial and follow-up MDCT
N-acetylcysteine only [number] 5/40
Steroids and N-acetylcysteine [number] 2/40
Combined immunosuppressive therapy (N-acetylcysteine, steroids, and immunomodulatord) [number] 13/40
Pirfenidone alone [number] 13/40
Pirfenidone and N-acetylcysteine [number] 1/40
Pirfenidone, N-acetylcysteine, and steroids [number] 3/40
Pirfenidone and steroids [number] 3/40
Sildenafil 1/40
Bosentan 1/40
Initial and follow-up MDCT interval [months] 13 (10–17)
Summary of gender, age, body mass index (BMI), smoking history, comorbidities, diagnostic procedures, pulmonary function tests [including vital capacity
(VC), total lung capacity (TLC), diffusing capacity of the lung for carbon monoxide (DLCO), and arterial pressure of oxygen (PaO2)], therapy prior and after
initial multidetector computed tomography (MDCT), and interval between initial and follow-up MDCT data of the idiopathic pulmonary fibrosis (IPF) patients
that constituted the study population. Data are presented as absolute number of patients (n) or median and interquartile range (in brackets).aWas considered the presence or absence of emphysema additionally to fibrosis.bOne value is missing due to patient inability to perform pulmonary function tests.cSeven values are missing due to patient inability to perform the DLCO test.dImmunomodulator indicates azathioprine and\or cyclophosphamide at a dosage clinically indicated.
doi:10.1371/journal.pone.0130653.t001
MDCT Automatic Assessment of Disease Extent Progression in IPF
PLOSONE | DOI:10.1371/journal.pone.0130653 June 25, 2015 4 / 17
Multidetector Computed TomographyIn all IPF patients, thin-section MDCT of the entire chest was routinely performed at inspira-tory breath-hold in supine position using spiral mode scanning. Prior to the examination, allpatients were trained to achieve a full end-inspiratory breath-hold after automatic patientinstruction. Twenty-nine patients underwent the pair of baseline and follow-up MDCT scanson a 4-slice scanner (Volume Zoom, Siemens AG, Forchheim, Germany) and 11 patients on a64-slice scanner (Somatom Definition AS, Siemens AG, Forchheim, Germany). The technicalparameters for the 4-slice scanner were as follows: tube voltage 120 kV, effective tube current-time product of 70 mAs, collimation of 4x1.25 mm, rotation time 0.5 sec, and pitch of 2 (typi-cally DLPw = 127 mGy cm, E = 1.6 mSv, and scan time = 18 sec). The acquisition parametersfor the 64-slice scanner were as follows: tube voltage 120 kV, median effective tube current-time product of 67 mAs (range 48–151), collimation of 64x0.6 mm, rotation time of 0.33 sec,and pitch of 1.5 (typically DLPw = 37 mGy cm, E = 0.6 mSv, and scan time = 3 sec). Twopatients were scanned both at baseline examination and at follow-up with contrast enhancedMDCT on the 4-slice scanner with identical administration (120ml Iopamidol-300, BraccoImaging, Konstanz, Germany @ 3.5ml/s). Baseline and follow-up scans were started automati-cally by bolus triggering with a region-of-interest (ROI) located in the pulmonary trunk, andscanning protocol as mentioned above.
Image reconstruction was performed with a slice thickness of 1.25 and 1 mm increment.Since medium-soft kernels are more accurate and less noisy than sharp kernels for computerbased quantitative analysis, either B40f kernel (4-slice scanner) or iterative I40f algorithm(64-slice scanner) were used [15]. The scale of attenuation coefficients with these systems ran-ged from -1024 HU to +3071 HU. The systems were calibrated with a standard phantom forwater in quarterly period and after major maintenance, as well as for air daily. MDCT scansaffected by severe respiratory artifacts were not encountered in this study.
Visual scoring and automatic evaluation at MDCTMDCT images for each patient were reviewed by a trainee (D.C.) with 2 year of experience inthoracic imaging, who was blinded to individual therapy, clinical findings and histologicaldata, after 6 months of focused training for ILD under interactive guidance of experiencedchest radiologists (C.P.H and J.D.). For each patient, all the MDCT scans were scored on a cer-tified PACS workstation simultaneously, using a window setting for lung parenchyma (center,-600 HU; width, 1600 HU).
MDCT scans were visually evaluated at six axial levels selected by the reader as follows: 1)the aortic arch, 2) the carina, 3) the pulmonary venous confluence, 4) the midpoint betweenlevel 3 and level 5, 5) 1 cm above the dome of the right hemi-diaphragm and 6) 2 cm below thedome of the right hemi-diaphragm [21]. MDCT findings were interpreted on the basis of therecommendations suggested by the Fleischner Society nomenclature committee [10]. Thereader quantified semi-quantitatively in each slice the overall extent of interstitial lung disease(OE), defined by the sum of ground glass opacities (GGO), reticular opacities (RET), honey-combing (HC), and consolidations (CONS). Afterwards the reader quantified in each slice theindividual amount of GGO, RET, HC, CONS and emphysema (EMP). Each score was calcu-lated as the percentage of lung parenchyma involved to the nearest 5%. In each patient, thetotal extent of OE, GGO, RET, HC, CONS and EMP were derived by averaging the scoresobtained at the six axial levels described above.
The lung density histogram of each CT was obtained using the in-house YACTA software,which was primarily developed for the emphysema quantification [22]. The stack of around300 DICOM images per patient was analyzed fully automatically in an unattended mode. Soft
MDCT Automatic Assessment of Disease Extent Progression in IPF
PLOSONE | DOI:10.1371/journal.pone.0130653 June 25, 2015 5 / 17
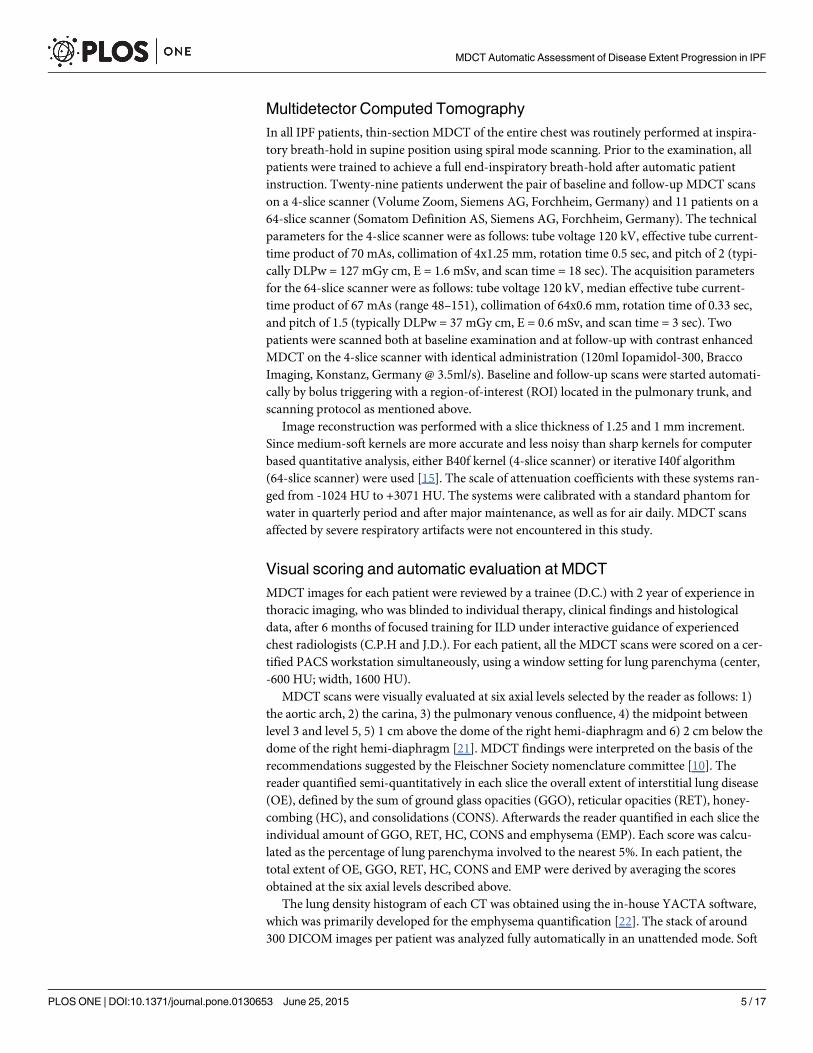
tissues (> -750 HU), lungs (< -500 HU), and tracheobronchial tree were found fully automati-cally using both threshold values and anatomical knowledge-based algorithms without manualinteraction (Fig 1). In each MDCT the reader assessed the quality of the volume automaticallysegmented. The HU value of the range 10th-90th percentile in 5th percentiles steps was derivedfrom the histogram recording the densities of all lung voxels for each MDCT.
Pulmonary function testsBody plethysmography (MasterScreen Body; E. Jaeger, Hoechberg, Germany) was performedaccording to the guidelines of the ERS and the standards of the ATS [23]. Pulmonary functiontests (PFTs) were obtained within 30 days of MDCT scans. The European Coal and Steel Com-munity—predicted values were selected as our in-house standard and reflect the individuallymeasured value in relation to an age- and height-matched control population given in percent-age [24]. The “%” symbol following the PFT parameters indicates the predicted values in per-cent. The changes in both vital capacity (VC%) and diffusing capacity of the lung for carbonmonoxide (DLCO%) between the initial and the follow-up PFTs were used for the correlationanalysis [1].
Fig 1. Visualization of the fully automatic lung parenchyma segmentation as obtained by in-houseYACTA software. Sagittal reconstruction image of a non-enhanced MDCT scan obtained from a patientsuffering from idiopathic pulmonary fibrosis (IPF) not included in the current trial. YACTA softwareautomatically segmented lung parenchyma and trachea-bronchial tree, emphasized as green and orangeoverlay respectively (window width: 1600 HU; level: -600 HU). Note that the segmentation algorithm fails tosegment portions of the lung parenchyma in the sub-pleural space of the recessus, due to its similar densityto the chest wall. (MDCT = multidetector computed tomography).
doi:10.1371/journal.pone.0130653.g001
MDCT Automatic Assessment of Disease Extent Progression in IPF
PLOSONE | DOI:10.1371/journal.pone.0130653 June 25, 2015 6 / 17
Data evaluation and statistical analysisIndividual longitudinal changes per year in VSs (Δ VSs %/y), in every 5th percentile included inthe range of 10th-90th percentile of lung density histogram (Δ PERC HU/y), and in PFTs (ΔPFTs %/y) were computed as the difference between the initial and follow-up MDCTs resultsdivided by the interval. In order to identify a measurable difference in MDCT density, the per-centiles of the attenuation histogram characterized by the largest difference and the lowestoverlap in longitudinal HU changes between treated and untreated patients were identified.Pearson correlation analysis was used to evaluate the relationship between VSs, selected PERC,and PFTs%. All data were recorded using a dedicated database (Excel 2010, Microsoft Corp.,Redmond, WA) and analyzed using SPSS version 20 (SPSS, Inc., Chicago, IL). A p value lessthan 0.05 was considered significant.
Results
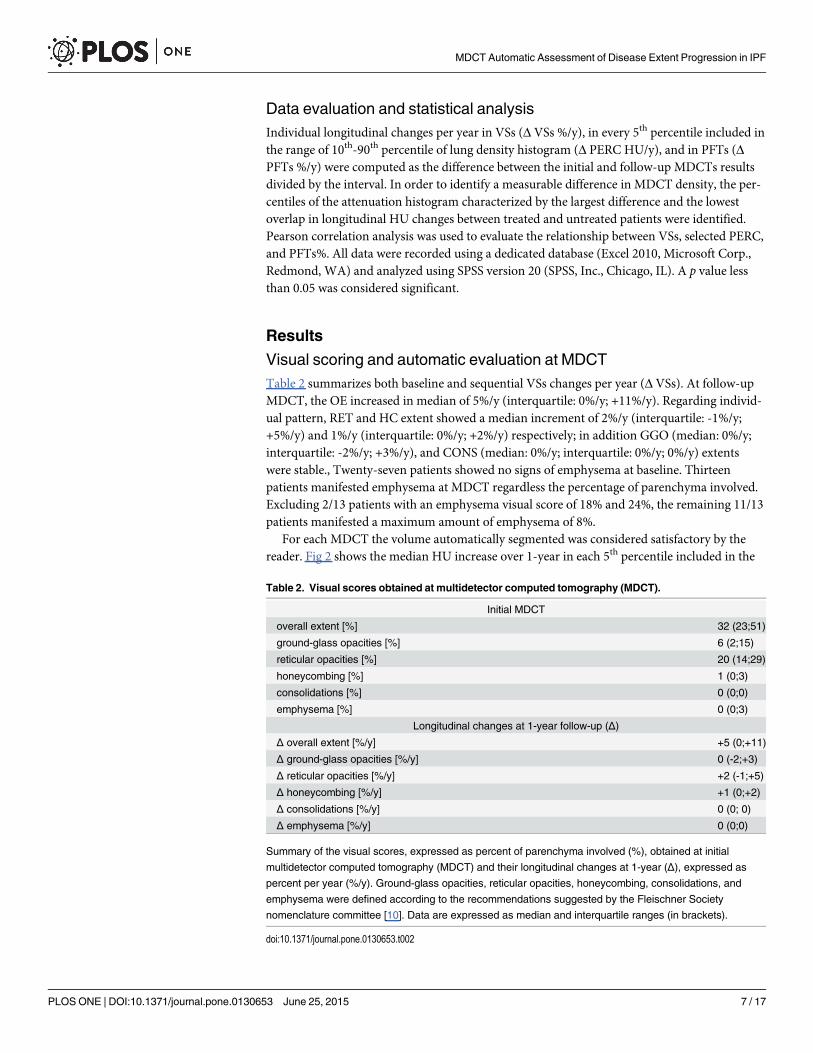
Visual scoring and automatic evaluation at MDCTTable 2 summarizes both baseline and sequential VSs changes per year (Δ VSs). At follow-upMDCT, the OE increased in median of 5%/y (interquartile: 0%/y; +11%/y). Regarding individ-ual pattern, RET and HC extent showed a median increment of 2%/y (interquartile: -1%/y;+5%/y) and 1%/y (interquartile: 0%/y; +2%/y) respectively; in addition GGO (median: 0%/y;interquartile: -2%/y; +3%/y), and CONS (median: 0%/y; interquartile: 0%/y; 0%/y) extentswere stable., Twenty-seven patients showed no signs of emphysema at baseline. Thirteenpatients manifested emphysema at MDCT regardless the percentage of parenchyma involved.Excluding 2/13 patients with an emphysema visual score of 18% and 24%, the remaining 11/13patients manifested a maximum amount of emphysema of 8%.
For each MDCT the volume automatically segmented was considered satisfactory by thereader. Fig 2 shows the median HU increase over 1-year in each 5th percentile included in the
Table 2. Visual scores obtained at multidetector computed tomography (MDCT).
Initial MDCT
overall extent [%] 32 (23;51)
ground-glass opacities [%] 6 (2;15)
reticular opacities [%] 20 (14;29)
honeycombing [%] 1 (0;3)
consolidations [%] 0 (0;0)
emphysema [%] 0 (0;3)
Longitudinal changes at 1-year follow-up (Δ)
Δ overall extent [%/y] +5 (0;+11)
Δ ground-glass opacities [%/y] 0 (-2;+3)
Δ reticular opacities [%/y] +2 (-1;+5)
Δ honeycombing [%/y] +1 (0;+2)
Δ consolidations [%/y] 0 (0; 0)
Δ emphysema [%/y] 0 (0;0)
Summary of the visual scores, expressed as percent of parenchyma involved (%), obtained at initial
multidetector computed tomography (MDCT) and their longitudinal changes at 1-year (Δ), expressed as
percent per year (%/y). Ground-glass opacities, reticular opacities, honeycombing, consolidations, and
emphysema were defined according to the recommendations suggested by the Fleischner Society
nomenclature committee [10]. Data are expressed as median and interquartile ranges (in brackets).
doi:10.1371/journal.pone.0130653.t002
MDCT Automatic Assessment of Disease Extent Progression in IPF
PLOSONE | DOI:10.1371/journal.pone.0130653 June 25, 2015 7 / 17
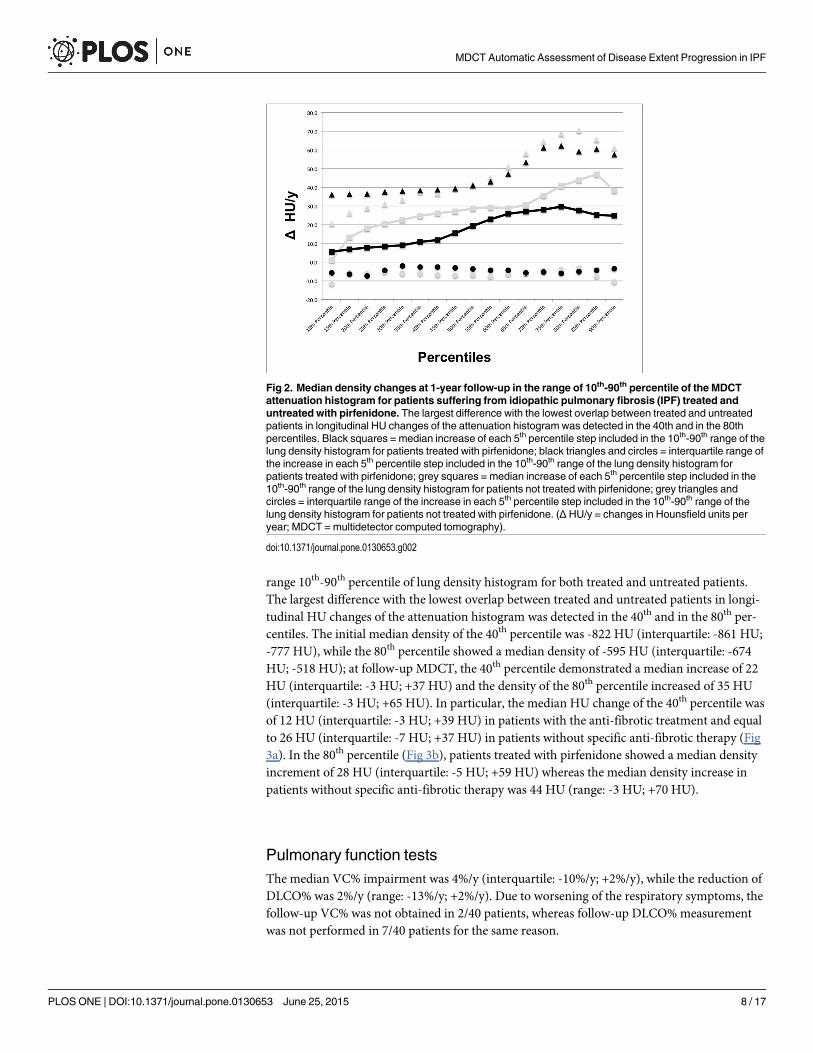
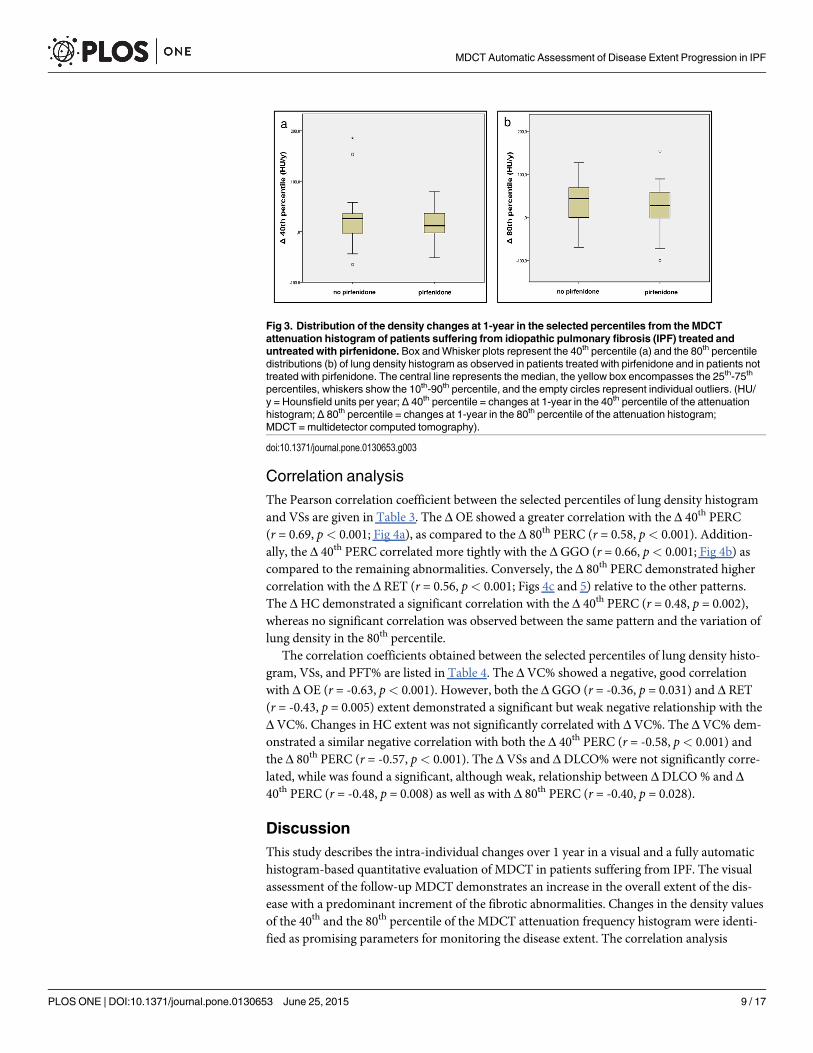
range 10th-90th percentile of lung density histogram for both treated and untreated patients.The largest difference with the lowest overlap between treated and untreated patients in longi-tudinal HU changes of the attenuation histogram was detected in the 40th and in the 80th per-centiles. The initial median density of the 40th percentile was -822 HU (interquartile: -861 HU;-777 HU), while the 80th percentile showed a median density of -595 HU (interquartile: -674HU; -518 HU); at follow-up MDCT, the 40th percentile demonstrated a median increase of 22HU (interquartile: -3 HU; +37 HU) and the density of the 80th percentile increased of 35 HU(interquartile: -3 HU; +65 HU). In particular, the median HU change of the 40th percentile wasof 12 HU (interquartile: -3 HU; +39 HU) in patients with the anti-fibrotic treatment and equalto 26 HU (interquartile: -7 HU; +37 HU) in patients without specific anti-fibrotic therapy (Fig3a). In the 80th percentile (Fig 3b), patients treated with pirfenidone showed a median densityincrement of 28 HU (interquartile: -5 HU; +59 HU) whereas the median density increase inpatients without specific anti-fibrotic therapy was 44 HU (range: -3 HU; +70 HU).
Pulmonary function testsThe median VC% impairment was 4%/y (interquartile: -10%/y; +2%/y), while the reduction ofDLCO% was 2%/y (range: -13%/y; +2%/y). Due to worsening of the respiratory symptoms, thefollow-up VC% was not obtained in 2/40 patients, whereas follow-up DLCO%measurementwas not performed in 7/40 patients for the same reason.
Fig 2. Median density changes at 1-year follow-up in the range of 10th-90th percentile of the MDCTattenuation histogram for patients suffering from idiopathic pulmonary fibrosis (IPF) treated anduntreated with pirfenidone. The largest difference with the lowest overlap between treated and untreatedpatients in longitudinal HU changes of the attenuation histogram was detected in the 40th and in the 80thpercentiles. Black squares = median increase of each 5th percentile step included in the 10th-90th range of thelung density histogram for patients treated with pirfenidone; black triangles and circles = interquartile range ofthe increase in each 5th percentile step included in the 10th-90th range of the lung density histogram forpatients treated with pirfenidone; grey squares = median increase of each 5th percentile step included in the10th-90th range of the lung density histogram for patients not treated with pirfenidone; grey triangles andcircles = interquartile range of the increase in each 5th percentile step included in the 10th-90th range of thelung density histogram for patients not treated with pirfenidone. (Δ HU/y = changes in Hounsfield units peryear; MDCT = multidetector computed tomography).
doi:10.1371/journal.pone.0130653.g002
MDCT Automatic Assessment of Disease Extent Progression in IPF
PLOSONE | DOI:10.1371/journal.pone.0130653 June 25, 2015 8 / 17
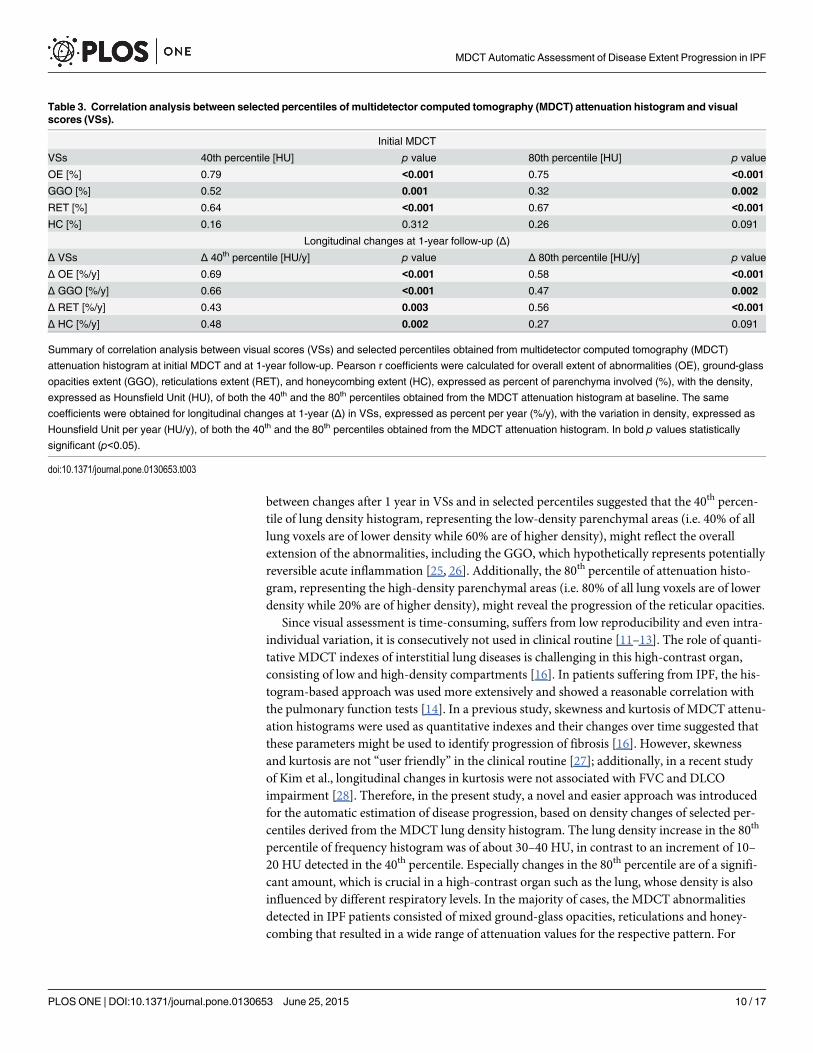
Correlation analysisThe Pearson correlation coefficient between the selected percentiles of lung density histogramand VSs are given in Table 3. The Δ OE showed a greater correlation with the Δ 40th PERC(r = 0.69, p< 0.001; Fig 4a), as compared to the Δ 80th PERC (r = 0.58, p< 0.001). Addition-ally, the Δ 40th PERC correlated more tightly with the Δ GGO (r = 0.66, p< 0.001; Fig 4b) ascompared to the remaining abnormalities. Conversely, the Δ 80th PERC demonstrated highercorrelation with the Δ RET (r = 0.56, p< 0.001; Figs 4c and 5) relative to the other patterns.The ΔHC demonstrated a significant correlation with the Δ 40th PERC (r = 0.48, p = 0.002),whereas no significant correlation was observed between the same pattern and the variation oflung density in the 80th percentile.
The correlation coefficients obtained between the selected percentiles of lung density histo-gram, VSs, and PFT% are listed in Table 4. The Δ VC% showed a negative, good correlationwith Δ OE (r = -0.63, p< 0.001). However, both the Δ GGO (r = -0.36, p = 0.031) and Δ RET(r = -0.43, p = 0.005) extent demonstrated a significant but weak negative relationship with theΔ VC%. Changes in HC extent was not significantly correlated with Δ VC%. The Δ VC% dem-onstrated a similar negative correlation with both the Δ 40th PERC (r = -0.58, p< 0.001) andthe Δ 80th PERC (r = -0.57, p< 0.001). The Δ VSs and ΔDLCO% were not significantly corre-lated, while was found a significant, although weak, relationship between Δ DLCO % and Δ40th PERC (r = -0.48, p = 0.008) as well as with Δ 80th PERC (r = -0.40, p = 0.028).
DiscussionThis study describes the intra-individual changes over 1 year in a visual and a fully automatichistogram-based quantitative evaluation of MDCT in patients suffering from IPF. The visualassessment of the follow-up MDCT demonstrates an increase in the overall extent of the dis-ease with a predominant increment of the fibrotic abnormalities. Changes in the density valuesof the 40th and the 80th percentile of the MDCT attenuation frequency histogram were identi-fied as promising parameters for monitoring the disease extent. The correlation analysis
Fig 3. Distribution of the density changes at 1-year in the selected percentiles from the MDCTattenuation histogram of patients suffering from idiopathic pulmonary fibrosis (IPF) treated anduntreated with pirfenidone. Box andWhisker plots represent the 40th percentile (a) and the 80th percentiledistributions (b) of lung density histogram as observed in patients treated with pirfenidone and in patients nottreated with pirfenidone. The central line represents the median, the yellow box encompasses the 25th-75th
percentiles, whiskers show the 10th-90th percentile, and the empty circles represent individual outliers. (HU/y = Hounsfield units per year; Δ 40th percentile = changes at 1-year in the 40th percentile of the attenuationhistogram; Δ 80th percentile = changes at 1-year in the 80th percentile of the attenuation histogram;MDCT = multidetector computed tomography).
doi:10.1371/journal.pone.0130653.g003
MDCT Automatic Assessment of Disease Extent Progression in IPF
PLOSONE | DOI:10.1371/journal.pone.0130653 June 25, 2015 9 / 17
between changes after 1 year in VSs and in selected percentiles suggested that the 40th percen-tile of lung density histogram, representing the low-density parenchymal areas (i.e. 40% of alllung voxels are of lower density while 60% are of higher density), might reflect the overallextension of the abnormalities, including the GGO, which hypothetically represents potentiallyreversible acute inflammation [25, 26]. Additionally, the 80th percentile of attenuation histo-gram, representing the high-density parenchymal areas (i.e. 80% of all lung voxels are of lowerdensity while 20% are of higher density), might reveal the progression of the reticular opacities.
Since visual assessment is time-consuming, suffers from low reproducibility and even intra-individual variation, it is consecutively not used in clinical routine [11–13]. The role of quanti-tative MDCT indexes of interstitial lung diseases is challenging in this high-contrast organ,consisting of low and high-density compartments [16]. In patients suffering from IPF, the his-togram-based approach was used more extensively and showed a reasonable correlation withthe pulmonary function tests [14]. In a previous study, skewness and kurtosis of MDCT attenu-ation histograms were used as quantitative indexes and their changes over time suggested thatthese parameters might be used to identify progression of fibrosis [16]. However, skewnessand kurtosis are not “user friendly” in the clinical routine [27]; additionally, in a recent studyof Kim et al., longitudinal changes in kurtosis were not associated with FVC and DLCOimpairment [28]. Therefore, in the present study, a novel and easier approach was introducedfor the automatic estimation of disease progression, based on density changes of selected per-centiles derived from the MDCT lung density histogram. The lung density increase in the 80th
percentile of frequency histogram was of about 30–40 HU, in contrast to an increment of 10–20 HU detected in the 40th percentile. Especially changes in the 80th percentile are of a signifi-cant amount, which is crucial in a high-contrast organ such as the lung, whose density is alsoinfluenced by different respiratory levels. In the majority of cases, the MDCT abnormalitiesdetected in IPF patients consisted of mixed ground-glass opacities, reticulations and honey-combing that resulted in a wide range of attenuation values for the respective pattern. For
Table 3. Correlation analysis between selected percentiles of multidetector computed tomography (MDCT) attenuation histogram and visualscores (VSs).
Initial MDCT
VSs 40th percentile [HU] p value 80th percentile [HU] p value
OE [%] 0.79 <0.001 0.75 <0.001
GGO [%] 0.52 0.001 0.32 0.002
RET [%] 0.64 <0.001 0.67 <0.001
HC [%] 0.16 0.312 0.26 0.091
Longitudinal changes at 1-year follow-up (Δ)
Δ VSs Δ 40th percentile [HU/y] p value Δ 80th percentile [HU/y] p value
Δ OE [%/y] 0.69 <0.001 0.58 <0.001
Δ GGO [%/y] 0.66 <0.001 0.47 0.002
Δ RET [%/y] 0.43 0.003 0.56 <0.001
Δ HC [%/y] 0.48 0.002 0.27 0.091
Summary of correlation analysis between visual scores (VSs) and selected percentiles obtained from multidetector computed tomography (MDCT)
attenuation histogram at initial MDCT and at 1-year follow-up. Pearson r coefficients were calculated for overall extent of abnormalities (OE), ground-glass
opacities extent (GGO), reticulations extent (RET), and honeycombing extent (HC), expressed as percent of parenchyma involved (%), with the density,
expressed as Hounsfield Unit (HU), of both the 40th and the 80th percentiles obtained from the MDCT attenuation histogram at baseline. The same
coefficients were obtained for longitudinal changes at 1-year (Δ) in VSs, expressed as percent per year (%/y), with the variation in density, expressed as
Hounsfield Unit per year (HU/y), of both the 40th and the 80th percentiles obtained from the MDCT attenuation histogram. In bold p values statistically
significant (p<0.05).
doi:10.1371/journal.pone.0130653.t003
MDCT Automatic Assessment of Disease Extent Progression in IPF
PLOSONE | DOI:10.1371/journal.pone.0130653 June 25, 2015 10 / 17
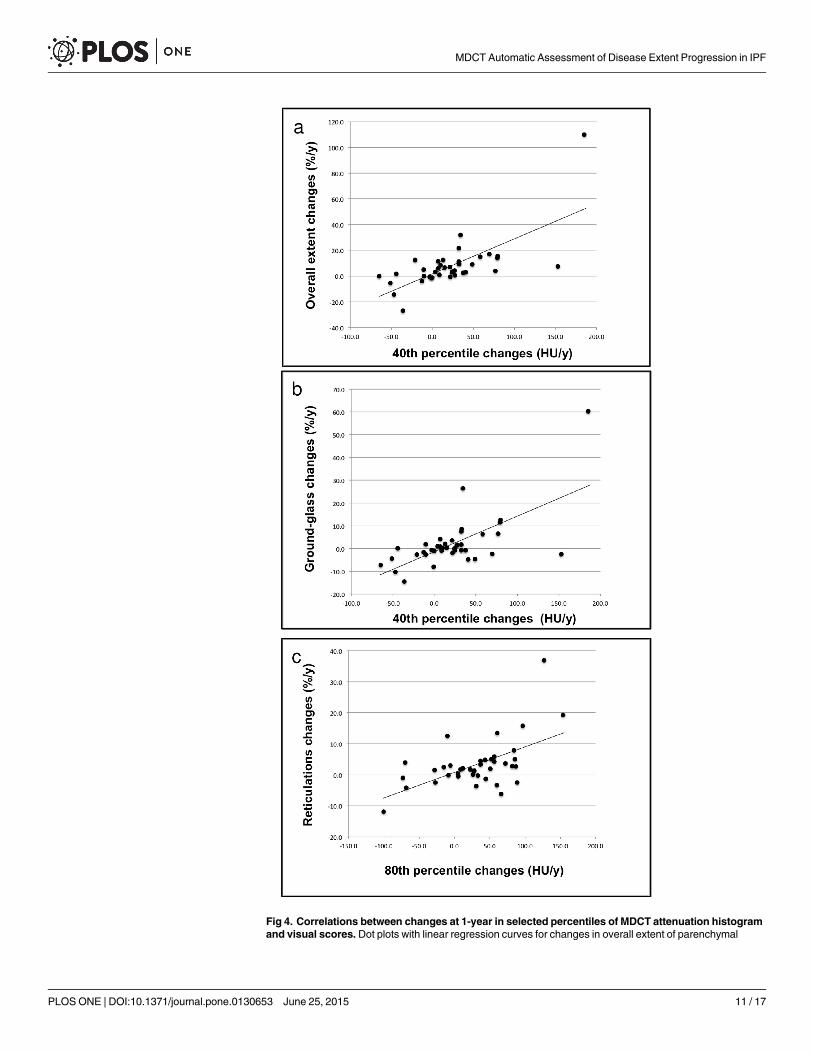
Fig 4. Correlations between changes at 1-year in selected percentiles of MDCT attenuation histogramand visual scores. Dot plots with linear regression curves for changes in overall extent of parenchymal
MDCT Automatic Assessment of Disease Extent Progression in IPF
PLOSONE | DOI:10.1371/journal.pone.0130653 June 25, 2015 11 / 17
abnormalities plotted against density variation in the 40th percentile of the MDCT attenuation histogram(r = 0.69, p < 0.001) (a), for the changes in ground-glass opacity extent plotted against density variation in the40th percentile of the MDCT attenuation histogram (r = 0.66, p < 0.001) (b), and for changes in reticulationsextent plotted against density variation in 80th percentile of the MDCT attenuation histogram (r = 0.56,p < 0.001) (c). (%/y = percent per year; HU/y = Hounsfield units per year; MDCT = multidetector computedtomography).
doi:10.1371/journal.pone.0130653.g004
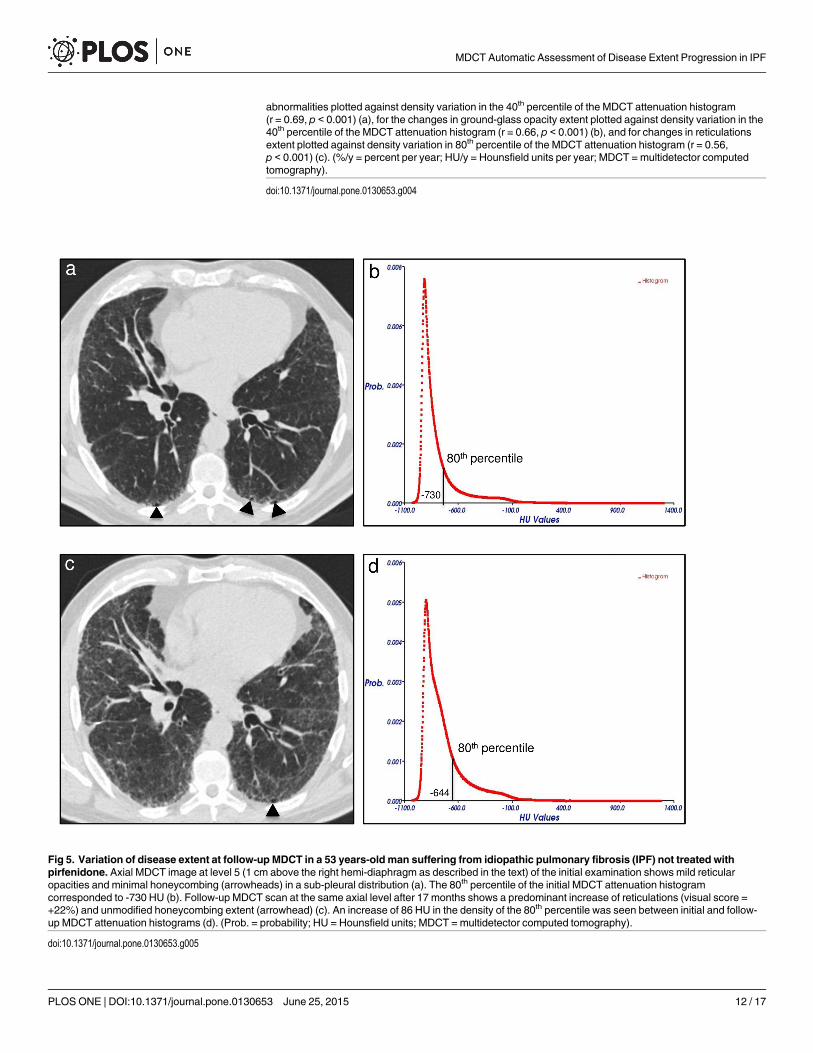
Fig 5. Variation of disease extent at follow-up MDCT in a 53 years-old man suffering from idiopathic pulmonary fibrosis (IPF) not treated withpirfenidone. Axial MDCT image at level 5 (1 cm above the right hemi-diaphragm as described in the text) of the initial examination shows mild reticularopacities and minimal honeycombing (arrowheads) in a sub-pleural distribution (a). The 80th percentile of the initial MDCT attenuation histogramcorresponded to -730 HU (b). Follow-up MDCT scan at the same axial level after 17 months shows a predominant increase of reticulations (visual score =+22%) and unmodified honeycombing extent (arrowhead) (c). An increase of 86 HU in the density of the 80th percentile was seen between initial and follow-up MDCT attenuation histograms (d). (Prob. = probability; HU = Hounsfield units; MDCT = multidetector computed tomography).
doi:10.1371/journal.pone.0130653.g005
MDCT Automatic Assessment of Disease Extent Progression in IPF
PLOSONE | DOI:10.1371/journal.pone.0130653 June 25, 2015 12 / 17
instance, an increase of the gross cystic changes results in a decrease of the average regionalHU values, possibly due to the air inside the cysts, in contrast to an increment of reticular opac-ities and ground-glass opacities extents that causes an increase of the MDCT attenuation [29].For this reason, the increase of the 80th percentile lung density, which represented the reticularopacities progression, was higher as compared to the increment observed in the 40th percentile,which probably reflected a combination of a predominant ground-glass pattern mixed withreticular opacities and honeycombing. Similarly to the findings obtained by Yoon et al., in thisstudy a relatively good correlation was demonstrated between the automatic and the visualquantification of the lung abnormalities extent, though higher correlation was seen betweenthe visual score of reticulations and correspondent automatic quantification (Table 3) [13].Furthermore, in another series the association between the visual and the automatic quantifica-tion of fibrotic pattern was weak [9]. For these reasons, the automatic quantification based ondensity changes of selected percentiles derived from attenuation histogram might be more reli-able in distinguishing the different IPF abnormalities than Gaussian histogram normalized cor-relation (GNHC) and texture analysis based on statistical descriptors of frequency histogram(i.e mean, standard deviation, skewness and kurtosis) used in the above mentioned studies [9,13, 30].
The assessment of the relationship between MDCT features and functional status is chal-lenging. MDCT is unable to quantify the absolute severity of inflammatory and fibrotic disease
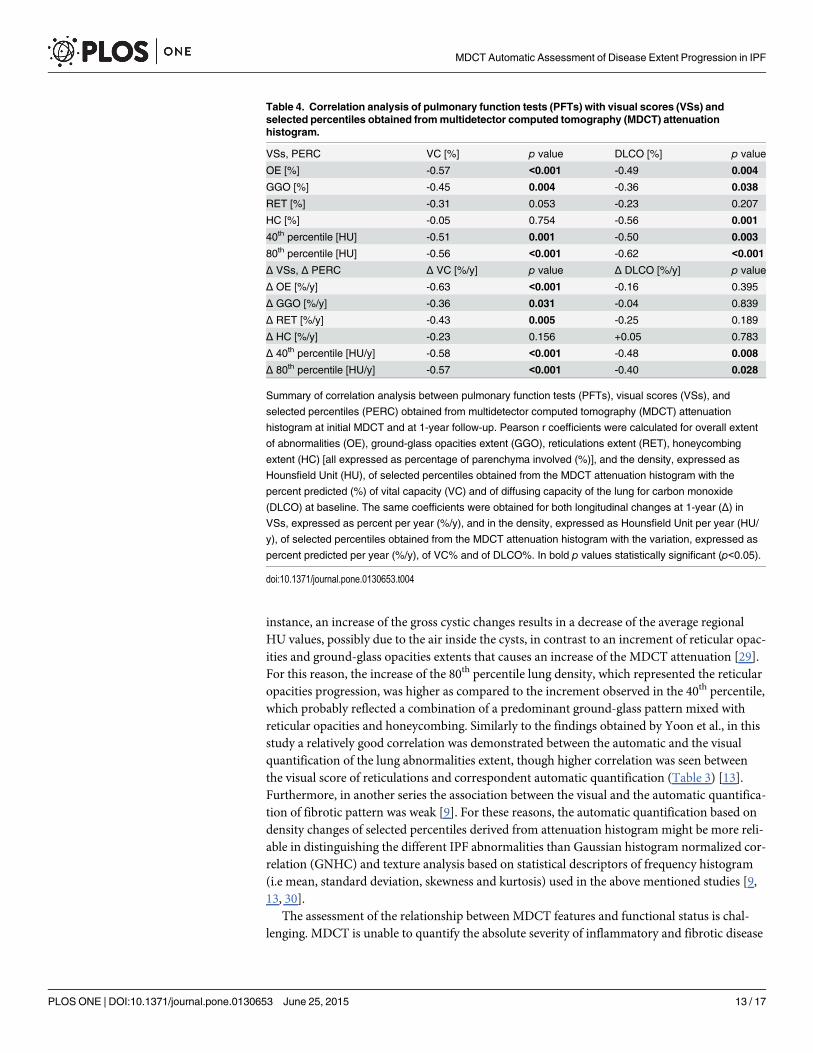
Table 4. Correlation analysis of pulmonary function tests (PFTs) with visual scores (VSs) andselected percentiles obtained frommultidetector computed tomography (MDCT) attenuationhistogram.
VSs, PERC VC [%] p value DLCO [%] p value
OE [%] -0.57 <0.001 -0.49 0.004
GGO [%] -0.45 0.004 -0.36 0.038
RET [%] -0.31 0.053 -0.23 0.207
HC [%] -0.05 0.754 -0.56 0.001
40th percentile [HU] -0.51 0.001 -0.50 0.003
80th percentile [HU] -0.56 <0.001 -0.62 <0.001
Δ VSs, Δ PERC Δ VC [%/y] p value Δ DLCO [%/y] p value
Δ OE [%/y] -0.63 <0.001 -0.16 0.395
Δ GGO [%/y] -0.36 0.031 -0.04 0.839
Δ RET [%/y] -0.43 0.005 -0.25 0.189
Δ HC [%/y] -0.23 0.156 +0.05 0.783
Δ 40th percentile [HU/y] -0.58 <0.001 -0.48 0.008
Δ 80th percentile [HU/y] -0.57 <0.001 -0.40 0.028
Summary of correlation analysis between pulmonary function tests (PFTs), visual scores (VSs), and
selected percentiles (PERC) obtained from multidetector computed tomography (MDCT) attenuation
histogram at initial MDCT and at 1-year follow-up. Pearson r coefficients were calculated for overall extent
of abnormalities (OE), ground-glass opacities extent (GGO), reticulations extent (RET), honeycombing
extent (HC) [all expressed as percentage of parenchyma involved (%)], and the density, expressed as
Hounsfield Unit (HU), of selected percentiles obtained from the MDCT attenuation histogram with the
percent predicted (%) of vital capacity (VC) and of diffusing capacity of the lung for carbon monoxide
(DLCO) at baseline. The same coefficients were obtained for both longitudinal changes at 1-year (Δ) in
VSs, expressed as percent per year (%/y), and in the density, expressed as Hounsfield Unit per year (HU/
y), of selected percentiles obtained from the MDCT attenuation histogram with the variation, expressed as
percent predicted per year (%/y), of VC% and of DLCO%. In bold p values statistically significant (p<0.05).
doi:10.1371/journal.pone.0130653.t004
MDCT Automatic Assessment of Disease Extent Progression in IPF
PLOSONE | DOI:10.1371/journal.pone.0130653 June 25, 2015 13 / 17
[29]. However, the correlation with both the VC% and the DLCO% decline achieved bychanges of histogram attenuation in the selected percentiles were higher than the relationshipobserved in previous studies between statistical descriptors of lung density histogram (mean,standard deviation, skewness and kurtosis) and the functional impairment [13–15]. Theseresults confirmed that histogram analysis based on the selected percentiles do better representthe decline of lung function over time than the investigation of the other frequency histogramfeatures above mentioned.
There are several limitations in this study besides those already described above. First, it is aretrospective data analysis on a small number of patients from a single center. However, thepresence of patients from only one center reduced the inter-scanner variability, which is a well-known drawback and limitation of any quantitative analysis and especially the automatic eval-uation [14]. Second, no spirometric gating in the acquisition of chest MDCT images was used,but each patient was trained to achieve a full end-inspiratory breath-hold. Also, Best et al. sug-gested that spirometric standardization might not be necessary for routine use [16]. Third,visual scores at CT were obtained by a single not-experienced reader. However, it is well-known that visual assessment suffers from inter-individual and even intra-individual variation,thus the visual analysis was not based upon a multi-reader special-expert board, but upon aconstant focus trained single reader under interactive guidance of experienced chest radiolo-gists [11–13]. In addition, correlations with percentiles obtained in the present study weregood, therefore they are expected higher if visual scores are obtained by experienced readers.Fourth, there is a weakness in the automatic segmentation provided by the in-house software,which was initially developed for emphysema quantification with corresponding algorithmsfor lung contour detection. The software expected a low-density lung parenchyma while IPF-patients show a high-density lung parenchyma, leading to possible failures in the segmentationof the sub-pleural regions. Since IPF manifests to a relevant amount in the sub-pleural space,the segmentation algorithm fails to include parts of the affected lung as seen in a patient notincluded in this trial shown in Fig 1. This requires more sophisticated segmentation algorithmsthat take anatomical knowledge (rib, liver, etc.) into account and\or allow manual correction ofthe segmented volume. Such tools are under development but were not implemented in theYACTA software at the study time. This might have caused an underrepresentation of thehigh-density parts of the disease leading to higher values of e.g. the 80th percentile. However,during the planning phase of a software manual correction tool, was found a difference of 70ml (around 1–2% of the total lung volume) between the manual and the fully automatic seg-mentation volume. This difference might be regarded marginal considering that might benearly constant in the longitudinal MDCTs during the course of the disease. Fifth, the CT mea-surements were not corrected for eventually different lung volumes. This would affect densitymeasures significantly. Neither the visual scores, nor the attenuation percentiles were normal-ized for lung volumes. This should not affect the correlations results obtained in the presentstudy between such methods of quantification. However, for future studies lung volume nor-malization is required, in order to eliminate the well-known limitation of sub-optimal inspira-tion during MDCT scan [31]. Sixth, the patients analyzed were treated or untreated resultingin very small subgroups. Since the purpose of this analysis was not to show treatment successbut only whether a follow-up can be quantified automatically, the included population waschosen as it happens nowadays in clinical routine. This includes treated and untreated patientswith the aim of keeping the CT technology constant. Seventh, our study population includedtwo patients who underwent contrast-enhanced MDCT scans in order to mirror the typicalclinical environment. Iodinated contrast medium affects the lung attenuation [32]. However,to reduce this limitation, both baseline and follow-up MDCTs scan were obtained with identi-cal bolus triggering technique on the same scanner. Lastly, MDCT lung attenuation could be
MDCT Automatic Assessment of Disease Extent Progression in IPF
PLOSONE | DOI:10.1371/journal.pone.0130653 June 25, 2015 14 / 17
affected by congestive hearth failure and pulmonary embolism, which determine significantalterations of the lung density histogram, such as a shift to higher HU values or a reduction ofskewness and kurtosis [33, 34]. However, in the present study, the patients were regularlyscreened by echocardiography and hematic levels of brain natriuretic peptide (BNP). None ofthem suffered from congestive heart failure or pulmonary embolism at MDCT time.
ConclusionsVisual quantification of parenchymal abnormalities at multidetector computed tomographyover 1 year in IPF patients showed an increase in the overall extent of the disease, with a pre-dominant increment of the fibrotic abnormalities. The density changes in the 40th percentilemight reflect the overall extension of the lung abnormalities, in particular of the ground-glasspattern, which could represent potentially reversible acute inflammation; in addition, thechange in the 80th percentile might reveal the progression of the irreversible fibrotic reticularopacities. Future studies with a larger number of patients might focus upon these values.
AcknowledgmentsThis study was supported by grants from the Dietmar Hopp Stiftung, the Bundesministeriumfür Bildung und Forschung (BMBF) to the German Center for Lung Research (DZL)(82DZL00401, 82DZL00402, 82DZL00404), the Deutsche Forschungsgemeinschaft, and theRuprecht-Karls-Universität Heidelberg within the funding program Open Access Publishing.
Author ContributionsConceived and designed the experiments: DC JD FH HUKMK CPH. Performed the experi-ments: DC JD OWDNUO KP. Analyzed the data: DC JD TB NS MK CPH BO. Contributedreagents/materials/analysis tools: OW TB. Wrote the paper: DC HUK NS MK CPH.
References1. Raghu G, Collard HR, Egan JJ, Martinez FJ, Behr J, Brown KK, et al. An official ATS/ERS/JRS/ALAT
statement: idiopathic pulmonary fibrosis: evidence-based guidelines for diagnosis and management.Am J Respir Crit Care Med 2011; 183: 788–824. doi: 10.1164/rccm.2009-040GL PMID: 21471066
2. King TE Jr, Pardo A, Selman M. Idiopathic pulmonary fibrosis. Lancet 2011; 378: 1949–1961. doi: 10.1016/S0140-6736(11)60052-4 PMID: 21719092
3. Kreuter M. Pirfenidone: an update on clinical trial data and insights from everyday practice. Eur RespirRev 2014; 23: 111–117. doi: 10.1183/09059180.00008513 PMID: 24591668
4. King TE Jr, Bradford WZ, Castro-Bernardini S, Fagan EA, Glaspole I, Glassberg MK, et al. A phase 3trial of pirfenidone in patients with idiopathic pulmonary fibrosis. N Engl J Med 2014; 370: 2083–2092.doi: 10.1056/NEJMoa1402582 PMID: 24836312
5. Richeldi L, du Bois RM, Raghu G, Azuma A, Brown KK, Costabel U, et al. Efficacy and safety of ninte-danib in idiopathic pulmonary fibrosis. N Engl J Med 2014; 370: 2071–2082. doi: 10.1056/NEJMoa1402584 PMID: 24836310
6. du Bois RM, Weycker D, Albera C, Bradford WZ, Costabel U, Kartashov A, et al. Forced vital capacityin patients with idiopathic pulmonary fibrosis: test properties and minimal clinically important difference.Am J Respir Crit Care Med 2011; 184: 1382–1389. doi: 10.1164/rccm.201105-0840OC PMID:21940789
7. du Bois RM, Weycker D, Albera C, Bradford WZ, Costabel U, Kartashov A, et al. Ascertainment of indi-vidual risk of mortality for patients with idiopathic pulmonary fibrosis. Am J Respir Crit Care Med 2011;184: 459–466. doi: 10.1164/rccm.201011-1790OC PMID: 21616999
8. Mura M, Zompatori M, Pacilli AM, Fasano L, Schiavina M, Fabbri M. The presence of emphysema fur-ther impairs physiologic function in patients with idiopathic pulmonary fibrosis. Respir Care 2006; 51:257–265. PMID: 16533415
MDCT Automatic Assessment of Disease Extent Progression in IPF
PLOSONE | DOI:10.1371/journal.pone.0130653 June 25, 2015 15 / 17
9. Iwasawa T, Ogura T, Sakai F, Kanauchi T, Komagata T, Baba T, et al. CT analysis of the effect of pirfe-nidone in patients with idiopathic pulmonary fibrosis. Eur J Radiol 2014; 83: 32–38. doi: 10.1016/j.ejrad.2012.02.014 PMID: 22465123
10. Hansell DM, Bankier AA, MacMahon H, McLoud TC, Müller NL, Remy J. Fleischner Society: glossaryof terms for thoracic imaging. Radiology 2008; 246: 697–722. doi: 10.1148/radiol.2462070712 PMID:18195376
11. Watadani T, Sakai F, Johkoh T, Noma S, Akira M, Fujimoto K, et al. Interobserver variability in the CTassessment of honeycombing in the lungs. Radiology 2013; 266: 936–44. doi: 10.1148/radiol.12112516 PMID: 23220902
12. Azuma A, Nukiwa T, Tsuboi E, Suga M, Abe S, Nakata K, et al. Double-blind, placebo-controlled trial ofpirfenidone in patients with idiopathic pulmonary fibrosis. Am J Respir Crit Care Med 2005; 171: 1040–1047. PMID: 15665326
13. Yoon RG, Seo JB, Kim N, Lee HJ, Lee SM, Lee YK, et al. Quantitative assessment of change inregional disease patterns on serial HRCT of fibrotic interstitial pneumonia with texture-based auto-mated quantification system. Eur Radiol 2013; 23: 692–701. doi: 10.1007/s00330-012-2634-8 PMID:22918563
14. Best AC, Lynch AM, Bozic CM, Miller D, Grunwald GK, Lynch DA. Quantitative CT indexes in idiopathicpulmonary fibrosis: relationship with physiologic impairment. Radiology 2003; 228: 407–414. PMID:12802000
15. Sverzellati N, Calabrò E, Chetta A, Concari G, Larici AR, Mereu M et al. Visual score and quantitativeCT indices in pulmonary fibrosis: relationship with physiologic impairment. Radiol Med 2007; 112:1160–1172. doi: 10.1007/s11547-007-0213-x PMID: 18193399
16. Best AC, Meng J, Lynch AM, Bozic CM, Miller D, Grunwald GK, et al. Idiopathic pulmonary fibrosis:physiologic tests, quantitative CT indexes, and CT visual scores as predictors of mortality. Radiology2008; 246: 935–940. doi: 10.1148/radiol.2463062200 PMID: 18235106
17. Heussel CP, Herth FJ, Kappes J, Hantusch R, Hartlieb S, Weinheimer O, et al. Fully automatic quantita-tive assessment of emphysema in computed tomography: comparison with pulmonary function testingand normal values. Eur Radiol 2009; 19: 2391–2402. doi: 10.1007/s00330-009-1437-z PMID:19458953
18. American Thoracic Society (ATS), European Respiratory Society (ERS). Idiopathic pulmonary fibrosis:diagnosis and treatment. International consensus statement. Am J Respir Crit Care Med 2000; 161:646–664. PMID: 10673212
19. Oltmanns U, Kahn N, Palmowski K, Träger A, Wenz H, Heussel CP, et al. Pirfenidone in idiopathic pul-monary fibrosis—real life experience from a German tertiary referral center for interstitial lung diseases.Respiration 2014; 88: 199–207. doi: 10.1159/000363064 PMID: 25115833
20. Choo JY, Goo JM, Lee CH, Park CM, Park SJ, Shim MS. Quantitative analysis of emphysema and air-way measurements according to iterative reconstruction algorithms: comparison of filtered back projec-tion, adaptive statistical iterative reconstruction and model-based iterative reconstruction. Eur Radiol2014; 24: 799–806. doi: 10.1007/s00330-013-3078-5 PMID: 24275806
21. Walsh SL, Sverzellati N, Devaraj A, Wells AU, Hansell DM. Chronic hypersensitivity pneumonitis: highresolution computed tomography patterns and pulmonary function indices as prognostic determinants.Eur Radiol 2012; 22: 1672–1679. doi: 10.1007/s00330-012-2427-0 PMID: 22466512
22. Weinheimer O, Achenbach T, Bletz C, Duber C, Kauczor HU, Heussel CP. About objective 3-d analysisof airway geometry in computerized tomography. IEEE Trans Med Imaging 2008; 27: 64–74. doi: 10.1109/TMI.2007.902798 PMID: 18270063
23. Miller MR, Hankinson J, Brusasco V, Burgos F, Casaburi R, Coates A, et al. Standardisation of spirom-etry. Eur Respir J 2005; 26: 319–338. PMID: 16055882
24. Quanjer PH, Tammeling GJ, Cotes JE, Pedersen OF, Peslin R, Yernault YC. Lung volumes and forcedventilatory flows. Report Working Party Standardization of Lung Function Tests, European Communityfor Steel and Coal. Official Statement of the European Respiratory Society. Eur Respir J Suppl 1993;16: 5–40. PMID: 8499054
25. Ferguson EC, Berkowitz EA. Lung CT: Part 2, The interstitial pneumonias clinical, histologic, and CTmanifestations. AJR Am J Roentgenol 2012; 199: W464–476. PMID: 22997396
26. Westhoff M. Akut-auf-chronisches respiratorisches Versagen bei interstitiellen Pneumonien. Med KlinIntensivmed Notfmed. August 2014. Available: http://link.springer.com/article/10.1007%2Fs00063-014-0388-6.
27. Shin KE, Chung MJ, Jung MP, Choe BK, Lee KS. Quantitative computed tomographic indexes in dif-fuse interstitial lung disease: correlation with physiologic tests and computed tomography visual scores.J Comput Assist Tomogr 2011; 35: 266–271. doi: 10.1097/RCT.0b013e31820ccf18 PMID: 21412102
MDCT Automatic Assessment of Disease Extent Progression in IPF
PLOSONE | DOI:10.1371/journal.pone.0130653 June 25, 2015 16 / 17
28. Kim HJ, Brown MS, Chong D, Gjertson DW, Lu P, Kim HJ, et al. Comparison of the quantitative CTimaging biomarkers of idiopathic pulmonary fibrosis at baseline and early change with an interval of 7months. Acad Radiol 2015; 22: 70–80. doi: 10.1016/j.acra.2014.08.004 PMID: 25262954
29. Wells AU, King AD, Rubens MB, Cramer D, du Bois RM, Hansell DM. Lone cryptogenic fibrosing alveo-litis: a functional-morphologic correlation based on extent of disease on thin-section computed tomog-raphy. Am J Respir Crit Care Med 1997; 155: 1367–1375. PMID: 9105081
30. Lee Y, Seo JB, Lee JG, Kim SS, Kim N, Kang SH. Performance testing of several classifiers for differen-tiating obstructive lung diseases based on texture analysis at high-resolution computerized tomography(HRCT). Comput Methods Programs Biomed 2009; 93: 206–215. doi: 10.1016/j.cmpb.2008.10.008PMID: 19070933
31. Kauczor HU, Heussel CP, Fischer B, KlammR, Mildenberger P, Thelen M. Assessment of lung vol-umes using helical CT at inspiration and expiration: comparison with pulmonary function tests. AJR AmJ Roentgenol 1998; 171: 1091–1095. PMID: 9763003
32. Adams H, Bernard MS, McConnochie K. An appraisal of CT pulmonary density mapping in normal sub-jects. Clin Radiol 1991; 43: 238–242. PMID: 2025994
33. Kato S, Nakamoto T, Iizuka M. Early diagnosis and estimation of pulmonary congestion and edema inpatients with left-sided heart diseases from histogram of pulmonary CT number. Chest 1996; 109:1439–1445. PMID: 8769490
34. Matsuoka S, Kurihara Y, Yagihashi K, Niimi H, Nakajima Y. Quantification of thin-section CT lung atten-uation in acute pulmonary embolism: correlations with arterial blood gas levels and CT angiography.AJR Am J Roentgenol 2006; 186: 1272–1279. PMID: 16632718
MDCT Automatic Assessment of Disease Extent Progression in IPF
PLOSONE | DOI:10.1371/journal.pone.0130653 June 25, 2015 17 / 17