Embed Size (px)
Citation preview

Davidson6 has suggested that the describing functionsfor sinusoids above threshold are reasonably constantif an initial log-taking stage is assumed. The log-takingstage however, has a greater effect on high-contrastcomponents, with only a small effect on the much-low-er-contrast low-spatial-frequency components. Be-cause the differences between real steps and Cornsweetedges occur in the low-spatial-frequency region, thislog-taking stage does not yield adequate predictions forCornsweet edges.
Although this model was proposed principally as aheuristic device, its predictions are thought goodenough to consider refinements that could lead to im-proved predictions. More-extensive direct measure-ments of the suprathreshold visual describing functionwould be valuable. Recalculations would show whetherthe model, with the necessity for a describing functionthat changes with contrast, is consistent with experi-mental data. The bandwidth of visual spatial-frequencychannels probably varies; this has not been taken intoaccount in the model. The bandwidths in this modelwere of a uniform size (approximately 0. 5 cycles/deg)that is very narrow relative to the estimates that appearin the literature.
Of considerable interest is the mechanism that cre-ates a visual step, allowing the real step and Cornsweetedge to look identical at low contrast when the visualsystem apparently does not pass the low-frequency in-formation. This mechanism is not presently known.
*Part of this material was presented at the Annual Meeting ofthe Optical Society of America, Houston, October, 1974.
tNow at the Institute of Optics, University of Rochester, Roch-ester, N. Y.
tVivian O'Brien, "Contour Perception, Illusion and Reality," J.Opt. Soc. Am. 48, 112-119 (1958).
2 T. N. Cornsweet, Visual Perception (Academic, New York,1970), p. 270.
3 F. Ratliff, "Contour and contrast," Proc. Am. Philos. Soc.115, 150-163 (1971).
4The luminance (L) viewed through perfect polarizers in thisconfiguration varies with the angle (6) of the third polarizer:L =sin2t +9cos2 0. Therefore, L is constant for any value of i.For the polarizers used in these measurements, L variedless than 5% over the range of 0 used. We wish to acknowl-edge the help of N. Weisstein who suggested this technique.
5C, Blakemore, J. Muncey, and E. Ridley, "Stimulus specifi-city in the human visual system," Vision Res. 13, 1915-1931(1973).
6M. Davidson, "Perturbation approach to spatial brightness in-teraction in human vision," J. Opt. Soc. Am. 58, 1300-1309(1968).
7A Hanning function weights the profile by a cosine one periodwide. Such a function reduces the effects of truncating theprofile at other than an integer multiple of the period. Thestep contrast has no period; the truncation at the edges of thewindow introduces erroneous side lobes on the frequencyspectrum. The price of such a weighting function is to slight-ly blur the spectrum. We applied the weighting function toboth the step and Cornsweet edges for consistency even thoughit was needed only in the case of the real step. A completediscussion of the Hanning function can be found in E. 0.Brigham, The Fast Fourier Transform (Prentice-Hall, En-glewood Cliffs, N.J., 1974), p. 141.
Visual texture discrimination using random-dot patternsStephen R. Purks* and Whitman Richards t
Massachusetts Institute of Technology, Cambridge, Massachusetts 02139(Received 27 July 1976; revision received 12 January 1977)
A method for generating random-dot textures is described that provides statistical control of any nadjacent points (n -grams), while leaving constant the statistics of shorter spans. The method thus allows theexperimenter to isolate statistics of n-grams of any span length to determine the nature of their influence ontexture discrimination. Variables that control phase are relatively unimportant. The most significant variablesare constraints imposed upon span lengths less than 3 that regulate gray level and spatial frequency content.However, span lengths of 3 or greater may still influence discrimination by altering the distribution of thespatial-frequency content.
In the early sixties Julesz' created computer-generatedpatterns with controlled high-order statistical proper-ties. 2 Although these patterns for the most part appearas random collections of dots, the patterns assume dif-ferent textures as the statistical properties of the dotsare altered. However, the texture of these patterns isunfamiliar. Therefore, Julesz argues, when subjectsare asked to discriminate such stimuli, they should beforced to use their more primitive visual mechanisms.
If Julesz's position is correct, thentheuse of random-dot patterns with controlled statistical properties isone method of revealing some basic organizing princi-ples of primitive information processing. Julesz' re-
sults suggested that the discrimination of random-dottexture patterns was based primarily on the analysis ofclusters or lines formed by proximate points of uniformbrightness. Because only controlled probability transi-tions of adjacent pairs of elements are required to gen-erate textures with different size clusters or runs ofpoints of equal brightness, Julesz considered and ac-cepted the possibility that third- and higher-order tran-sition probabilities were irrelevant to the human ob-server. Subsequently, however, Pollack3 has shownthat random-dot patterns differing only in their statis-tics for sequences of length three (tri-grams) can easilybe discriminated. 4 Going still one step further, weshow in Fig. 1 an example of two discriminable patterns
765 J. Opt. Soc. Am., Vol. 67, No. 6, June 1977 Copyright � 1977 by the Optical Society of America

FIG. 1. Texture pattern where upper and lower halves of fig-ure differ only in their 4-gram statistics. (See Table I for ac-tual distributions of run lengths.)
that differ only in their statistics for four adjacentpoints (4-gram). This discrimination of patterns de-spite identical 1-gram and 2-gram statistics raisesagain the question of the relation between the complexi-ty of the transition probability and the nature of visualdiscrimination. More explicitly, is there a direct re-lation between statistical dependencies and the processof visual discrimination? To answer this question, anew method was devised for generating patterns withcontrolled n-gram statistics. Then the method was ap-plied to isolate the effects of manipulating the statisticsof sequences of various lengths (or spans), while leav-ing invariant the statistics of shorter spans.
METHOD OF GENERATING TEXTURES
Binary sequences with transitions dependent on then - 1 previous points were generated on a PDP-8 orPDP-12 computer, and then were translated and readout on a Calcomp plotter to create the white= 0 andblack= 1 squares which made up the visual patterns.Each sequence was 2048 elements in length and wassliced and plotted as a rectangular half of a 64 x 64array. Generally, the slices were 64 elements longlaid parallel to the division between the two halves, ex-cept for control figures where 32-element slices werelaid perpendicular to the division. A second sequencewith different n-gram statistics filled the second halfof the array. To control for orientation preferences,all patterns were tested for discriminability with thedivider oriented both vertically and horizontally; thiswas accomplished simply by rotating the pattern.
To test for the discriminability of patterns that differonly in their statistics for spans greater than n, twoseparate sequences must be generated that differ intheir n-gram statistics, but which leave all shorterspan statistics identical. To accomplish this task, it isuseful to recognize that the generation of probabilisticsequences of length n may be defined completely by aset of transition probabilities for each of 2(n-1) possibleprevious subsequences of length n -1. To show this
more clearly, consider as a variable V, the binary val-ue for the jth position of a subsequence. Then,
Vi=O or 1.
Now let the a priori probability of the sequence oflength n be defined by P(V1, V2, ... , Va). But V, will beeither 0 or 1. Thus we may divide the a priori proba-bility of a sequence of length n into two probabilityfunctions for generating either a " 1" or a "0" followingthe shorter sequence of length n - 1. Let GI(VI,V2, ... , Vn-,) and G@(Vl, V2,. . ., V,,-) be these two prob-
abilities, where G1 is the probability set by the com-puter for generating a "1" immediately following thesequence V,, V2, . . ., V,,n and Go is its complement (i. e.,the probability of following V,, V2, .... V,,- with a 0).We thus have the following relations:
p(V 1, V2,*. * * V,-,, 1)
(1)
(2)
(3)
= P(V1 V2 .... X V,,-)*G 0 (V1 , V *,. .. , V,,-,)
P(v 1, V2, .. .* X n-1 I,)
= P(V1, V2,. . ., V,,, I* Go(Vi V,?, -. . V,,-,) I
G0(V1, Va . . . XV,,-,) = 1 - G1(VI, V2, . .. , V.-,) -
From the above, it should be clear that there are2 n-1 generation parameters, each corresponding to aGo( ), GI( ) pair for a particular sequence of lengthn-1. Each of the 2n-1 parameters may be independent-.ly varied to produce distinct n-gram statistics. How-ever, in general, we wish to compare patterns with dif-ferent n-gram statistics where the shorter span (n - 1)transition probabilities are fixed. Since the shorter(n - 1)-gram statistics are in turn determined by 2 (now)independent parameters, it follows that there are
2 (n-1) - 2 (n-2) = 2`2
independent generation parameters that determine con-straints on n-grams having fixed (n - 1)-gram statis-tics. This halving of the number of independent gen-eration parameters also follows directly from the re-lationship
PMv, V3, V n-I, 1 )
G= (1(, V2, V3, . V,, * P nl*(1, V2, V3, . nI)
+ c1(0, V2, V3, * Vn-1) * P(O, V2, V3, .. . , Vn l). (4)
Note that fixed (n - 1) gram contraints define values ofthe form P(v 1 , V2, V3,. .. , v n ) in the above equation.Thus the fixed (n - 1) gram statistics will determinea particular dependence between pairs of generationparameters of the form G1 (l, V2, V3 ,... * V,,.) andGc(0, V2, V3 , ... , Vnl).
ILLUSTRATION OF GENERATION METHOD
To illustrate the convenience of the above methodfor controlling n-gram statistics, consider Fig. 2.Each half of this figure has identical 1-gram and 2-gramstatistics with P(V1, V2)= 0.25 for all permissible val-ues of V1, V2. The top and bottom halves of the patternare clearly discernable, however, because there aresubstantial differences in their statistics for spans oflength 3 or more. To hold the 1- and 2-gram distribu-
766 J. Opt. Soc. Am., Vol. 67, No. 6, June 1977 S. R. Purks and W. Richards 766

FIG. 2. Texture pattern with identical 1- and 2-gram statis-tics in the top and bottom half. This is a scale reference figurehaving the value 2.
tion constant in both half-fields, the following genera-tion parameters were used:
Bottom field
GQ(00) = 0. 95
G,(01) = 0. 95
G,(10) = 0. 05
G 1(ll) = 0. 05
Top field
G,(00) = 0.05
GQ(01) = 0. 05
G 1 0) = 0. 95
G1 (ll) = 0. 95
Note that in each half-field, G,(00) + G1 (10) = 1 and
G1(01)+ G1 (ll)= 1, or more generally, that
G1(0, V2)+ G1(1, V2)= 1
Thus, Eq. (4) is satisfied for uniform 2-gram statis-tics. The 3-gram distributions, i. e., the values ofP(V1, V2, V3,), then follow straightforwardly from thegeneration parameters according to Eqs. (1) and (2).
TEST PROCEDURES
Following pilot studies, nine patterns were chosenfor discrimination testing on six subjects (four naiveplus the two authors). Each pattern was 5 in. squareand contained two subfields of equal size that dividedthe square either right-left or top-bottom. Both orien-tations were used for each pattern. The task of thesubject was to report first the orientation of the divi-sion between the fields, i. e., top-bottom or left-right.Then he assigned a number to indicate the magnitudeof the discriminable difference between the two sub-fields. The experimenter recorded this magnitude esti-mate as a negative value if the subject's perceived di-vision disagreed with the actual objective division.
To assist each subject in assigning numbers indicat-ing the discriminability of the texture pairs, three ref-erence patterns were in constant unobstructed view at1 m distance, subtending 80 visual angle. The firstwas completely random throughout and was assigned ascale value of 0. The second, which was identical tothe tested pattern displayed in Fig. 3, was assigned a
value of 1. A third picture (Fig. 2) with still greaterdifferences between the 3-gram statistics of each halfwas used to define the scale value 2 (see Table I forgeneration probabilities). Subjects were encouragedto use fractional scale values, and of course, couldalso use numbers larger than 2 if appropriate.
In addition to presenting patterns with different sta-tistical properties at the 1 m viewing distance, severalexperimental manipulations were introduced. Theseincluded (i) changing the viewing distance, (ii) blur,(iii) changing orientation to 450, and (iv) tilting the pat-
tern out of the frontal plane. For all of these manipula-tions, the average luminance of the patterns remainedin the photopic range near 250 cd/M2 .
RESULTS
Control of run-length
From Julesz's earlier studies, it was clear that ifthe average gray level of two patterns was identical,then the distribution of black and white run lengths ap-peared to be the most important variable in aiding tex-ture discrimination. Run length may be controlled byvarying the parameters controlling 3-gram generationwhile holding the 1- and 2-gram generation parametersconstant. Figure 3 is such an example. The top fieldof this figure favors runs (extent of uniform lightness)of length two, while the bottom field favors runs ofeither one or greater than two. Note that the overallimpression is one of a difference in "coarseness" of thetwo subfields. Such a difference may also be corre-lated with the distributions of spatial frequencies con-tained in the two fields, and hence a possible basis forthe discrimination is one based on a spatial-frequencyanalysis. 5
Because there are two independent generation param-eters for 3-grams with fixed 2-gram statistics, it ispossible to control both black and white run length in-
FIG. 3. Reference pattern having a value of 1. The 1- and 2-
gram statistics are constant (see Table I), whereas run lengthonly has been controlled by a suitable variation of the 3-gramstatistics. The top field favors runs of length two, while thebottom field favors runs of one or more than two.
S. R. Purks and W. Richards 767767 J. Opt. Soc. Am., Vol. 67, No. 6, June 1977
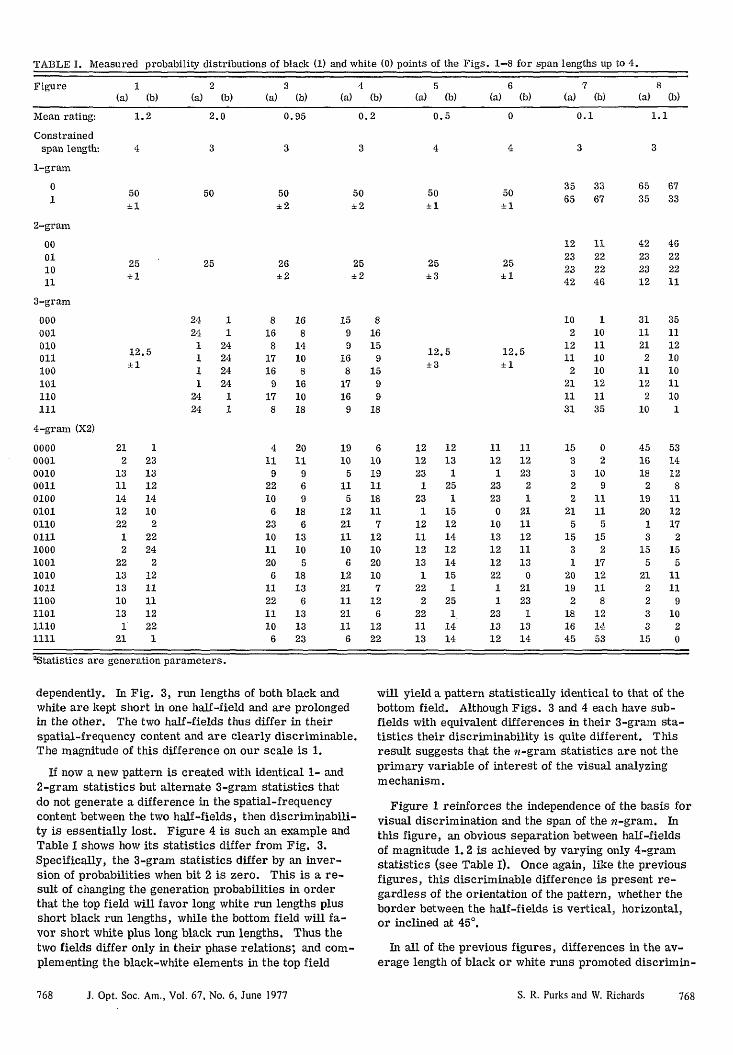
TABLE I. Measured probability distributions of black (1) and white (0) points of the Figs. 1-8 for span lengths up to 4.
Figure 1 2 3 4 5 6 7 8(a) (b) (a) (b) (a) (b) (a) (b) (a) (b) (a) (b) (a) (b) (a) (b)
Mean rating: 1.2 2.0 0.95 0.2 0.5 0 0.1 1.1
4
50±1
Constrainedspan length:
1-gram
01
2-gram
00011011
3-gram
000001010Ol100101110111
4-gram (X2)
0000000100100011010001010110011110001001101010111100110111101111
3
50±1
35 33 65 6765 67 35 33
12
25 23
±1 42
12.5±1
102
1211
2211131
12 12 11 11 1512 13 12 12 323 1 1 23 3
1 25 23 2 223 1 23 1 21 15 0 21 21
12 12 10 11 511 14 13 12 1512 12 12 11 313 14 12 13 1
1 15 22 0 2022 1 1 21 19
2 25 1 23 222 1 23 1 1811 14 13 13 1613 14 12 14 45
11222246
110111010121135
0
210
9
1111
5152
1712118
121453
'Statistics are generation parameters.
dependently. In Fig. 3, run lengths of both black andwhite are kept short in one half-field and are prolongedin the other. The two half-fields thus differ in theirspatial-frequency content and are clearly discriminable.The magnitude of this difference on our scale is 1.
If now a new pattern is created with identical 1- and2-gram statistics but alternate 3-gram statistics thatdo not generate a difference in the spatial-frequencycontent between the two half-fields, then discriminabili-ty is essentially lost. Figure 4 is such an example andTable I shows how its statistics differ from Fig. 3.Specifically, the 3-gram statistics differ by an inver-sion of probabilities when bit 2 is zero. This is a re-sult of changing the generation probabilities in orderthat the top field will favor long white run lengths plusshort black run lengths, while the bottom field will fa-vor short white plus long black run lengths. Thus thetwo fields differ only in their phase relations; and com-plementing the black-white elements in the top field
will yield a pattern statistically identical to that of thebottom field. Although Figs. 3 and 4 each have sub-fields with equivalent differences in their 3-gram sta-tistics their discriminability is quite different. Thisresult suggests that the n-gram statistics are not theprimary variable of interest of the visual analyzingmechanism.
Figure 1 reinforces the independence of the basis forvisual discrimination and the span of the n-gram. Inthis figure, an obvious separation between half-fieldsof magnitude 1. 2 is achieved by varying only 4-gramstatistics (see Table I). Once again, like the previousfigures, this discriminable difference is present re-gardless of the orientation of the pattern, whether theborder between the half-fields is vertical, horizontal,or inclined at 450.
In all of the previous figures, differences in the av-erage length of black or white runs promoted discrimin-
768 J. Opt. Soc. Am., Vol. 67, No. 6, June 1977
4 3
5050±1
3
50±2
26±2
3
50± 2
25± 2
25±1
3
25
12.5±1
25±3
12.5±3
24241111
2424
11
24242424
11
8168
17169
178
4119
22106
231011206
112211106
168
14108
161018
2011
969
186
1310
518136
131323
1599
168
17169
1910
5115
122111106
12211121116
816159
1599
18
610191118117
121020107
126
1222
212
131114122212
2213131013
121
123131214102
2224212111112221
42232312
3111212
11122
10
4516182
1920
13
155
212233
15
46222211
35111210101110
1
5314128
1112172
155
1111
91020
S. R. Purks and W. Richards 768

FIG. 4. Controlled 3-gram statistics. The spatial frequencycontent of both half-fields is the same, but the two fields havea difference in their 3-gram statistics which is comparable tothat in Fig. 3. The top and bottom halves of the figure differonly in their phase relationships.
ation between the half-fields. Such runs are controlledlargely by the 2-gram statistics. With controlled 4-gram statistics it is possible to keep the distribution ofrun lengths constant because there are four indepen-dent generation parameters, only two of which affectrun length distribution. Figure 5 is such an examplewhere the run length distributions are equivalent to"chance. " However, the right half-field favors "sym-metric" alternations such as 01010 or 110011, while theleft half-field favors asymmetric alternations such as11011 or 00100. Thus the half-fields do not differ intheir run length distributions but do differ in their spa-tial-frequency contents. For a vertically or horizontal-ly oriented border between the half-fields, the differ-ence is discriminable at a scale value of 0. 5. (Inciden-tally, this discrimination improves markedly if thefield is reduced by viewing at 5 m, whereas orientation
FIG. 5. Texture patterns with the distribution of run lengths
held constant by controlled 4-gram statistics. Discriminationis possible, having an average scale value of 0. 5. The rightand left of the figure differ in "symmetry" of the alternation ofblack-white transitions.
FIG. 6. Controlled 4-gram statistics as in Fig. 5, except thatthe directionality of black-white transitions is manipulated.No discrimination of top and bottom subfields.
at 450 degrades the differences.) Thus the distributionof run lengths is not a necessary basis for discrimina-tion, but the arrangement of runs affecting spatial-fre-quency content can be critical.
As still another example of the difficulty of predict-ing discrimination from n-gram statistics, considerFig. 6. Here again run length is chance as in the pre-vious Fig. 5, and only the alternation sequence is ma-nipulated as before. But in this case the two half-fields differ only in the direction of black-white transi-tions. For example, the top field favors sequencessuch as 010011, whereas the bottom half-field favors110010. Here the two fields have similar spatial fre-quency contents but differ in their phase preferences.No observer could reliably make this discrimination(scale value equalled 0), suggesting again that localphase information is lost during texture analysis.
Effect of gray level
In all of the previous figures, the 1- and 2-gram sta-tistics have been held fixed so that each square is equal-ly likely to be black or white independent of its immedi-ately adjacent neighbors. If now the probability of ob-taining a black square is twice that for obtaining awhite, then the overall gray level of the pattern willdarken as shown in Fig. 7. We may simultaneouslyvary the 3-gram statistics to control run lengths forwhite. The bottom half of the pattern favors runlengths of 2 for white, while the top half favors whiteruns of 1 or greater than 2. In this case, the discrim-ination is poor, yielding a scale value of magnitude 0. 1.
By taking the negative of Fig. 7, we change the graylevel and complement the run length distribution fromwhite to black. Except for the reversal in sign, there-fore, the statistics are identical. But this complemen-tary pattern, shown in Fig. 8, yields a much more dis-criminable difference between half-fields (scale valueequals 1. 1).6 Thus, once again, we demonstrate thatthe span of the statistical control alone is not criticalto the discrimination of textures. Run length alone is
769 J. Opt. Soc. Am., Vol. 67, No. 6, June 1977 S. R. Purks and W. Richards 769

FIG. 7. Texture patterns with the black squares twice as fre-quent as the white, thereby changing the gray level. The runlengths in each half of the pattern are controlled by 3-gramstatistics, as in Fig. 3. Discrimination of the top and bottomhalf-fields is poor, with a value 0.1.
also not a sufficiently isolated variable, but insteadmust at the least be subdivided into black runs and whiteruns, depending upon the average gray level of the pat-tern.
Global variations in spatial-requency content
If subjects are asked to analyze the basis for theirdiscriminations, all invariably indicate that the lengthof black or white runs (or clusters) is the most impor-tant clue. Such runs determine the major spatial-fre-quency components of the pattern, aside from the dotsize itself. Clearly, if a given pattern is viewed froma greater distance, then its spatial-frequency contentwill increase in proportion, whereas its statistical prop-erties will remain invariant (at least as long as the dotsmay be still resolved). If it is the statistical propertiesof the display that are important in controlling texturediscrimination, then any such change in viewing distancewill not change discrimination. In order to make thiscomparison between discrimination of patterns withfixed statistics but variable spatial-frequency content,several experimental manipulations were introduced.
1. Viewing distance. A change in the viewing dis-tance from 1 to 5 m generally altered the magnitude ofthis discrimination. The largest change occurred forFigs. 3 and 5, whose scale values, respectively, in-creased from 1 to 1. 3 and 0. 5 to 1. 1.
2. Blur. All patterns were also viewed throughspherical and cylindrical lenses of :k 6 diopter power inboth orientations. Spherical blur generally severelyreduced discrimination, with the sole exception of Figs.3 and 5. Cylindrical blur perpendicular to the direc-tion of the runs generally caused a degradation, reduc-ing the magnitude of the difference between half-fieldsto 80% of its original value without lenses. On theother hand, if blur was introduced parallel to the runs,then discrimination generally increased, often by asmuch as 50% (Figs. 1, 4, 5, 7). The difference due to
the direction of cylindrical blur is such that the latteraxis eliminated the high-frequency content introducedby the dots in a string, thus "bringing out" the lower-frequency runs by streaking, whereas perpendicularblurring only eliminated the high-frequency spectracreated between dots lying above and below each other.Emphasizing the low-frequency content of the strings ofa pattern thus aids the discrimination of random-dottextures.
3. Tilt. A further manipulation of the spatial-fre-quency content of the patterns was obtained by tilting thepatterns out of the frontal plane by about 800 (i. e., asnear the sagittal plane as possible without loss of dotresolution). With the viewing distance now reduced toabout 50 cm, the range of spatial frequencies thus var-ied as a gradient of about 25%. Figures 1, 5, and 8were most affected by this manipulation, with discrim-ination reduced almost to zero when the tilt was per-pendicular to the border between the half-fields, thuscreating a gradient in the direction of the runs. Nopattern was better discriminated when seen as tilted inany orientation. This result suggests that texture dis-crimination is easier if the spatial-frequency content oftexture pairs is constant, at least in the direction of thepairwise analysis.
DISCUSSION
Several of the experimental results suggest to us thatanalyzing textures in terms of the span of their statis-tical dependencies is not a fruitful approach to under-standing human texture perception. Although, asJulesz'"7 has pointed out earlier, there is a relationbetween 1- and 2-gram distributions and discrimina-tion, this relation strongly relates to visual perceptiononly for the shortest span lengths that control gray lev-el. These short span dependencies are also the leastaffected by viewing distance, for the achromatic vari-able is intensive, and not extensive as in the case ofspatial-frequency content, which is controlled by longerspan statistics. Clearly, if the visual system analyzespatterns in a manner dependent upon angular subtense,
'IFu
FIG. 8. Identical to Fig. 7, except that the white points havebeen complemented to black and vice versa. Discriminationis now increased to 1.1.
770 J. Opt. Soc. Am., Vol. 67, No. 6, June 1977 S. R. Purks and W. Richards 770
then the statistics of a pattern become an almost irrele-vant variable. That the spatial-frequency content is animportant variable in pattern discrimination is alreadyobvious from many previous studies (Robson,8 Sachs,Nachmias, and Robson,5 Graham and Nachmias,9 Stro-meyer and Julesz,' 0 and Stecher et al.11 The severalexperimental manipulations such as altered viewing dis-tance, and introducing blur, merely are demonstrationsof the obvious.
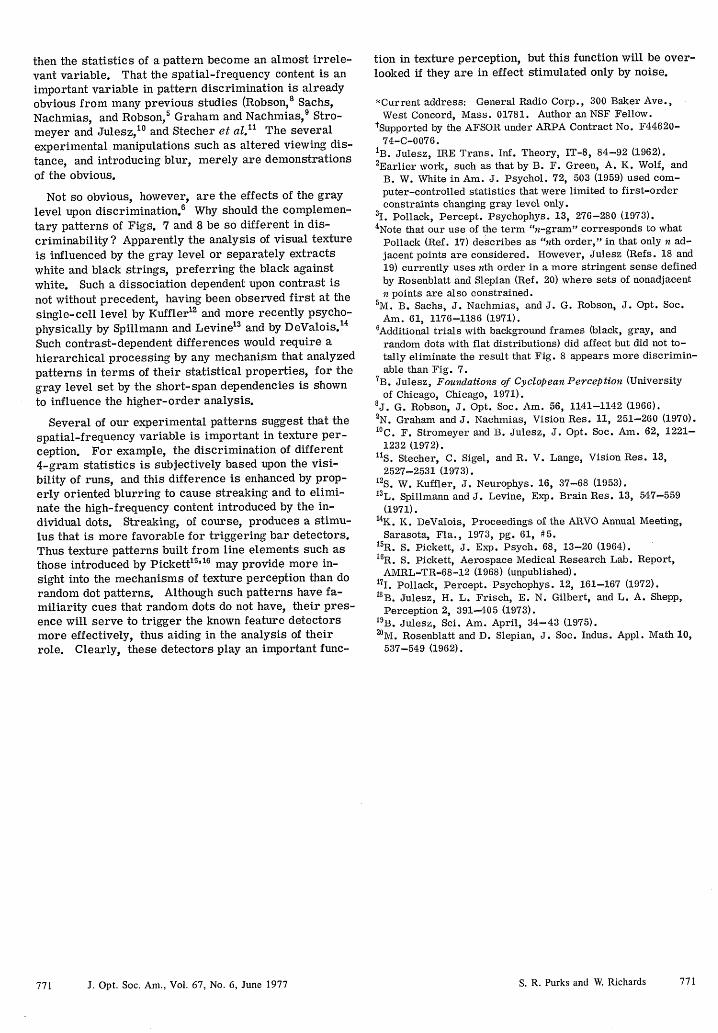
Not so obvious, however, are the effects of the graylevel upon discrimination. 6 Why should the complemen-tary patterns of Figs. 7 and 8 be so different in dis-criminability? Apparently the analysis of visual textureis influenced by the gray level or separately extractswhite and black strings, preferring the black againstwhite. Such a dissociation dependent upon contrast isnot without precedent, having been observed first at thesingle-cell level by Kuffler12 and more recently psycho-physically by Spillmann and Levine 13 and by DeValois. 14
Such contrast-dependent differences would require ahierarchical processing by any mechanism that analyzedpatterns in terms of their statistical properties, for thegray level set by the short-span dependencies is shownto influence the higher-order analysis.
Several of our experimental patterns suggest that thespatial-frequency variable is important in texture per-ception. For example, the discrimination of different4-gram statistics is subjectively based upon the visi-bility of runs, and this difference is enhanced by prop-erly oriented blurring to cause streaking and to elimi-nate the high-frequency content introduced by the in-dividual dots. Streaking, of course, produces a stimu-lus that is more favorable for triggering bar detectors.Thus texture patterns built from line elements such asthose introduced by Pickett1 5 116 may provide more in-sight into the mechanisms of texture perception than dorandom dot patterns. Although such patterns have fa-miliarity cues that random dots do not have, their pres-ence will serve to trigger the known feature detectorsmore effectively, thus aiding in the analysis of theirrole. Clearly, these detectors play an important func-
tion in texture perception, but this function will be over-looked if they are in effect stimulated only by noise.
*Current address: General Radio Corp., 300 Baker Ave.,West Concord, Mass. 01781. Author an NSF Fellow.
tSupported by the AFSOR under ARPA Contract No. F44620-74-C-0076.
'B. Julesz, IRE Trans. Inf. Theory, IT-8, 84-92 (1962).2 Earlier work, such as that by B. F. Green, A. K. Wolf, and
B. W. White in Am. J. Psychol. 72, 503 (1959) used com-puter-controlled statistics that were limited to first-orderconstraints changing gray level only.
3I. Pollack, Percept. Psychophys. 13, 276-280 (1973).4Note that our use of the term "n-gram" corresponds to what
Pollack (Ref. 17) describes as "nth order," in that only n ad-jacent points are considered. However, Julesz (Refs. 18 and19) currently uses nth order in a more stringent sense definedby Rosenblatt and Slepian (Ref. 20) where sets of nonadjacentn points are also constrained.
5M. B. Sachs, J. Nachmias, and J. G. Robson, J. Opt. Soc.Am. 61, 1176-1186 (1971).
6Additional trials with background frames (black, gray, andrandom dots with flat distributions) did affect but did not to-tally eliminate the result that Fig. 8 appears more discrimin-able than Fig. 7.
7B. Julesz, Foundations of Cyclopean Perception (Universityof Chicago, Chicago, 1971).
8 J. G. Robson, J. Opt. Soc. Am. 56, 1141-1142 (1966).9N. Graham and J. Nachmias, Vision Res. 11, 251-260 (1970).10C. F. Stromeyer and B. Julesz, J. Opt. Soc. Am. 62, 1221-
1232 (1972).1S. Stecher, C. Sigel, and R. V. Lange, Vision Res. 13,
2527-2531 (1973).i2S. W. Kuffler, J. Neurophys. 16, 37-68 (1953).i3L. Spillmann and J. Levine, Exp. Brain Res. 13, 547-559
(1971).14 K. K. DeValois, Proceedings of the ARVO Annual Meeting,
Sarasota, Fla., 1973, pg. 61, #5.5R. S. Pickett, J. Exp. Psych. 68, 13-20 (1964).
16R. S. Pickett, Aerospace Medical Research Lab. Report,AMRL-TR-68-12 (1968) (unpublished).
171. Pollack, Percept. Psychophys. 12, 161-167 (1972).18B. Julesz, H. L. Frisch, E. N. Gilbert, and L. A. Shepp,
Perception 2, 391-405 (1973).19 B. Julesz, Sci. Am. April, 34-43 (1975).2 0M. Rosenblatt and D. Slepian, J. Soc. Indus. Appl. Math 10,
537-549 (1962).
771 J. Opt. Soc. Am., Vol. 67, No. 6, June 1977 S. R. Purks and W. Richards 771