Embed Size (px)
Citation preview
ELSEVIER Acta Psychologica 95 (1997) 165-179
acta psychologica
Visual search and the detection of abnormal readings in graphical displays
J. Greaney a,*, A.W. MacRae h a School of Education, University of Birmingham, Birmingham B15 277, UK
b School of Psychology, University of Birmingham, Birmingham B15 277, UK
Received 13 February 1995; revised 13 September 1995; accepted 8 December 1995
Abstract
Two experiments evaluated the properties of polygon displays and bar graphs as fault indicators for systems with many parameters. A modified visual search paradigm was used to test the effectiveness of different display configurations to be check-read for the presence of abnormal ( ' target ') readings. Whether the task was to detect the occurrence of a single abnormal (off-limits) parameter or count the number of abnormal parameters, both displays yielded response times and error rates that were independent of the total number (from 4 to 16) of displayed parameters. When the task was fault detection, the subjects performed equally well with both types of displays. When the task was counting the number of abnormalities, performance with the bar graph was independent of the number of abnormalities but performance with the polygon display was poorer overall and deteriorated with larger numbers of abnormalities. The results contradict either the proximity-compatibility hypothesis of Wickens or the traditional classification of polygons and bar graphs as typical integral and separable displays, respectively. The results are best characterized in terms of the similarity relations between and among 'target' and 'nontarget' parameters.
PsyclNFO classification: 2323; 4010
Keywords: Aviation safety; Graphical displays; Human factors engineering; Visual displays; Visual search
* Corresponding author. Now at: Research and Graduate School of Education, University of Manchester, Oxford Road, Manchester M13 9PL, UK, E-mail: [email protected], Fax: +44 161 275 7894, Tel.: +44 161 275 7282.
0001-6918/97/$17.00 Copyright © 1997 Elsevier Science B.V. All rights reserved. PII S0001-6918(96)00002-9
166 J. Greaney, A. W. MacRae / Acta Psychologica 95 (1997) 165-179
1. Introduction
1.1. Background
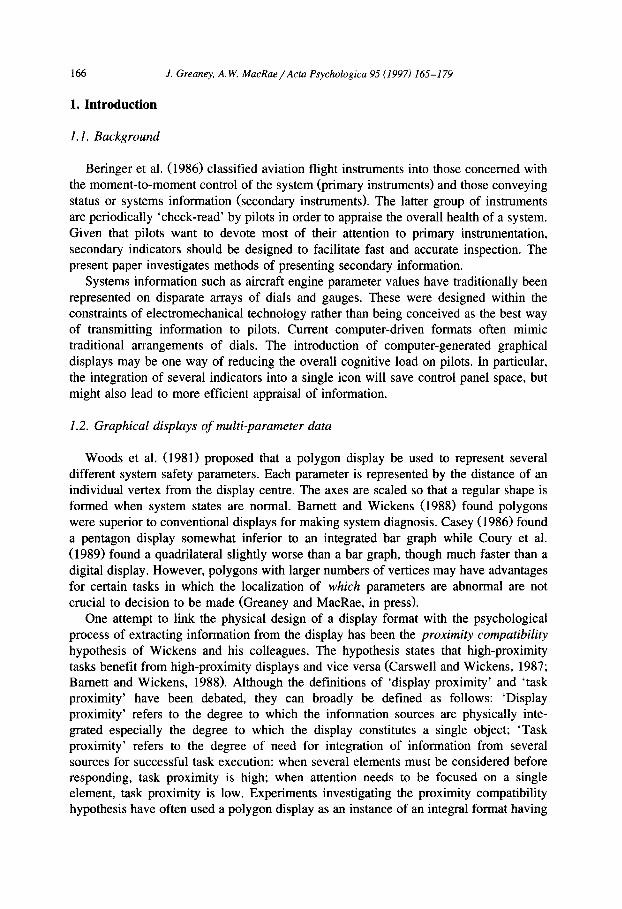
Beringer et al. (1986) classified aviation flight instruments into those concerned with the moment-to-moment control of the system (primary instruments) and those conveying status or systems information (secondary instruments). The latter group of instruments are periodically 'check-read' by pilots in order to appraise the overall health of a system. Given that pilots want to devote most of their attention to primary instrumentation, secondary indicators should be designed to facilitate fast and accurate inspection. The present paper investigates methods of presenting secondary information.
Systems information such as aircraft engine parameter values have traditionally been represented on disparate arrays of dials and gauges. These were designed within the constraints of electromechanical technology rather than being conceived as the best way of transmitting information to pilots. Current computer-driven formats often mimic traditional arrangements of dials. The introduction of computer-generated graphical displays may be one way of reducing the overall cognitive load on pilots. In particular, the integration of several indicators into a single icon will save control panel space, but might also lead to more efficient appraisal of information.
1.2. Graphical displays of multi-parameter data
Woods et al. (1981) proposed that a polygon display be used to represent several different system safety parameters. Each parameter is represented by the distance of an individual vertex from the display centre. The axes are scaled so that a regular shape is formed when system states are normal. Barnett and Wickens (1988) found polygons were superior to conventional displays for making system diagnosis. Casey (1986) found a pentagon display somewhat inferior to an integrated bar graph while Coury et al. (1989) found a quadrilateral slightly worse than a bar graph, though much faster than a digital display. However, polygons with larger numbers of vertices may have advantages for certain tasks in which the localization of which parameters are abnormal are not crucial to decision to be made (Greaney and MacRae, in press).
One attempt to link the physical design of a display format with the psychological process of extracting information from the display has been the proximity compatibility hypothesis of Wickens and his colleagues. The hypothesis states that high-proximity tasks benefit from high-proximity displays and vice versa (Carswell and Wickens, 1987; Barnett and Wickens, 1988). Although the definitions of 'display proximity' and 'task proximity' have been debated, they can broadly be defined as follows: 'Display proximity' refers to the degree to which the information sources are physically inte- grated especially the degree to which the display constitutes a single object; 'Task proximity' refers to the degree of need for integration of information from several sources for successful task execution: when several elements must be considered before responding, task proximity is high; when attention needs to be focused on a single element, task proximity is low. Experiments investigating the proximity compatibility hypothesis have often used a polygon display as an instance of an integral format having
J. Greaney, A.W. MacRae /Acta Psychologica 95 (1997) 165-179 167
high display proximity. Low display proximity has been represented by a bar graph, which is taken to be perceptually separable into its elements. Experimental evidence has been presented both in favour of (Barnett and Wickens, 1988) and against (Coury et al., 1989; Sanderson et al., 1989) the hypothesis that matching the proximity of task and display is advantageous.
The tasks required in the present study were 'low proximity', relying only on detection of one or more 'target' (abnormal) parameters. An analogy may be drawn between this task of check-reading a display for the presence of an abnormal reading and the visual search paradigm.
1.3. Visual search
In a typical visual-search experiment, an observer is asked to decide rapidly whether or not a multi-element display contains a particular 'target' element. The time needed for some target types does not depend on the number of displayed elements and that is often taken to imply 'pre-attentive', or 'parallel', processing. Response times that increase as a function of number of elements indicate a 'serial' search requiring focused attention. There is an obvious relation between the visual-search task and check-reading a display for abnormal states and it may be possible to improve the efficiency of fault detection if faults are signalled by perceptual features that are processed pre-attentively. For example, if an observer is presented with a display consisting of several vertical lines, a tilted line 'pops out' with no need to search through the display to detect it. It has long been recognized as good practice to arrange dial pointers so that in their normal positions they point in the same direction, making abnormal values easier to detect (Fitts, 1951).
According to feature-integration theory (Treisman and Gelade, 1980; Treisman and Gormican, 1988), simple visual features such as colour, orientation, common motion and form are registered in parallel across the visual field but detecting the conjunction of features requires focal attention. However, some emergent features produce flat search functions just like simple features. Treisman and Paterson (1984) concluded that the Gestalt property of 'closure' allows triangles to be detected in parallel against a background of lines and angles, though potentially emergent forms such as junctions and intersections formed by two straight lines (Treisman and Gormican, 1988) are not.
Duncan and Humphreys (1989) have proposed a continuum of search efficiency which is determined by target and nontarget similarities. Instead of a purely serial versus parallel distinction, the difficulty of search for a target element increases with increasing similarity of targets to nontargets (target salience) and decreasing similarity among nontargets (internal noise).
The results from visual search experiments have thus been interpreted within different theoretical frameworks. Nevertheless, the finding that simple and distinctive visual features can 'pop out' from a multi-element display, can have important implications for display design (Watson, 1991). For this reason, the visual search paradigm is a useful framework for interpreting results from experiments on display design and for guiding the design of optimal displays.
168 J. Greaney, A. W. MacRae /Acta Psychologica 95 (1997) 165-179
1.4. Visual search and graphical displays
Munson and Horst (1986) tried to identify the processing of polygon displays as holistic or sequential (equivalently, parallel or serial) by measuring the time taken to identify a display as normal or abnormal as a function of the number of vertices in the polygon. Serial processing of vertices would predict longer reaction times (RTs) when polygons had more vertices but they found no sign of that, indeed RTs instead declined with increasing numbers of vertices. Hughes and MacRae (1994) reported the same result with displays having up to 20 vertices.
It might be expected though that a bar graph, because it is separable rather than integral, would be processed serially, giving search times that increase as a function of the number of displayed parameters. However, the bar graph has 'emergent' properties, as noted by Coury et al. (1989): the tops of the bars form a contour which is distorted by an abnormal bar, and if a fixed line marks the limit of normality, a bar that is out of limits is cut by it, forming a new rectangle. This is a simple feature which could therefore produce pop-out.
In the present study the task of graphical display inspection was modelled in a laboratory environment using a modified visual search task.
1.5. The present study
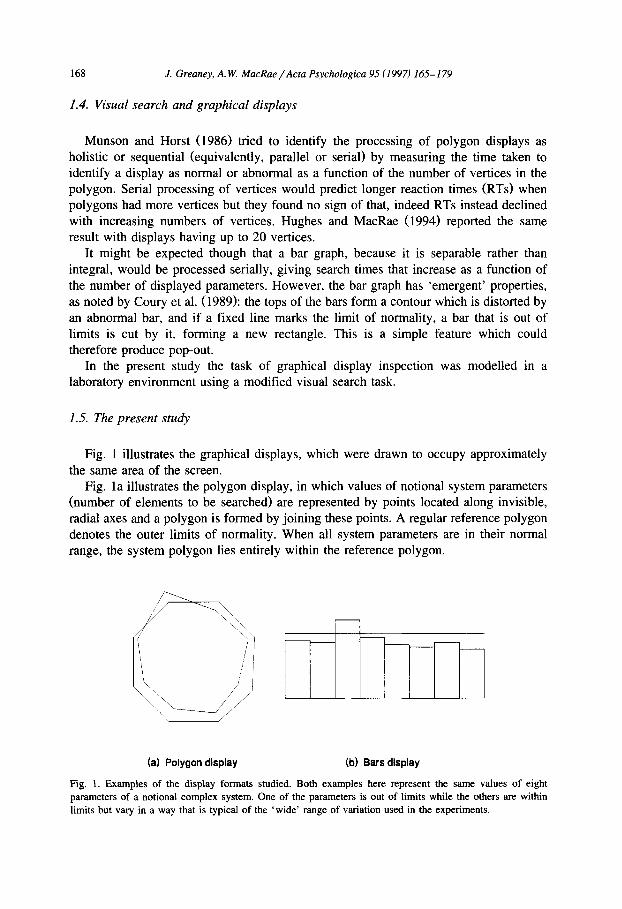
Fig. 1 illustrates the graphical displays, which were drawn to occupy approximately the same area of the screen.
Fig. la illustrates the polygon display, in which values of notional system parameters (number of elements to be searched) are represented by points located along invisible, radial axes and a polygon is formed by joining these points. A regular reference polygon denotes the outer limits of normality. When all system parameters are in their normal range, the system polygon lies entirely within the reference polygon.
\ , /
1 (a) Polygon display (b) Bars display
Fig. 1. Examples of the display formats studied. Both examples here represent the same values of eight parameters of a notional complex system. One of the parameters is out of limits while the others are within limits but vary in a way that is typical of the 'wide' range of variation used in the experiments.
J. Greaney, A. W. MacRae / Acta Psychologica 95 (1997) 165-179 169
Fig. lb illustrates the bar graph, in which parameter values are represented by the heights of yellow vertical bars above a common baseline. A horizontal reference line 29 mm above the baseline indicated the limit of normal values: a parameter was out of limits if the corresponding bar crossed the reference line.
The number of parameters in a display was 4, 8, 12 or 16. Much of the cited research used displays with fewer parameters, and did not manipulate the number of parameters as an experimental factor. Coury et al. (1989) and Barnett and Wickens (1988) used four parameters; Carswell and Wickens (1987) and Sanderson et al. (1989) used two triangles (six parameters). In real-world applications an operator may need to check large numbers of system readings, so a display's potential for representing many parameters should be evaluated.
Parameter variability has not been directly tested in any of the research cited. The more separable nature of the bar graph may allow focused attention on individual readings, which may therefore be less affected by parameter variability. System variabil- ity was manipulated by varying the band width of the nontargets. Targets were parameter values that deviated from the limit values by + 2 or + 6 mm, while nontargets were parameter values remaining within the range of normal values.
In many real situations the status information conveyed by the display would have to compete with more urgent and rapidly changing information. In the present study, graphical displays were positioned below a dynamic tracking task. The dynamic display was analogous to a 'primary' instrument and was designed to increase the overall workload in the laboratory environment. However, the tracking task was not designed to represent a particular primary instrument or to interfere significantly with the monitoring task. Rather, having two displays was thought to provide a better simulation of real-world demands than if subjects had to monitor the graphical displays alone.
In Experiment 1 a single parameter could be out of limits (0 or 1 target), and in Experiment 2, up to three out-of-limits parameters might be present in a display (0-3 targets).
2. Experiment 1
2.1. Method
2.1.1. Subjects
Eight volunteers aged 18-31 were paid to participate. All had normal or corrected- to-normal vision and were members of the School of Psychology, University of Birmingham.
2.1.2. Apparatus and stimuli
Displays were generated on an EGA colour monitor by a PC and all responses were made using a two-button mouse. Subjects sat approximately 500 mm from the screen in a dimly lit room. Graphical displays were centred 85 mm below the tracking-display centre, separating them vertically by 40 mm (about 4.6 deg visual angle). Polygons and bar graphs were drawn in yellow using outline shapes (i.e., not solid fill) and occupied
170 J. Greaney, A. W. MacRae / Acta Psychologica 95 (1997) 165-179
approximately the same area on the screen. For the polygon display, a continously-pre- sent green reference polygon with a radius of 29 mm (about 3.3 deg visual angle) was used to denote the limit of normality. For the bar graph, a single green line 29 mm above the baseline performed the same function. The total width of the bar graph was 88 mm (about 10.0 deg of visual angle) so the width of each bar depended on the number of parameters displayed. In both types of display, parameters were represented by positions along invisible axes, of 35 mm maximum length. Targets were parameter values that deviated from the limit values by + 2 or + 6 mm, while nontargets were parameter values remaining within the range of normal values (i.e., selected parameters - 2 or - 6 mm and nonselected parameters in a narrow or wide band). These remaining parameters had random values in a band that was either narrow (from 15.5 mm to 18.5 mm) or wide (from 15.5 mm to 23.5 mm).
2.1.3. Experimental design Each subject participated in 2 sessions of about 1 hour each. Each session was
divided into sixteen blocks, one for each combination of graphical display (bar graph or polygon), number of parameters (4, 8, 12 or 16) and level of nontarget variability (high or low). The order of blocks was randomized but the same sequence was then followed in all sessions, except that each subject entered the sequence at a different block and in the second session the order of presentation was reversed. Within each block of 24 trials there were equal numbers of displays with and without an out-of-limits parameter present. There was also a practice block consisting of 24 trials using the format from block 1 with 10 displayed parameters.
2.1.4. Experimental procedure A dynamic control task at the top of the screen consisted of keeping a symbolic
'spaceship' inside a blue rectangle 38 mm X 40 ram. A score at the top of the screen increased on each step while the spaceship remained within the rectangle but decreased if any part of it strayed outside. The subject performed compensatory, two-dimensional tracking with the mouse to keep the spaceship inside the rectangle and maximize the score. It changed direction and velocity every 0.2 sec, accompanied by a tone pulse which rose in pitch if any part of the spaceship passed out of the rectangle. The dynamic task required practically continuous control of the mouse, simulating the demands of the primary flying displays on pilots. If the spaceship had been within the rectangle for 50 per cent of the time, then the mean change in score would have been zero. The maximum possible score would have been achieved if the spaceship had remained within the rectangle throughout the experiment, and no response to the polygon had been made so the score accumulated for a further 2 seconds after the appearance of the variable display. In this case, the average increase of the tracking score per trial would have been 4.75 X 5 = 23.75. Conversely, the minimum possible score of -23 .75 would have occurred if no mouse movements or button presses were made. None of the subjects were observed to carry out either of these extreme strategies. Instead, subjects appeared to regard the whole situation as an integrated task, in which the demands of responding to both displays did not conflict.
Test displays appeared 2.75 sec after the trial had commenced and remained for up to
J. Greaney, A.W. MacRae/Acta Psychologica 95 (1997) 165-179 171
2 sec (obscuring the reference lines, if the displays overlapped). On each trial a single parameter was randomly assigned to one of four positions, 2 mm or 6 mm inside or outside the limit of parameter normality. These distances were used equally often within a block so that half the trials contained an out-of-limits (target) parameter.
As soon as the graphical display appeared, the subject pressed either mouse button and followed up with a response to indicate whether system status was 'OK' or 'BAD'. The tracking task was running until this first button press was made. The first button press caused the test display to be deleted and the tracking task halted. The tracking task rectangle immediately divided into quarters, the upper two containing the words 'OK' and 'BAD', with their positions counterbalanced across subjects. The subject indicated system status by using the mouse to move an arrow cursor, which had appeared at the centre of the rectangle, to the desired response. The selected quarter then changed colour; clicking a mouse button then selected that response. Immediate feedback was given by a rising or falling tone (indicating a correct answer or a wrong answer respectively), the dynamic task halted and the spaceship disappeared.
If no response was made within 2 sec of a test display appearing, then an invalid response was recorded and feedback for an error was given. Once a trial had been completed, the spaceship icon reappeared and the dynamic task continued from the position at which it had been interrupted. The computer recorded the time from the appearance of a graphical display to each of the responses and the current score on the tracking task. Performance measures for the check-reading task were: time from display onset to deletion of the display (RT~); time from display deletion to the response indicating whether the display was OK or BAD (RT2); number of errors (ER). Error trials were not replaced but were removed from analysis of the mean RTs. Subjects were asked to respond as quickly and accurately as possible, but were not given specific guidance on how to distribute effort over the various task demands.
2.2. Results
The mean changes in tracking score from trial to trial for each of the experimental factors were entered into a repeated measures ANOVA, but no significant results were evident. The overall mean change in tracking score was + 16.28, indicating that the subjects had maintained the spaceship within the rectangle for majority of the time (98%) that the tracking task was running.
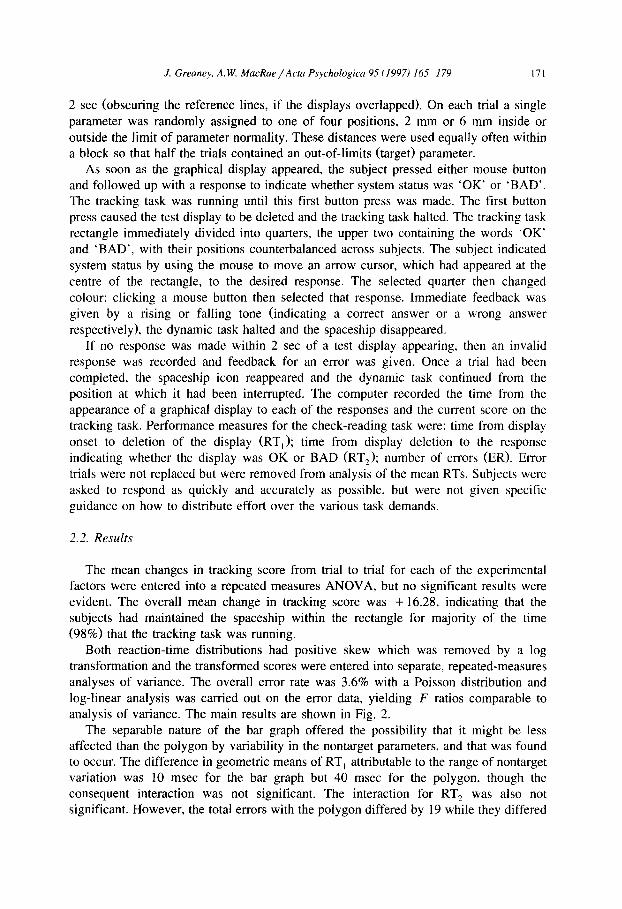
Both reaction-time distributions had positive skew which was removed by a log transformation and the transformed scores were entered into separate, repeated-measures analyses of variance. The overall error rate was 3.6% with a Poisson distribution and log-linear analysis was carried out on the error data, yielding F ratios comparable to analysis of variance. The main results are shown in Fig. 2.
The separable nature of the bar graph offered the possibility that it might be less affected than the polygon by variability in the nontarget parameters, and that was found to occur. The difference in geometric means of RT~ attributable to the range of nontarget variation was 10 msec for the bar graph but 40 msec for the polygon, though the consequent interaction was not significant. The interaction for RT 2 was also not significant. However, the total errors with the polygon differed by 19 while they differed
172 J. Greaney, A. IV. MacRae / Acta Psychologica 95 (1997) 165-179
RT1 (msec)
1 ooo
800
600
400
Bars
Polygon
RT2 (msec) % Errors
1 000
800
600 Polygon
Bars
10
8
6 Polygon
4
/ / D a 2 ~/
/
0
/ /
/
4 8 12 16 4 8 12 16 4 8 12 16
Number of parameters displayed
Fig. 2. Reaction times (geometric means) and percentage of errors in each combination of display format and number of displayed parameters when the task was to identify the system state as normal or abnormal and one parameter at most could be out of limits (Experiment 1). The total response time was made up of components RT 1 and RT 2. During RT t the display remained visible until cancelled by an initial response. RT 2 was the time that followed until a second response indicating whether the display had or had not included an abnormal parameter.
by only 2 (and in favour of high variability) with the bar graph. The interaction was significant (F(1,7) = 6.78, p < 0.05).
2.3. Discuss ion
The most notable finding was that detection times were practically independent of the number of bars in the bar graph. This is an instance of an ostensibly 'separable' display being processed ' in parallel' and may reflect the influence of simple features on search
efficiency, an abnormal bar protruding above the reference line being easily detected. Responses were faster when system variability was low. The nontarget parameters
were then more similar, yielding a more regular display shape which may have allowed easier separation of target from nontarget parameters. The difficulty of the task was slightly reduced by nontargets remaining further from the boundary of normality but since there was no effect on the proportion of false alarms, that was not an important factor.
3. Experiment 2
In Experiment 1, displays contained at most one off-limits parameter but in a real-world failure, several different parameters might be out of limits simultaneously.
J. Greaney, A. IV. MacRae / Acta Psychologica 95 (1997) 165-179 173
Experiment 2 used displays containing up to three off-limits parameters. Rather than merely classifying a display as normal or abnormal, the task was to report the number of off-limits parameters.
3.1. Method
3.1.1. Subjects Eight men and women aged 18-23 were paid for participation. All were students at
the University of Birmingham and had normal or corrected-to-normal vision.
3.1.2. Procedure All aspects of the procedure were the same as in Experiment 1 except for the task of
monitoring the graphical display, which required the number of off-limits parameters to be reported. Up to three target parameters, all with the same value, could be present on each trial. In a block of 24 trials, one, two and three targets occurred four times each, taking the same four values used in Experiment 1, so again half the trials represented fault states.
When the test display appeared, the participant pressed a mouse button and then indicated how many, if any, system parameters were off limits. The first button press halted the tracking task and deleted the test display (so this task was equivalent to the previous experiment, allowing for comparison of RT~s across experiments). The rectan- gle then divided into quarters, each containing a number, 0, 1, 2, or 3; the participant indicated the number of abnormal parameters by positioning an arrow cursor on one of them to change its colour; clicking a mouse button then selected that number as the response. A correct or incorrect response was signalled by auditory feedback and the tracking task recommenced.
3.2. Resul~
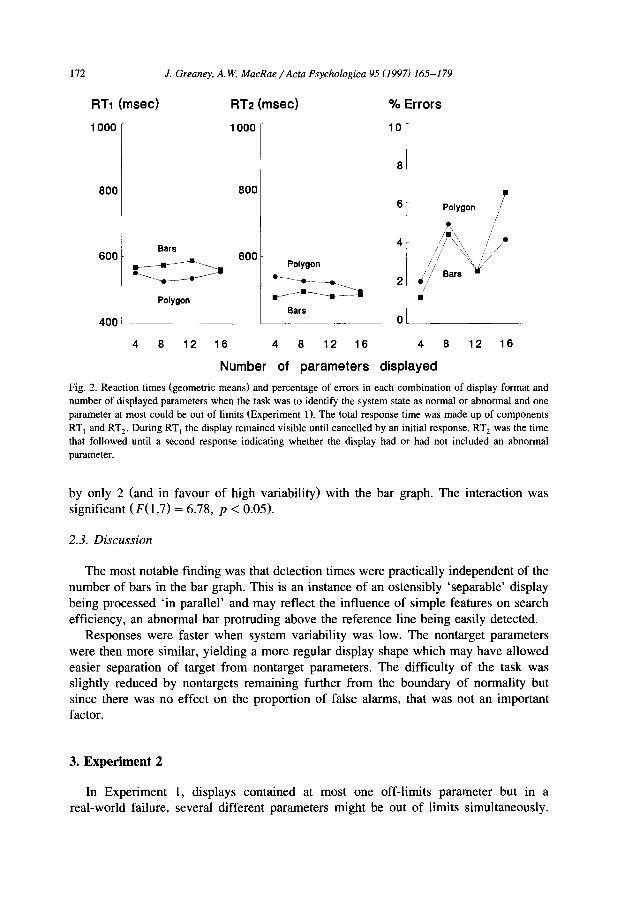
Performance measures and analysis were the same as before and Fig. 3 shows the corresponding results. Analysis of performance on the tracking task revealed no significant effects. The mean change in tracking score per trial was + 15.95, indicating that the space-ship was maintained within the rectangle for the majority of the time (93%) that the task was running.
Responses to the display were generally slower and less accurate than in Experiment 1, with an overall error rate of 6.2%. As before, there were no significant performance differences as a function of the total number of parameters in the display, but this time responses were generally faster and more accurate to bar graphs than to polygons though it was only for errors that the differences were significant: F(I ,7) = 6.61, p < 0.05 (the mean error rates were 4.4% and 7.9% for bar graphs and polygons respectively).
In comparing the Experiments 1 and 2 it should be noted that there were extra categories or error that could be made in Experiment 2. The error rates in Experiment 2 were divided into categories on this basis. The overall rate for responses equivalent to Experiment 1 (i.e., 0 deviations answered as 1, 2, or 3 deviations; as well as 1, 2, or 3 deviations answered as 0 deviations) was 3.1% (cf. the overall rate for Experiment 1 was
174 J. Greaney, A.W. MacRae /Acta Psychologica 95 (1997) 165-179
RT1 (msec) RT2 (msec) % Errors
1 000
800
600
400
Polygon
Bars
1000
800
600
Polygon
j j l ~ / '- /e
/ - \ /
Bars
4 8 12 16 4 8 12 16
Number of parameters
10
\ \ 8
Polygon ",,~_~
6
Bars 2
0
4 8 12 16
displayed
Fig. 3. Reaction times and errors in Experiment 2 when the task was to indicate the number of out-of-limits parameters and up to three might be out of limits.
3.6%). In Experiment 2, errors could also be made by correct detections of 'targets present' by miscounts of the number of deviations (i.e., 1 deviation answered as 2 or 3 deviations; 2 deviations answered as 1 or 3 deviations; and 3 deviation answered as 1 or 2 deviations). Error rates for each of the three possibilities showed similar levels (6.6%, 5.7% and 6.3% respectively) that were higher than the rate for those errors of categorical type tested in Experiment 1. This suggests increase in errors from Experiment 1 to Experiment 2 may be partly attributable to correct detections of targets present by miscounts of the number of deviations.
Performance was much faster to displays with easy (6 mm) than with difficult (2 mm) discriminations: for RT,, F(1,7) = 13.08, p < 0.01; for RT 2, F(1,7) = 8.50, p < 0.05; for ER, F ( 1 , 7 ) = 11.02, p < 0.05. The means for easy versus hard discriminations respectively were for RT,, 669 msec versus 695 msec; for RT 2, 718 msec versus 746 msec; for ER, 3.9% versus 8.4%. Variability of the nontargets caused no significant performance differences but responses were slower and less accurate when the system status was abnormal: for RT,, F(1,7) = 3.52, n.s.; for RT 2, F(1,7) = 14.83, p < 0.01; for ER, F(1,7) = 6.97, p < 0.05. The means for the the significant differences were 794 msec and 681 msec (RT 2, for normal versus abnormal displays respectively) and 8.3% versus 4.0% (the error rates for normal versus abnormal displays). The interactions between display format and system variability were nonsignificant.
3.2.1. Number of target parameters There was a significant interaction in RT 1 between the number of target parameters
and the display format - F(2,14) = 5.23, p < 0.05 - and we can see that there was a similar, though nonsignificant, tendency with all the measures: RTs and errors increase
J. Greaney, A. IV. MacRae / Acta Psychologica 95 (1997) 165-179 175
RTt (msec) RT2 (msec) % Errors
1 000
800
600
400
1000
Polygon ~ e 800 i r j ~
Bars 600
Polygon /
/ '
%
/ Bars ,,,
i/
1 2 Polygon/ -e
10 /
, i
8 ///' ////'
6 /// ,
4 / Bars 'm_ / ~ li
2
oi
0 1 2 3 0 1 2 3 0 1 2 3
Number of parameters abnormal
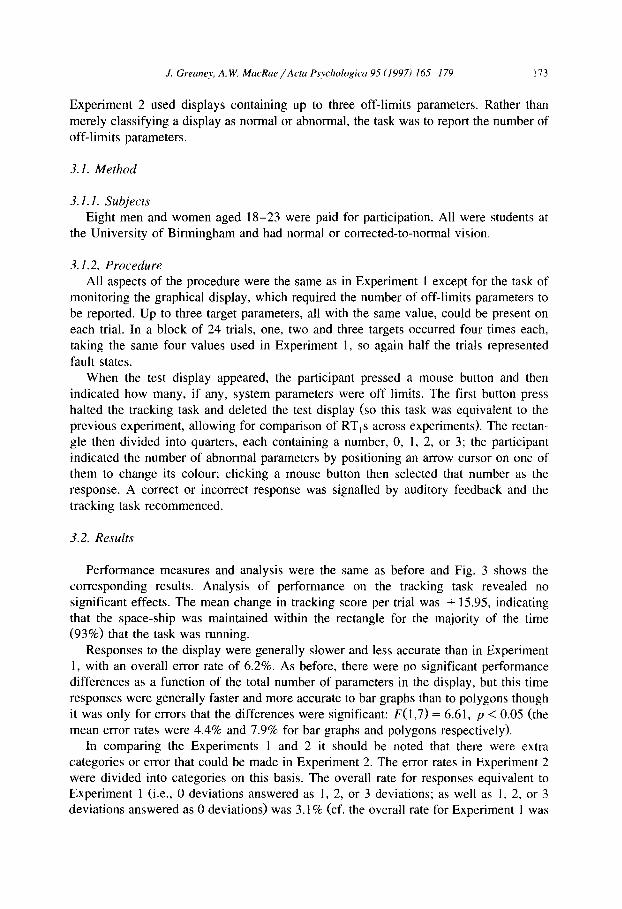
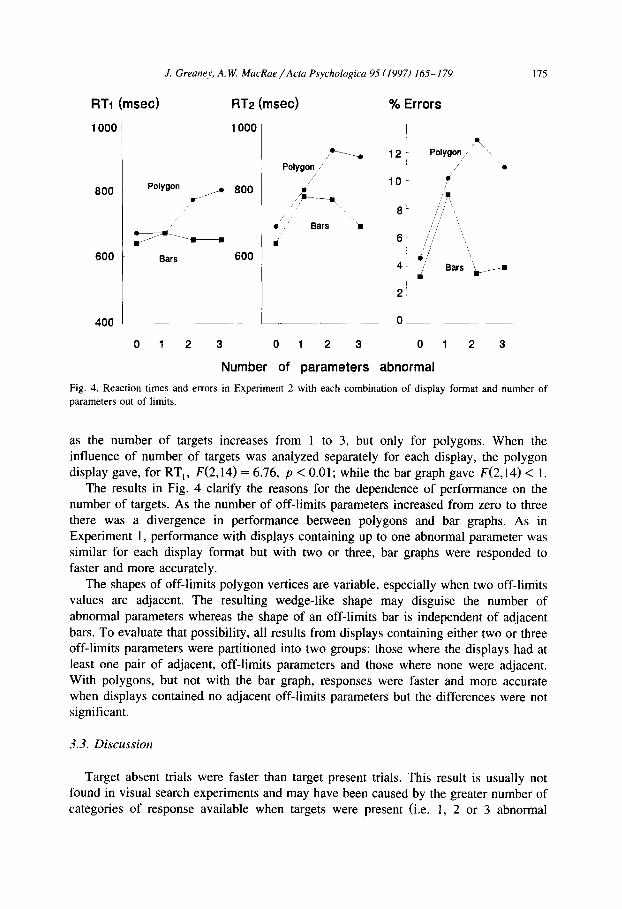
Fig. 4. Reaction times and errors in Experiment 2 with each combination of display format and number of parameters out of limits.
as the number of targets increases from l to 3, but only for polygons. When the influence of number of targets was analyzed separately for each display, the polygon display gave, for RTI, F(2,14) = 6.76, p < 0.01; while the bar graph gave F(2,14) < 1.
The results in Fig. 4 clarify the reasons for the dependence of performance on the number of targets. As the number of off-limits parameters increased from zero to three there was a divergence in performance between polygons and bar graphs. As in Experiment 1, performance with displays containing up to one abnormal parameter was similar for each display format but with two or three, bar graphs were responded to faster and more accurately.
The shapes of off-limits polygon vertices are variable, especially when two off-limits values are adjacent. The resulting wedge-like shape may disguise the number of abnormal parameters whereas the shape of an off-limits bar is independent of adjacent bars. To evaluate that possibility, all results from displays containing either two or three off-limits parameters were partitioned into two groups: those where the displays had at least one pair of adjacent, off-limits parameters and those where none were adjacent. With polygons, but not with the bar graph, responses were faster and more accurate when displays contained no adjacent off-limits parameters but the differences were not significant.
3.3. Discussion
Target absent trials were faster than target present trials. This result is usually not found in visual search experiments and may have been caused by the greater number of categories of response available when targets were present (i.e. 1, 2 or 3 abnormal
176 J. Greaney, A. W. MacRae / Acta Psychologica 95 (1997) 165-179
parameters present). There were faster RTs and lower error rates with both displays for trials requiring discriminations where the target parameter was 6 mm rather than 2 mm from the limit position. This may mean that the efficiency of classifying a system as abnormal or normal could be increased by nonlinear mapping of parameter values onto the display axes so as to emphasize departures from the borderline of acceptability. It remains to be seen if that would have adverse consequences for other tasks such as obtaining quantitative information from the displays.
4. General discussion
It is not surprising that RT z was longer when the task entailed counting the number of fault states, but the increase in RT~ is not strictly predictable and the result that polygon displays gave RTs in that task that were significantly longer for large than for small numbers of faults also requires explanation. Serial scanning of parameters predicts no difference as a function of number of faults but predicts dependence on the number of parameters displayed - the exact opposite of what was found. Parallel processing of parameters predicts no dependence on number of parameters - but no dependence on the number of faults either. That result occurred with the bar graph but not with the polygon display. Note that the difference between display types is the opposite of the prediction that results from viewing the polygon as integral and the bar graph as separable.
An explanation is suggested by the finding that displays with no faults were responded to significantly faster than those with faults. When system status is abnormal, three responses are available since up to three parameters may be off-limits, but that makes a difference only if the no-fault response has a unique status rather than being one of four equal possibilities. In Experiment 1, fault and no-fault states were responded to equally quickly. It thus appears that the task in Experiment 2 involved two decision stages: one where the system was classified as abnormal or normal followed by one where the number of abnormalities was counted. Instead of classifying a display into one of four categories, the strategy appears to have been to classify it first as normal or abnormal with parallel processing, as found in Experiment 1, and then to determine, by a serial process, the number of out-of-limits parameters if the display was abnormal. In visual search studies, RTs to targets are usually faster than to displays containing no targets so it might be expected that RT~ would be faster when more abnormalities are present and the evidence for a fault is stronger. However, this may have been counteracted by adoption of a stricter criterion because of awareness that a further discrimination would be required or the processing required by RT 2 may have over- lapped in time with that for RT 1.
The conclusion from Experiment 1 and from these results is that detection of a single abnormal parameter can be carried out as a parallel process with these displays. Although sufficient to classify the system as faulty or not, such detection did not give enough information for the response required in Experiment 2.
The results of Experiment 2 suggest that the features of the polygon are salient enough to pop-out, yet not salient enough to allow subitizing. Off-limit polygon
J. Greaney, A. W. MacRae / Acta Psychologica 95 (1997) 165-179 177
parameters are seemingly detected in parallel (no effect of the number of within-limit items in Experiment 1), yet show a cost when there are multiple targets (effect of the number of within-limit items in Experiment 2).
The research on subitization suggests that rapid enumeration relies on a preattenive mechanism operating on distinctive target items. Sagi and Julesz (1984) found that a number (up to four) items in a visual display could be rapidly counted (subitized) by a parallel (preattentive) process. The targets were horizontal and vertical line segments embedded within an aggregate of diagonal line segments. However, a serial process was required to determine what the orientations of the lines were. Trick and Pylyshyn (1993) found that subjects could subitize target items among nontargets when the targets and nontargets differed by a simple feature. Serial search may be needed to enumerate polygon vertices because finer discriminations are required to make sure that the vertex is a fault.
Target adjacency has a more adverse effect on polygons than on bar graphs - perhaps because bars are separable. Bars form more consistent shapes when off limits, and the shapes are all oriented in one direction. There is an additional adverse effect on polygon displays of adjacent polygon vertices combining to form single protrusions that may not be easily separated into their components. In contrast, adjacent bars are more easily discriminated since their relative heights provide an easily-detected vernier (alignment) cue. The human visual system is adept at discriminating the alignment of vertical lines.
Identifying fault states is a high-proximity task, requiring integration of all the available information to generate a single response. Identifying the number of faults is a relatively low-proximity task requiring attention to individual elements of the display to select from a larger number of response categories. Both tasks were performed better with the low-proximity bar graph display than the high-proximity polygon display. The result casts further doubt on the usefulness of the proximity-compatibility hypothesis for predicting display effectiveness since it seems that other aspects of the displays had more influence on performance. Sanderson et al. (1989) also found that an integrated (high proximity) task can be performed better with a bar graph than with a polygon display. Subjects monitored a pair of displays each representing three parameters of a separate dynamic process. The displays were either two object (triangle) displays or two bar graphs. In a task conceived as requiring information integration, observers were required to detect any failures of normal functioning. Each process consisted of two inputs and an output and the dynamics were such that under normal conditions, the output should be a fixed proportion of the difference between the two inputs. The superiority of the bar graph was attributed in part to the emergent feature of linearity which was evident in some situations. When the output bar was positioned between the two inputs, and the inputs were equally weighted, then the task could be achieved merely by detecting a deviation from linearity of the heights of the bars.
Experiments 1 and 2 used displays that represented up to 16 parameters, and both display types worked as well or better with large numbers of parameters. Since decision times did not depend on the number of displayed parameters there is no indication that the bar graph display was processed serially even though the bars of the bar graph are a collection of separate objects while the polygon is a single object. The result is novel because, although others have varied the number of vertices in a polygon display, the
178 J. Greaney, A. W. MacRae / Acta Psychologica 95 (1997) 165-179
number of parameters indicated by a bar graph has not been an experimental variable in any comparable context.
All these results can be integrated in the framework of target and nontarget similarities proposed by Duncan and Humphreys (1989). Target-nontarget similarity is lowest when the targets exceed the reference limit by 6 mm and highest when they are within 2 mm of it. When target-nontarget similarity is low, target salience is high. Nontarget-nontarget dissimilarity (internal noise) is least when only a small range of values can be adopted by nontargets. In addition to these attributes, we propose that target-target similarity may be important. In our experiments, the values represented by all targets were identical within trials but target similarity was high in the bar graph, where the departures were all in the same direction and were indicated by identical rectangles, while with the polygon display the targets had different appearances because of their differing directions and the varying influence of the exact positions of neighbouring vertices. Overall, performance was best when nontarget similarity was high, target similarity was high and target-nontarget similarity was low.
References
Barnett, B.J. and C.D. Wickens, 1988. Display proximity in multicue information: The benefits of boxes. Human Factors 30, 15-24.
Beringer, D.B., F. Howard and J. Jenkins, 1986. 'Putting information in the visual periphery: It beats a pointed stick in the eye'. In: Proc. Human Factors Society 30th Annual meeting (pp. 613-617). Santa Monica, CA: Human Factors Society.
Carswell, C.M. and C.D. Wickens, 1987. Information integration and the object display. Ergonomics 30, 511-527.
Casey, E.J., 1986. 'Visual display representation of multidimensional systems: The effect of information correlation and display integrality'. In: Proc. Human Factors Society 30th Meeting (pp. 430-434). Santa Monica, CA: Human Factors Society.
Coury, B.G., M.D. Boulette and R.A. Smith, 1989. Effect of uncertainty and diagnosticity on classification of multidimensional data with integral and separable displays of system status. Human Factors 31,551-570.
Duncan, J. and G.W. Humphreys, 1989. Visual search and stimulus similarity. Psychological Review 96, 433-458.
Fitts, P.M., 1951. 'Engineering psychology and equipment design'. In: S.S. Stevens (Ed.), Handbook of experimental psychology (pp. 1287-1340). New York: Wiley.
Greaney, J. and A.W. MacRae, in press. Diagnosis of fault location using polygon displays. Ergonomics. Hughes, T. and A.W. MacRae, 1994. Holistic peripheral processing of a polygon display. Human Factors 36,
645-651. Munson, R.C. and R.L. Horst, 1986. 'Evidence for global processing of complex visual displays'. In: Proc.
Human Factors Society 30th Meeting (pp. 776-780). Santa Monica, CA: Human Factors Society. Sagi, D. and B. Julesz, 1984. Detection versus discrimination of visual orientation. Perception 13, 619-628. Sanderson, P.M., J.M. Flach, M.A. Buttigieg and E.J. Casey, 1989. Object displays do not always support
better integrated task performance. Human Factors 31, 183-198. Treisman, A. and G. Gelade, 1980. A feature-integration theory of attention. Cognitive Psychology 12,
97-136. Treisman, A. and S. Gormican, 1988. Feature analysis in early vision: Evidence from search asymmetries.
Psychological Review 95, 15-48. Treisman, A. and R. Paterson, 1984. Emergent features, attention and object perception. Journal of Experimen-
tal Psychology: Human Perception and Performance 10, 12-31. Trick, L.M. and Z.W. Pylyshyn, 1993. What enumeration studies can show us about spatial attention:

J. Greaney, A.W. MacRae /Acta Psychologica 95 (1997) 165-179 179
Evidence from limited capacity preattentive processing. Journal of Experimental Psychology: Human Perception and Performance 19, 331-351.
Watson, D.G., 1991. Theory-based display design. Unpublished M.Sc. Cognitive Science dissertation. University of Birmingham, UK.
Woods, D.D., J.A. Wise and L.F. Hanes, 1981. 'An evaluation of nuclear power plant safety parameter display system'. In: Proc. Human Factors Society 25th Meeting (pp. 110-114). Santa Monica, CA: Human Factors Society.


![Graphical displays for meta-analysis: An overview with ...psych.colorado.edu/~willcutt/pdfs/Anzures-Cabrera_2010.pdf · graphical displays for meta-analysis ... [18] or an ordering](https://img.pdfslide.us/doc/110x75/5aaf91297f8b9a07498d811e/graphical-displays-for-meta-analysis-an-overview-with-psych-willcuttpdfsanzures-cabrera2010pdfgraphical.jpg)


![Spotlight: Directing Users’ Attention on Large Displays · Interfaces]: Graphical User Interfaces (GUI), Windowing Systems Additional Keywords and Phrases: large displays, attention,](https://img.pdfslide.us/doc/110x75/60121acdf2c1ed71d31c3409/spotlight-directing-usersa-attention-on-large-displays-interfaces-graphical.jpg)