Embed Size (px)
Citation preview

19th Computer Vision Winter WorkshopZuzana Kukelova and Jan Heller (eds.)Krtiny, Czech Republic, February 3–5, 2014
Visual Recognition and Fault Detection for Power Line Insulators
Markus Oberweger, Andreas Wendel1, and Horst Bischof
Institute for Computer Graphics and VisionGraz University of Technology, Austria
[email protected], {wendel, bischof}@icg.tugraz.at
Abstract The inspection of high voltage power lines is animportant task in order to prevent failure of the transmis-sion system. In this work, we present a novel approach todetect insulators in aerial images and to analyze them au-tomatically for possible faults. Our detection algorithm isbased on discriminative training of local gradient-based de-scriptors and a subsequent voting scheme for localization.Further, we introduce an automatic extraction of the indi-vidual insulator caps and check them for faults by using adescriptor with elliptical spatial support.We demonstrate our approach on an evaluation set of 400real-world insulator images captured from a helicopter andevaluate our results with respect to a manually createdground-truth. The performance of our insulator detectoris comparable to other state-of-the-art object detectors andour insulator fault detection outperforms existing methods.
1 IntroductionHigh voltage power lines and transmission systems becomemore and more important with the raising demand of energy,especially in context of renewable resources. Pre-emptiveinspection is an essential maintenance procedure in order tokeep the downtime of a power line low, but it is time- andmoney-consuming, requiring much manual labor. Thereforewe propose a machine-aided method for insulator inspectionby automatically analyzing the images taken along a powerline in order to determine faulty insulators, which are amongthe most common problems in transmission networks [21].While there are different types of insulators, we focus on themost common cap and pin insulator with its characteristicstacked caps. The insulator can be applied to the pylon indifferent orientations, different sizes, or combined parallelor serial. We thus do not assume a certain orientation, com-bination or size in our method.
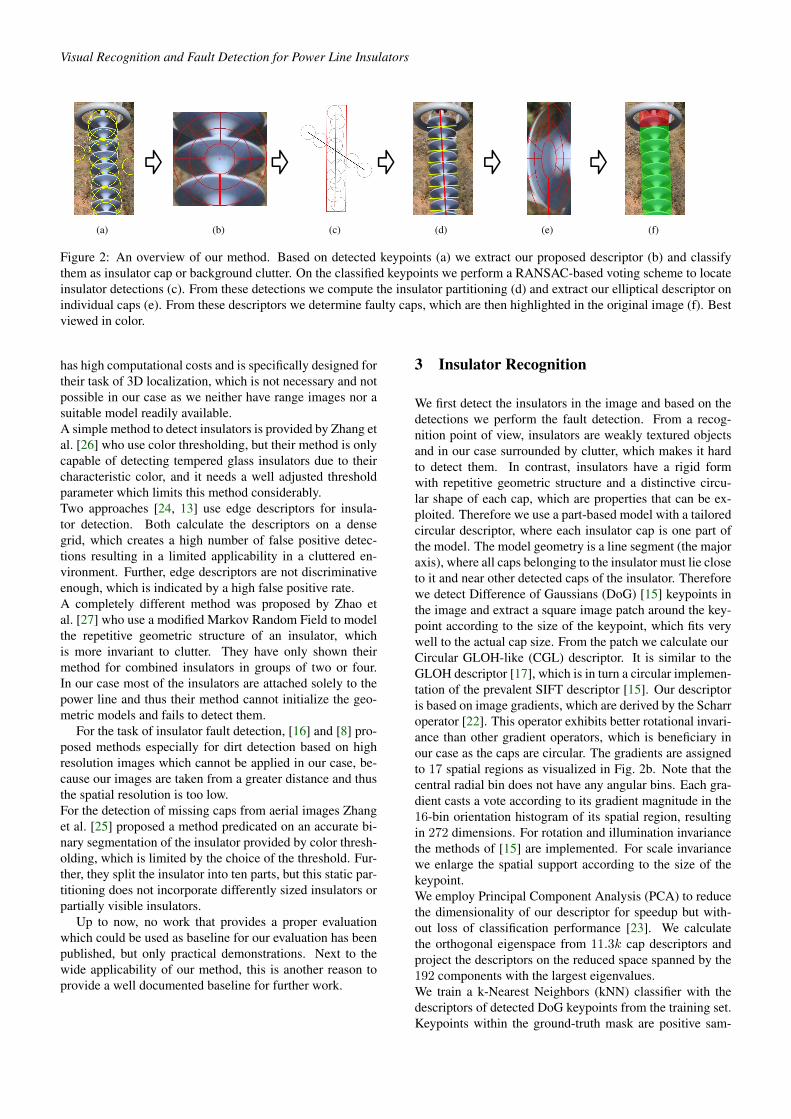
In this paper we present a novel recognition method forinsulators in highly cluttered images (see Fig.1), and we in-troduce an automatic insulator fault detector. An overviewillustrating the key-features of our work is shown in Fig. 2.The main contributions of this work are
1. an insulator detector, which is invariant to insulator ori-entation, size and combinations, partial overlap, illumi-nation, and background clutter based on a circular de-scriptor and a noise-tolerant voting scheme, and1Current affiliation: Google Inc.
Figure 1: Our method detects insulators in highly clutteredaerial images and performs an automatic fault analysis. Thefaults are highlighted in red.
2. an automatic insulator fault detector, which automaticallypartitions each insulator into its individual caps and sub-sequently analyzes each cap for faults based on an ellip-tical descriptor.
We demonstrate the performance of our approach using animage set taken from a helicopter inspection, and evaluatethe quality using a manually created groundtruth, which is,to the best of our knowledge, the first systematic evaluation.
2 Related WorkWhile different methods for detecting insulator faults ex-ist, e.g. visual inspection or electrotechnical measurement,our method can be used complementary with other meth-ods and especially for identifying mechanical damage andflashover marks. However, there is no inspection method ormeasurement device that is able to detect all possible insu-lator faults [14].
For insulator detection there are several works, as e.g. [4,9], who use the detection as enabling method for further pro-cessing, but these methods’ localization is too inaccurate forour work and restricted to a certain scenario, e.g. untexturedbackground or a camera facing the sky, and thus not work-ing well for our highly cluttered background. Opposing tothese inaccurate methods, Kawamura et al. [11] publishedan approach based on 3D template matching for accurate 3Dlocalization of insulators for robot interaction. The method
Visual Recognition and Fault Detection for Power Line Insulators
(a)
(b)
(c)
(d)
(e)
(f)
Figure 2: An overview of our method. Based on detected keypoints (a) we extract our proposed descriptor (b) and classifythem as insulator cap or background clutter. On the classified keypoints we perform a RANSAC-based voting scheme to locateinsulator detections (c). From these detections we compute the insulator partitioning (d) and extract our elliptical descriptor onindividual caps (e). From these descriptors we determine faulty caps, which are then highlighted in the original image (f). Bestviewed in color.
has high computational costs and is specifically designed fortheir task of 3D localization, which is not necessary and notpossible in our case as we neither have range images nor asuitable model readily available.A simple method to detect insulators is provided by Zhang etal. [26] who use color thresholding, but their method is onlycapable of detecting tempered glass insulators due to theircharacteristic color, and it needs a well adjusted thresholdparameter which limits this method considerably.Two approaches [24, 13] use edge descriptors for insula-tor detection. Both calculate the descriptors on a densegrid, which creates a high number of false positive detec-tions resulting in a limited applicability in a cluttered en-vironment. Further, edge descriptors are not discriminativeenough, which is indicated by a high false positive rate.A completely different method was proposed by Zhao etal. [27] who use a modified Markov Random Field to modelthe repetitive geometric structure of an insulator, whichis more invariant to clutter. They have only shown theirmethod for combined insulators in groups of two or four.In our case most of the insulators are attached solely to thepower line and thus their method cannot initialize the geo-metric models and fails to detect them.
For the task of insulator fault detection, [16] and [8] pro-posed methods especially for dirt detection based on highresolution images which cannot be applied in our case, be-cause our images are taken from a greater distance and thusthe spatial resolution is too low.For the detection of missing caps from aerial images Zhanget al. [25] proposed a method predicated on an accurate bi-nary segmentation of the insulator provided by color thresh-olding, which is limited by the choice of the threshold. Fur-ther, they split the insulator into ten parts, but this static par-titioning does not incorporate differently sized insulators orpartially visible insulators.
Up to now, no work that provides a proper evaluationwhich could be used as baseline for our evaluation has beenpublished, but only practical demonstrations. Next to thewide applicability of our method, this is another reason toprovide a well documented baseline for further work.
3 Insulator Recognition
We first detect the insulators in the image and based on thedetections we perform the fault detection. From a recog-nition point of view, insulators are weakly textured objectsand in our case surrounded by clutter, which makes it hardto detect them. In contrast, insulators have a rigid formwith repetitive geometric structure and a distinctive circu-lar shape of each cap, which are properties that can be ex-ploited. Therefore we use a part-based model with a tailoredcircular descriptor, where each insulator cap is one part ofthe model. The model geometry is a line segment (the majoraxis), where all caps belonging to the insulator must lie closeto it and near other detected caps of the insulator. Thereforewe detect Difference of Gaussians (DoG) [15] keypoints inthe image and extract a square image patch around the key-point according to the size of the keypoint, which fits verywell to the actual cap size. From the patch we calculate ourCircular GLOH-like (CGL) descriptor. It is similar to theGLOH descriptor [17], which is in turn a circular implemen-tation of the prevalent SIFT descriptor [15]. Our descriptoris based on image gradients, which are derived by the Scharroperator [22]. This operator exhibits better rotational invari-ance than other gradient operators, which is beneficiary inour case as the caps are circular. The gradients are assignedto 17 spatial regions as visualized in Fig. 2b. Note that thecentral radial bin does not have any angular bins. Each gra-dient casts a vote according to its gradient magnitude in the16-bin orientation histogram of its spatial region, resultingin 272 dimensions. For rotation and illumination invariancethe methods of [15] are implemented. For scale invariancewe enlarge the spatial support according to the size of thekeypoint.We employ Principal Component Analysis (PCA) to reducethe dimensionality of our descriptor for speedup but with-out loss of classification performance [23]. We calculatethe orthogonal eigenspace from 11.3k cap descriptors andproject the descriptors on the reduced space spanned by the192 components with the largest eigenvalues.We train a k-Nearest Neighbors (kNN) classifier with thedescriptors of detected DoG keypoints from the training set.Keypoints within the ground-truth mask are positive sam-

Markus Oberweger, Andreas Wendel, and Horst Bischof
ples and randomly selected keypoints from the backgroundnegative samples. For recognition we query the classifierwith the descriptors of the detected keypoints in order todistinguish between insulator caps and clutter.
From the classified keypoints we determine the boundingboxes for the insulators. We group the keypoints by theirscale and apply an adapted RANSAC [7] approach on allkeypoints of each scale to robustly fit the insulator modelto the detected keypoints. We have to modify the originalalgorithm to handle multiple insulator instances in an im-age [19]. Therefore we determine two random initial pointsp1,p2 from all available keypoints of one scale which sat-isfy the proximity constraint ‖p1−p2‖ < 4 ·sz(p1), wheresz(p) is the keypoint size. If no point combination satis-fies the proximity constraint, the algorithm terminates as nomodel can be initialized. From these two points we createan initial model, i.e. the line segment connecting them. Weadd keypoints as inliers to the model, whose distance frompoint to line is smaller than half the keypoint size. All in-liers have to be in relative proximity to already added inliers.This ensures that we do not add false positive detections lo-cated on the line. Each valid model must contain at leastfive inliers. We use the best model, thus having most in-liers, as detection. The bounding box is created from theinliers by calculating the minimum bounding rectangle. Theinliers are removed from the available keypoints, thus eachkeypoint is only used for one model. We repeat the processas long as a single iteration generates a valid model, else allinsulators have been detected and the algorithm terminates.Using the described procedure we first optimize the recall ofthe detection. In the next step we use the estimation of thefundamental period of the insulator partitioning to verify thedetections by evaluating the repetitive structure within theinsulator, which is not present in false positive detections.
4 Insulator Fault DetectionThe detected insulators are then analyzed for faults. Eachinsulator is described by its major axis and divided into itsindividual caps along this axis, as shown in Fig. 2d. Fur-ther, we calculate an elliptical descriptor from each cap togenerate a score, which serves as a level of faultiness. Byusing a cap-wise partitioning of the insulator we can local-ize faults more accurately and invariant to differently sizedand truncated insulators.
4.1 Insulator PartitioningThe first step of the insulator partitioning is the estimationof the overall orientation Θ. This orientation estimation andcorrection is important in order to provide a fixed layoutfor the following cap extraction. Therefore we use a binarysegmentation mask obtained from the actual detection usingGrabCut [20]. On the mask we apply an image moment-based method which exploits the elongated shape of the in-sulator. The momentM of order (i+j) is calculated as [10]
Mij =∑x
∑y
xiyjI(x, y) (1)
where x and y are the image coordinates and I(x, y) thepixel intensity. Using M we calculate the insulator orienta-
tion as
Θ =1
2atan2
(2
(M11
M00− M10
M00
M01
M00
),
M20
M00−(M10
M00
)2
− M02
M00−(M01
M00
)2).
(2)
The orientation is derived from the covariance matrix of thenormalized second order image moments of the image mask.
In the second step of the partitioning we separate the in-sulator into its individual caps. Therefore we detect separa-tion candidates by extracting Canny edges [3] and intersectthem with the major axis of the insulator. Because these can-didates are noisy, we employ signal processing methods toestimate and extract the separations. The separation candi-dates are formed as an impulse in a 1D signal i[u] along themajor axis u using
i[u] =
{1, if major axis intersects with edge0, otherwise.
(3)
The signal consists of impulses which are not properlyaligned and thus create high frequency responses. There-fore we apply a Gaussian filter which provides a low passfilter and serves as noise estimate. For the Gaussian kernelwe use σ = 1
3b1N
∑N−1i=1 di,i+1c where di,i+1 is the dis-
tance between two consecutive impulses. This kernel hasbeen chosen to adaptively minimize the leverage on neigh-boring impulses due to filtering, which is necessary becauseof the high variance of cap sizes.The fundamental period f of the filtered signal x[u] is usedto estimate the repetitive structure within the insulator. Fromx[u] we calculate the Nfft-point Fast Fourier Transform(FFT) as X = F {x} where Nfft = 2dld(length(x[u]))e.In order to improve the period estimate we use a weight-ing function w[k] to suppress unwanted frequency parts,which can be caused by wrong separation candidates. w[k]is again a Gaussian distribution with σ = kc√
2centered
at kc = bNfft
w/2 c where w is the width of the insulatormasks bounding box which serves as an estimate. Further,f = bNfft
kmaxc and kmax is determined by
kmax = arg maxk
(|X| ·w[k] | k > 3) (4)
where k > 3 is used to suppress the dominant constant com-ponent of the signal. We estimate f on the major axis andon two lines parallel to this axis and use the median of thedetected frequencies, which improves the robustness.The alignment of the partitioning within the insulator is cal-culated using cross-correlation of the filtered input signalx[u] and an idealized partitioning created from the funda-mental period. The determined offset is used for matchingthe calculated to the nearest detected separations. If a sepa-ration is missing, e.g. not detected, a separation is thus auto-matically added at the most likely position.In Fig. 3a the input signal i[u] is compared to the resultingpartitioning. Note the noisy input signal with multiple re-sponses for each separation and with noise within the caps,which are removed in the result. In Fig. 3b the shown spec-trum exhibits a strong peak at kmax = 67 for aNfft = 1024point FFT, which correctly results in f = 15px.

Visual Recognition and Fault Detection for Power Line Insulators
0 100 200 300 400 500 6000
0.2
0.4
0.6
0.8
1Raw data
Image coordinate
Sep
arat
ion
0 100 200 300 400 500 6000
0.2
0.4
0.6
0.8
1Reconstructed samples
Image coordinate
Sep
arat
ion
(a)
0 100 200 300 400 500 6000
50
100
150
200FFT
Frequency
Mag
nitu
de
0 100 200 300 400 500 6000
0.5
1Weight
Frequency
Mag
nitu
de
0 100 200 300 400 500 6000
10
20
30
40FFT weighted
Frequency
Mag
nitu
de
(b)
Figure 3: Insulator partitioning (measured f = 15px). (a)shows the reconstruction of the partitioning and (b) showsthe estimation of the fundamental period.
4.2 EGL DescriptorBased on the partitioning we extract an elliptical descrip-tor from each cap, which fits an insulator cap very well andthus minimizes the influence of neighboring caps or back-ground clutter. In contrast to the CGL descriptor our El-liptical GLOH-like (EGL) descriptor contains gradient his-tograms for elliptical spatial regions (planar elliptical coor-dinates [18]). The spatial layout of the descriptor is shownin Fig. 2e, which again is divided into 17 regions with a 16-bin histogram of gradient orientations for each region. Theaxes of the ellipse are given by the size of the insulator cap.The EGL descriptor is not rotational invariant, which is notneeded, because the insulator tilt can be corrected by usingthe insulator orientation. The illumination invariance andscale invariance are the same as with the CGL descriptor.
4.3 Fault DetectionBased on the extracted descriptors from each insulator capwe determine outliers, which are the faulty caps. We have touse an unsupervised outlier detector due to the lack of faultycaps for training and due to high intraclass variations of theinsulators (background, viewpoint). Further, we do not treatthe faults as binary classification problem, but we assign ascore to each cap of an insulator. A higher score character-izes a higher dissimilarity to the other caps of the insulatorand thus a more likely faulty cap. Therefore we use the Lo-cal Outlier Factor (LOF) approach proposed by Breunig etal. [2], which provides a score for the dissimilarity by usingthe distance of a descriptor to the k nearest neighbors as anestimate for the local descriptor density. We assume that anoutlier has a lower local density in high dimensional space.The relation of this distance to the distance of its neighborsis used to identify outliers. As distance measure d(A,B) weuse the normalized L1 distance between two descriptors Aand B in D-dimensional space,
d(A,B) =
D∑i=1
|Ai −Bi|maxi −mini
(5)
where maxi and mini are the minimal and maximal valuesof dimension i over all descriptors. We use k = 3 neighbors,initialize the distances with all descriptors of an insulator,and add each test descriptor separately to the set in order topreset the distances to a task-specific range [12].The scores exhibit different ranges for each insulator. Fora global representation we normalize the scores for each in-sulator to a range of [0 . . . 1]. Further, we enhance the dis-tinctiveness by thresholding the score sequence and set allvalues that do not excess the confidence level of 1√
2of the
standard deviation above mean to 0. This provides a morediscriminative visualization as shown in Fig. 2f.
5 EvaluationIn this section we present and discuss the results of the eval-uation. To the best of our knowledge, there is currently nopublicly available dataset for insulator detection. Thereforewe use our own evaluation set, which contains 400 images(size 2352×1568px) with 375 labeled insulators, whereat 20

Markus Oberweger, Andreas Wendel, and Horst Bischof
out of over 11.3k caps are labeled faulty (4 flashover dam-ages and 16 cracked caps). For evaluation and training weuse a segmented ground-truth, which is generated by man-ually segmenting the insulators using a GrabCut [20] basedlabeling tool. Truncated insulators with less than five visiblecaps are not labeled. We evaluate on a computer with a Core2 Duo with 2.6GHz and 4GB of RAM.
5.1 Insulator RecognitionWe first evaluate the keypoint classification and subse-quently the recognition based on the classified keypoints.For the evaluation of the recognition there has not been pub-lished a work that provides proper evaluation metrics whichcould be used as baseline, but only practical demonstrations.
5.1.1 Keypoint Classification The evaluation ofthe keypoint classification is based on the true positiverate (TPR), the fraction of correctly identified caps to allcaps, and the true negative rate (TNR), the fraction ofcorrectly identified clutter to all clutter samples. For thekeypoint classification a high TPR and TNR are requiredin order to distinguish between cap and clutter keypoints.From our evaluation set we automatically extract 11.3kcaps located on DoG keypoints within the ground-truthmask and 11k clutter samples randomly selected from thebackground as ground-truth.Tab. 1 shows the classification results for different descrip-tor types. The classification rates are obtained by usinga kNN classifier with 2-fold cross-validation. Our CGLdescriptor scores the highest TPR and TNR rate, thus it isthe most suitable descriptor for this task. The high TNRof 99.7% is essential for efficient clutter suppression, but aslightly smaller TPR of 92.7% can be tolerated as not allcaps of an insulator must be detected in order to detect theinsulator itself due to our part-based model.
Descriptor CGL SIFT [15] SURF [1]TPR 92.7% 92.5% 75.8%TNR 99.7% 92.4% 90.5%Average runtime 1.4ms 1.9ms 0.25ms
Table 1: Average keypoint classification rates. Our descrip-tor (CGL) performs best.
The detection of keypoints works best with a DoG [15] de-tector. A dense grid (e.g. 7 scales from 20 to 100px) is notapplicable because of the high runtime and the high numberof false positive detections. Other detectors as e.g. an ap-proximated Hessian detector [1] cannot locate the insulatorcaps accurately, or detectors that detect corner-like struc-tures rather locate the keypoints on the boundaries than inthe center of the caps.
5.1.2 Recognition We evaluate the insulator detector onour evaluation set, where each connected component in theground-truth mask is determined as insulator and the min-imal bounding rectangle is used as ground-truth boundingbox. Note that these are rotated rectangles, therefore they fitthe insulators very well.In order to evaluate the localization of our method we use
the well-known Pascal score [5], which is calculated fromthe overlap of our generated bounding boxBc to the ground-truth Bgt by
p(Bc, Bgt) =area(Bc ∩Bgt)area(Bc ∪Bgt)
. (6)
An object is considered detected if p(Bc, Bgt) > 0.5.As objective we want to maximize the number of correctdetections and minimize the number of false detections. Thetwo used evaluation metrics are precision, the fraction ofcorrect detections to the total number of detections made byour detector, and recall, the fraction of correctly detectedobjects to the number of annotated objects. Our detectorprovides a score for each detection, which is used to vary thetrade off between these two metrics. The score is calculatedby
score(p, L) =
(1−
∑Ni=1 dp,L(pi, L)∑Ni=1 sz(pi)/2
)·N (7)
where p is the inlier set, L the estimated model, N is thenumber of inliers and dp,L the Euclidean distance from in-lier to model. The score is higher if a model contains moreinliers or better fitting inliers.We use the Precision-Recall Curve (PRC) as performancemeasurement, which is shown in Fig. 4 for our detector. Thecurve is constructed in accordance to [5] by using the inter-polated precision. We perform 2-fold cross-validation andplot the averaged precision and recall values. The recallreaches a maximum of 98% and drops rapidly for higherrecall scores. Most false positives are caused by insufficientoverlap of the detected to the ground-truth bounding box.Only about 7% of the false positives are actually located onthe background or on the pylons, thus showing efficient clut-ter suppression.
0 0.2 0.4 0.6 0.8 10
0.1
0.2
0.3
0.4
0.5
0.6
0.7
0.8
0.9
1
recall
prec
isio
n
PR Insulator Detection
PR 2−fold CV 56.33%
Figure 4: PRC for insulator detection. The average precisionis over 56%.
Badly detected boxes are identified by a low overlapvalue as shown in Fig. 5. For our evaluation the requiredPascal criterion is very strict due to the fact that we use ro-tated bounding boxes, which is not originally intended [5].

Visual Recognition and Fault Detection for Power Line Insulators
Subjectively speaking, an overlap score of 0.5 already fitsthe insulator very well, whereas a lower threshold might beconcerned, e.g. p(Bc, Bgt) > 0.4 already improves the re-call to 100%. Using an overlap threshold of 0.5 the insula-tors in Fig. 5 (a)-(c) would be considered correct detections,and Fig. 5 (d)-(f) false detections although the first two fitwell. Only the detection in Fig. 5f completely fails, becausethe line model is initialized badly and further the detected in-sulator caps in the upper part are not included into the modeldue to a large distance from the model.
(a) 0.9 (b) 0.68 (c) 0.58 (d) 0.48 (e) 0.45 (f) 0.2
Figure 5: Detection results (red) with overlap scorep(Bc, Bgt) stated. Best viewed in color.
5.2 Insulator Fault DetectionFor the fault detection, a proper insulator partitioning is es-sential. Therefore we first evaluate the insulator partitioningand then the fault detection itself. Fig. 1 shows the faultdetection results for a mechanical damage and Fig. 2f for aflashover damage.
5.2.1 Insulator Partitioning For the evaluation of thepartitioning we compare the calculated orientation to the ori-entation of the minimum bounding rectangle of the ground-truth segmentation mask. We have implemented the Hough-based method of [25] as baseline. As evaluation criterionwe use the angular error e(Θ,Θgt) = |Θ−Θgt| (mod π
2 ),where Θgt is the orientation of the ground-truth and Θ theorientation provided by the method. Only the absolute ori-entation matters due to the symmetric shape of the insula-tor. The mean µ(e) and the standard deviation σ(e) of theangular error are used to compare the methods. A smallermean indicates a more accurate orientation estimation anda smaller standard deviation shows, that the errors are lessscattered.The evaluation results in Tab. 2 show, that our moment-based method is more accurate and requires less computa-tion time than the Hough-based approach. The orientationof the bounding box of the actual detection requires no addi-tional computation, but it is less accurate than our proposedmethod and prone to outliers. A more precise orientationprovides a higher accuracy of the partitioning.
For the evaluation of the partitioning we measured thefundamental period from the images and use it as ground-truth. The fundamental period is correctly computed for84% of all insulators, w.r.t. a tolerable deviation of ±5px or10%. For the cap extraction the creation of a ground-truth
Method µ(e) σ(e) Average runtimeMoment-based 0.33◦ 0.48◦ 12msHough-based [25] 1.57◦ 2.03◦ 430msBounding box 1.02◦ 1.24◦ 0ms
Table 2: Insulator orientation evaluation.
is not feasible, thus resulting in manual checks. A properpartitioning requires a cap width of at least 10px, otherwisethe separation features between the individual caps vanish.The partitioning works for different perspectives as shownin Fig. 6a and 6b, but fails if there are no separation featuresas depicted in Fig. 6c. For that sample also humans fail toseparate the caps.
(a)
(b)
(c)
Figure 6: Partitioning results. Note the different sizes (redline is 5px wide). Best viewed in color.
5.2.2 Fault Detection We compare our fault detectionmethod to the approach of [25] based on Gray-Level Co-occurrence Matrices (GLCM). In order to make their scorescomparable we use our partitioning to calculate their fea-tures, instead of constantly ten parts.A detailed view of a score sequence is given in Fig. 7, whichshows the scores for a flashover damage (see Fig. 2e) at cap1. The scores are normalized, but not thresholded as de-scribed in Section 4.3 for a better illustration. The ground-truth has a value of 1 for a faulty cap and 0 for non-faultycaps. Both methods score high values for the faulty caps,but the values scored for non-faulty caps are quite different.By using our EGL-based approach, we efficiently suppressbackground clutter and are invariant to faults in the segmen-tation mask, in contrast to the GLCM-based method, which

Markus Oberweger, Andreas Wendel, and Horst Bischof
cannot distinguish between a faulty cap and a defect in thesegmentation mask.
1 2 3 4 5 6 7 8 9 100
0.2
0.4
0.6
0.8
1
Cap #
Sco
re (
norm
aliz
ed)
LOFGLCMGround−truth
Figure 7: Score sequence for a flashover damage at cap 1.Our LOF-based approach can clearly distinguish betweenfaulty and non-faulty caps.
For the evaluation of our fault detection we use the Re-ceiver Operating Characteristic (ROC), which is indepen-dent of class skew [6] and thus advantageous in the case offault detection because the faulty samples make up only afraction of all samples. Although we use a continuous scorefor the fault detection, the evaluation can be seen as a binaryclassification problem: faulty caps are the desired positiveclass, non-faulty caps are the negative class. As performancemeasurements we use the TPR, the fraction of successfullydetected faulty caps to all faulty caps, and the false posi-tive rate (FPR), the fraction of mistakenly identified faultycaps to all non-faulty caps. A comparison of different ROCfor insulator fault detection is shown in Fig. 8. The ROC iscreated by using the fault score as threshold. Our EGL de-scriptor with LOF performs best and achieves a TPR of 95%at a FPR of 12%.
6 ConclusionIn this work we have presented a novel approach for insula-tor recognition and a subsequent automatic fault detectionfrom aerial images. We introduced a method for insula-tor recognition using a part-based model with local imagefeatures and a RANSAC-based clustering approach, whichenables the detection of insulators in a highly cluttered en-vironment regardless of their orientation, size or combina-tions.Further, we proposed a method for insulator fault detectionbased on a descriptor with elliptical spatial support. We usedLOF to assign a score of faultiness to each insulator cap ex-tracted by our automatic partitioning algorithm. This pro-vides an accurate cap-wise fault assessment of the insulatorunder different photometric and geometric conditions.Both methods have been evaluated thoroughly and we have
0 0.1 0.2 0.3 0.4 0.5 0.6 0.7 0.8 0.9 10
0.1
0.2
0.3
0.4
0.5
0.6
0.7
0.8
0.9
1
false positve rate
true
pos
itve
rate
(re
call)
ROC − LOF 93.25%ROC − GLCM 61.80%
Figure 8: ROC for fault detection, with area under the curvestated in the caption. Our proposed method (LOF with EGLdescriptor) significantly outperforms GLCM [25].
established a baseline, which can be used for comparison infuture works.
AcknowledgementThis work has been supported by the Austrian Re-search Promotion Agency (FFG) project FIT-IT Pegasus(825841/10397).
References[1] Herbert Bay, Tinne Tuytelaars, and Luc J. Van Gool.
SURF: Speeded Up Robust Features. In Proc. ECCV,2006.
[2] Markus M. Breunig, Hans-Peter Kriegel, Raymond T.Ng, and Jorg Sander. LOF: Identifying density-basedlocal outliers. In Proc. SIGMOD, 2000.
[3] John Canny. A computational approach to edgedetection. Trans. PAMI, 8(6):679–698, 1986.
[4] Jaime Del-Cerro, Antonio Barrientos, PascualCampoy, and Pedro J. Garcıa. An autonomoushelicopter guided by computer vision for inspection ofoverhead power cable. In Proc. IROS Workshops, 2002.
[5] Mark Everingham, Luc J. Van Gool, Christopher K. I.Williams, John M. Winn, and Andrew Zisserman. ThePascal Visual Object Classes (VOC) Challenge. IJCV,88(2):303–338, 2010.
[6] Tom Fawcett. An introduction to ROC analysis.Pattern Recognition Letters, 27(8):861–874, 2006.
[7] Martin A. Fischler and Robert C. Bolles. Randomsample consensus: A paradigm for model fitting withapplications to image analysis and automatedcartography. Comm. ACM, 24(6):381–395, 1981.
[8] Yumin Ge, Baoshu Li, Shutao Zhao, and ChengzongPang. Detection of the insulator dirtiness based on thecomputer vision. In Proc. CICED, 2006.
Visual Recognition and Fault Detection for Power Line Insulators
[9] Irene Y. H. Gu, Unai Sistiaga, Sonja M. Berlijn, andAnders Fahlstrom. Online detection of snowcoverageand swing angles of electrical insulators on powertransmission lines using videos. In Proc. ICIP, 2009.
[10] Ming-Kuei Hu. Visual pattern recognition by momentinvariants. Trans. Information Theory, 8(2):179–187, 1962.
[11] Kentaro Kawamura, Mark D. Wheeler, OsamuYamashita, Yoichi Sato, and Katsushi Ikeuchi.Localization of insulators in electric distributionsystems by using 3D template matching from multiplerange images. In Proc. IROS, 1998.
[12] Aleksandar Lazarevic and Vipin Kumar. Featurebagging for outlier detection. In Proc. ICKDDM, 2005.
[13] Weiguo Li, Gaosheng Ye, Feng Huang, Shikun Wang,and Wenzhi Chang. Recognition of insulator based ondeveloped MPEG-7 texture feature. In Proc. ICISP,2010.
[14] Zheng Li and Yi Ruan. Fault diagnosis system for theinspection robot in power transmission linesmaintenance. In Proc. OIT, 2009.
[15] David G. Lowe. Distinctive image features fromscale-invariant keypoints. IJCV, 60(2):91–110, 2004.
[16] Xin Mei, Tiecheng Lu, Xiaoyun Wu, and Bo Zhang.Insulator surface dirt image detection technologybased on improved watershed algorithm. In Proc.
PEEC, 2012.[17] Krystian Mikolajczyk and Cordelia Schmid. A
performance evaluation of local descriptors. Trans.
PAMI, 27(10):1615–1630, 2005.[18] Parry Hiram Moon and Domina Eberle Spencer. Field
Theory Handbook: Including Coordinate Systems, Differential
Equations and Their Solutions. Springer, 1971.[19] Julien Rabin, Julie Delon, Yann Gousseau, and Lionel
Moisan. MAC-RANSAC: a robust algorithm for therecognition of multiple objects. In Proc. 3DPVT, 2010.
[20] Carsten Rother, Vladimir Kolmogorov, and AndrewBlake. Grabcut: Interactive foreground extractionusing iterated graph cuts. ACM TOG, 23(3):309–314,2004.
[21] Murari Mohan Saha, Jan Jozef Izykowski, andEugeniusz Rosolowski. Fault Location on Power Networks.Springer, 2010.
[22] Hanno Scharr. Optimale Operatoren in der digitalen
Bildverarbeitung. PhD thesis, Ruprecht-Karls-UniversittHeidelberg, 2000.
[23] Simon Winder, Gang Hua, and Matthew Brown.Picking the best DAISY. In Proc. CVPR, 2009.
[24] Jian Zhang and Ruqing Yang. Insulators recognitionfor 220kv/330kv high-voltage live-line cleaning robot.In Proc. ICPR, 2006.
[25] Xinye Zhang, Jubai An, and Fangming Chen. Amethod of insulator fault detection from airborneimages. In Proc. GCIS, 2010.
[26] Xinye Zhang, Jubai An, and Fangming Chen. Asimple method of tempered glass insulator recognitionfrom airborne image. In Proc. ICOIP, 2010.
[27] Jingjing Zhao, Xingtong Liu, Jixiang Sun, and LinLei. Detecting insulators in the image of overheadtransmission lines. In Proc. ICIC, 2012.