Embed Size (px)
Citation preview
Empir Software EngDOI 10.1007/s10664-008-9068-6
Visual querying and analysis of large softwarerepositories
Lucian Voinea · Alexandru Telea
© Springer Science + Business Media, LLC 2008Editors: Prof. Hassan, Prof. Diehl and Prof. Gall
Abstract We present a software framework for mining software repositories. Ourextensible framework enables the integration of data extraction from repositorieswith data analysis and interactive visualization. We demonstrate the applicabilityof the framework by presenting several case studies performed on industry-sizesoftware repositories. In each study we use the framework to give answers toone or several software engineering questions addressing a specific project. Next,we validate the answers by comparing them with existing project documentation,by interviewing domain experts and by detailed analyses of the source code. Theresults show that our framework can be used both for supporting case studies onmining software repository techniques and for building end-user tools for softwaremaintenance support.
Keywords Software visualization · Evolution visualization · Repository mining
1 Introduction
Software configuration management (SCM) systems are widely accepted instrumentsfor managing large software development projects containing millions of lines ofcode spanning thousands of files developed by hundreds of people over manyyears. SCMs maintain a history of changes in both the structure and contents ofthe managed project. This information is suitable for empirical studies on softwareevolution (Ball et al. 1997; Bennett et al. 1999; Greenwood et al. 1998).
L. Voinea (B)SolidSource BV, Grassavanne 14, 5658 EV Eindhoven, The Netherlandse-mail: [email protected]
A. TeleaInstitute of Mathematics and Computer Science, University of Groningen,Nijenborgh 9, 9747 AG Groningen, The Netherlandse-mail: [email protected]
Empir Software Eng
Many SCM systems exist on the market and are used in the daily practice inthe software industry. Among the most widespread such systems we mention CVS,Subversion, Visual SourceSafe, RCS, CM Synergy, and ClearCase. The ConcurrentVersions System (CVS) and Subversion are, in particular, very popular in the area ofopen source software projects. Many CVS and Subversion repositories covering longevolution periods, e.g., 5–10 years, are freely available for analysis. These repositoriesare, hence, interesting options for research on software evolution.
Most SCM systems, including CVS and Subversion, are nevertheless primarilydesigned to support the task of archiving software and maintaining code consistencyduring development. The main operations they provide are check-in, check-out, anda limited amount of functionality for navigating the intermediate versions that asoftware system has during its evolution. They offer no functionality that enablesusers to get data overviews easily. Such overviews are essential in case the questionsasked involve many files or file versions, rather than a particular file, or address factsat a higher abstraction level than the file level. Most questions concerning spottingtrends in software evolution are of this type. This leads us to a major challenge ofsoftware evolution research based on SCMs, namely how to tackle data size andcomplexity. Raw repository information is too large and provides, when directlydisplayed, only limited insight into the evolution of a software project. Extra analysisis needed to process such data and extract relevant evolution features.
Visual tools, added atop of basic SCM systems, are a recent advance in the field.By using dense pixel techniques, information on hundreds of versions of hundreds offiles can be displayed on a single screen overview. Furthermore, interesting evolutionpatterns can be identified by directly looking at the visualization. Tuning variousgraphics parameters such as layout, texture, color, and shading yields differentvisualizations, thereby addressing different user questions.
However promising, a fundamental question remains: how valid are the answersproduced by visualization tools, when compared to ground truth as known bydomain experts? A related question is: can visualization tools be used to answernon-trivial questions on industry-size repositories? Although preliminary evidencesuggests that such tools enhance the users’ analysis powers and can provide accurateinsight, there is still a high demand for a stronger validation of the accuracy ofthe obtained insight on complex, real-life code repositories which are unfamiliarto the persons using the tools. In this paper, we address the above question by anumber of empirical studies, as follows. We first introduce an extensible frameworkfor SCM data extraction and analysis. Then we customize this framework to supportdevelopers in answering a number of concrete questions on CVS and Subversionsoftware repositories (Q1 · · · Q5):
Q1: What is the contribution style in a given project?Q2: Who are the main developers in charge?Q3: What are the high-level building blocks of a software system?Q4: How maintainable is a given project?Q5: What is the maintenance risk of a given developer leaving a given project?
Next, we use our framework to perform several empirical studies on real-lifesoftware repositories. In these studies, one or several questions on a specific softwarerepository ate to be answered by a person who is not the main code developer.We validate the obtained answers by comparing them with existing project doc-
Empir Software Eng
umentation, by interviewing software developers and by detailed analyses of thesource code itself. Finally, we use this information to draw several conclusionsconcerning the effectiveness of visual repository analysis in supporting softwareevolution assessments.
The structure of this paper is as follows. In Section 2 we review existing repositorydata extraction methods and software evolution analysis techniques. Section 3introduces our customizable framework for mining software repositories: Section 3.1presents a flexible data interface with software repositories; Section 3.2 describesa clustering technique for detecting logical coupling of files based on evolutionsimilarity; Section 3.3 describes a visual back-end for evolution assessment. Next,in Sections 4 to 7 we demonstrate the applicability of our framework with four casestudies performed on several large-scale, real-world repositories. The specific plan-ning, operation, analysis, result interpretation and result validation are presented foreach case. Section 8 discusses several aspects related to the choice of the case studiesand their prototypical value. Section 9 summarizes our contribution and outlinesopen issues for future research.
2 Background
The huge potential of the data stored in SCMs for empirical studies on softwareevolution has been recently acknowledged. The growth in popularity and use ofSCM systems, e.g., the open source (CVS, http://www.nongnu.org/cvs/) and Sub-version (SVN, http://subversion.tigris.org), opened new ways for project accounting,auditing, and understanding. Existing efforts to support these developments can begrouped in three directions: data extraction, data mining, and data visualization.
Data extraction is a less detailed, yet very important, aspect of software evolutionanalysis. Subversion offers a standard API for accessing the software repository.However, Subversion is a relatively new SCM system. It appeared in June 2000and it was first managed using CVS. This is reflected in the existence of fewerlarge repositories freely available for investigations. A large part of the open sourcecommunity still uses CVS as their primary SCM system. Hence, a large part ofresearch in software evolution consider data from CVS repositories, e.g., (Burch et al.2005; Fischer et al. 2003; Gall et al. 2003; German et al. 2004; Lopez-Fernandez et al.2004; Voinea and Telea 2006a; Voinea et al. 2005; Ying et al. 2004; Zimmermannet al. 2004). Yet, a standard framework for CVS data extraction does not exist so far.To build such a framework, two main challenges must be addressed: evolution dataretrieval and CVS output parsing. The huge data amount in repositories is usuallyavailable over the Internet. On-the-fly retrieval is ill suited for interactive (visual)assessment, given the sheer data size. Storing data locally requires long acquisitiontimes, large storage space, and consistency checks. Next, CVS output is badly suitedfor machine reading. Many CVS systems use ambiguous or nonstandard outputformats (e.g., file names without quotes but including spaces, which compromiseconsistency in space separated records). Attempts to address these problems exist,but are incomplete. Libraries exist that offer an application interface (API) to CVS,e.g., javacvs (for Java programmers) or libcvs (for Perl programmers). However,javacvs is basically undocumented, and hence of little use. libcvs handles onlylocal repositories. The Eclipse environment offers a CVS client but not an API.
Empir Software Eng
The Bonsai project (Bonsai, http://www.mozilla.org/projects/bonsai/) offers tools topopulate a database with evolution data obtained from CVS repositories. However,these tools are mainly meant as a web data access package and are little documented.The best supported effort for CVS data acquisition so far is the NetBeans.javacvspackage (http://javacvs.netbeans.org) for Java programmers (not to be mistaken asjavacvs). This package has a reasonably documented API offering most of thefunctionality of the standard CVS client by parsing its output into API-level datastructures. However, the usefulness of this library depends on its ability to supportnonstandard formats. Its main drawback is the difficulty to adapt it to a specificnonstandard situation.
Data mining focuses on extracting and processing relevant information from SCMsystems. SCM systems have not been designed to support empirical studies, sothey often lack direct access to high-level, aggregated evolution information. This isdistilled from the “raw” stored data by data mining tools. In the following, we reviewa number of the prominent results in this field. Fischer et al. (2003) extend the SCMevolution data with information on file merge points. Gall et al. (2003) and Germanand Mockus (2003) use transaction recovery methods based on fixed time windows.Zimmermann et al. (2004) extended this work with sliding windows and facts minedfrom commit e-mails. Ball analyzes cohesion of classes using a mined probabilityof classes being modified together (Ball et al. 1997). Bieman et al. (2003) and Gallet al. (2003) also mine relations between classes based on change similarities. Yinget al. (2004) and Zimmermann and Weisgerber (2004), Zimmermann et al. (2004),address relations between finer-grained artifacts, e.g., functions. Lopez-Fernandezet al. (2004) apply general social network analysis methods on SCM data to assessthe similarity and development process of large projects. Overall, the above methodsprovide several types of distilled facts from the raw data, thereby trying to answerquestions such as: which software entities evolved together, which are the high andlow activity areas of a project, how is the developers network structured, and how doa number of quality metrics, such as maintainability or modularity, change during aproject’s evolution. During data mining, a data size reduction often occurs, as onlythe metrics and facts relevant to the actual question are examined further. Howeveruseful, this approach can discard important facts which are not directly reflected bythe mining process, but which can give useful collateral insight.
Data visualization takes a different path than data mining, focusing on makingthe large amount of evolution information available to users in an effective way.Visualization methods make few assumptions on the data - the goal is to let usersdiscover patterns and trends rather than coding these in the mining process. SeeSoft(Eick et al. 1992), one of the earliest works in this direction, is a line-based codevisualization tool which uses color to show code snippets matching given modificationrequests. Augur (Froehlich and Dourish 2004) visually combines project artifactand activity data at a given moment. Xia (Wu et al. 2004b) uses treemap layoutsfor software structure, colored to show evolution metrics, e.g., time and author oflast commit and number of changes. Such tools successfully show the structure ofsoftware systems and the change dependencies at given moments. Yet, they do notshow code attributes and structure changes made throughout an entire project. Afirst step towards getting insight into several versions, UNIX’s gdiff and Windows’WinDiff tools display code differences between two versions of a file by showing lineinsertions, deletions, and edits computed by the diff tool. Still, such tools cannot
Empir Software Eng
show the evolution of thousands of files and hundreds of versions. Collberg et al.solve this for medium-size projects by depicting the evolution of software structuresand mechanisms as a sequence of graphs (Collberg et al. 2003). Lanza (2001) depictsthe evolution of object-oriented software systems at class level. Wu et al. (2004a)visualize the evolution of entire projects at file level and emphasize the evolutionmoments. Voinea and Telea propose a set of tools that visualize the entire evolutionof software at file (Voinea et al. 2005) and project level (Voinea and Telea 2006a)using dynamic layouts and multivariate visualization techniques. The approaches ofLanza, Wu et al., and Voinea and Telea scale well on large software projects. Burchet al. (2005) propose a framework for visual mining of both evolution and structure atvarious levels of detail. SoftChange (German et al. 2004) is an attempt for a coherentenvironment to support the comparison of Open Source projects, targeting CVS,project mailing lists, and bug report databases. SoftChange focuses mainly on dataextraction and analysis, aiming to be a generic foundation for building evolutionvisualization tools.
In spite of numerous attempts to tackle challenges in each of the above mentioneddirections, there exist only a few tools that combine data extraction, data mining,and data visualization functionality in a single environment (Cubranic et al. 2005;German et al. 2004). Tool integration is absolutely essential for getting them ac-cepted by engineers during software development and maintenance, and also fororganizing empirical studies on software evolution. Many existing tools, however,are quite monolithic and do not allow easy integration of new extraction, miningor visualization components. To address this issue, we present next a new approachtowards an extensible framework.
3 An Extensible Framework for Mining Software Repositories
The purpose of our extensible framework for repository mining is twofold. First, itprovides a foundation for empirical research on software evolution, both in termsof software tools and methodology. Secondly, it leverages the power of interactivevisualization techniques in the analysis of large amounts of interesting and potentiallyuseful information stored in software repositories. Ultimately, we would like to usethis framework to provide end users with a complete software evolution analysischain. We present next the key design elements of our framework and the compo-nents it integrates so far.
3.1 Data Extraction
As already explained in Section 2, repository data extraction is a serious practicalproblem for building analysis and visualization tools. Most repository access proto-cols, such as implemented in the CVS and Subversion versioning systems, implementonly the basic access functions needed to support the archiving process. In the caseof CVS, navigation commands also do not have a machine-readable output. Whenparsing CVS output, one usually searches for a parser that copes with the outputformat at hand and tries to add it to the experimental setup.
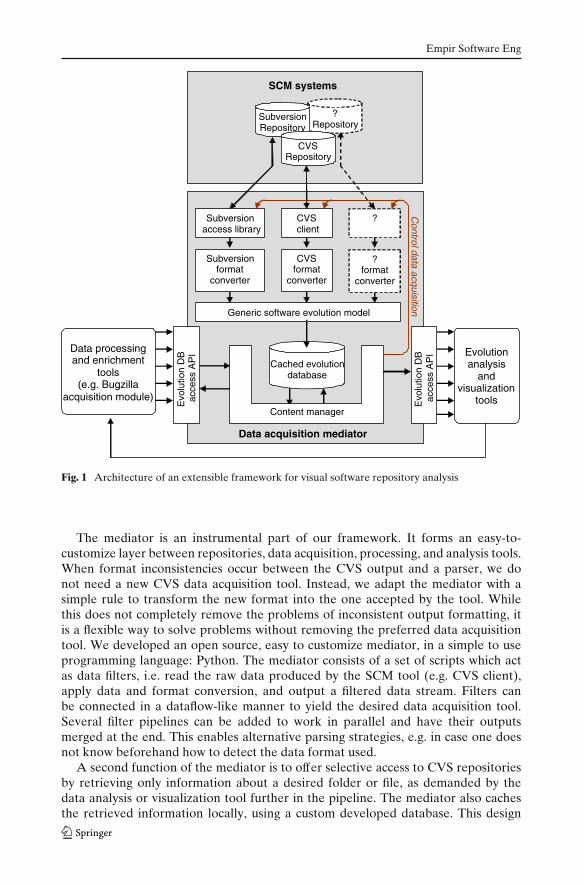
We propose next an approach towards repository data access that simplifies theprocess using a data acquisition mediator (see Fig. 1).
Empir Software Eng
CVS client
Cached evolution database
Data acquisition mediator
Subversion access library
?
Generic software evolution model
Evo
lutio
n D
Bac
cess
AP
I Evolutionanalysis
andvisualization
tools
Data processingand enrichment
tools(e.g. Bugzilla
acquisition module)
Subversionformat
converter
?Repository
SubversionRepository
CVS Repository
SCM systems
Content manager
Control data acquisition
CVS format
converter
? format
converter
Evo
lutio
n D
Bac
cess
AP
I
Fig. 1 Architecture of an extensible framework for visual software repository analysis
The mediator is an instrumental part of our framework. It forms an easy-to-customize layer between repositories, data acquisition, processing, and analysis tools.When format inconsistencies occur between the CVS output and a parser, we donot need a new CVS data acquisition tool. Instead, we adapt the mediator with asimple rule to transform the new format into the one accepted by the tool. Whilethis does not completely remove the problems of inconsistent output formatting, itis a flexible way to solve problems without removing the preferred data acquisitiontool. We developed an open source, easy to customize mediator, in a simple to useprogramming language: Python. The mediator consists of a set of scripts which actas data filters, i.e. read the raw data produced by the SCM tool (e.g. CVS client),apply data and format conversion, and output a filtered data stream. Filters canbe connected in a dataflow-like manner to yield the desired data acquisition tool.Several filter pipelines can be added to work in parallel and have their outputsmerged at the end. This enables alternative parsing strategies, e.g. in case one doesnot know beforehand how to detect the data format used.
A second function of the mediator is to offer selective access to CVS repositoriesby retrieving only information about a desired folder or file, as demanded by thedata analysis or visualization tool further in the pipeline. The mediator also cachesthe retrieved information locally, using a custom developed database. This design
Empir Software Eng
lets one transparently control the trade-off between latency, bandwidth and storagespace in the data acquisition step as desired.
We have been able to test our mediator-based data extraction as part of severalsoftware repository mining challenges at the MSR’06, SoftVis’06, and Vissoft’07scientific events (Voinea and Telea 2006b, c). Getting to the facts in the repositorywas one of the main time-consuming, tedious, tasks for most participants. Themediator solution, complemented by a small amount of scripting, provided us with ameans to quickly get the facts and save more time for the actual visual analysis part.
3.2 Mining Evolutionary Coupling
Raw repository data is too large and low-level to provide insight into the evolution ofsoftware projects. Extra analysis is needed to extract relevant evolution aspects. Animportant analysis use-case is to identify artifacts that have similar evolution. Severalapproaches exist for this task (Bieman et al. 2003; Gall et al. 2003; Ying et al. 2004;Zimmermann et al. 2004). All these approaches use similarity measures (also knownas evolutionary coupling measures) based on recovered repository transactions, i.e.,sets of files committed by a user at some moment. The assumption is that related fileshave a similar evolution pattern, and thus their revisions will often share the samecommit transaction. This information about correlated files is used to predict futurechanges in the analyzed system, from the perspective of a given artifact.
We offer a more general approach that does not take transactions into account butpure commit moments, when searching for similar files. We believe transaction-basedsimilarity measures fail to correlate files that are developed by different authors, havedifferent comments attached, and yet are still highly coupled. To handle such cases,we propose a similarity measure using the time distance between commit moments.If S1 = {ti|i = 1..N} are the commit moments for a file F1 and S2 = {t j| j = 1..M} thecommit moments for F2, we define the similarity between F1 and F2 as the symmetricsum:
Φ(F1, F2) =N∑
i=1
1√max(mint j∈S2 |ti − t j|, k) + l
+M∑
j=1
1√max(minti∈S1 |t j − ti|, k) + l
(1)
where k and l are parameters intended to reduce the influence of completelyunrelated events on the similarity measure (k), and to limit the impact of isolated,yet very similar, events (l). The square root attenuates the influence of the networklatency on the transaction time recorded by the repository. Intuitively, the measureΦ considers, for each commit moment of F1, the closest commit moment from F2,weighted by the inverse time distance between the two moments. In practice, weobtained good results by assigning value 1 to l and 3,600 (seconds) to k. The casestudies presented in Section 5 uses these values.
We next use this measure in an agglomerative clustering algorithm to group filesthat have a similar evolution. The clustering works in a bottom-up fashion, as follows.First, all individual files are placed in their own cluster. Next, the two most similarclusters, as given by the above similarity metric, are found and merged in a parent
Empir Software Eng
cluster, which gets the two original clusters as children. The process is repeated untila single root cluster is obtained. To measure the similarity of non-leaf clusters, we use(1) on all commit moments of all files in the first, respectively second, cluster. Thisis equivalent to a full linkage clustering which is computationally more expensivethan other techniques such as single linkage or k means (Everitt et al. 2001), butoffers a context-independent, more stable, result. To give a practical estimation ofthe efficiency: Clustering a project containing around 850 versions of 2,000 files, usinga C++ implementation of the evolutionary clustering, took just under 5 min on a 2.5GHz Windows PC.1
After the clustering tree is computed, it can be used to obtain a decomposition ofsystem evolution by selecting only those clusters that satisfy a given criterion. Userscan interactively select the most appropriate decomposition in a visual way using,for example, the cluster map widget introduced by Voinea and Telea in (Voinea andTelea 2006d). We added this facility to our framework, using the data acquisitionmediator introduced in Section 3.1 to decouple the calculation of the clustering tree(done in C++ by a standalone program) from the cluster selection widget (done inPython as part of our visualization).
3.3 Visualization
Visualization attempts to provide insight into large and complex evolution data bydelegating pattern detection and correlation discovery to the human visual system.Visualization can also present data analysis results in an intuitive way. Visualizationis a main ingredient of our software repository mining framework.
As a visualization back-end of our framework we integrated the CVSgrabtool (Voinea and Telea 2006a). In its first release (2004), CVSgrab was a toolfor acquiring history information from CVS repositories. Since then, CVSgrab hasevolved into a set of techniques for visualizing project evolution at file level.
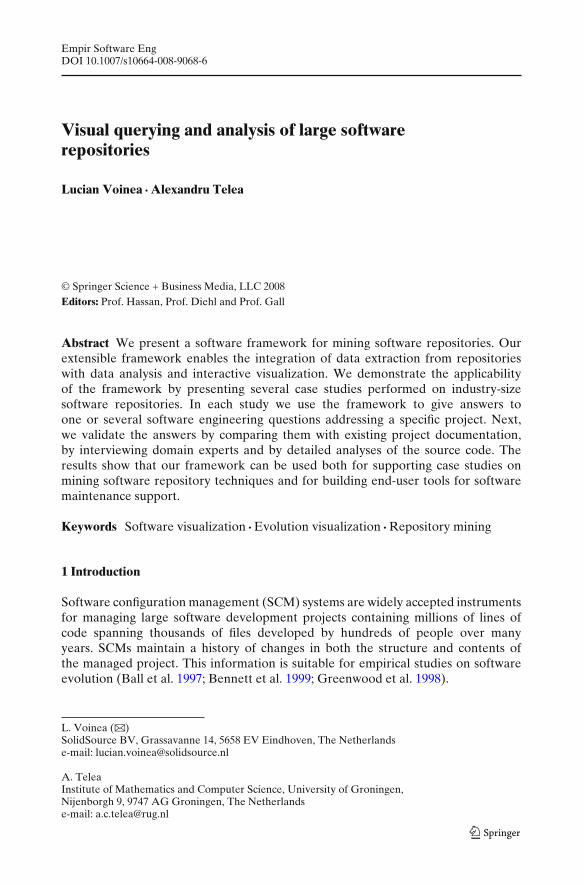
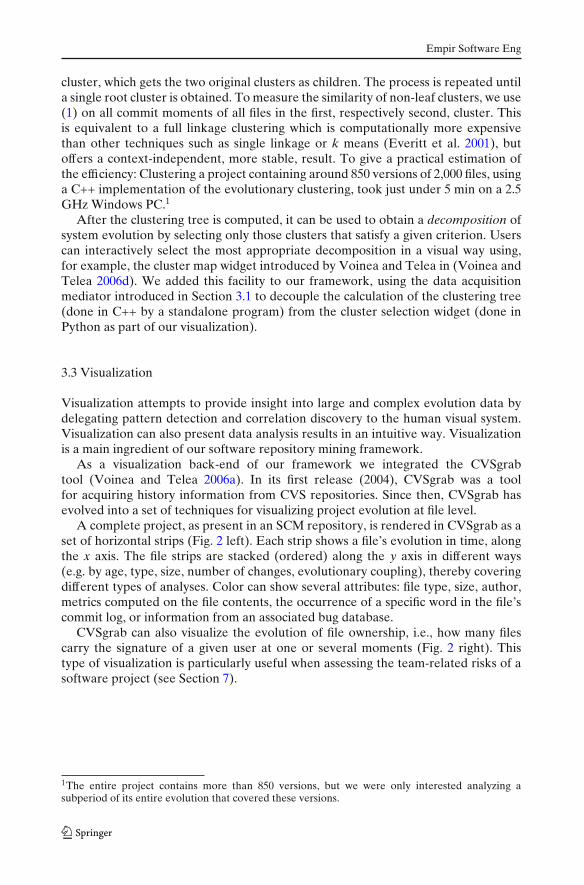
A complete project, as present in an SCM repository, is rendered in CVSgrab as aset of horizontal strips (Fig. 2 left). Each strip shows a file’s evolution in time, alongthe x axis. The file strips are stacked (ordered) along the y axis in different ways(e.g. by age, type, size, number of changes, evolutionary coupling), thereby coveringdifferent types of analyses. Color can show several attributes: file type, size, author,metrics computed on the file contents, the occurrence of a specific word in the file’scommit log, or information from an associated bug database.
CVSgrab can also visualize the evolution of file ownership, i.e., how many filescarry the signature of a given user at one or several moments (Fig. 2 right). Thistype of visualization is particularly useful when assessing the team-related risks of asoftware project (see Section 7).
1The entire project contains more than 850 versions, but we were only interested analyzing asubperiod of its entire evolution that covered these versions.
Empir Software Eng
Time
Files
F1
F2
F3
F4
Color encodes versionbased file metrics
Consecutive versions of file F1
Time
Users / number of files
Evolution of file metrics Evolution of file ownership
User A
User B
Num
ber of files
Fig. 2 CVSgrab visualization of project evolution
Summarizing, the main advantages of our framework as compared to the variousrepository data mining and/or visualization frameworks, are
– A dataflow architecture combining data acquisition, filtering, metric computa-tion, storage, and visualization modules;
– Integrated support for CVS and Subversion repositories;– Handling specific CVS data formats by scripted plug-ins;– Incremental and cached access to data on repositories;– An integrated module for clustering files based on evolutionary coupling;– An integrated visualization module in which all visualization options (e.g. layout,
color encoding, textures) can be customized to reflect any data attribute value(e.g. file size, type, date, author).
In the remainder of this article, we present several case studies that illustratethe applicability of our framework on real-life, industry-size software repositories.In all these studies, we connected the evolutionary coupling and clustering algo-rithm (Section 3.2) to the CVSgrab visualization back-end (outlined above) throughthe data acquisition mediator (Section 3.1) to form a complete evolution analysissolution. This solution was then used by us to answer the questions stated in theintroduction. Next, we confronted domain experts with the results and other existinginformation in order to (in)validate them. Finally, we presented the complete toolsetto the domain experts and collected feedback on other issues, such as usability andintuitiveness.
4 Case Study: Assessment of Repository Management Style
In the first study, we analyzed the evolution of two open source software (OSS)projects to investigate how changes are committed in repositories. In order to ensureconsistency in OSS projects where many developers join the team, only a fewdevelopers are typically allowed to make project-wide changes. Often, the changescommitted by these ‘repository managers’ incorporate the work of many otherdevelopers who do not have commit rights, represent project-wide updates such
Empir Software Eng
as code beautification, or represent considerable work gathered into a single ‘bulkcommit’. Hence, simply equating the user(s) who perform the most changes withthe most insightful persons in the project can be misleading. Those users might havecommitted the changes of other less privileged developers. Also, code beautificationoperations touch a lot of files, but that does not mean the user performing them hasintimate knowledge over them.
To assess if the above takes place (or not) for a given repository, i.e. to answerquestions Q1 and Q2, we performed an investigation using the framework intro-duced in Section 3 and validated the results using the information available in thecorresponding project documentation and on the project website. We examined twoprojects: ArgoUML and PostgreSQL.
4.1 ArgoUML
The first project we analyzed was ArgoUML, an object-oriented design tool with a6-year evolution of 4,452 files developed by 37 authors. Using the data acquisitionmediator (Section 3.1), we retrieved the project information from the public CVSrepository. For this, we had to extend the CVS format converter such that file nameswith spaces were correctly handled.
Once the format converter had been patched, data acquisition took 31 min overa T1 Internet connection: 8 min for the initial setup (i.e., retrieval, in full, of thelast version of 59 MB) and 23 min to retrieve the evolution data to be visualized(20 MB). After being retrieved, all data was cached by the acquisition mediator.Any subsequent updates of this information, e.g. when new versions appear in therepository, require only a time proportional with the number of changed files. Hence,when only a few files are changed, updating the cached data only requires a coupleof seconds.
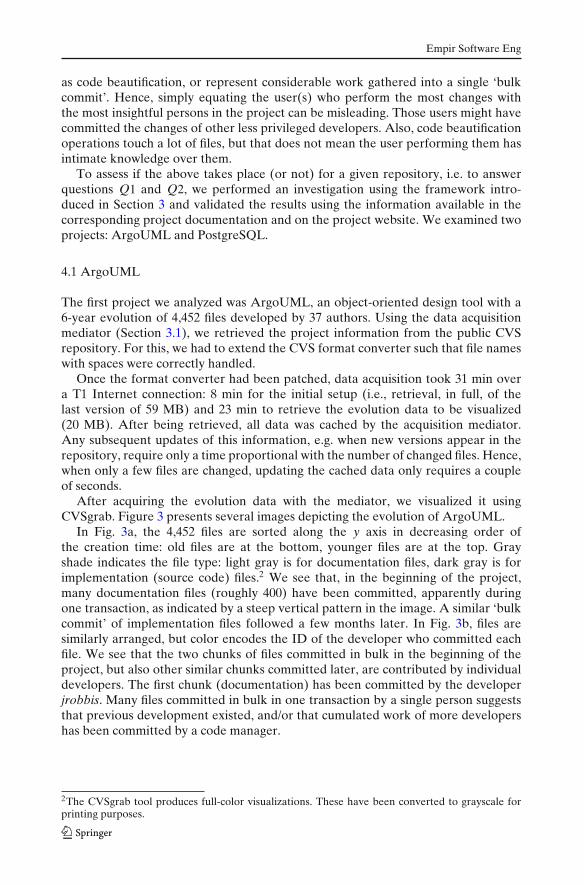
After acquiring the evolution data with the mediator, we visualized it usingCVSgrab. Figure 3 presents several images depicting the evolution of ArgoUML.
In Fig. 3a, the 4,452 files are sorted along the y axis in decreasing order ofthe creation time: old files are at the bottom, younger files are at the top. Grayshade indicates the file type: light gray is for documentation files, dark gray is forimplementation (source code) files.2 We see that, in the beginning of the project,many documentation files (roughly 400) have been committed, apparently duringone transaction, as indicated by a steep vertical pattern in the image. A similar ‘bulkcommit’ of implementation files followed a few months later. In Fig. 3b, files aresimilarly arranged, but color encodes the ID of the developer who committed eachfile. We see that the two chunks of files committed in bulk in the beginning of theproject, but also other similar chunks committed later, are contributed by individualdevelopers. The first chunk (documentation) has been committed by the developerjrobbis. Many files committed in bulk in one transaction by a single person suggeststhat previous development existed, and/or that cumulated work of more developershas been committed by a code manager.
2The CVSgrab tool produces full-color visualizations. These have been converted to grayscale forprinting purposes.
Empir Software Eng
documentation
implementation
time time
contribution mvw contribution linus
contribution all developers
first import jrobbins
contribution kataka linus vs. mvw
files
files
files
A B
C D
E F
G H
number of file commits linus mvw
file types
Fig. 3 ArgoUML evolution visualization with CVSgrab
Figure 3g shows a list of the most active developers. The list is sorted based on thenumber of file commits associated with each person, shown as a bar for each personname. We see that linus, mvw and kataka are the most active developers. However,the many files they contribute (compared to other developers) suggests they have the
Empir Software Eng
role of code managers, i.e. they commit the work of more developers, taking care ofthe code consistency.
Figure 3e depicts the commit moments of kataka. Dark gray dots show the fileversions he committed. We see that kataka has not been active in the last 18 months.In contrast, Fig. 3c and d, indicates that linus and mvw are active code managers.
Figure 3f uses color to visualize the contributions of linus (light gray) and mvw(dark gray). Figure 3h shows a zoom-in on a selected area. In both images, we seethat both linus and mvw have a similar contribution style. They typically commitmany files at one moment, but also make individual smaller commits. This suggeststhey both do project-wide operations, such as code beautification, and also do issue-specific code updates, possibly provided by other developers.
We validated our observations on the evolution of ArgoUML by comparingthem with the information available in the project documentation and on theofficial project website (ArgoUML, www.http://argouml.tigris.org/). According tothis information, ArgoUML has been started by Jason Robbins prior to 1995, andpreliminary versions have been made public as early as 1998. The repository hasbeen only populated in early 2000, by the same developer. According to the samewebsite, prior to 1999, more developers took part in the development of ArgoUML,for example Jim Holt and Curt Arnold. This validates our hypothesis that previouswork, done by several developers, existed before the first files were stored in therepository.
We also consulted the list of committed members available on the project websiteto investigate the role of kataka, linus and mvw. According to the list, kataka hasbeen a major developer only until release 0.18 of ArgoUML, in April 2005, anddid not contribute to later releases. This confirmed our observation about katakabeing an important developer who was inactive in the last 18 months of recordeddevelopment. The list further revealed that linus has the role of a project leader,being also responsible for all releases. This explains his contribution pattern, whichaffects in general many files at the same moment, and confirms our hypothesis oflinus being an important code manager. Additionally, the list reveals that mvw is incharge of code documentation. This can also explain why he modifies many files atonce, performing project-wide modifications that may not be issue-specific.
4.2 PostgreSQL
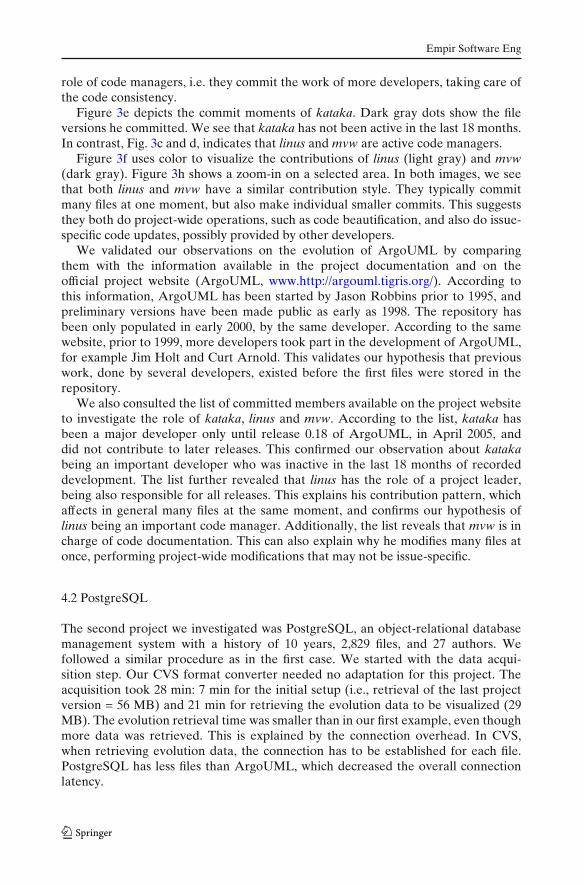
The second project we investigated was PostgreSQL, an object-relational databasemanagement system with a history of 10 years, 2,829 files, and 27 authors. Wefollowed a similar procedure as in the first case. We started with the data acqui-sition step. Our CVS format converter needed no adaptation for this project. Theacquisition took 28 min: 7 min for the initial setup (i.e., retrieval of the last projectversion = 56 MB) and 21 min for retrieving the evolution data to be visualized (29MB). The evolution retrieval time was smaller than in our first example, even thoughmore data was retrieved. This is explained by the connection overhead. In CVS,when retrieving evolution data, the connection has to be established for each file.PostgreSQL has less files than ArgoUML, which decreased the overall connectionlatency.
Empir Software Eng
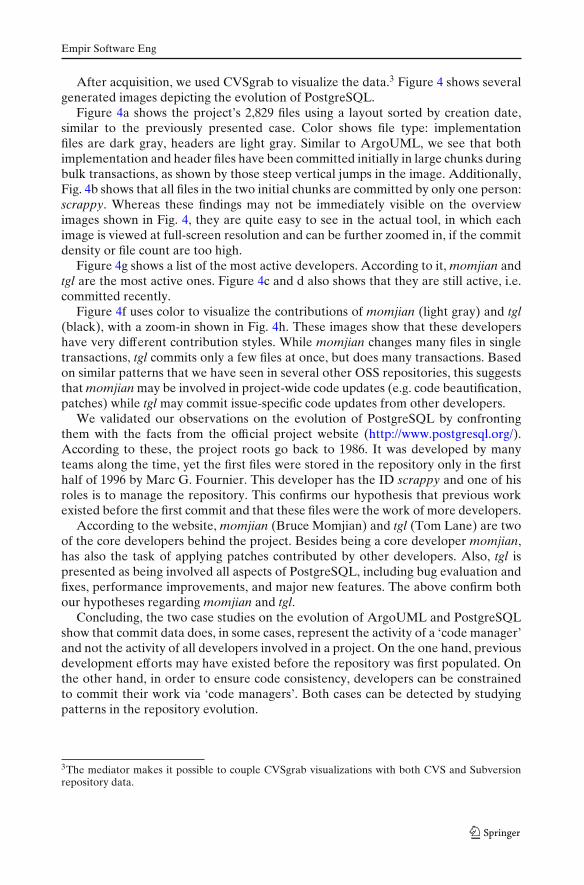
After acquisition, we used CVSgrab to visualize the data.3 Figure 4 shows severalgenerated images depicting the evolution of PostgreSQL.
Figure 4a shows the project’s 2,829 files using a layout sorted by creation date,similar to the previously presented case. Color shows file type: implementationfiles are dark gray, headers are light gray. Similar to ArgoUML, we see that bothimplementation and header files have been committed initially in large chunks duringbulk transactions, as shown by those steep vertical jumps in the image. Additionally,Fig. 4b shows that all files in the two initial chunks are committed by only one person:scrappy. Whereas these findings may not be immediately visible on the overviewimages shown in Fig. 4, they are quite easy to see in the actual tool, in which eachimage is viewed at full-screen resolution and can be further zoomed in, if the commitdensity or file count are too high.
Figure 4g shows a list of the most active developers. According to it, momjian andtgl are the most active ones. Figure 4c and d also shows that they are still active, i.e.committed recently.
Figure 4f uses color to visualize the contributions of momjian (light gray) and tgl(black), with a zoom-in shown in Fig. 4h. These images show that these developershave very different contribution styles. While momjian changes many files in singletransactions, tgl commits only a few files at once, but does many transactions. Basedon similar patterns that we have seen in several other OSS repositories, this suggeststhat momjian may be involved in project-wide code updates (e.g. code beautification,patches) while tgl may commit issue-specific code updates from other developers.
We validated our observations on the evolution of PostgreSQL by confrontingthem with the facts from the official project website (http://www.postgresql.org/).According to these, the project roots go back to 1986. It was developed by manyteams along the time, yet the first files were stored in the repository only in the firsthalf of 1996 by Marc G. Fournier. This developer has the ID scrappy and one of hisroles is to manage the repository. This confirms our hypothesis that previous workexisted before the first commit and that these files were the work of more developers.
According to the website, momjian (Bruce Momjian) and tgl (Tom Lane) are twoof the core developers behind the project. Besides being a core developer momjian,has also the task of applying patches contributed by other developers. Also, tgl ispresented as being involved all aspects of PostgreSQL, including bug evaluation andfixes, performance improvements, and major new features. The above confirm bothour hypotheses regarding momjian and tgl.
Concluding, the two case studies on the evolution of ArgoUML and PostgreSQLshow that commit data does, in some cases, represent the activity of a ‘code manager’and not the activity of all developers involved in a project. On the one hand, previousdevelopment efforts may have existed before the repository was first populated. Onthe other hand, in order to ensure code consistency, developers can be constrainedto commit their work via ‘code managers’. Both cases can be detected by studyingpatterns in the repository evolution.
3The mediator makes it possible to couple CVSgrab visualizations with both CVS and Subversionrepository data.
Empir Software Eng
implementation
headers
time time
contribution tgl contribution momjian
contribution scrappy
first import
contribution petere momjian vs. tgl
files
files
files
A B
C D
E F
G H
number of file commits momjian tgl
file types
Fig. 4 PostgreSQL evolution visualization with CVSgrab
Empir Software Eng
5 Case Study: System Decomposition Based of Evolutionary Coupling
An important question that most developers ask when trying to understand asoftware system is “what are the high-level building blocks?” (Q3). To answer thisquestion, we use the history information stored in SCM repositories, by computinga system decomposition hierarchy based on evolutionary coupling (Section 3.2).However technically simple to compute, one should still ask: How accurately doessuch a decomposition reflect the actual building blocks used in the software?
We answered this question by studying the decomposition based on evolutionarycoupling of the mCRL2 software package (http://www.mcrl2.org). mCRL2 is atoolset for modeling, validation, and verification of concurrent systems and protocols.It contains 2,635 files contributed by 15 developers during 30 development months.mCRL2 is hosted on a Subversion repository.
We started with the data acquisition step. The Subversion format converterneeded no adaptations for this project. The acquisition took 20 min. This relativelylow acquisition time as compared with the previous cases is explained by the richerfunctionality of Subversion repositories, which can deliver a list of their contents.Consequently, the initial set-up step specific to CVS repositories was not required inthis case.
Once the information has been acquired, we used the evolutionary couplingdecomposition component of our framework (Section 3.2). The component operateson the evolution data cached by the data acquisition mediator. We planned tovalidate the results by using a domain expert involved in the development of mCRL2to assess the computed decomposition. We used as domain expert Jeroen van derWulp, one of the main architects behind mCRL2. At his suggestion, we applied thedecomposition on the sip subsystem, i.e. that part of the software with which he wasmost familiar. This subsystem contains 65 files and implements the interface betweenvarious tools available in mCRL2, and a central controller. The computation of theagglomerative clustering tree took only 2 s.
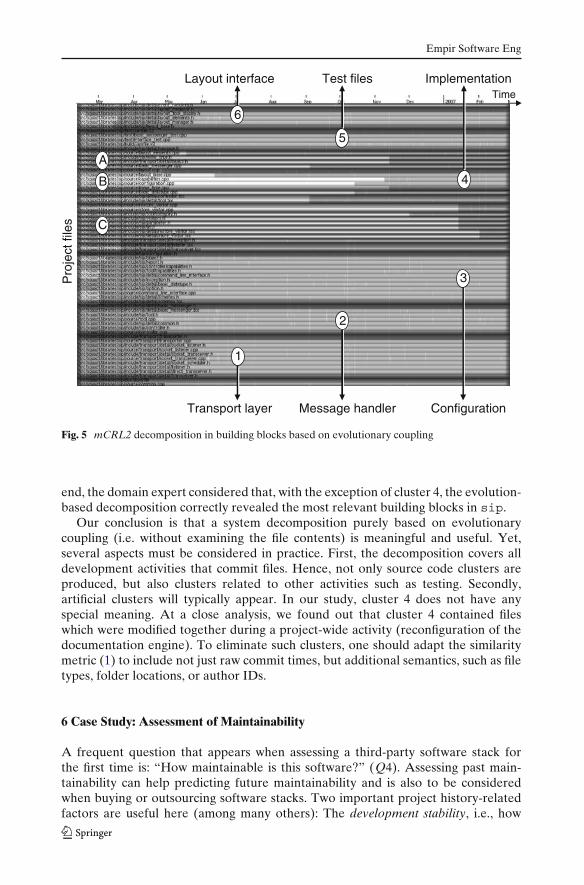
After the clustering, we used CVSgrab to select a decomposition based on similarcohesion (Voinea and Telea 2006a). Figure 5 shows the resulting decomposition,containing six main clusters (numbered 1–6) and a number of unclustered files (Aand C). Files in the same cluster are visually emphasized using the so-called plateaucushions, dark at the edges and bright in the middle, implemented as described in(Voinea and Telea 2006a). We concluded that the sip component has six high-level building blocks, and we asked the opinion of the domain expert on thisdecomposition.
The expert analyzed the names of the files in each cluster and then indicated themain role they refer to in the design of the sip component. He identified clusters1, 2, 3, and 6 as a meaningful view on the architecture of the sip component with4 building blocks. The meaning of each clusters is shown as annotations in Fig. 5.Clusters 1, 2, and 6 contain mostly files correctly located in their correspondingbuilding block (hence they are a good decomposition). Cluster 3 contains also a fewfiles logically belonging to other blocks (hence is a less useful decomposition). Cluster5 does not contains files in a building block, but groups files used for testing the sipsubsystem. Finally, cluster 4 groups the remainder of the files in the project. Thedomain expert analyzed also the names of the unclustered files (e.g. A,C in Fig. 5)and concluded they are weakly related to one of the main clusters 1, 2, 3, or 6. In the
Empir Software Eng
Transport layer Message handler Configuration
Implementation Test filesLayout interface
1
2
3
4
5
6
C
B
A
Time
Pro
ject
file
s
Fig. 5 mCRL2 decomposition in building blocks based on evolutionary coupling
end, the domain expert considered that, with the exception of cluster 4, the evolution-based decomposition correctly revealed the most relevant building blocks in sip.
Our conclusion is that a system decomposition purely based on evolutionarycoupling (i.e. without examining the file contents) is meaningful and useful. Yet,several aspects must be considered in practice. First, the decomposition covers alldevelopment activities that commit files. Hence, not only source code clusters areproduced, but also clusters related to other activities such as testing. Secondly,artificial clusters will typically appear. In our study, cluster 4 does not have anyspecial meaning. At a close analysis, we found out that cluster 4 contained fileswhich were modified together during a project-wide activity (reconfiguration of thedocumentation engine). To eliminate such clusters, one should adapt the similaritymetric (1) to include not just raw commit times, but additional semantics, such as filetypes, folder locations, or author IDs.
6 Case Study: Assessment of Maintainability
A frequent question that appears when assessing a third-party software stack forthe first time is: “How maintainable is this software?” (Q4). Assessing past main-tainability can help predicting future maintainability and is also to be consideredwhen buying or outsourcing software stacks. Two important project history-relatedfactors are useful here (among many others): The development stability, i.e., how
Empir Software Eng
dynamically is the code changing, and the code cleanness, i.e., what is the quality ofthe intermediate versions.
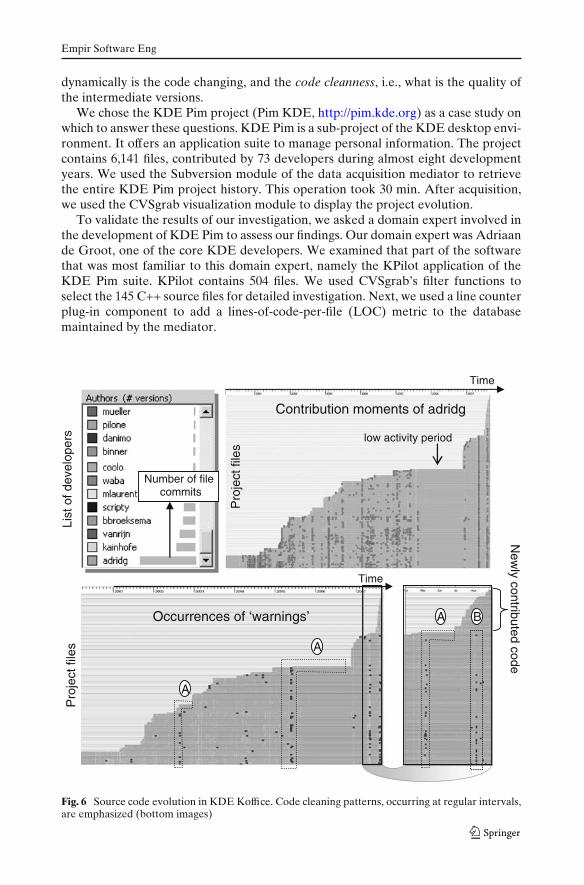
We chose the KDE Pim project (Pim KDE, http://pim.kde.org) as a case study onwhich to answer these questions. KDE Pim is a sub-project of the KDE desktop envi-ronment. It offers an application suite to manage personal information. The projectcontains 6,141 files, contributed by 73 developers during almost eight developmentyears. We used the Subversion module of the data acquisition mediator to retrievethe entire KDE Pim project history. This operation took 30 min. After acquisition,we used the CVSgrab visualization module to display the project evolution.
To validate the results of our investigation, we asked a domain expert involved inthe development of KDE Pim to assess our findings. Our domain expert was Adriaande Groot, one of the core KDE developers. We examined that part of the softwarethat was most familiar to this domain expert, namely the KPilot application of theKDE Pim suite. KPilot contains 504 files. We used CVSgrab’s filter functions toselect the 145 C++ source files for detailed investigation. Next, we used a line counterplug-in component to add a lines-of-code-per-file (LOC) metric to the databasemaintained by the mediator.
List
of d
evel
oper
s
Contribution moments of adridg
Occurrences of ‘warnings’
New
ly contributed code
A
A
A B
Number of file commits
low activity period
Time
Pro
ject
file
s
Pro
ject
file
s
Time
Fig. 6 Source code evolution in KDE Koffice. Code cleaning patterns, occurring at regular intervals,are emphasized (bottom images)
Empir Software Eng
Figure 6 (top left) shows the developers sorted on number of commits, whichyields adridg (Adriaan de Groot) as the main developer. In Fig. 6 (top right), filesare drawn sorted on inverse creation time—old files are at bottom, most recent onesare at top. The dark dots show the commits (time and file) of adridg. We quickly see aflat region without any commit events (dark dots). This is a low-activity developmentmoment, in which we can assume the software is in a stable state. Another interestingaspect regarding the maintainability of KPilot is shown in Fig. 6 (bottom). Filesare laid out as above, but the dots mark the presence of the word “warnings” inthe commit logs. This word often appears in logs reporting that compiler warningshave been removed, indicating that a thorough code inspection has been done.Such code cleaning happens when the code is stable and no planned (refactoring)changes are foreseen. In Fig. 6 (bottom), we see several “L” shaped patterns (A)that indicate many files being changed while removing “warnings”, right before a lowactivity period. This suggests that as functionality is implemented and the softwarehas reached a stable phase, the code is carefully inspected and compiler warningsare removed before continuing development. This suggests KPilot is a thoroughlymaintained project. A different project-wide code clean step is seen in the zoom-in image (marker B). Here, only old code is modified to remove compile warnings.
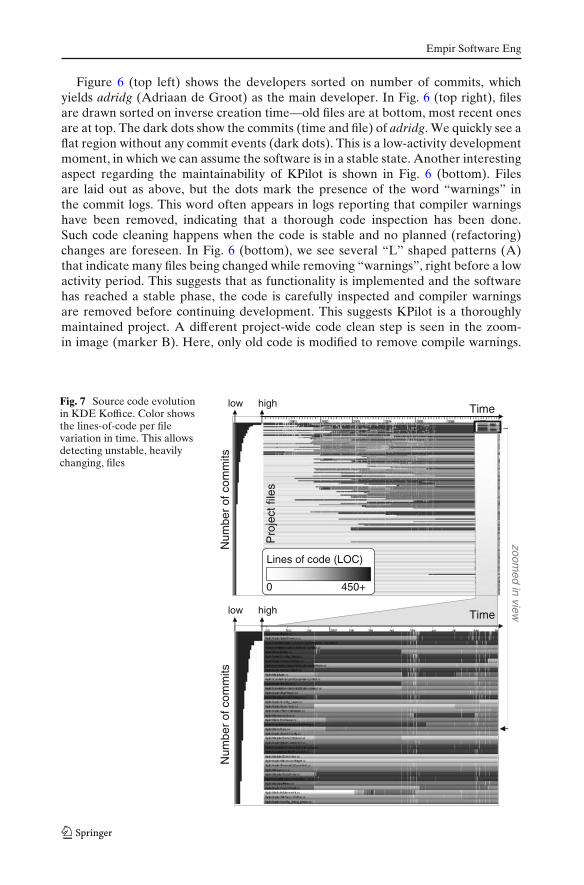
Fig. 7 Source code evolutionin KDE Koffice. Color showsthe lines-of-code per filevariation in time. This allowsdetecting unstable, heavilychanging, files
Time
Lines of code (LOC)
0 450+
Pro
ject
file
s
Num
ber
of c
omm
its
low high
low high Time
Num
ber
of c
omm
its
zoomed in view
Empir Software Eng
The newly contributed code (at top of image) is probably not yet stable, so it is notcleaned up.
Figure 7 shows code files sorted on activity (number of commits) and coloredwith the LOC metric. As expected, the most active files (at top) are also amongthe oldest. Since we measure activity as absolute number of commits, older fileswhich are still changed get potentially a higher chance to be recognized as active. Toemphasize recently active files, if desired, we can use the activity metric computed ona subperiod, e.g. few latest months, of the entire history.
However, we also discover these most active files are not very stable. Themagnified region shows the latest versions of some of the most active files. Theseare not stable files, as the LOC metric (gray shade) varies a lot for each file.
Our findings described above were validated by the domain expert, who couldrecognize his work patterns in our results. We conclude that the visual correlationof several attributes, such as project activity, specific patterns in commit logs, andsource code metrics, can deliver valuable insights on code stability and maintenancestyle (e.g. periodic code cleaning operations). Hence, the presence of such patternscan be used as a sign of good maintainability. However, as it appeared when askinga developer unfamiliar with the KPilot code base and only slightly familiar withCVSgrab, identifying such visual patterns clearly takes some training time (overone hour). An improvement we consider is to detect and visually highlight patternsof interest.
7 Case Study: Assessment of Project Team Risks
A set of important questions for project managers are “What are the team-relatedrisks?”, “What happens if a developers leaves the team?” and “What will be theeffort of replacing the leaving person?” (Q5) In this section, we show how evolutiondata, mined from software repositories, can help answering these questions.
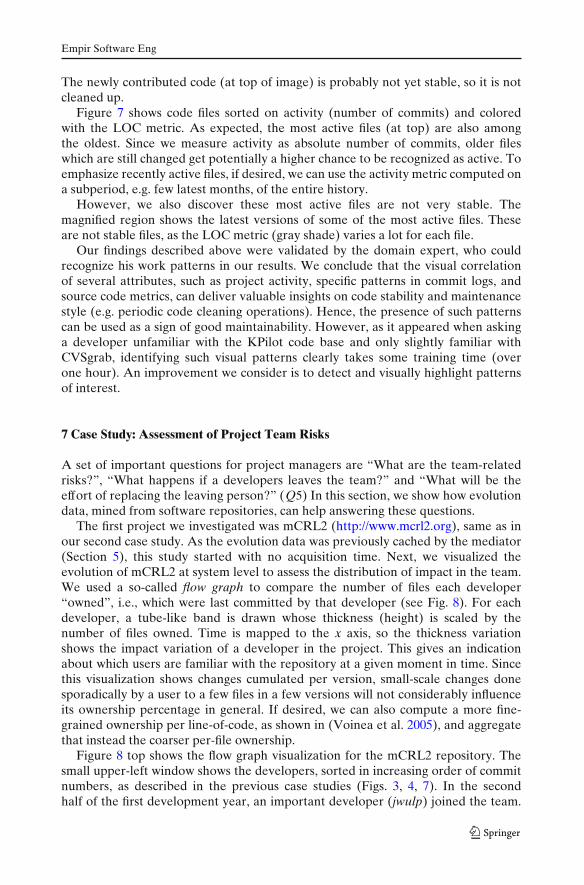
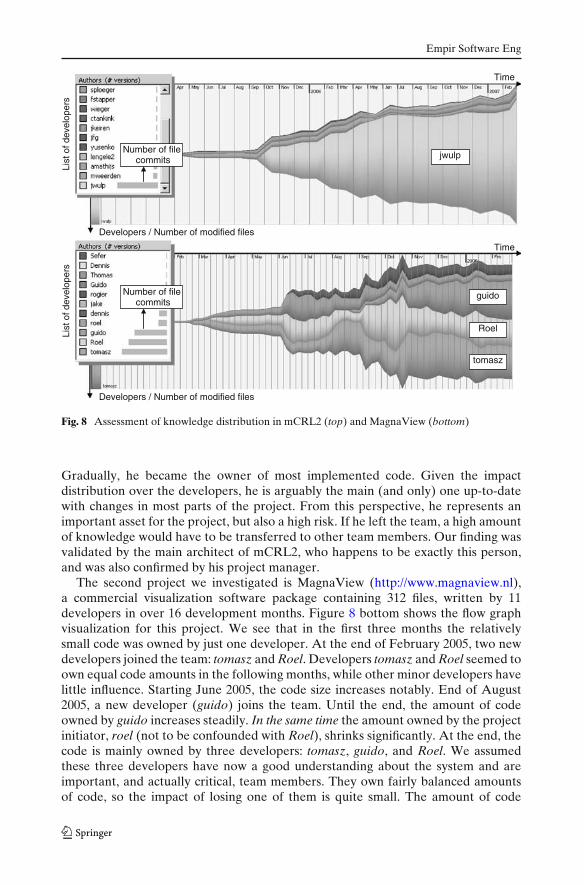
The first project we investigated was mCRL2 (http://www.mcrl2.org), same as inour second case study. As the evolution data was previously cached by the mediator(Section 5), this study started with no acquisition time. Next, we visualized theevolution of mCRL2 at system level to assess the distribution of impact in the team.We used a so-called flow graph to compare the number of files each developer“owned”, i.e., which were last committed by that developer (see Fig. 8). For eachdeveloper, a tube-like band is drawn whose thickness (height) is scaled by thenumber of files owned. Time is mapped to the x axis, so the thickness variationshows the impact variation of a developer in the project. This gives an indicationabout which users are familiar with the repository at a given moment in time. Sincethis visualization shows changes cumulated per version, small-scale changes donesporadically by a user to a few files in a few versions will not considerably influenceits ownership percentage in general. If desired, we can also compute a more fine-grained ownership per line-of-code, as shown in (Voinea et al. 2005), and aggregatethat instead the coarser per-file ownership.
Figure 8 top shows the flow graph visualization for the mCRL2 repository. Thesmall upper-left window shows the developers, sorted in increasing order of commitnumbers, as described in the previous case studies (Figs. 3, 4, 7). In the secondhalf of the first development year, an important developer (jwulp) joined the team.
Empir Software Eng
Number of file commits
List
of d
evel
oper
sLi
st o
f dev
elop
ers
Number of file commits jwulp
tomasz
Roel
guido
Time
Time
Developers / Number of modified files
Developers / Number of modified files
Fig. 8 Assessment of knowledge distribution in mCRL2 (top) and MagnaView (bottom)
Gradually, he became the owner of most implemented code. Given the impactdistribution over the developers, he is arguably the main (and only) one up-to-datewith changes in most parts of the project. From this perspective, he represents animportant asset for the project, but also a high risk. If he left the team, a high amountof knowledge would have to be transferred to other team members. Our finding wasvalidated by the main architect of mCRL2, who happens to be exactly this person,and was also confirmed by his project manager.
The second project we investigated is MagnaView (http://www.magnaview.nl),a commercial visualization software package containing 312 files, written by 11developers in over 16 development months. Figure 8 bottom shows the flow graphvisualization for this project. We see that in the first three months the relativelysmall code was owned by just one developer. At the end of February 2005, two newdevelopers joined the team: tomasz and Roel. Developers tomasz and Roel seemed toown equal code amounts in the following months, while other minor developers havelittle influence. Starting June 2005, the code size increases notably. End of August2005, a new developer (guido) joins the team. Until the end, the amount of codeowned by guido increases steadily. In the same time the amount owned by the projectinitiator, roel (not to be confounded with Roel), shrinks significantly. At the end, thecode is mainly owned by three developers: tomasz, guido, and Roel. We assumedthese three developers have now a good understanding about the system and areimportant, and actually critical, team members. They own fairly balanced amountsof code, so the impact of losing one of them is quite small. The amount of code
Empir Software Eng
owned by the other eight minor developers is very small, so they are non-critical tothe development.
We used as validation the opinion of Roel Vliegen, the main software architectbehind MagnaView, as domain expert. Our distribution of developers in terms of(critical) team impact was found to be correct. We concluded that the flow graphvisualization showing the evolution of team members’ impact provides a simple,intuitive, and highly effective way for managers to discover and/or monitor theimpact distribution over a team. The flow graphs were particularly appreciatedexactly because of their simplicity, as compared to more complex imagery such asthe decomposition clusters (Fig. 5). In particular, flow graphs were easily understood,and appreciated, by non-technical persons (managers). However, the flow graph viewwas most effective when correlated with other views, such as the member list sortedbased on impact, as well as the evolution of file metrics (Fig. 2 left).
8 Discussion
In the previous sections, we have described a number of case studies showing howour visualization framework can be used to discover several facts and perform severalassessments on software repositories. At this point, an important question is: Howmuch can we generalize from these studies to the applicability of our approach andthe presented analyses to any software repository in general?
Several observations can be made here. First, all the chosen repositories(ArgoUML, PostgreSQL, mCRL2, KDE Pim, and MagnaView) contain largeprojects spanning several thousands of files each, tens of developers, and changescovering several years. During related past studies, we also analyzed the Mozillacode, which contains over ten thousand files (Voinea and Telea 2007). This makesus believe that our methods and tools are technically scalable to industry-size repos-itories. Second, the techniques presented here do not analyze the file contents, butonly the repository commit data. While this makes the range of performed analysesless specific, e.g. we could not perform duplication or clone evolution analysis onsource code, this also makes our techniques lightweight, fast, and generic, as we donot need to transfer or analyze the actual file contents.
Second, we chose for the case studies repositories ranging from OSS projects(ArgoUML, PostgreSQL, KDE Pim) to academic software (mCRL2) and commer-cial software (MagnaView). Software is developed and maintained in different waysin these three types of communities. We performed our different types of analyses(repository management style, system decomposition using evolutionary coupling,maintainability assessment, and team risk assessment) on all these repositories,although we described here only a subset thereof, for space constraints. From theseresults, we believe that the proposed methods and techniques should be applicable toany type of software repository in a range of organizations, as long as the repositorydata is accessible via a suitable mediator.
Third, we chose different types of information for validation: project historymanually extracted from documentation and websites (ArgoUML, PostgreSQL) anddiscussions with actual developers and project managers (mCRL2, KDE Pim, andMagnaView). In none of the case studies were we involved, directly or not, in the
Empir Software Eng
development or code-level usage of the studied code bases. In two cases (mCRL2and MagnaView), the domain experts involved in the validation briefly saw ourvisualizations, but they were not told of our interpretation of the visual patternsuntil after they validated our findings. Given these, we conclude that users familiarwith our visualization tools can effectively perform correct assessments of severalevolution aspects on unknown repositories.
A separate question to discuss relates to the effectiveness of our visualizations.A visualization is effective if users can detect patterns in it which correlate withevents in the displayed data. So which are the most salient patterns of our evolutionvisualizations, and why do they show?
One of the most frequently used visual patterns are colored pixel blocks. Giventhe 2D time-by-file layout used (Fig. 2), semi-compact, same-color, near-rectangularpixel blocks show file versions which are related by two attributes (sorting (y axis)and coloring) and related in time (x axis). After such blocks are found, their meaningdepends on the axes’ and color encoding, showing e.g. owned code (Section 4) orcode-cleaning events or unstable files (Section 6). Clusters essentially use the samerectangular visual pattern, on a higher scape, to show this time files evolving together(Section 5). A quite different pattern are the ‘code flows’ used to show evolution ofdevelopers’ impact (Section 7). This pattern is easy to interpret: tube thickness showscontribution amount, color shows identity. Thickening tubes, from right to left, show‘code owners’ who become gradually more important. A very similar pattern wassuccessfully used in computer games to show evolution of players in time (MicrosoftInc 2007).
9 Conclusions
We presented a framework for visual data mining and analysis of software reposito-ries and its application in supporting various assessments of software developmentand maintenance processes. Our main goals were to determine, through case studieswith concrete projects, developers, and questions, whether the insights generatedby our tools do indeed match the reality; which were the most usable and usefultools; and to test the effectiveness of visual analysis tools for understanding softwarerepositories in practice.
Through this study, we have reached several conclusions. The critical require-ments for visual analysis tools (on software repositories) are simplicity, genericity,and integration. Visual techniques (and their user interfaces) need to be simple tobe understood and accepted. Our simplest techniques: 2D Cartesian layouts, colorencoding attributes, and sorting on any attribute, are easy to grasp and performinteractively with a few mouse clicks. We presented also a new visualization, theflow graphs, which shows team impact distribution over time in a simple, aggregated,manner. This visualization was especially appreciated by project managers who aretypically farther away from the code. More complex techniques, such as the evolu-tionary coupling based clusters (Section 3.2, are considerably harder to understand,even by more advanced users. Next, the proposed techniques have to be generic:any technique (e.g. color mapping or sorting) can be applied on any attribute (e.g.author IDs or the LOC metric). This allows users to construct analysis scenarios
Empir Software Eng
interactively with a few mouse clicks. Finally, the complete framework has to be fullyintegrated with existing repositories. Our solution, a network of scripted componentsconnected by a dataflow engine to a central fact database, allows rapid customizationfor different repository standards and formats. This proved to be essential in doingthe case studies, as all users we talked to, whether from the academia or the industry,suggested that they would generally reject a tool-chain having a complex, tediousset-up phase.
Our second goal was to develop an experimenting framework, both in soft-ware tools and methodology, for research on software evolution. Our framework,consisting of a set of data filters, metric computation components, and a visualizationback-end, all coupled together via a scriptable data acquisition mediator to theactual repositories, provides a flexible way to construct visual analysis scenariostargeting concrete questions in a few minutes up to about one hour. Our framework isillustrated by four different case studies (of a larger set that we performed), coveringanalysis of repository management style, system decomposition, maintainability,and project team risks, over three industry-size Open Source projects (ArgoUML,PostgreSQL, KDE Koffice), one academic system (mCRL2) and one commercialsystem (MagnaView). Virtually all our findings were positively verified by domainexperts who were not involved in the analysis. Also, we had no prior knowledgeabout the analyzed systems.
This positive news has to be, however, put into perspective. In all cases, the per-sons performing the visual analysis were reasonably familiar with our visualizationframework. An important subsequent question is whether actual developers in thefield will be able to get the same results with our tools in a comparable amount oftime. Answering this is still an open question. In a follow-up set of case studies, weplan to assess the usability of our toolset by its end-users and, also, refine and extendthose visual techniques which are best accepted by the users. Finally, we are workingon extending our toolset with new metrics (e.g. an improved evolutionary coupling)that target new specific questions of our users.
References
Ball T, Kim JM, Porter AA, Siy HP (1997) If your version control system could talk.... In: Proc. ICSE’97 workshop on process modeling and empirical studies of software engineering
Bennett K, Burd E, Kemerer C, Lehman MM, Lee M, Madachy R, Mair C, Sjoberg D, Slaughter S(1999) Empirical studies of evolving systems. Empirical Soft Eng 4(4):370–380
Bieman JM, Andrews AA, Yang HJ (2003) Understanding change-proneness in oo software throughvisualization. In: IWPC’03: Proc. intl. workshop on program comprehension. IEEE CS Press,pp 44–53
Burch M, Diehl S, Weißgerber P (2005) Visual data mining in software archives. In: SoftVis ’05: Proc.ACM symposium on software visualization. ACM Press, pp 37–46
Collberg C, Kobourov S, Nagra J, Pitts J, Wampler K (2003) A system for graph-based visualizationof the evolution of software. In: SoftVis’03: Proc. ACM symposium on software visualization.ACM Press, pp 77–86
Cubranic D, Murphy GC, Singer J, Booth KS (2005) Hipikat: a project memory for software devel-opment. IEEE Trans Softw Eng 31(6):446–465
Eick SG, Steffen JL, Sumner EE (1992) SeeSoft—a tool for visualizing line oriented softwarestatistics. IEEE Trans Soft Eng 18(11):957–968
Empir Software Eng
Everitt E, Landau S, Leese M (2001) Cluster analysis. Arnold Publishers, IncFischer M, Pinzger M, Gall H (2003) Populating a release history database from version control and
bug tracking systems. In: ICSM’03: Proc. intl. conference on software maintenance. IEEE CSPress, pp 23–32
Froehlich J, Dourish P (2004) Unifying artifacts and activities in a visual tool for distributed softwaredevelopment teams. In: ICSE’04: Proc. intl. conference on software engineering. IEEE CS Press,pp 387–396
Gall H, Jazayeri M, Krajewski J (2003) CVS release history data for detecting logical couplings. In:IWPSE’03: Proc. intl. workshop on principles of software evolution. IEEE CS Press, pp 13–23
German D, Mockus A (2003) Automating the measurement of open source projects. In: Proc.ICSE’03 workshop on open source software engineering, pp 63–38
German D, Hindle A, Jordan N (2004) Visualizing the evolution of software using SoftChange. In:ICSEKE’04: Proc. 16th intl. conference on software engineering and knowledge engineering,pp 336–341
Greenwood RM, Warboys B, Harrison R, Henderson P (1998) An empirical study of the evolution ofa software system. In: ASE’98: Proc. 13th conference on automated software engineering. IEEECS Press, pp 293–296
Lanza M (2001) The evolution matrix: recovering software evolution using software visualizationtechniques. In: IWPSE’01: Proc. intl. workshop on principles of software evolution. ACM Press,pp 37–42
Lopez-Fernandez L, Robles G, Gonzalez-Barahona JM (2004) Applying social network analysisto the information in cvs repositories. In: MSR’04: Proc. intl. workshop on mining softwarerepositories. IEEE CS Press
Microsoft Inc (2007) Age of empires game. www.microsoft.com/games/empiresVoinea L, Telea A (2006a) CVSgrab: mining the history of large software projects. In: EuroVis’06:
Proc. eurographics/IEEE-VGTC symposium on visualization. IEEE CS Press, pp 187–194Voinea L, Telea A (2006b) How do changes in buggy Mozilla files propagate? In: SoftVis ’06: Proc.
ACM symposium on software visualization. ACM Press, pp 147–148Voinea L, Telea A (2006c) Mining software repositories with CVSgrab. In: MSR ’06: Proc. intl.
workshop on mining software repositories. ACM Press, pp 167–168Voinea L, Telea A (2006d) Multiscale and multivariate visualizations of software evolution. In:
SoftVis ’06: Proceedings of the 2006 ACM symposium on software visualization. ACM Press,pp 115–124
Voinea L, Telea A (2007) Visual data mining and analysis of software repositories. Comput Graph31(3):410–428
Voinea L, Telea A, van Wijk JJ (2005) Visualization of code evolution. In: SoftVis’05: Proc. ACMsymposium on software visualization. ACM Press, pp 47–56
Wu J, Spitzer C, Hassan A, Holt R (2004a) Evolution spectrographs: visualizing punctuated changein software evolution. In: IWPSE’04: Proc. intl. workshop on principles of software evolution.IEEE CS Press, pp 57–66
Wu X, Murray A, Storey MA, Lintern R (2004b) A reverse engineering approach to support softwaremaintenance: version control knowledge extraction. In: WCRE ’04: Proceedings of the 11thworking conference on reverse engineering (WCRE’04). IEEE Computer Society, Washington,DC, USA, pp 90–99
Ying ATT, Murphy GC, Ng R, Chu-Carroll MC (2004) Predicting source code changes by miningrevision history. IEEE Trans Soft Eng 30(9):574–586
Zimmermann T, Weisgerber P (2004) Preprocessing CVS data for fine-grained analysis. In: MSR’04:Proc. intl. workshop on mining software repositories
Zimmermann T, Weisgerber P, Diehl S, Zeller A (2004) Mining version histories to guide softwarechanges. In: ICSE ’04: Proc. intl. conference on software engineering. IEEE CS Press, pp 563–572
Empir Software Eng
Lucian Voinea received a Professional Doctorate in Engineering degree (PDEng) from theEindhoven University of Technology (Netherlands) in 2003 and a PhD degree in computer sciencefrom the same university in 2007. Starting from 1999, he worked as a freelance contractor forcompanies in Romania, Netherlands and US. His research interests include methods, technologiesand tools for the analysis of quality attributes of large software systems, and in particular the analysisof software evolution. He recently co-founded SolidSource, a start-up company specialized in toolsand services for the maintenance of software systems (www.solidsource.nl).
Alexandru Telea received his PhD in 2000 from the Eindhoven University of Technology in theNetherlands. He worked at the same university as an assistant professor in data visualization until2007, when he received an adjunct professor position in software visualization from the University ofGroningen, the Netherlands. He has pioneered several innovative methods in visualizing complexinformation related to software systems, reverse engineering, and software evolution. He hasbeen the lead developer and architect of several software systems for reverse engineering, datavisualization, visual programming, and component-based development. He has published over 100articles and one book in the above fields.
![Efficiently Querying Large XML Data Repositories: A Surveythejoeshow.net/pdf/xml-stream/xquery-large-repos.pdf1.2.1 Database-Style XML Queries XMLPathLanguage(XPath)[27]andXQuery[30],originally](https://img.pdfslide.us/doc/110x75/601964c1b21fa73bfd15d2d6/efficiently-querying-large-xml-data-repositories-a-121-database-style-xml-queries.jpg)