Embed Size (px)
Citation preview

Visual Impact Assessment
Project Lima - Steelpoort
Submitted to Bohlweki Environmental
By MetroGIS (Pty) Ltd Office 222 Building No.17b
CSIR Meiring Naude Road
Pretoria
Contact: Dawie van Vuuren Tel. 012 349 2884
e-mail: [email protected]
March 2007

Project Lima Visual Impact Assessment
1
CONTENTS 1. INTRODUCTION....................................................................................................... 2
2. SCOPE AND LIMITATIONS ..................................................................................... 2
3. METHODOLOGY FOR THE ASSESSMENT OF VISUAL IMPACT ........................ 3
3.1 Status Quo: Regional Overview & Visual Character .................................... 3
3.2 Potential Visual Exposure .............................................................................. 6
3.3 Visual Distance / Observer Proximity to the Proposed project .................. 7
3.3 Viewer Incidence / Viewer Perception ......................................................... 11
3.4 Visual Absorbtion Capacity.......................................................................... 12
3.5 Visual Impact Assessment ........................................................................... 13
3.6 Visual Impact Index....................................................................................... 19
4 LIGHTING ............................................................................................................... 21
5 VISUAL IMPACT DURING CONSTRUCTION ....................................................... 23
6 COMMUNICATIONS MAST VISIBILITY ................................................................ 23
7 CONCLUSION ........................................................................................................ 25
REFERENCES ............................................................................................................... 26

Project Lima Visual Impact Assessment
2
VISUAL IMPACT ASSESSMENT 1. INTRODUCTION The proposed pumped storage hydroelectricity scheme in the Steelpoort area, known as Project Lima, comprises an all encompassing development of a reservoir, a dam, a power station, and associated infrastructure. The scheme it is located on the Mpumalanga Escarpment between the Nebo Plateau (Thaba Ya Sekhukhune) and the Steelpoort River valley . The significance of the location from a visual perspective is the cliff of approximately 700 meter which flattens out as a plateau on top, and widens out into a valley at the bottom, as indicated on Map 1. Since the topography will play an important role in the visual impact assessment, the availability of high quality contours will dictate the extent of the study area. Map 1: Location of upper reservoir on the plateau and lower dam in the valley
2. SCOPE AND LIMITATIONS The scope of work entails a visual impact assessment of the structural elements of the proposed project. The study will focus on the main form giving elements that are envisaged to impact on the character of the area. These include the following:
• Upper Reservoir • Lower Dam • Switch yard • Administrative Complex • Construction camps (temporary structures iro of housing, stockpile, etc) • Communications mast
The specific issues to be addressed include the following:
• A detailed desktop study to determine the visual character of the area surrounding the proposed scheme.
• To determine the view shed i.e. Identify all possible observation sites from which the proposed scheme will be visible.
• The visual absorption capacity i.e. to measure the ability of landscapes to visually accept/accommodate the proposed scheme.
• To identify elements of visual quality that would be affected by the proposed scheme.

Project Lima Visual Impact Assessment
3
• Describe and evaluate the specific visual impacts of the scheme taking into consideration the following:
o Critical view points
o Extent and spatial scale
o Intensity and severity
o Magnitude and significance
• Recommend mitigation measures to reduce the potential visual impacts generated by the proposed transmission line.
• The visual assessments must be represented spatially on a map/s
The limitations to conduct a sound visual impact of the proposed scheme, are mainly contributed to the availability and the quality of data. Sufficient geographical data was provided to conduct a full visual impact assessment for the proposed scheme, however most of the data (with the exception of contours) lacked descriptive (attribute) data. The existing data was supplemented with land cover / land use data captured specifically for this project from the monochrome aerial photographs. Although the data has a high spatial resolution, the temporal accuracy cannot be confirmed, since the date of the photography is unknown. Assumptions were made with regard to the extent of farming activities in the area as well as residential villages, to the effect that any changes would not have a significant impact on the findings of this study. The only accurate way data could be improved, was be to conduct a full scale ground truthing exercise, but this was not possible due to time and budget constraints. 3. METHODOLOGY FOR THE ASSESSMENT OF VISUAL IMPACT The methodology for this visual impact assessment is based on extensive spatial analysis using GIS techniques, and incorporating the data obtained from the client, supplemented with data captured in-house. A series of independent spatial analysis operations are conducted, which are integrated as a synthesis to arrive at a visual impact index as a final conclusion. 3.1 Status Quo: Regional Overview & Visual Character The visual character of the study area has been assessed by means of two processes, i.e.
An analysis of GIS data, and in particular the following: o Land cover data captured from aerial photography and satellite imagery; o Topographic data derived from contours.
The quantification of data in terms of a model The general character of the study area is shaped firstly by the topographical features of an escarpment and a river valley, and secondly by land use consisting of commercial farming in the valley, and rural residential villages on the plateau, as indicated on Map 2. A scenic preference model was used to quantify each land use category in terms of the visual quality thereof. This model is base on a study undertaken in Queensland Australia, which involved a large community participation project to determine people’s perceptions of different landscapes with different “disturbing“ factors. A set of parameters for visual impact assessment was developed from the findings of the study. These parameters are regarded as representative for the purpose of this study, and have therefore been applied (refer to Table 1 and Map 3).

Project Lima Visual Impact Assessment
4
Map 2: The Use of Land in the Study Area
In terms of the scenic preference model, the visual character is classified as Low, Medium, High or Very High. The model provides for a visual quality rating of 1 – 4 for different land cover types, which is used later on to create a visual impact index. Table 1: Visual Quality Classification of Land Cover Types in the Study Area
Land Cover VQ_Value Visual Quality Woodland 4 Very High Thicket, Bushland, Bush Clumps 4 Very High Natural Bare Rock & Soil 4 Very High Grassland 4 Very High Degraded Grassland 3 High Subsistence Dry Land 2 Medium Commercial Irrigated 2 Medium Commercial Dry Land 2 Medium Residential, Formal Township 1 Low Erosion, Dongas, Gullies 1 Low The visual quality of most of the study area has a rating of Very High, as indicated on Map 3a. This is contributed to the view-dominating escarpment and undisturbed bush land and grassland. Low visual quality is mostly associated with human activity where natural vegetation or land is disturbed. The impact of the proposed scheme on the visual quality of the area will be severely adverse, as indicated in Map 3b.

Project Lima Visual Impact Assessment
5
Map 3a: Visual Quality of the Study Area (current)
Map 3b: Possible Impact of the Proposed project on the Visual Quality of the Study Area

Project Lima Visual Impact Assessment
6
3.2 Potential Visual Exposure Potential visual exposure is determined by means of a viewshed analysis of the proposed project. Since the upper reservoir and the lower dam represent the largest structures in terms of height and footprint, they are used as geographical features to conduct the viewshed analysis. A series of points are taken along the perimeter of each feature, and the visibility of each point is calculated across the study area, taking into account the topography and the height of these features. With the aid of GIS, the topography of the study area is modeled into a digital terrain model, based on the contour data (see Map 4). The terrain is characterised by an escarpment-like topography, with a relative flat plateau, a 700m high escarp, and a valley. The terrain on the plateau renders a high degree of visual exposure, whereas the escarp and ridges in the valley render a degree of screening from exposure. Map 4: The Topography of the Study Area (proposed dams shown on the plateau and in the valley)
Due to the topographic characteristics of the study area, and the fact that the proposed development is occurring in two distinct locations, a varying degree of exposure will be experienced. As indicated on Map 5, the upper dam will be visible mainly form the high lying areas of the plateau, and from a far distance in the valley. The lower dam will be visible from its immediate surroundings in the valley. Both dams will be visible from high lying areas and from further distances away, especially from the north-east.

Project Lima Visual Impact Assessment
7
Map 5: Viewshed Analysis of the Proposed Project
No Visibility Both Dams Lower Dam Only Upper Dam Only
3.3 Visual Distance / Observer Proximity to the Proposed project The principle of reduced impact over distance is applied in order to determine the core area of visual impact for the proposed project. Using GIS buffering and calculation functions, the width of the upper dam wall, viewed from incremental distances of 1 km, were measured. The results are displayed on a graph in Figure 1. The width of the dam, as viewed from the direction of the villages, is approximately 1700m. It is generally assumed that an object this wide, will be predominantly visible from an equal distance. Hence the proximity impact is measured from a distance of 1 km and further away from the object. At 2000m from the viewing location the relative exposure decreases to 50%, and it further decreases to 25% at a distance of 4000m. Figure 1: Relationship between exposure and proximity
Proximity Impact
0
2
4
6
8
10
12
14
16
18
20
1 2 3 4 5 6
Distance from Dam (km)
Mea
sure
d D
am L
engt
h on
3D-
map
(c
m)

Project Lima Visual Impact Assessment
8
Given the enormous extent of the project in total, it must be assumed that large structures, especially the dams, will be visible from a long distance. For the purposes of the visual impact assessment, however, the analysis is limited to a radius of 5 km. A series of 1 km radii were created around each dam (refer to Map 6), and based on the above criteria the following are concluded.
0 – 1000 meters. Short distance view where the structures will dominate the frame of vision and constitute a very high visual prominence.
1 km – 2 km. Medium distance where the structures would still fill most of the frame of vision and be easily and comfortable visible. This would constitute a high visual prominence.

Project Lima Visual Impact Assessment
9
2 km – 3 km. Medium distance where the structures would become part of the visual
environment, but would still be dominant and recognizable. This zone constitutes a medium visual prominence.
3 km – 5 km. Medium to longer distance where the structures would become part of the visual environment to a greater extent, but would still be visible and recognizable when focused upon. This zone constitutes a medium to low visual prominence.

Project Lima Visual Impact Assessment
10
Greater than 5 km. Long distance view of the proposed project where structures would still be visible. However, from this distance structures would be assimilated by the environment. This constitutes a low visual prominence.
The proximity buffers created for the two routes are indicated on Map 6 to indicate the scale and viewing distance. (It is important to note that the screening effect of the topography is ignored in this analysis). Map 6: Viewer Proximity

Project Lima Visual Impact Assessment
11
3.3 Viewer Incidence / Viewer Perception The number of observers and their perception of a structure determine the concept of visual impact. If there are no observers, or if the visual perception of the structure is favorable to all the observers, there would be no visual impact. It is necessary to identify areas of high viewer incidence and to classify certain areas according to the observer’s visual sensitivity towards the proposed project. It is also necessary to generalise the viewer incidence and sensitivity to some degree, as there are many variables when trying to determine the perception of the observer. This includes regularity of sighting, cultural background, state of mind, purpose of sighting, etc. which would create a myriad of options. For the purpose of this study two areas have been classified as having differing observer incidences and/or perceptions, i.e. roads and residential areas.
Roads. Roads concentrate people who use it to reach a routine destination (e.g. work, or shopping), a holiday or recreational destination, or just as part of a leisure experience. The road network in the study area consists of a Main Road (R555), a Secondary Road (R579) and a number of Other Roads, mainly dirt roads giving access to farms. The R555 carries approximately 2000 vehicles per day, passing through the Steelpoort area. The R579 mainly carries residents of the villages on the plateau.
The incidence of viewers will be relatively high on the R-routes, and low on the local dirt roads. It is envisaged that the perception of the observers on these two routes will vary from neutral (iro local people) to negative (iro travelers). Negative perceptions are mainly contributed to the contrast between the general natural environment and the infrastructure associated with the proposed project.
Residential Areas (Villages and farmsteads). The villages Sehlakwane and Mphurome are situated on the plateau, within 2 – 5 km from the upper dam. Farmsteads are located in a dispersed pattern in the lower valley area. The incidence of viewers will be high in the villages, but it will be low on farmsteads. Based on the public participation meetings that were held earlier during the project, it is concluded that a neutral viewer perception is likely, although occurrences of a negative perception must be expected where the viewer incidence is high.
In general, negative viewer perception are associated with high incidence of viewers. Map 7 gives a visualisation of these possibilities.

Project Lima Visual Impact Assessment
12
Map 7: Viewer Incidence & Perception
3.4 Visual Absorbtion Capacity Visual absorption capacity (VAC) indicates the relative ability of the landscape to accept the changes brought about by human alteration, with the least loss of landscape character and scenic value. These indicators are based on characteristics of the immediate landscape. The following factors are taken into account:
• land use / land cover, • topography,
The sheer size and extent of the proposed project within a predominantly natural area, with a rural residential and farming character, renders it very difficult to be absorbed visually by other features. The only possibilities are structures within the villages which might shield the observer from viewing parts of the development. Whereas building material will be source from the immediate environment, it will only be effective at far distances where structures will not appear so large. Other than the topography shielding visibility, the structures associated with the project will be highly visible at medium to short distances. Map 7: Visual Absorbtion Capacity

Project Lima Visual Impact Assessment
13
3.5 Visual Impact Assessment Each of the above impact areas are further described in terms of a visual impact matrix, and is based on the impact criteria shown in table 2: Table 2: Matrix of Impact Criteria Extent (distribution) National
4 Regional 3
Local 2
Site 1
Duration (Time Period of Impact)
Permanent 4
Long-term 3
Medium-term 2
Short-term 1
Intensity Very High 4
High 3
Moderate 2
Low 1
Probability of occurrence
Definite 4
Highly Probable 3
Possible 2
Improbable 1
In addition, these criteria are weighted in terms of importance. The weight of each criterion is expressed as a percentage of its validity. This is deemed necessary to avoid distortion of the final weighting score by less important criteria. The basis of the visual impact analysis is the quantification of information, which was created by means of data processing, most of which is geographically orientated. The resulting geographical data was further analysed by means of database operations. The final analysis for each of the impact areas is described by means of a series of matrixes in the next couple of pages:

Project Lima Visual Impact Assessment
14
1. Visual Quality
Rating Matrix for Visual Quality impacts
Criteria Rating Weighting of Rating
Final Rating
Extent = Local 2 80.00% 1.6 Duration = Permanent 4 50.00% 2 Intensity = Very High (ave 3.5)
4 100.00% 4
Probability of occurrence = Definite
4 80.00% 3.2
Total 14 10.8 This is rated as a High Negative Impact before the implementation of mitigation and management measures Mitigation and Management measures - Rehabilitation of construction camps - Landscaping of sites, especially lower dam - Enhance lower dam as a water feature
Criteria Rating
Extent 2 80.00% 1.6 Duration 4 50.00% 2 Intensity 2 100.00% 2 Probability of occurrence 4 80.00% 3.2 Total 12 8.8 This is rated as a Medium Negative Impact after the implementation of mitigation and management measures

Project Lima Visual Impact Assessment
15
2. Visibility
Rating Matrix for Visibility
Criteria Rating Weighting of Rating
Final Rating
Extent = Regional 3 80.00% 2.4 Duration = Permanent 4 50.00% 2 Intensity = Low (ave 1.1) 1 100.00% 1 Probability of occurrence = Definite
4 80.00% 3.2
Total 12 8.6 This is rated as a Medium Negative Impact before the implementation of mitigation and management measures Mitigation and Management measures - None, since it is unlikely that the topography of the area will change
Criteria Rating
Extent 3 80.00% 2.4 Duration 4 50.00% 2 Intensity 1 100.00% 1 Probability of occurrence 4 80.00% 3.2 Total 12 8.6 This is rated as a Medium Negative Impact after the implementation of mitigation and management measures
Project Lima Visual Impact Assessment
16
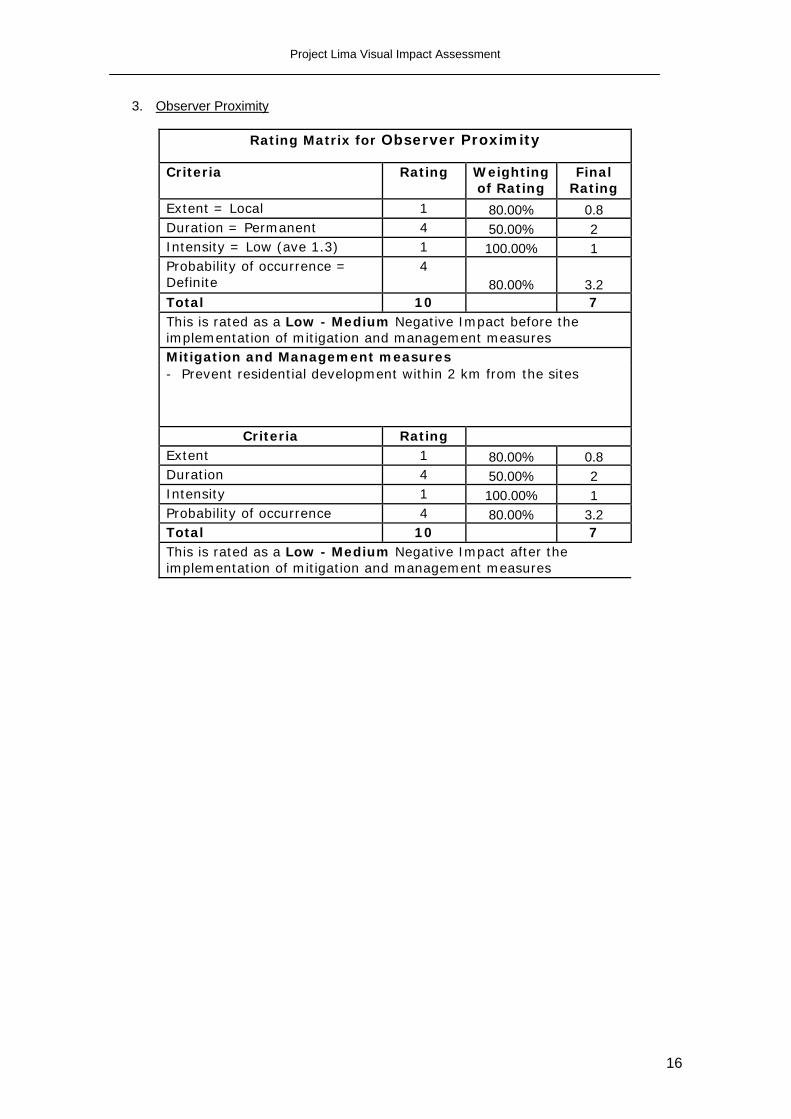
3. Observer Proximity
Rating Matrix for Observer Proximity
Criteria Rating Weighting of Rating
Final Rating
Extent = Local 1 80.00% 0.8 Duration = Permanent 4 50.00% 2 Intensity = Low (ave 1.3) 1 100.00% 1 Probability of occurrence = Definite
4 80.00% 3.2
Total 10 7 This is rated as a Low - Medium Negative Impact before the implementation of mitigation and management measures Mitigation and Management measures - Prevent residential development within 2 km from the sites
Criteria Rating
Extent 1 80.00% 0.8 Duration 4 50.00% 2 Intensity 1 100.00% 1 Probability of occurrence 4 80.00% 3.2 Total 10 7 This is rated as a Low - Medium Negative Impact after the implementation of mitigation and management measures

Project Lima Visual Impact Assessment
17
4. Viewer Incidence & Perception
Rating Matrix for Observer Incidence & Perception
Criteria Rating Weighting of Rating
Final Rating
Extent = Regional 3 80.00% 2.4 Duration = Permanent 4 50.00% 2 Intensity = Medium (ave 2) 2 100.00% 2 Probability of occurrence = Definite
4 80.00% 3.2
Total 13 9.6 This is rated as a Medium Negative Impact before the implementation of mitigation and management measures Mitigation and Management measures - Promote the site as a tourist attraction to positively influence viewer perception
Criteria Rating
Extent 3 80.00% 2.4 Duration 4 50.00% 2 Intensity = Low 1 100.00% 1 Probability of occurrence 2 80.00% 1.6 Total 10 7 This is rated as a Low - Medium Negative Impact after the implementation of mitigation and management measures

Project Lima Visual Impact Assessment
18
5. Visual Absorbtion Capacity
Rating Matrix for Visual Absorbtion Capacity
Criteria Rating Weighting of Rating
Final Rating
Extent = Regional 3 100.00% 3 Duration = Permanent 4 50.00% 2 Intensity = Very High (ave 3.8)
4 100.00% 4
Probability of occurrence = Definite
4 100.00% 4
Total 15 13 This is rated as a Very High Negative Impact before the implementation of mitigation and management measures Mitigation and Management measures - Ensure that construction material will not contrast with the environment i.r.o texture and colour
- Shield administrative buildings and access roads with appropriate landscaping techniques
Criteria Rating Extent 3 100.00% 3 Duration 4 50.00% 2 Intensity = High 3 100.00% 3 Probability of occurrence 2 100.00% 2 Total 12 10 This is rated as a High Negative Impact after the implementation of mitigation and management measures

Project Lima Visual Impact Assessment
19
3.6 Visual Impact Index The methodology followed in this study demonstrates a strong spatial analysis component. The resulting datasets, as discussed above, were integrated in a further analysis to arrive at a conclusive result. By applying the values of the matrix indicated in table 2, a final visual impact index was created. The outcome of the visual impact index is shown in table 3 and represented as a range of shading colours in Map 8. Table 3: Calculated average for assessment areas, where visibility is true.
Visual Quality
Viewer Perception
Proximity Visual Absorbtion Capacity
Total Rating
3.52 2 1.3 3.8 2.95 Map 8: Visual Impact Index

Project Lima Visual Impact Assessment
20
Visual Impact Index
Rating Matrix for Final VIA Index
Criteria Rating Weighting of Rating
Final Rating
Extent = Regional 3 80.00% 2.4 Duration = Permanent 4 50.00% 2 Intensity = High (ave 2.95) 3 100.00% 3 Probability of occurrence = Definite
4 80.00% 3.2
Total 14 10.6 This is rated as a High Negative Impact before the implementation of mitigation and management measures Mitigation and Management measures - All mitigation measures implemented as proposed
Criteria Rating
Extent 3 80.00% 2.4 Duration 4 50.00% 2 Intensity = Medium 2 100.00% 2 Probability of occurrence 2 80.00% 1.6 Total 11 8 This is rated as a Medium Negative Impact after the implementation of mitigation and management measures

Project Lima Visual Impact Assessment
21
4 LIGHTING The possible impact of night-time lighting associated with the project structures is assessed separate from the above impact elements, because of its uniqueness. Since the project is still in a feasibility phase, and no detail design of lighting infrastructure is available, the possible effects are based on basic criteria and certain assumptions. Impacts occur as a result of spill light and glare. Spill light can be defined as the illumination that is produced by a light source or a combination of light sources at a point or surface, whereas glare is associated with the brightness of lighting as an image experienced by the observer. Impacts from spill light are normally related to interruption of sleep but may also interfere with other light-sensitive areas such as outdoor activities and leisure. Glare results from a direct line of sight to a light source and the reflection from a light source and can be disabling to motorists and pedestrians. With regard to the proposed project, light sources are likely to be present at the following locations:
Switchyard Tunnel inlets and outlets Administrative buildings
The setting of the switchyard, administrative buildings and lower dam in front of a 700m mountain face, is noted for the possibility of light reflection. Being close against the slope, it is possible that the lower parts of the slope will be illuminated by light sources, especially security lights at the switchyard and the dams. The compounding effect of glare generated by lighting sources in close proximity of each other is also noted. This effect is illustrated in Figure 5 (note this is only for illustration purposes). Figure 5. Illustration of mountain slopes illuminated by spill light.
Possible affected areas include farm houses and residential areas closer than 2 km from the light sources, as well as the section of road passing within 2 km from the lower dam site (refer to Map 9). The impact of lighting is judged on the scale and intensity of lighting sources, as compared with other sources in the surrounding areas, which are mainly farmsteads and residential villages. Compared to these, the effect of lighting associated with the project will be severely adverse and appropriate control measures need to be considered.

Project Lima Visual Impact Assessment
22
Map 9: Possible Impact of Lighting
Rating Matrix for Lighting
Criteria Rating Weighting of Rating
Final Rating
Extent = Local 2 100.00% 2 Duration = Permanent 4 100.00% 4 Intensity = Very High 4 100.00% 4 Probability of occurrence = Definite
4 100.00% 4
Total 14 14 This is rated as a Very High Negative Impact before the implementation of mitigation and management measures Mitigation and Management measures - The use of mast lighting should be avoided - All light sources should be directed downwards, and away from the mountain side mountain side - Light sources should be shielded where appropriate
Criteria Rating Extent 2 100.00% 2 Duration 4 100.00% 4 Intensity = Medium 3 100.00% 3 Probability of occurrence 3 100.00% 3 Total 12 12 This is rated as a High Negative Impact after the implementation of mitigation and management measures

Project Lima Visual Impact Assessment
23
5 VISUAL IMPACT DURING CONSTRUCTION The construction of the proposed project in its totality represents a transition from the current setting to a new multi-faceted development. It is inevitable that the visual impact of construction activities will be severely adverse. There are little to no measures to control the visual impact of construction activities per se. It is important, however to attend to construction yards where building material is stocked, and workers’ housing, which will be temporary features. These should be managed in such a way that they cause minimum distraction from an aesthetical point of view. 6 COMMUNICATIONS MAST VISIBILITY An additional analysis was conducted to determine the visibility (line of sight) between a fixed location on the mountain top, and a location near or on top of the administration buildings. These locations are indicated on Map 10a. Map 10a: Location of masts for line-of-sight (viewshed) analysis
A viewshed analysis was undertaken, based on 1 meter contours for the site. These contours are of high accuracy which makes a detailed analysis possible. This is required to determine the viewshed of different mast heights. An analysis was undertaken for the upper mast varying in heights between 2m and 45 m. The height and exact location of the lower mast is irrelevant, since the line of sight to the upper mast is determined from ground level. The result of the analysis is shown in Maps 10b – 10d.

Project Lima Visual Impact Assessment
24
Map 10b: Viewshed analysis for upper mast – height 45 meter
Map 10c: Viewshed analysis for upper mast – max. height 45 meter, min. height 02 meter

Project Lima Visual Impact Assessment
25
Map 10d: Viewshed analysis for upper mast – varying heights between 45m- 02m
7 CONCLUSION The construction of a feature as huge and extensive as Project Lima introduces a highly contrasting feature into the environment. The character of the study area in general reflects a high degree of natural veld, with human activities related to rural settlements. The escarpment-like topography of the area renders it a very high visual quality which will be impacted upon by the proposed development. In order to conduct a visual impact assessment that is objective, a data driven methodology was followed, most of which within a geographical context. That quantification of information made it possible to arrive at conclusive assessments for a range of elements. The result of the analysis is summarized in Table 14.9. Summary of Visual Impact Assessment
Visual Impact Elements Assessed Possible Impact without
Mitigation Measures
Possible Impact with Mitigation
Measures
Visual Quality High Medium Visibility Medium N/a Observer Proximity Medium - Low Low - Medium Viewer Incidence & Perception Medium Low - Medium Visual Absorbtion Capacity Very High High VIA Index High Medium Lighting Very High High

Project Lima Visual Impact Assessment
26
Construction Very High High The visual impact of the proposed development will be adverse, the significance of which varies from very high to medium, as indicated by the Visual Impact Index. As indicated in Map 8, though, these impacts are localised and mostly associated with proximity to the site. However, the overall impact after mitigation measures are implemented is a medium negative significance. The area is sparsely populated with critical visual receptor points localised at villages, farmsteads and on roads. At these points, the adverse impact will be significant. Cognisance must be taken of Lighting as an important visual impact with an annoyance element linked to it. It is recommended that design specific mitigation measures be drawn up as soon as details of lighting design become available. With regard to construction, care are must be taken to maintain temporary structures and building yards at an aesthetic acceptable level. In conclusion, visual impacts associated with Project Lima are unavoidable, but it is believed the proposed project does not hold a fatal flaw that would restrict the development from taking place. REFERENCES Oberholzer, B. 2005. Guideline for Involving Visual and Aesthetic Specialists In EIA Processes: Edition 1. CSIR Report No ENV-S-c 2005 053 F. Republic of South Africa, Provincial Department of the Western Cape, Department of Environmental Affairs & Development Planning, Cape Town. <http:// www.oum.qld.gov.au/?id=306> (accessed on 20 December 2006) Scenic Amenity of the Lockyer Study. Queensland, Australia.