Embed Size (px)
Citation preview
Thesis for The Degree of Doctor of Philosophy
Visual GUI Testing:Automating High-Level Software Testing in
Industrial Practice
Emil Alegroth
Division of Software EngineeringDepartment of Computer Science & Engineering
Chalmers University of Technology and Goteborg UniversityGoteborg, Sweden, 2015

Visual GUI Testing:Automating High-Level Software Testing inIndustrial Practice
Emil Alegroth
Copyright © 2015 Emil Alegrothexcept where otherwise stated.All rights reserved.
Technical Report No 117DISSN 0346-718XISBN 978-91-7597-227-5Department of Computer Science & EngineeringDivision of Software EngineeringChalmers University of Technology and Goteborg UniversityGoteborg, Sweden
This thesis has been prepared using LATEX.Printed by Chalmers Reproservice,Goteborg, Sweden 2015.
ii
To Therese, Alexandra and my supporting family

iv

Abstract
Software Engineering is at the verge of a new era where continuous releasesare becoming more common than planned long-term projects. In this contexttest automation will become essential on all levels of system abstraction tomeet the market’s demands on time-to-market and quality. Hence, automatedtests are required from low-level software components, tested with unit tests,up to the pictorial graphical user interface (GUI), tested with user emulatedsystem and acceptance tests. Thus far, research has provided industry with aplethora of automation solutions for lower level testing but GUI level testing isstill primarily a manual, and therefore costly and tedious, activity in practice.
We have identified three generations of automated GUI-based testing. Thefirst (1st) generation relies on GUI coordinates but is not used in practice dueto unfeasible maintenance costs caused by fragility to GUI change. Second(2nd) generation tools instead operate against the system’s GUI architecture,libraries or application programming interfaces. Whilst this approach is suc-cessfully used in practice, it does not verify the GUI’s appearance and it isrestricted to specific GUI technologies, programming languages and platforms.
The third (3rd) generation, referred to as Visual GUI Testing (VGT), isan emerging technique in industrial practice with properties that mitigate thechallenges experienced with previous techniques. VGT is defined as a tool-driven test technique where image recognition is used to interact with, andassert, a system’s behavior through its pictorial GUI as it is shown to the userin user-emulated, automated, system or acceptance tests. Automated teststhat produce results of quality on par with a human tester and is thereforean effective complement to reduce the aforementioned challenges with manualtesting. However, despite its benefits, the technique is only sparsely used inindustry and the academic body of knowledge contains little empirical supportfor the technique’s industrial viability.
This thesis presents a broad evaluation of VGT’s capabilities, obtainedthrough a series of case studies and experiments performed in academia andSwedish industry. The research follows an incremental methodology that be-gan with experimentation with VGT, followed by industrial studies that wereconcluded with a study of VGT’s use at a company over several years. Resultsof the research show that VGT is viable for use in industrial practice withbetter defect-finding ability than manual tests, ability to test any GUI basedsystem, high learnability, feasible maintenance costs and both short and long-term company benefits. However, there are still challenges associated with thesuccessful adoption, use and long-term use of VGT in a company, the mostcrucial that suitable development and maintenance practices are used. Thisthesis thereby concludes that VGT can be used in industrial practice and aimsto provides guidance to practitioners that seek to do so. Additionally, thiswork aims to be a stepping stone for academia to explore new test solutionsthat build on image recognition technology to improve the state-of-art.
Keywords
Software Engineering, Automated Testing, Visual GUI Testing, Industrial Re-search, Empirical Research, Applicability and Feasibility

Acknowledgments
First and foremost, my deepest thanks go to my main supervisor, friend andmentor Professor Robert Feldt whose belief in me and unwavering supportmade this thesis possible. We have had an amazing journey together and youhave not just taught me how to be a researcher but a better person as well,something that I will cherish forever.
Second, my thanks go to my second supervisor, Associate professor HelenaHolmstrom-Olsson, whose positive attitude, support and advice have been agreat source of inspiration and help, both in times of joy and despair.
Next I want to thank my examiner Professor Gerardo Scheider and all mypast and present colleagues at the Software Engineering division at ChalmersUniversity of Technology whose guidance and support has been invaluable forthe completion of my thesis work. In particular I would like to thank Dr.Ana Magazinius, Dr. Ali Shahrokni, Dr. Joakim Pernstal, Pariya Kashfi, An-tonio Martini, Per Lenberg, Associate professor Richard Berntsson Svensson,Professor Richard Torkar and Professor Jan Bosch for many great experiencesbut also for always being there to listen to and support my sometimes crazyideas. Additionally, I want to thank Bogdan Marculescu and Professor TonyGorschek who, together with Robert, convinced me, in their own way, to pro-ceed a PhD. Further, I want to thank my international research collaborators,in particular Professor Atif Memon, Rafael Oliveira and Zebao Gao who madea research visit in the US a wonderful experience.
However, this thesis had not been completed without the support of myloving wife, and mother of my wonderful Alexandra, Therese Alegroth. Shehas been my rock and the person I could always rely on when times were tough.Thanks also go to my mother Anette, father Tomas and sister Mathilda forbelieving in me and for their sacrifices to ensure that I could pursue this dream.Further, I want to thank my friends for always being there and I hope thatone day, perhaps after reading my thesis, that you will understand what I dofor a living.
I also want to thank my industrial collaborators, in particular the staffat Saab AB, Michel Nass, the staff at Inceptive, Geoffrey Bache, the Soft-ware Center and everyone else that has helped, supported and believed in myresearch.
This research has been conducted in a joint research project financed bythe Swedish Governmental Agency of Innovation Systems (Vinnova), ChalmersUniversity of Technology and Saab AB. My studies were also supported by theSwedish National Research School for Verification and Validation (SWELL),funded by Vinnova.
vii

List of Publications
Appended papers
This thesis is primarily supported by the following papers:
1. E. Borjesson, R. Feldt, “Automated System Testing using Visual GUITesting Tools: A Comparative Study in Industry”Proceedings of the 5th International Conference on Software TestingVerification and Validation (ICST’2012), Montreal, Canada, April 17-21, 2012 pp. 350-359.
2. E. Alegroth, R. Feldt, H. H. Olsson, “Transitioning Manual System TestSuites to Automated Testing: An Industrial Case Study”Proceedings of the 6th International Conference on Software TestingVerification and Validation (ICST’2013), Luxenbourg, March 18-22, 2013.
3. E. Alegroth, R. Feldt, L. Ryrholm, “Visual GUI Testing in Practice:Challenges, Problems and Limitations”Published in the Empirical Software Engineering Journal, 2014.
4. E. Alegroth, R. Feldt, P. Kolstrom, “Maintenance of Automated TestSuites in Industry: An Empirical study on Visual GUI Testing”In submission.
5. E. Alegroth, R. Feldt, “On the Long-term Use of Visual GUI Testingin Industrial Practice: A Case Study”In submission.
6. E. Alegroth, G. Zebao, R. Oliviera, A. Memon, “Conceptualization andEvaluation of Component-based Testing Unified with Visual GUI Test-ing: An Empirical Study”Proceedings of the 8th International Conference on Software TestingVerification and Validation (ICST’2015), Graz, Austria, April 13-17,2015
7. E. Alegroth, J. Gustafsson, H. Ivarsson, R. Feldt, “Replicating RareSoftware Failures with Visual GUI Testing: An Industrial Success Story”Accepted for publication in the Journal of IEEE Software, 2015.
ix
x
Other papers
The following papers are published but not appended to this thesis, either dueto overlapping contents to the appended papers, contents not related to thethesis or because the contents are of less priority for the thesis main conclu-sions.
1. E. Borjesson, R. Feldt, “Structuring Software Engineering Case Studiesto Cover Multiple Perspectives”Proceedings of the 21st International Conference on Software Engineer-ing & Knowledge Engineering (SEKE’2011), Miami Beach, Florida,USA, July 1-3, 2011.
2. E. Alegroth, M. Nass, H. H. Olsson, “JAutomate: a Tool for System-and Acceptance-test Automation”Proceedings of the 6th International Conference on Software Testing,Verification and Validation (ICST’2013), Luxenbourg, March 18-22, 2013.
3. E. Alegroth, “Random Visual GUI Testing: Proof of Concept”Proceedings of the 23rd International Conference on Software Engineer-ing & Knowledge Engineering (SEKE’2013), Boston, Massachusetts,USA, June 27-29, 2013.
4. G. Liebel, E. Algroth and R.Feldt, “State-of-Practice in GUI-based Sys-tem and Acceptance Testing: An Industrial Multiple-Case Study”Proceedings of the 39th EUROMICRO Conference on Software Engi-neering and Advanced Applications (SEAA), 2013.
5. E. Algroth and R.Feldt, “Industrial Application of Visual GUI Testing:Lessons Learned”Chapter of the book Continuous Software Engineering published by Springer,2014.
6. E. Alegroth, G. Bache, E. Bache, “On the Industrial Applicability ofTextTest: An Empirical Case Study”Proceedings of the 8th International Conference on Software TestingVerification and Validation (ICST’2015), Graz, April 13-17, 2015
7. R. Oliviera, E. Alegroth, G. Zebao, A. Memon, “Definition and Evalu-ation of Mutation Operators for GUI-level Mutation Analysis”Proceedings of the 10th Mutation Workshop (Mutation’2015), Graz, Aus-tria, April 13, 2015
Statement of contribution
In all listed papers, the first author was the primary contributor to the researchidea, design, data collection, analysis and/or reporting of the research work.

Contents
Abstract v
Acknowledgments vii
List of Publications ix
1 Introduction 11.1 Introduction . . . . . . . . . . . . . . . . . . . . . . . . . . . . . 11.2 Software engineering and the need for testing . . . . . . . . . . 3
1.2.1 Software Testing . . . . . . . . . . . . . . . . . . . . . . 31.2.2 Automated Software Testing . . . . . . . . . . . . . . . 51.2.3 Automated GUI-based Software Testing . . . . . . . . . 7
1.2.3.1 1st generation: Coordinate-based . . . . . . . . 71.2.3.2 2nd generation: Component/Widget-based . . 71.2.3.3 3rd generation: Visual GUI Testing . . . . . . 91.2.3.4 Comparison . . . . . . . . . . . . . . . . . . . . 11
1.3 Research problem and methodology . . . . . . . . . . . . . . . 111.3.1 Problem background and motivation for research . . . . 131.3.2 Thesis research process . . . . . . . . . . . . . . . . . . 161.3.3 Research methodology . . . . . . . . . . . . . . . . . . . 171.3.4 Case studies . . . . . . . . . . . . . . . . . . . . . . . . . 18
1.3.4.1 Interviews . . . . . . . . . . . . . . . . . . . . 201.3.4.2 Workshops . . . . . . . . . . . . . . . . . . . . 211.3.4.3 Other . . . . . . . . . . . . . . . . . . . . . . . 22
1.3.5 Experiments . . . . . . . . . . . . . . . . . . . . . . . . 241.3.6 Data analysis . . . . . . . . . . . . . . . . . . . . . . . . 24
1.4 Overview of publications . . . . . . . . . . . . . . . . . . . . . . 271.4.1 Paper A: Static evaluation . . . . . . . . . . . . . . . . . 271.4.2 Paper B: Dynamic evaluation . . . . . . . . . . . . . . . 281.4.3 Paper C: Challenges, problems and limitations . . . . . 301.4.4 Paper D: Maintenance and return on investment . . . . 311.4.5 Paper E: Long-term use . . . . . . . . . . . . . . . . . . 331.4.6 Paper F: VGT-GUITAR . . . . . . . . . . . . . . . . . . 351.4.7 Paper G: Failure replication . . . . . . . . . . . . . . . . 37
1.5 Contributions, implications and limitations . . . . . . . . . . . 381.5.1 Applicability of Visual GUI Testing in practice . . . . . 391.5.2 Feasibility of Visual GUI Testing in practice . . . . . . . 42
xi
xii CONTENTS
1.5.3 Challenges, problems and limitations with Visual GUITesting in practice . . . . . . . . . . . . . . . . . . . . . 47
1.5.4 Solutions to advance Visual GUI Testing . . . . . . . . . 471.5.5 Implications . . . . . . . . . . . . . . . . . . . . . . . . . 48
1.5.5.1 Implications for practice . . . . . . . . . . . . 481.5.5.2 Future research . . . . . . . . . . . . . . . . . . 49
1.5.6 Threats and limitations of this research . . . . . . . . . 511.5.6.1 Internal validity . . . . . . . . . . . . . . . . . 511.5.6.2 External validity . . . . . . . . . . . . . . . . . 521.5.6.3 Construct validity . . . . . . . . . . . . . . . . 521.5.6.4 Reliability/conclusion validity . . . . . . . . . 53
1.6 Thesis summary . . . . . . . . . . . . . . . . . . . . . . . . . . 53
2 Paper A: Static evaluation 552.1 Introduction . . . . . . . . . . . . . . . . . . . . . . . . . . . . . 562.2 Related Work . . . . . . . . . . . . . . . . . . . . . . . . . . . . 572.3 Case Study Description . . . . . . . . . . . . . . . . . . . . . . 59
2.3.1 Pre-study . . . . . . . . . . . . . . . . . . . . . . . . . . 602.3.2 Industrial Study . . . . . . . . . . . . . . . . . . . . . . 62
2.4 Results . . . . . . . . . . . . . . . . . . . . . . . . . . . . . . . . 642.4.1 Results of the Pre-study . . . . . . . . . . . . . . . . . . 642.4.2 Results of the industrial study . . . . . . . . . . . . . . 68
2.5 Discussion . . . . . . . . . . . . . . . . . . . . . . . . . . . . . . 712.6 Conclusion . . . . . . . . . . . . . . . . . . . . . . . . . . . . . 73
3 Paper B: Dynamic evaluation 753.1 Introduction . . . . . . . . . . . . . . . . . . . . . . . . . . . . . 763.2 Related Work . . . . . . . . . . . . . . . . . . . . . . . . . . . . 773.3 Research methodology . . . . . . . . . . . . . . . . . . . . . . . 78
3.3.1 Research site . . . . . . . . . . . . . . . . . . . . . . . . 793.3.2 Research process . . . . . . . . . . . . . . . . . . . . . . 80
3.4 Results and Analysis . . . . . . . . . . . . . . . . . . . . . . . . 813.4.1 Pre-transition . . . . . . . . . . . . . . . . . . . . . . . . 813.4.2 During transition . . . . . . . . . . . . . . . . . . . . . . 83
3.4.2.1 VGT test suite maintenance for improvement . 853.4.2.2 VGT test suite maintenance required due to
SUT change . . . . . . . . . . . . . . . . . . . 863.4.3 Post-transition . . . . . . . . . . . . . . . . . . . . . . . 88
3.5 Discussion . . . . . . . . . . . . . . . . . . . . . . . . . . . . . . 913.5.1 Threats to validity . . . . . . . . . . . . . . . . . . . . . 94
3.6 Conclusion . . . . . . . . . . . . . . . . . . . . . . . . . . . . . 94
4 Paper C: Challenges, problems and limitations 974.1 Introduction . . . . . . . . . . . . . . . . . . . . . . . . . . . . . 984.2 Background and Related work . . . . . . . . . . . . . . . . . . . 1004.3 Industrial case study . . . . . . . . . . . . . . . . . . . . . . . . 102
4.3.1 The industrial projects . . . . . . . . . . . . . . . . . . . 1034.3.2 Detailed data collection in Case 1 . . . . . . . . . . . . . 1054.3.3 Detailed data collection in Case 2 . . . . . . . . . . . . . 107
CONTENTS xiii
4.3.4 The VGT suite . . . . . . . . . . . . . . . . . . . . . . . 1084.4 Results and Analysis . . . . . . . . . . . . . . . . . . . . . . . . 110
4.4.1 Test system related CPLs . . . . . . . . . . . . . . . . . 1114.4.1.1 Test system version . . . . . . . . . . . . . . . 1124.4.1.2 Test system (General) . . . . . . . . . . . . . . 1154.4.1.3 Test system (Defects) . . . . . . . . . . . . . . 1174.4.1.4 Test company specific CPLs . . . . . . . . . . 1184.4.1.5 Test system (Environment) . . . . . . . . . . . 119
4.4.2 Test tool related CPLs . . . . . . . . . . . . . . . . . . . 1194.4.2.1 Test tool (Sikuli) related CPLs . . . . . . . . . 1194.4.2.2 Test application . . . . . . . . . . . . . . . . . 124
4.4.3 Support software related CPLs . . . . . . . . . . . . . . 1254.4.4 CPL Summary . . . . . . . . . . . . . . . . . . . . . . . 1274.4.5 Potential CPL solutions . . . . . . . . . . . . . . . . . . 1294.4.6 Defect finding ability, development cost and return on
investment (ROI) . . . . . . . . . . . . . . . . . . . . . . 1314.5 Discussion . . . . . . . . . . . . . . . . . . . . . . . . . . . . . . 138
4.5.1 Challenges, Problems, Limitations and Solutions . . . . 1384.5.2 Defects and performance . . . . . . . . . . . . . . . . . . 1404.5.3 Threats to validity . . . . . . . . . . . . . . . . . . . . . 142
4.6 Conclusions . . . . . . . . . . . . . . . . . . . . . . . . . . . . . 143
5 Paper D: Maintenance and return on investment 1455.1 Introduction . . . . . . . . . . . . . . . . . . . . . . . . . . . . . 1465.2 Related work . . . . . . . . . . . . . . . . . . . . . . . . . . . . 1475.3 Methodology . . . . . . . . . . . . . . . . . . . . . . . . . . . . 148
5.3.1 Phase 1: Interview study . . . . . . . . . . . . . . . . . 1495.3.2 Phase 2: Case study Setting . . . . . . . . . . . . . . . . 1505.3.3 Phase 2: Case study Procedure . . . . . . . . . . . . . . 153
5.4 Results and Analysis . . . . . . . . . . . . . . . . . . . . . . . . 1555.4.1 Quantitative results . . . . . . . . . . . . . . . . . . . . 156
5.4.1.1 Modeling the cost . . . . . . . . . . . . . . . . 1595.4.2 Qualitative results . . . . . . . . . . . . . . . . . . . . . 161
5.4.2.1 Phase 1: Interview results . . . . . . . . . . . . 1615.4.2.2 Phase 2: Observations . . . . . . . . . . . . . . 1635.4.2.3 Phase 2: Factors that affect the maintenance
of VGT scripts . . . . . . . . . . . . . . . . . . 1645.5 Discussion . . . . . . . . . . . . . . . . . . . . . . . . . . . . . . 168
5.5.1 Threats to validity . . . . . . . . . . . . . . . . . . . . . 1705.6 Conclusions . . . . . . . . . . . . . . . . . . . . . . . . . . . . . 171
6 Paper E: Long-term use 1736.1 Introduction . . . . . . . . . . . . . . . . . . . . . . . . . . . . . 1746.2 Related work . . . . . . . . . . . . . . . . . . . . . . . . . . . . 1766.3 Methodology . . . . . . . . . . . . . . . . . . . . . . . . . . . . 177
6.3.1 Case company: Spotify . . . . . . . . . . . . . . . . . . 1776.3.2 Research design . . . . . . . . . . . . . . . . . . . . . . . 179
6.4 Results and Analysis . . . . . . . . . . . . . . . . . . . . . . . . 1846.4.1 Results for RQ1: VGT adoption . . . . . . . . . . . . . 184

xiv CONTENTS
6.4.2 Results for RQ2: VGT benefits . . . . . . . . . . . . . . 1856.4.3 Results for RQ3: VGT challenges . . . . . . . . . . . . . 1876.4.4 Results for RQ4: VGT alternatives . . . . . . . . . . . . 1896.4.5 Quantification of the Qualitative Results . . . . . . . . . 194
6.5 Guidelines for adoption and use of VGT in industrial practice . 1946.5.1 Adoption of VGT in practice . . . . . . . . . . . . . . . 1976.5.2 Use of VGT in practice . . . . . . . . . . . . . . . . . . 1986.5.3 Long-term use of VGT in practice . . . . . . . . . . . . 199
6.6 Discussion . . . . . . . . . . . . . . . . . . . . . . . . . . . . . . 2006.6.1 Threats to Validity . . . . . . . . . . . . . . . . . . . . . 202
6.7 Conclusions . . . . . . . . . . . . . . . . . . . . . . . . . . . . . 2036.8 Appendix A: Interview Questions . . . . . . . . . . . . . . . . . 204
7 Paper F: VGT-GUITAR 2057.1 Introduction . . . . . . . . . . . . . . . . . . . . . . . . . . . . . 2067.2 Background and Motivation . . . . . . . . . . . . . . . . . . . . 2077.3 Methodology . . . . . . . . . . . . . . . . . . . . . . . . . . . . 209
7.3.1 Experiment: Fault detection and False results . . . . . . 2097.3.2 Case study: Applicability in practice . . . . . . . . . . . 213
7.4 Results and Analysis . . . . . . . . . . . . . . . . . . . . . . . . 2147.4.1 Experiment . . . . . . . . . . . . . . . . . . . . . . . . . 2147.4.2 Case study . . . . . . . . . . . . . . . . . . . . . . . . . 216
7.5 Discussion . . . . . . . . . . . . . . . . . . . . . . . . . . . . . . 2207.5.1 Threats to Validity . . . . . . . . . . . . . . . . . . . . . 221
7.6 Related Work . . . . . . . . . . . . . . . . . . . . . . . . . . . . 2227.7 Conclusions . . . . . . . . . . . . . . . . . . . . . . . . . . . . . 223
8 Paper G: Failure replication 2258.1 Failure replication and Visual GUI Testing . . . . . . . . . . . 2268.2 A Success story at Saab . . . . . . . . . . . . . . . . . . . . . . 226
8.2.1 The company . . . . . . . . . . . . . . . . . . . . . . . . 2278.2.2 The problem . . . . . . . . . . . . . . . . . . . . . . . . 2278.2.3 The solution . . . . . . . . . . . . . . . . . . . . . . . . 2288.2.4 The defect . . . . . . . . . . . . . . . . . . . . . . . . . . 2308.2.5 Post-analysis . . . . . . . . . . . . . . . . . . . . . . . . 230
8.3 Discussion . . . . . . . . . . . . . . . . . . . . . . . . . . . . . . 2318.4 Lessons learnt . . . . . . . . . . . . . . . . . . . . . . . . . . . . 232
Bibliography 235
Chapter 1
Introduction
1.1 Introduction
Today, software is ubiquitous in all types of user products, from software ap-plications to cars, mobile applications, medical systems, etc. Software allowsdevelopment organizations to broaden the number of features in their prod-ucts, improve the quality of these features and provide customers with post-deployment updates and improvements. In addition, software has shortenedthe time-to-market in many product domains, a trend driven by the marketneed for new products, features and higher quality software.
However, these trends place new time constraints on software develop-ment organizations that limit the amount of requirements engineering, devel-opment and testing that can be performed on new software [1]. For testing,these time constraints imply that developers can no longer verify and vali-date the software’s quality with manual test practices since manual testing isassociated with properties such as high cost, tediousness and therefore error-proneness [2–7]. These properties are a particular challenge in the contextof changing requirements where the tests continuously need to be rerun forregression testing [8, 9].
Automated testing has been suggested as the solution to this challenge sinceautomation allows tests to be run more frequently and at lower cost [4, 7, 10].However, most automated test techniques have prerequisites that prohibit theiruse on software written in certain programming languages, for certain oper-ating systems, platforms, etc. [4, 11–13]. Additionally, most automated testtechniques operate on a lower level of system abstraction, i.e. against thebackend of the system. One such, commonly used, low-level test technique isautomated unit testing [14]. Whilst unit tests are applicable to find defectsin individual software components, its use for system and acceptance testingis still a subject of ongoing debate [15, 16]. Test techniques exist for auto-mated system and acceptance testing that interact with the system under test(SUT) through hooks into the SUT or its GUI. However, these techniques donot verify that the pictorial GUI, as shown to the user, behaves or appearscorrectly. These techniques therefore have limited ability to fully automatemanual, scenario-based, regression test cases, in the continuation of this the-sis referred to as manual test cases. Consequently, industry is in need of a
1

2 CHAPTER 1. INTRODUCTION
flexible and GUI-based test automation technique that can emulate humantester behavior to mitigate the challenges associated with current manual andautomated test techniques.
In this thesis we introduce and evaluate Visual GUI Testing (VGT). VGTis a term we have defined that encapsulates all tools that use image recog-nition to interact with a SUT’s functionality through the bitmaps shown onthe SUT’s pictorial GUI. These interactions are performed with user emu-lated keyboard and mouse events that make VGT applicable on almost anyGUI-driven application and to automate test cases that previously had to beperformed manually. Consequently, VGT has the properties that software in-dustry is looking for in a flexible, GUI-based, automated test technique sincethe technique’s only prerequisite is that a SUT has a GUI. A prerequisite thatonly limits the technique’s applicability and usefulness for, as examples, serveror other backend software.
However, at the start of this thesis work the body of knowledge on VGTwas limited to analytical research results [17] regarding VGT tools, i.e. Trig-gers [18], VisMap [19] and Sikuli [20]. Hence, no empirical evidence existedregarding the technique’s applicability or feasibility of use in industrial prac-tice. Applicability that, in this thesis, refers to factors such as a test tech-nique’s defect-finding ability, usability for regression, system and acceptancetesting, learnability and flexibility of use for different types of GUI-based soft-ware. Feasibility, in turn, refers to the long-term applicability of a technique,including feasible development and maintenance costs, usability under stricttime constraints and suitable time until the technique provides positive returnon investment (ROI). Empirical evidence on these factors are key to under-stand the real life complexities of using the technique, to build best practicesand to advance its use in industrial practice [17, 21]. However, such evidencecan only be acquired through an incremental process that evaluates the tech-nique from several perspectives and different industrial contexts. This the-sis work was therefore performed in Swedish software industry, with differentprojects, VGT tools and research techniques to fulfill the thesis research objec-tive. Hence, to acquire evidence for, or against, the applicability and feasibilityof adoption, use and viability of VGT in industrial practice, including whatchallenges, problems and limitations that are associated with these activities.Work that consequently resulted in an overall understanding of the currentstate-of-practice of VGT, what impedes its continued adoption and a final, yetpositive, conclusion regarding the long-term viability of VGT in industrial use.
The results presented in this introductory chapter (Chapter 1) are struc-tured as follows. First, an introduction is given in Section 1.1 followed bya background to this research, including; manual, automated and automatedGUI-based testing. Section 1.3 then presents the research problem, questionsand the methodology. This section also details the different research methodsthat were used and how the included papers contribute to answer the thesisresearch questions. An overview, and summaries, of the included papers arethen given in Section 1.4. Section 1.5 then presents the syntheses of includedpapers and finally the thesis introduction is concluded in a summary in Section1.6.

1.2. SOFTWARE ENGINEERING AND THE NEED FOR TESTING 3
1.2 Software engineering and the need for test-ing
Software engineering is the application of engineering best practices in a struc-tured process to design, develop and maintain software of high quality [22].Several software development processes have been defined such as plan-driven,incremental and agile development processes [23, 24]. These processes can bedivided into three fundamental activities: requirements engineering, develop-ment (design and implementation) and verification and validation.
Requirements engineering refers to the activity of elicitation, specifica-tion and modeling of the software’s requirements, i.e. the needs of the cus-tomer/user. Hence, features, functions and qualities that the developed soft-ware must include [25, 26]. In turn, development is the activity of designingand realizing the requirements in software that fulfills the user’s needs. Finally,verification and validation, traditionally, is the activity of evaluating that thedeveloped software conforms to the requirements [1], most commonly achievedthrough testing.
Tests for verification and validation are therefore a tightly coupled coun-terpart to requirements [27]. Hence, whilst the quality of a software system isdetermined by how well each process activity is performed, it is through test-ing that this quality is measured. Measurements that can be taken throughoutthe development process, i.e. early with reviews of documents or code or latewith customer acceptance tests. Testing is therefore an essential activity in allsoftware engineering, regardless of process or development objective.
1.2.1 Software Testing
Software testing for verification and validation is a core, but also costly, activitythat can make up for 20-50 percent of the cost of a software developmentproject [1, 28, 29]. Verification is defined as the practice of assuring that theSUT conforms to its requirements, whilst validation is defined as the practiceof assuring that the SUT conforms to the requirements and fulfills the user’sneeds [25,26].
Pictorial GUI
GUI model
BitmapsHooks into:
GUI API/Toolkit(GUI) Source code/
architecture
System core
SW architectureTechnical interfaces
SW components
Regression system and acceptance
testingFront-end
Back-end
Visual GUI Testing
Component/Widget/Tag-based GUI-
testing
Unit-testing and integration testing
System view
System layers
System components
Manualtesting
Automatedtesting
Reviews, unit testing
and integration
testingClasses
Functions/methods
Exploratory testing
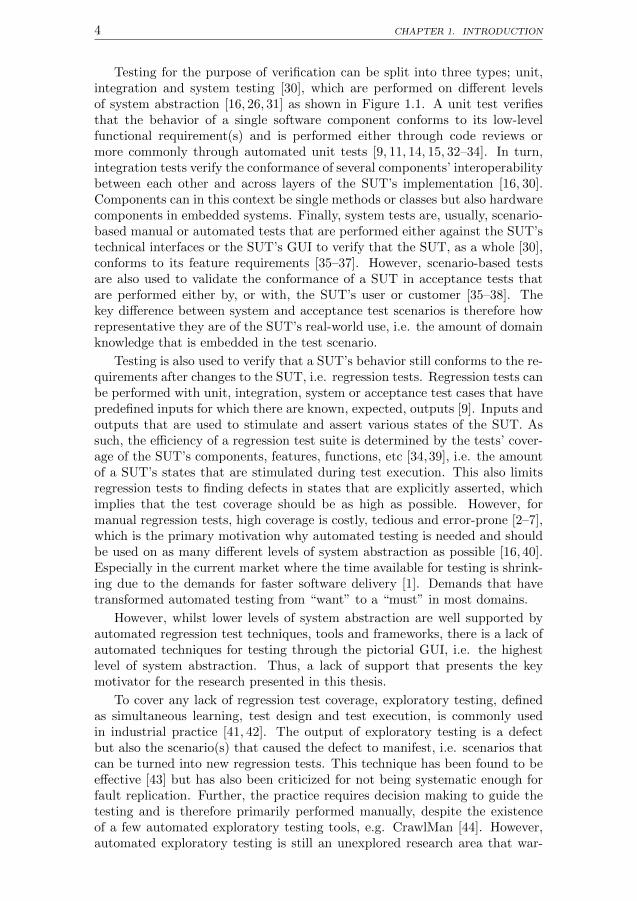
Figure 1.1: Theoretical, layered, model of a System and the manual/automatedtechniques generally used to test the different layers.
4 CHAPTER 1. INTRODUCTION
Testing for the purpose of verification can be split into three types; unit,integration and system testing [30], which are performed on different levelsof system abstraction [16, 26, 31] as shown in Figure 1.1. A unit test verifiesthat the behavior of a single software component conforms to its low-levelfunctional requirement(s) and is performed either through code reviews ormore commonly through automated unit tests [9, 11, 14, 15, 32–34]. In turn,integration tests verify the conformance of several components’ interoperabilitybetween each other and across layers of the SUT’s implementation [16, 30].Components can in this context be single methods or classes but also hardwarecomponents in embedded systems. Finally, system tests are, usually, scenario-based manual or automated tests that are performed either against the SUT’stechnical interfaces or the SUT’s GUI to verify that the SUT, as a whole [30],conforms to its feature requirements [35–37]. However, scenario-based testsare also used to validate the conformance of a SUT in acceptance tests thatare performed either by, or with, the SUT’s user or customer [35–38]. Thekey difference between system and acceptance test scenarios is therefore howrepresentative they are of the SUT’s real-world use, i.e. the amount of domainknowledge that is embedded in the test scenario.
Testing is also used to verify that a SUT’s behavior still conforms to the re-quirements after changes to the SUT, i.e. regression tests. Regression tests canbe performed with unit, integration, system or acceptance test cases that havepredefined inputs for which there are known, expected, outputs [9]. Inputs andoutputs that are used to stimulate and assert various states of the SUT. Assuch, the efficiency of a regression test suite is determined by the tests’ cover-age of the SUT’s components, features, functions, etc [34,39], i.e. the amountof a SUT’s states that are stimulated during test execution. This also limitsregression tests to finding defects in states that are explicitly asserted, whichimplies that the test coverage should be as high as possible. However, formanual regression tests, high coverage is costly, tedious and error-prone [2–7],which is the primary motivation why automated testing is needed and shouldbe used on as many different levels of system abstraction as possible [16, 40].Especially in the current market where the time available for testing is shrink-ing due to the demands for faster software delivery [1]. Demands that havetransformed automated testing from “want” to a “must” in most domains.
However, whilst lower levels of system abstraction are well supported byautomated regression test techniques, tools and frameworks, there is a lack ofautomated techniques for testing through the pictorial GUI, i.e. the highestlevel of system abstraction. Thus, a lack of support that presents the keymotivator for the research presented in this thesis.
To cover any lack of regression test coverage, exploratory testing, definedas simultaneous learning, test design and test execution, is commonly usedin industrial practice [41, 42]. The output of exploratory testing is a defectbut also the scenario(s) that caused the defect to manifest, i.e. scenarios thatcan be turned into new regression tests. This technique has been found to beeffective [43] but has also been criticized for not being systematic enough forfault replication. Further, the practice requires decision making to guide thetesting and is therefore primarily performed manually, despite the existenceof a few automated exploratory testing tools, e.g. CrawlMan [44]. However,automated exploratory testing is still an unexplored research area that war-

1.2. SOFTWARE ENGINEERING AND THE NEED FOR TESTING 5
rants more research, including automated GUI-based exploratory testing sinceit could help mitigate the challenges associated with manual verification andvalidation, e.g. cost.
In summary, testing is used in industrial practice on different levels ofsystem abstraction for verification and validation of a SUT’s conformance to itsrequirements. However, much of this testing is manual, which is costly, tediousand error prone, especially for manual regression testing, which is suggested assolvable with automated testing. More research is therefore warranted into newautomated test techniques and in particular techniques that operate againstthe SUT’s highest level of system abstraction, i.e. the pictorial GUI.
1.2.2 Automated Software Testing
There are two key motivators for the use of automated testing in industrialpractice; (1) to improve software quality and (2) to lower test related costs [40].
Software quality : Automated tests help raise software quality throughhigher execution speed than manual tests that allow them to be executedmore frequently [16, 40]. Higher test frequency provides faster feedback tothe developers regarding the quality of the software and enables defects tobe caught and resolved earlier. In turn, quick defect resolution lowers theproject’s development time and mitigates the chance of defect propagationinto customer deliveries. Early defect detection also mitigates synergy effectsto occur between defects, for instance that two or more defects cause a jointfailure which root-cause therefore becomes more difficult and costly to find.
However, a prerequisite for any automated test technique to be used fre-quently is that the tests have reasonable test execution time. This prerequisiteis particularly important in contexts where the tests are used for continuousintegration, development and deployment [45]. Hence, contexts where thetest suites should be executed each time new code is integrated to the SUT,e.g. on commit, which cause the tests to set the pace for the highest possi-ble frequency of integration. This pacing is one reason why automated unittests [9, 11, 14, 15, 32–34] are popular in industrial practice since several hun-dred unit tests can be executed in a matter of minutes. In addition, unit testsare popular in agile software development companies, where they are usedto counteract regression defects [46] caused by change or refactoring that ispromoted by the process [47,48].
Lower cost : Automated testing is also used to lower the costs of testingby automating tests, or parts of tests, that are otherwise performed manually.However, there are still several costs associated with automated tests that needto be considered.
First , all automated test techniques require some type of tool that eitherneeds to be acquired, bought and/or developed. Next, the intended users of thetool need be given training or time to acquire knowledge and experience withthe tool and its technique before it can be used. Knowledge and experiencethat might be more or less cumbersome to acquire dependent on the technique’scomplexity [40]. This complexity implies that techniques with high learnabilityare more favorable from a cost perspective since they require less training.
Furthermore, adoption of test automation is associated with organizationalchanges, e.g. new or changed roles, which adds additional costs, especially if
6 CHAPTER 1. INTRODUCTION
the organizational changes affect the company’s processes, e.g. due to changesof the intended users’ responsibilities. Additionally, many automated testtechniques have prerequisites that prohibit their use to certain systems writtenin specific programming languages, operating systems and platforms [4,11–13].Therefore it is necessary to perform a pilot project to (1) evaluate if the newtechnique is at all applicable for the intended SUT and (2) for what types oftests the technique can be used. Thus a pilot project is an important activitybut also associated with a, sometimes substantial, cost. However, several ofthese costs are often overlooked in practice and are thereby “hidden” costsassociated with any change to a software process.
Second , for established systems, and particularly legacy systems, a consid-erable cost of adopting a new test technique is associated with the developmentof a suitably large test suite that provides test coverage of the SUT. Hence,since automated testing is primarily used for regression testing, test coverage,as stated in Section 1.2.1, is required for the testing to be efficient and valuablein finding defects.
However, this brings us to the third cost associated with automated test-ing which is maintenance of test scripts. Maintenance constitutes a continuouscost for all automated testing that grows with the size of the test suite. Thismaintenance is required to keep the test scripts aligned with the SUT’s re-quirements [49], or at least its behavior, to ensure that test failures are causedby defects in the SUT rather than intended changes to the SUT itself, i.e.failures referred to as false positives. However, larger changes to the SUT canoccur and the resulting maintenance costs can, in a worst case, become unrea-sonable [12]. These costs can however be mitigated through engineering bestpractices, e.g. modular test design [16, 40, 50]. However, best practices takestime to acquire, for any technique, and are therefore often missing, also forVGT.
Hence, these three costs must be compared together to the value providedby the automated tests, for instance value in terms of defects found or tothe costs compared to alternative test techniques, e.g. manual testing. Thereason for the comparison is to identify the point in time when the costs ofautomation break even with the alternatives, i.e. when return on investment(ROI) is achieved. Hence, for any automated test technique to be feasible,the adoption, development and maintenance costs must provide ROI and itshould do so as quickly as possible. Consequently, an overall view of costs,value and other factors, e.g. learnability, adoptability and usability, is requiredto provide an answer if a test automation technique is applicable and feasiblein practice. These factors were therefore evaluated during the thesis work toprovide industrial practitioners with decision support of when, how and whyto adopt and use VGT.
In summary, automated testing helps improve SUT quality and lowerproject costs [40]. However, the costs of automated testing can still be sub-stantial and must therefore be evaluated against other alternative techniquesto identify when and if the adoption of a new technique provides positive ROI.
1.2. SOFTWARE ENGINEERING AND THE NEED FOR TESTING 7
1.2.3 Automated GUI-based Software Testing
Automated software testing has several benefits over manual testing, e.g. im-proved test frequency, but there are also challenges, for instance, that mosttechniques operate on a lower level of system abstraction. However, there is aset of automated test techniques that operate against, or through, the SUT’sGUI that can be used for higher level testing. To clarify the differences be-tween these types of GUI-based testing techniques we have divided them intothree chronologically defined generations [51]. The difference between eachgeneration is how they interact with the SUT, i.e. with exact coordinates,through hooks into the SUT’s GUI or image recognition. The following sec-tion presents key properties of the three generations to provide the reader withcontextual information for the continuation of the thesis.
1.2.3.1 1st generation: Coordinate-based
1st generation GUI-based test automation uses exact coordinates on the screento interact with the SUT [3]. These coordinates are acquired by recording man-ual interaction with the SUT and are then saved to scripts that can be replayedfor automated regression testing, which improves test frequency. However, thetechnique is fragile, even minor changes to a GUI’s layout can cause an entiretest suite to fail, resulting in frequent and costly maintenance [3,52,53]. There-fore, the technique has mostly been abandoned in practice but is commonlyintegrated as one basic component into other test automation frameworks andtools, e.g. JUnit [53] and Sikuli [54]. However, because of the technique’slimited stand-alone use in practice it will not be discussed to any extent inthis thesis.
1.2.3.2 2nd generation: Component/Widget-based
2nd generation GUI-based testing tools stimulate and assert the SUT throughdirect access to the SUT’s GUI components or widgets by hooks into the SUT,e.g. into its GUI libraries or toolkits [12]. Synonyms for this technique areComponent-, Widget- or Tag-based GUI testing and is performed in industrialpractice with tools such as Selenium [55], QTP [56], etc.
These tools can achieve robust test case execution, e.g. few false testresults, due to the tools’ access and tight coupling to the SUT’s internal work-ings, e.g. GUI events and components’ ID numbers, labels, etc. These GUIevents can also be monitored in a few tools to automatically synchronize thetest script with the SUT, which would otherwise require the user to manu-ally specify synchronization points in the scripts, e.g. static delays or delaysbased on GUI state transitions. Synchronization is a common challenge for allGUI-based test techniques because the test scripts run asynchronously to theSUT.
Another advantage of SUT access is that some of these tools can improvetest script execution time by forcing GUI state transitions and bypass cosmetic,timed, events such as load screens, etc.
Further, most 2nd generation tools support record and replay, which lowerstest development costs. In addition, most tools support the user by managingGUI components’ property data, e.g. ID numbers, labels, component types,
8 CHAPTER 1. INTRODUCTION
OK
Hello World
Var= Ok[type = button,
ID = 2,Label = "OK
X = 10,Y = 5"]
Var = outField [type = textfield,
ID = 4, Label = "Hello World",
X = 10,Y = 70]
Example GUI 2 Generation pseudo codend GUI component data
click OkAssertLabel outField, "Hello World"
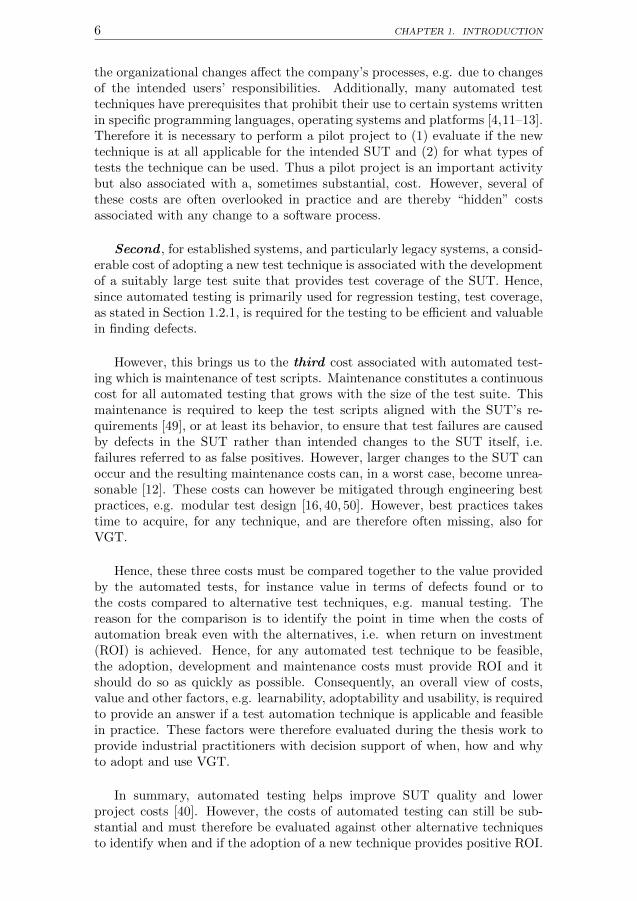
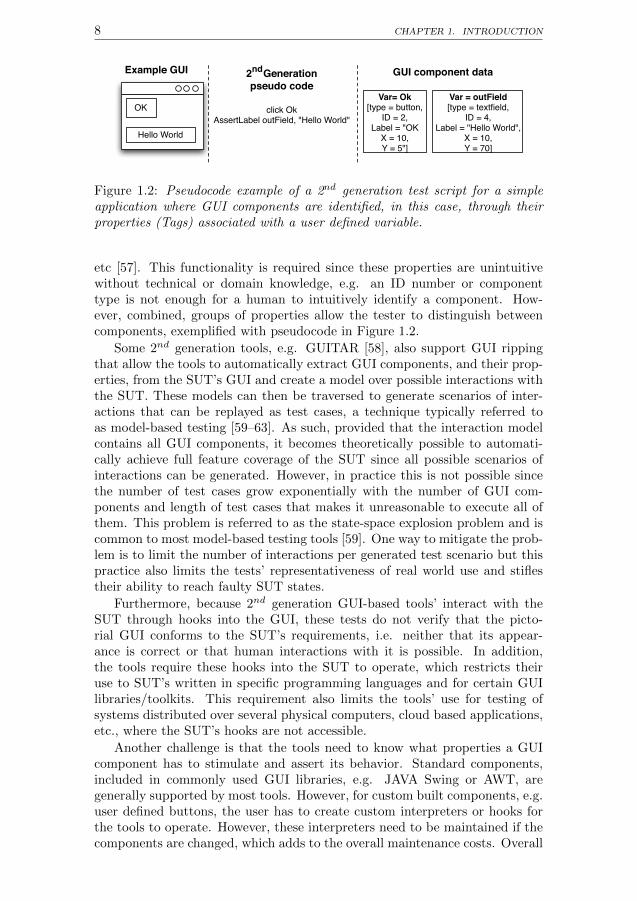
Figure 1.2: Pseudocode example of a 2nd generation test script for a simpleapplication where GUI components are identified, in this case, through theirproperties (Tags) associated with a user defined variable.
etc [57]. This functionality is required since these properties are unintuitivewithout technical or domain knowledge, e.g. an ID number or componenttype is not enough for a human to intuitively identify a component. How-ever, combined, groups of properties allow the tester to distinguish betweencomponents, exemplified with pseudocode in Figure 1.2.
Some 2nd generation tools, e.g. GUITAR [58], also support GUI rippingthat allow the tools to automatically extract GUI components, and their prop-erties, from the SUT’s GUI and create a model over possible interactions withthe SUT. These models can then be traversed to generate scenarios of inter-actions that can be replayed as test cases, a technique typically referred toas model-based testing [59–63]. As such, provided that the interaction modelcontains all GUI components, it becomes theoretically possible to automati-cally achieve full feature coverage of the SUT since all possible scenarios ofinteractions can be generated. However, in practice this is not possible sincethe number of test cases grow exponentially with the number of GUI com-ponents and length of test cases that makes it unreasonable to execute all ofthem. This problem is referred to as the state-space explosion problem and iscommon to most model-based testing tools [59]. One way to mitigate the prob-lem is to limit the number of interactions per generated test scenario but thispractice also limits the tests’ representativeness of real world use and stiflestheir ability to reach faulty SUT states.
Furthermore, because 2nd generation GUI-based tools’ interact with theSUT through hooks into the GUI, these tests do not verify that the picto-rial GUI conforms to the SUT’s requirements, i.e. neither that its appear-ance is correct or that human interactions with it is possible. In addition,the tools require these hooks into the SUT to operate, which restricts theiruse to SUT’s written in specific programming languages and for certain GUIlibraries/toolkits. This requirement also limits the tools’ use for testing ofsystems distributed over several physical computers, cloud based applications,etc., where the SUT’s hooks are not accessible.
Another challenge is that the tools need to know what properties a GUIcomponent has to stimulate and assert its behavior. Standard components,included in commonly used GUI libraries, e.g. JAVA Swing or AWT, aregenerally supported by most tools. However, for custom built components, e.g.user defined buttons, the user has to create custom interpreters or hooks forthe tools to operate. However, these interpreters need to be maintained if thecomponents are changed, which adds to the overall maintenance costs. Overall
1.2. SOFTWARE ENGINEERING AND THE NEED FOR TESTING 9
maintenance costs that have been reported to, in some cases, be substantialin practice [10,12,16,52].
However, there are also some types of GUI components that are difficult orcan not be tested with this technique, e.g. components generated at runtime,since their properties are not known prior to execution of the system. As such,there are several challenges associated with 2nd generation GUI-based testingthat limit the technique’s flexibility of use in industrial practice.
In summary, 2nd generation GUI-based testing is associated with quick andoften robust test execution due to their access to the SUT’s inner workings.However, this access is a prerequisite for the technique’s use that also limits itstools to test applications written is certain programming languages, with cer-tain types of components, etc. As a consequence, the technique lacks flexibilityin industrial use. Further, the technique does not operate on the same level ofsystem abstraction as a human user and does therefore not verify that the SUTis correct from a pictorial GUI point of view, neither in terms of appearanceor behavior. Additionally, the technique is associated with script maintenancecosts that can be extensive and in worst cases infeasible [10,12,16,52]. Conse-quently, 2nd generation GUI-based testing does not fully fulfill the industry’sneeds for a flexible and feasible test automation technique.
1.2.3.3 3rd generation: Visual GUI Testing
3rd generation GUI-based testing is also referred to as Visual GUI Testing(VGT) [64], and is defined as a tool driven automated test technique where im-age recognition is used to interact with, and assert, a system’s behavior throughits pictorial GUI as it is shown to the user in user emulated system or accep-tance tests. The foundation for VGT was established in the early 90s by a toolcalled Triggers [18], later in the 90s accompanied by a tool called VisMap [19],which both supported image recognition based automation. However, at thetime, lacking hardware support for the performance heavy image recognitionalgorithms made these tools unusable in practice [65]. Advances in hardwareand image recognition algorithm technology have now mitigated this chal-lenge [66] but it is still unknown if VGT, as a technique, is mature enoughfor industrial use. Thus providing one motivation the work presented in thisthesis.
Several VGT tools are available in practice, both open source; Sikuli [20],and commercial; JAutomate [67], EggPlant [68] and Unified Functional Test-ing (UFT) [56], each with different benefits and drawbacks due to the tools’individual features [67]. However, common to all tools is that they use imagerecognition to drive scripts that allow them to be used on almost any GUI-driven application, regardless of implementation, operating system or evenplatform. As a consequence, VGT is associated with a high degree of flexi-bility. The technique does however only have limited usefulness for non-GUIsystems, e.g. server-applications.
VGT scripts are written, or recorded, as scenarios that contain methodswhich are usually synonyms for human interactions with the SUT, e.g. mouseand keyboard events, and bitmap images. These images are used by the tools’image recognition algorithms to stimulate and assert the behavior of SUTthrough its pictorial GUI, i.e. in the same way as a human user. Consequently,

10 CHAPTER 1. INTRODUCTION
OK
Hello World
Example GUI 3 Generation (VGT) pseudo code
rd
click
AssertExists
OK
Hello World
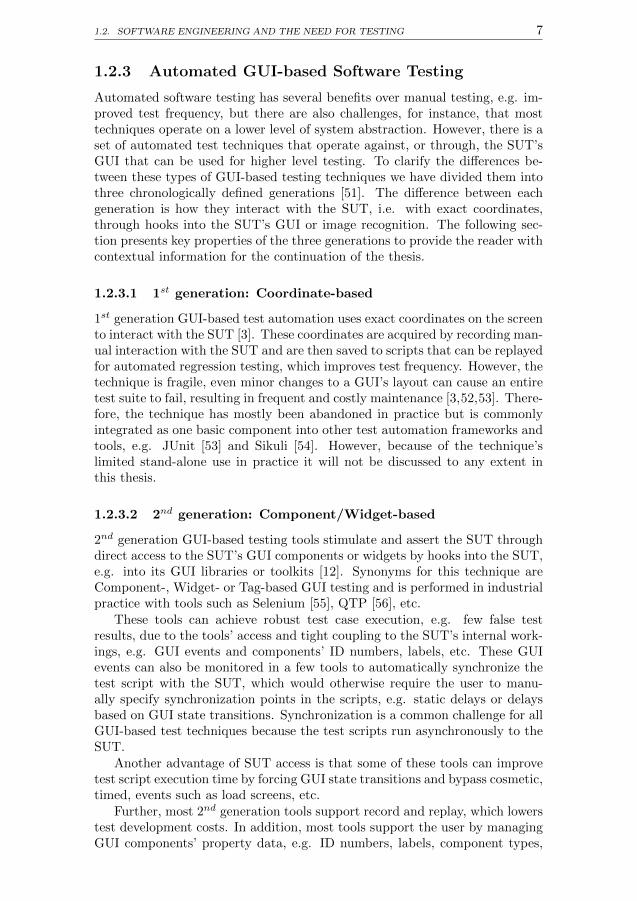
Figure 1.3: Pseudocode example of a 3rd generation (VGT) test case for asimple application. GUI components are associated with the application’s GUIcomponent images (Bitmaps).
VGT scripts are generally intuitive to understand, also for non-technical stake-holders, since the scripts’ syntax is relatable to how the stakeholders wouldthemselves interact with the SUT [20], e.g. click on a target represented bya bitmap and type a text represented by a string. This intuitiveness alsoprovides VGT with high learnability also by technically awkward users [65].
A pseudo-code VGT script example is shown in Figure 1.3 that performsthe same interactions as the example presented for 2nd generation GUI-basedtesting, presented in Figure 1.2, for comparison.
Conceptually, image recognition is performed in two steps during VGTscript playback. First, the SUT’s current GUI state is captured as a bitmap,e.g. in a screenshot of the computers desktop, which is sent together withthe sought bitmap from the VGT script to the image recognition algorithm.Second, the image recognition algorithm searches for the sought bitmap in thescreenshot and if it finds a match it returns the coordinates for the match thatare then used to perform an interaction with the SUT’s GUI. Alternatively,if the image recognition fails, a false boolean is returned or an exception israised.
Different VGT tools use different algorithms but most algorithms rely onsimilarity-based matching which means that a match, i.e. sought bitmap, isfound if it is within a percentile margin between the identified and soughtbitmap image [20]. This margin is typically set to 70 to 80 percent of theoriginal image to counteract failures due to small changes to a GUI’s appear-ance, e.g. change of a GUI bitmap’s color tint. However, similarity-basedmatching does not prevent image recognition failure when bitmaps are resizedor changed completely.
Additionally, VGT scripts, similar to 1st and 2nd generation scripts, needto be synchronized with the SUT’s execution. Synchronization in VGT isperformed with built in functionality or methods that wait for a bitmap(s) toappear on the screen before the script can proceed. However, these methodsalso make VGT scripts slow since they cannot execute quicker than the statetransitions of the GUI, which is a particular challenge for web-systems sincewaits also need to take network latency into account.
In summary, VGT is a flexible automated GUI-based test technique thatuses tools with image recognition to interact and assert a SUT’s behaviorthrough its pictorial GUI. However, the technique’s maturity is unknown andthis thesis therefore aims to evaluate if VGT is applicable and feasible inindustrial practice.
1.3. RESEARCH PROBLEM AND METHODOLOGY 11
1.2.3.4 Comparison
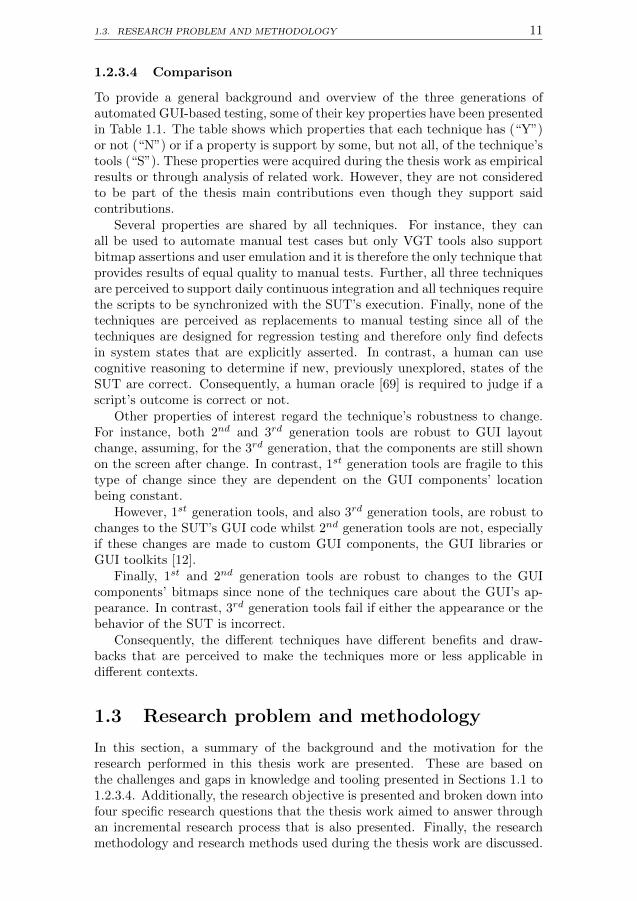
To provide a general background and overview of the three generations ofautomated GUI-based testing, some of their key properties have been presentedin Table 1.1. The table shows which properties that each technique has (“Y”)or not (“N”) or if a property is support by some, but not all, of the technique’stools (“S”). These properties were acquired during the thesis work as empiricalresults or through analysis of related work. However, they are not consideredto be part of the thesis main contributions even though they support saidcontributions.
Several properties are shared by all techniques. For instance, they canall be used to automate manual test cases but only VGT tools also supportbitmap assertions and user emulation and it is therefore the only technique thatprovides results of equal quality to manual tests. Further, all three techniquesare perceived to support daily continuous integration and all techniques requirethe scripts to be synchronized with the SUT’s execution. Finally, none of thetechniques are perceived as replacements to manual testing since all of thetechniques are designed for regression testing and therefore only find defectsin system states that are explicitly asserted. In contrast, a human can usecognitive reasoning to determine if new, previously unexplored, states of theSUT are correct. Consequently, a human oracle [69] is required to judge if ascript’s outcome is correct or not.
Other properties of interest regard the technique’s robustness to change.For instance, both 2nd and 3rd generation tools are robust to GUI layoutchange, assuming, for the 3rd generation, that the components are still shownon the screen after change. In contrast, 1st generation tools are fragile to thistype of change since they are dependent on the GUI components’ locationbeing constant.
However, 1st generation tools, and also 3rd generation tools, are robust tochanges to the SUT’s GUI code whilst 2nd generation tools are not, especiallyif these changes are made to custom GUI components, the GUI libraries orGUI toolkits [12].
Finally, 1st and 2nd generation tools are robust to changes to the GUIcomponents’ bitmaps since none of the techniques care about the GUI’s ap-pearance. In contrast, 3rd generation tools fail if either the appearance or thebehavior of the SUT is incorrect.
Consequently, the different techniques have different benefits and draw-backs that are perceived to make the techniques more or less applicable indifferent contexts.
1.3 Research problem and methodology
In this section, a summary of the background and the motivation for theresearch performed in this thesis work are presented. These are based onthe challenges and gaps in knowledge and tooling presented in Sections 1.1 to1.2.3.4. Additionally, the research objective is presented and broken down intofour specific research questions that the thesis work aimed to answer throughan incremental research process that is also presented. Finally, the researchmethodology and research methods used during the thesis work are discussed.
12 CHAPTER 1. INTRODUCTION
Property 1st
Gen.2nd
Gen.3rd
Gen.Independent of SUT platform N N YIndependent of SUT programming language Y S YNon-intrusive test execution N S YEmulates human user behavior Y N YOpen-source tool alternatives Y Y YSupports manual test case automation Y Y YSupports testing of custom GUI components Y S YSupports bitmap-based assertions N S YSupports testing of distributed systems Y S YSupports daily continuous integration Y Y YRobust to GUI layout change N Y YRobust to system code change Y N YRobust to bitmap GUI component change Y Y NSupport script recording (as opposed to manualscripting)
Y Y S
Script execution time independent of SUT perfor-mance
N N N
Replacement of other manual/automatic testpractices
N N N
Table 1.1: The positive and negative properties of different GUI-based testtechniques. All properties have been formulated such that a “Y” indicates thatthe property is supported by the technique. “N” indicates that the property isnot supported by the technique. “S” indicates that some of the technique’s toolssupports the property, but most don’t.
1.3. RESEARCH PROBLEM AND METHODOLOGY 13
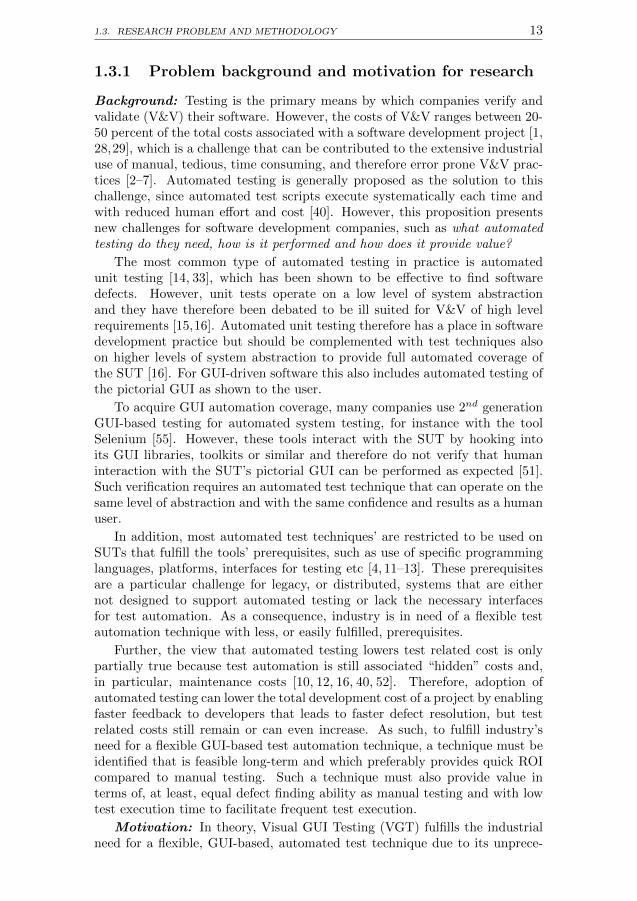
1.3.1 Problem background and motivation for research
Background: Testing is the primary means by which companies verify andvalidate (V&V) their software. However, the costs of V&V ranges between 20-50 percent of the total costs associated with a software development project [1,28,29], which is a challenge that can be contributed to the extensive industrialuse of manual, tedious, time consuming, and therefore error prone V&V prac-tices [2–7]. Automated testing is generally proposed as the solution to thischallenge, since automated test scripts execute systematically each time andwith reduced human effort and cost [40]. However, this proposition presentsnew challenges for software development companies, such as what automatedtesting do they need, how is it performed and how does it provide value?
The most common type of automated testing in practice is automatedunit testing [14, 33], which has been shown to be effective to find softwaredefects. However, unit tests operate on a low level of system abstractionand they have therefore been debated to be ill suited for V&V of high levelrequirements [15,16]. Automated unit testing therefore has a place in softwaredevelopment practice but should be complemented with test techniques alsoon higher levels of system abstraction to provide full automated coverage ofthe SUT [16]. For GUI-driven software this also includes automated testing ofthe pictorial GUI as shown to the user.
To acquire GUI automation coverage, many companies use 2nd generationGUI-based testing for automated system testing, for instance with the toolSelenium [55]. However, these tools interact with the SUT by hooking intoits GUI libraries, toolkits or similar and therefore do not verify that humaninteraction with the SUT’s pictorial GUI can be performed as expected [51].Such verification requires an automated test technique that can operate on thesame level of abstraction and with the same confidence and results as a humanuser.
In addition, most automated test techniques’ are restricted to be used onSUTs that fulfill the tools’ prerequisites, such as use of specific programminglanguages, platforms, interfaces for testing etc [4, 11–13]. These prerequisitesare a particular challenge for legacy, or distributed, systems that are eithernot designed to support automated testing or lack the necessary interfacesfor test automation. As a consequence, industry is in need of a flexible testautomation technique with less, or easily fulfilled, prerequisites.
Further, the view that automated testing lowers test related cost is onlypartially true because test automation is still associated “hidden” costs and,in particular, maintenance costs [10, 12, 16, 40, 52]. Therefore, adoption ofautomated testing can lower the total development cost of a project by enablingfaster feedback to developers that leads to faster defect resolution, but testrelated costs still remain or can even increase. As such, to fulfill industry’sneed for a flexible GUI-based test automation technique, a technique must beidentified that is feasible long-term and which preferably provides quick ROIcompared to manual testing. Such a technique must also provide value interms of, at least, equal defect finding ability as manual testing and with lowtest execution time to facilitate frequent test execution.
Motivation: In theory, Visual GUI Testing (VGT) fulfills the industrialneed for a flexible, GUI-based, automated test technique due to its unprece-
14 CHAPTER 1. INTRODUCTION
Paper Objective RQ1 RQ2 RQ3 RQ4A Static evaluation of VGT in
practiceX X X
B Dynamic evaluation of VGT inpractice
X X X
C Challenges, problems and limita-tions with VGT in practice
X X X
D Maintenance and return on in-vestment of VGT
X X
E Long-term use of VGT in prac-tice
X X X
F Model-based VGT combinedwith 2nd generation GUI-basedtesting
X X
G Failure replication X X
Table 1.2: Mapping of research questions to the individual publications pre-sented in this thesis.
dented ability to emulate human interaction and assertions through a SUT’spictorial GUI, an ability provided by the technique’s use of tools with imagerecognition. However, the technique’s body of knowledge is limited, in partic-ular in regards to empirical evidence for its applicability and feasibility of usein industrial practice. This lack of knowledge is the main motivator for theresearch presented in this thesis since such knowledge is required as decisionsupport for industrial practitioners to evaluate if they should adopt and usethe technique. Consequently, this research is motivated by an industrial needfor a flexible and cost-effective GUI-based test automation technique that canemulate end user behavior with at least equal defect-finding ability as manualtesting but with lower test execution time. From an academic point of view,the research is also motivated since it provides additional empirical evidencefrom industry regarding the adoption, use and challenges related to automatedtesting.
Research Objective: The objective of this thesis is to identify empiricalevidence for, or against, the applicability and feasibility of VGT in industrialpractice. Additionally, to identify what challenges, problems and limitationsthat impede the technique’s short and long-term use. Hence, an overall viewof the current state-of-practice of VGT, including alternative and future ap-plication areas for the technique. Consequently, knowledge that can be usedfor decision support by practitioners and input for future academic research.
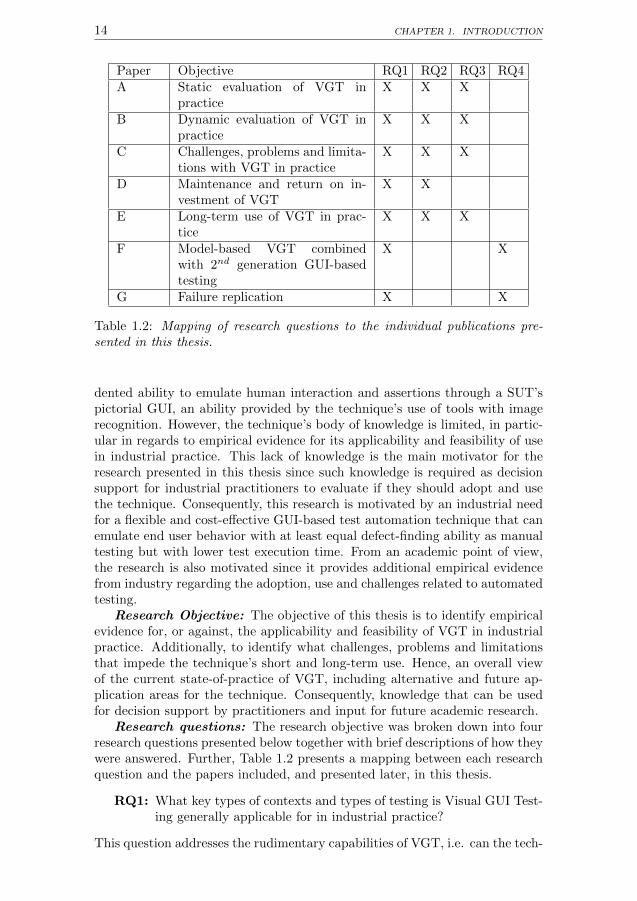
Research questions: The research objective was broken down into fourresearch questions presented below together with brief descriptions of how theywere answered. Further, Table 1.2 presents a mapping between each researchquestion and the papers included, and presented later, in this thesis.
RQ1: What key types of contexts and types of testing is Visual GUI Test-ing generally applicable for in industrial practice?
This question addresses the rudimentary capabilities of VGT, i.e. can the tech-
1.3. RESEARCH PROBLEM AND METHODOLOGY 15
nique at all find failures and defects on industrial grade systems? Additionally,it aims to identify support for what types of testing VGT is used for, e.g. onlyregression testing of system and acceptance tests or exploratory testing aswell? This question also addresses if VGT can be used in different contextsand domains, such as agile software development companies, for safety-criticalsoftware, etc. Support for this question was acquired throughout the thesiswork but in particular in the studies presented in Chapters 2, 3, 4, 6 and 8,i.e. Papers A, B, C, E and G.
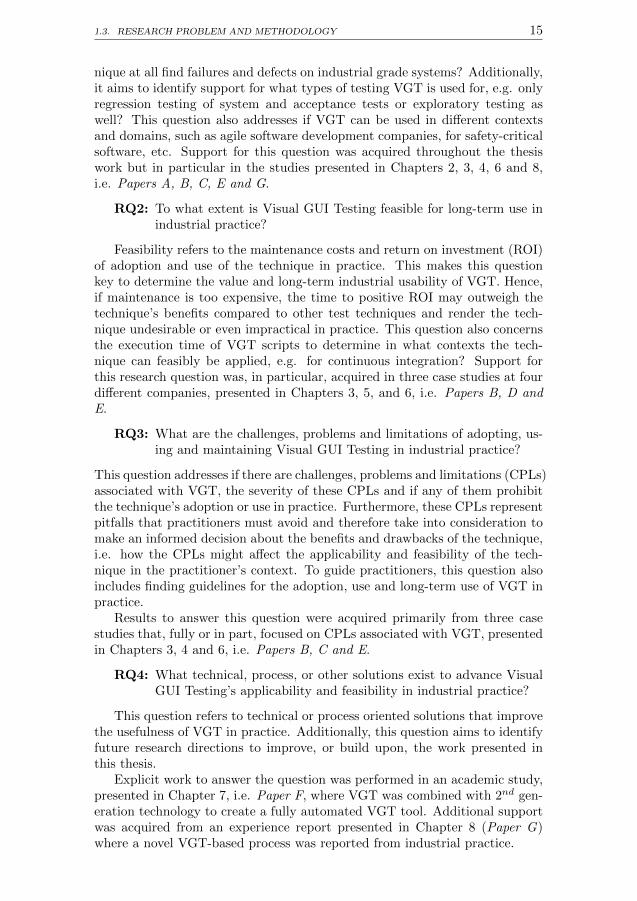
RQ2: To what extent is Visual GUI Testing feasible for long-term use inindustrial practice?
Feasibility refers to the maintenance costs and return on investment (ROI)of adoption and use of the technique in practice. This makes this questionkey to determine the value and long-term industrial usability of VGT. Hence,if maintenance is too expensive, the time to positive ROI may outweigh thetechnique’s benefits compared to other test techniques and render the tech-nique undesirable or even impractical in practice. This question also concernsthe execution time of VGT scripts to determine in what contexts the tech-nique can feasibly be applied, e.g. for continuous integration? Support forthis research question was, in particular, acquired in three case studies at fourdifferent companies, presented in Chapters 3, 5, and 6, i.e. Papers B, D andE.
RQ3: What are the challenges, problems and limitations of adopting, us-ing and maintaining Visual GUI Testing in industrial practice?
This question addresses if there are challenges, problems and limitations (CPLs)associated with VGT, the severity of these CPLs and if any of them prohibitthe technique’s adoption or use in practice. Furthermore, these CPLs representpitfalls that practitioners must avoid and therefore take into consideration tomake an informed decision about the benefits and drawbacks of the technique,i.e. how the CPLs might affect the applicability and feasibility of the tech-nique in the practitioner’s context. To guide practitioners, this question alsoincludes finding guidelines for the adoption, use and long-term use of VGT inpractice.
Results to answer this question were acquired primarily from three casestudies that, fully or in part, focused on CPLs associated with VGT, presentedin Chapters 3, 4 and 6, i.e. Papers B, C and E.
RQ4: What technical, process, or other solutions exist to advance VisualGUI Testing’s applicability and feasibility in industrial practice?
This question refers to technical or process oriented solutions that improvethe usefulness of VGT in practice. Additionally, this question aims to identifyfuture research directions to improve, or build upon, the work presented inthis thesis.
Explicit work to answer the question was performed in an academic study,presented in Chapter 7, i.e. Paper F, where VGT was combined with 2nd gen-eration technology to create a fully automated VGT tool. Additional supportwas acquired from an experience report presented in Chapter 8 (Paper G)where a novel VGT-based process was reported from industrial practice.
16 CHAPTER 1. INTRODUCTION
Paper A:Static
evaluation
Paper B: Dynamic
evaluationPaper C: Challenges,
problems and limitations
Paper D: Maintenance costs
Paper E: Long-term use of VGT
Paper F: VGT-GUITAR
Paper G: Fault replication with
VGT
RQ1:Applicability
RQ2:Feasibility
RQ3:CPLs
RQ4:Advances
Paper G: Fault replication with
VGT
Figure 1.4: A chronological mapping of how the studies included in this thesisare connected to provide support for the thesis four research questions. Thefigure also shows which papers that provided input (data, challenges, researchquestions, etc.) to proceeding papers. CPLs - challenges, problems and limi-tations.
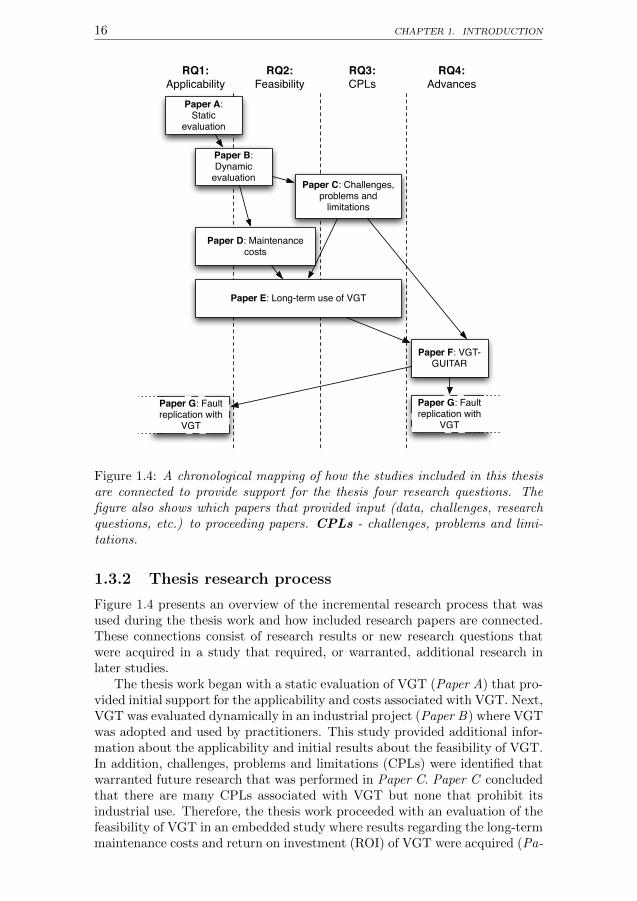
1.3.2 Thesis research process
Figure 1.4 presents an overview of the incremental research process that wasused during the thesis work and how included research papers are connected.These connections consist of research results or new research questions thatwere acquired in a study that required, or warranted, additional research inlater studies.
The thesis work began with a static evaluation of VGT (Paper A) that pro-vided initial support for the applicability and costs associated with VGT. Next,VGT was evaluated dynamically in an industrial project (Paper B) where VGTwas adopted and used by practitioners. This study provided additional infor-mation about the applicability and initial results about the feasibility of VGT.In addition, challenges, problems and limitations (CPLs) were identified thatwarranted future research that was performed in Paper C. Paper C concludedthat there are many CPLs associated with VGT but none that prohibit itsindustrial use. Therefore, the thesis work proceeded with an evaluation of thefeasibility of VGT in an embedded study where results regarding the long-termmaintenance costs and return on investment (ROI) of VGT were acquired (Pa-
1.3. RESEARCH PROBLEM AND METHODOLOGY 17
per D). These results were acquired through empirical work with an industrialsystem (Static analysis) and interviews with practitioners that had used VGTfor several months (Dynamic analysis). However, results regarding the long-term feasibility of the technique were still missing, a gap in knowledge thatwas filled by an interview study at a company that had used VGT for severalyears (Paper E ). Consequently, these studies provided an overall view of thecurrent state-of-practice of VGT. In addition they provided support to drawconclusions regarding the applicability (RQ1 ) and feasibility (RQ2 ) of VGTin practice but also what CPLs that are associated with the technique (RQ3 ).
Further, to advance state-of-practice, a study was performed where VGTwas combined with 2nd generation technology that resulted in a building blockfor future research into fully automated VGT (Paper F )(RQ4 ). Additionalsupport for RQ4 was acquired from an experience report from industry (PaperG) where a novel semi-automated exploratory test process based on VGT wasreported.
Combined, these studies provide results to answer the thesis four researchquestions and a significant contribution to the body of knowledge of VGT andautomated testing.
1.3.3 Research methodology
A research methodology is a structured process that serves to acquire datato fulfill a study’s research objectives [70]. On a high level of abstraction,a research process can be divided into three phases: preparation, collectionand analysis (PCA). In the preparation phase the study’s research objectives,research questions and hypotheses are defined, including research materials,sampling of subjects, research methods are chosen for data collection, etc.Next, data collection is performed that shall preferably be conducted with sev-eral methods and/or sources of evidence to enable triangulation of the study’sresults and improve the research validity, i.e. the level of trust in the researchresults and conclusions [70–72]. Finally, in the analysis phase, the acquired re-search results are scrutinized, synthesized and/or equated to draw the study’sconclusions that can be both positive or negative answers to a study’s researchquestion(s).
Some research methodologies deviate from the PCA pattern and are insteadsaid to have a flexible design. Flexible design implies that changes can bemade to the design during the study to, for instance, accommodate additional,unplanned, data collection opportunities [17].
A researcher can create an ad hoc research methodology if required, butseveral common methodologies exist that are used in software engineering re-search, e.g. case studies [17], experiments [73] and action research [74].
Two research methodologies were used extensively during this thesis work:case studies and experiments. This choice was motivated by the thesis re-search questions and the studies’ available resources. Action research was,for instance, not used because it requires a longitudinal study of incremen-tal change to the studied phenomenon which makes it resource intensive andplaces a larger requirement on the collaborating company’s commitment tothe study. Hence, a commitment that many companies are reluctant to giveto an immature research area such as VGT.
18 CHAPTER 1. INTRODUCTION
Research methodologies have different characteristics and thus, inherently,provide different levels of research validity [72]. Validity is categorized in differ-ent ways in different research fields but in this thesis it is categorized accordingto the guidelines by Runeson and Host [17], into the following categories:
� Construct validity - The suitability of the studied context to providevalid answers to the study’s research questions,
� Internal validity - The strength of cohesion and consistency of collectedresults.
� External validity - The ability to generalize the study’s results to othercontexts and domains, and
� Reliability/Conclusion validity - The degree of replicability of thestudy’s results.
Case studies provide a deeper understanding of a phenomenon in its actualcontext [17] and therefore have inherently high construct validity. In addition,given that a case study is performed in a well chosen context with an ap-propriate sample of subjects, it also provides results of high external validity.However, case studies in software engineering are often performed in industryand are therefore governed by the resources provided by the case company,which limits researcher control and can negatively affect the results internalvalidity.
In contrast, experiments [73] are associated with a high degree of researchercontrol. This control is used to manipulate the studied phenomenon and ran-domize the experimental sample to mitigate factors that could adversely affectthe study’s results. As such, experiments have inherent high internal validitybut it comes at the expense of construct validity since the studied phenomenonis, by definition, no longer studied in its actual context. In addition, similarto case studies, the external validity of experimental results depend on theresearch sample.
Furthermore, research methodologies can be classified based on if they arequalitative or quantitative [70], where case studies are associated with quali-tative data [17], e.g. data from interviews, observations, etc., and experimentsare associated with quantitative data [73], e.g. measurements, calculations,etc. These associations are however only a rule of thumb since many case stud-ies include quantitative data to support the study’s conclusions [73] and exper-iments often support their conclusions with qualitative observations. Duringthe thesis work, both types of data were extensively used to strengthen thepapers’, and the thesis, conclusions and contributions. This strength is pro-vided by quantitative results’ ability to be compared between studies, whilstqualitative data provides a deeper understanding of the results.
1.3.4 Case studies
A case study is defined as a study of a phenomenon in its contemporary con-text [17, 71]. The phenomenon in its context is also referred to as the study’sunit of analysis, which can be a practice, a process, a tool, etc., used in an
1.3. RESEARCH PROBLEM AND METHODOLOGY 19
Survey
Inte
rvie
ws
Docu
men
tan
dwork
shop
sanaly
sis
Exploratory
Explanatory Desc
riptiv
e
A
B
C
D
E
Experiment
F
Experience report
G
X
TypeX
Legend
- Case study presented in Paper X
- Study of other type presented in Paper X
Y - Research method(s) used in Papers Xs
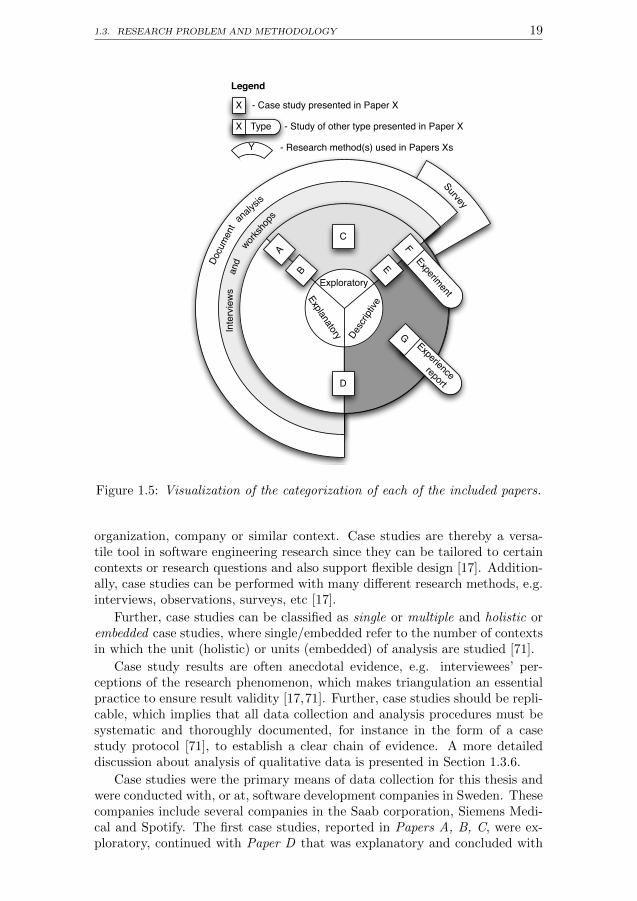
Figure 1.5: Visualization of the categorization of each of the included papers.
organization, company or similar context. Case studies are thereby a versa-tile tool in software engineering research since they can be tailored to certaincontexts or research questions and also support flexible design [17]. Addition-ally, case studies can be performed with many different research methods, e.g.interviews, observations, surveys, etc [17].
Further, case studies can be classified as single or multiple and holistic orembedded case studies, where single/embedded refer to the number of contextsin which the unit (holistic) or units (embedded) of analysis are studied [71].
Case study results are often anecdotal evidence, e.g. interviewees’ per-ceptions of the research phenomenon, which makes triangulation an essentialpractice to ensure result validity [17,71]. Further, case studies should be repli-cable, which implies that all data collection and analysis procedures must besystematic and thoroughly documented, for instance in the form of a casestudy protocol [71], to establish a clear chain of evidence. A more detaileddiscussion about analysis of qualitative data is presented in Section 1.3.6.
Case studies were the primary means of data collection for this thesis andwere conducted with, or at, software development companies in Sweden. Thesecompanies include several companies in the Saab corporation, Siemens Medi-cal and Spotify. The first case studies, reported in Papers A, B, C, were ex-ploratory, continued with Paper D that was explanatory and concluded with
20 CHAPTER 1. INTRODUCTION
Paper E that was descriptive, depicted in Figure 1.5. Hence, the thesis worktransitioned from exploration to explanation of the capabilities and propertiesof VGT to description of its use in practice. This transition was driven by theincrementally acquired results from each study, where later studies therebyaimed to verify the results of earlier studies. Figure 1.5 also includes studiesthat were not case studies, i.e. Papers F and G which were an experiment andan experience report respectively, depicted to show how they were classified inrelation to the other papers included in the thesis.
Furthermore, the performed case studies were all inherently different, i.e.conducted with different companies, in different domains, with different sub-jects and VGT tools, which has strengthened both the construct and externalvalidity of the thesis conclusions. Further, interviews were used for the ma-jority of the data collection to acquire in depth knowledge about the adoptionand use of VGT. However, quantitative, or quantifiable, data was also acquiredsince it was required to compare VGT to other test techniques in the studies,and the thesis. For instance, quantitative data was acquired to compare theperformance and cost of VGT to both manual test techniques and 2nd genera-tion GUI-based testing. However, comparisons were also made with qualitativedata, such as practitioners’ perceptions about benefits and drawbacks of dif-ferent techniques, to get a broad view of the techniques’ commonalities anddifferences in different contexts. Thus ensuring that the included studies’ in-dividual contributions were triangulated with data from different sources andmethods to improve the results internal validity.
1.3.4.1 Interviews
Interviews are commonly used for data collection in case study research andcan be divided into three different types: structured-, semi-structured andunstructured interviews [71, 75]. Each type is performed with an interviewguide that contains step-by-step instructions for an interview, including theinterview questions, research objectives, etc. In addition, interview guidesshall include a statement regarding the purpose of the study and insuranceof the interviewee’s anonymity, which helps to mitigate biased or untruthfulanswers. Further, these types of interviews vary in strictness, which relates tothe makeup of the interview guide as well as the interviewer’s freedoms duringan interview.
Structured interviews: Structured interviews are the most strict [71] andrestrict the interviewer from asking follow up questions or ask the intervieweeto clarify their answers. Therefore, considerable effort should be spent onthe interview guide to test it and to ensure that the interview questions areunambiguous and valid to answer the study’s research questions. Structuredinterview questions can be of different type but multiple-choice or forced-choiceare the most common. Forced choice questions, e.g. Likert-scale questions,can be analyzed with statistics [76] but require a larger interview sample,which makes the method costly in terms of resources. Therefore, structuredinterviews were not used during the thesis work.
Semi-structured interviews: The second most strict type of interviewis called semi-structured interviews [71], which allow the interviewer to elicitmore in depth or better quality information by asking follow up questions or

1.3. RESEARCH PROBLEM AND METHODOLOGY 21
by clarifying questions to the interviewee. These interviews are therefore suit-able in descriptive studies, where the studied phenomenon is partly known, orexploratory studies, where little or nothing is known about the phenomenon.In both cases, several interviews should be performed where each interviewshould add to the researcher’s understanding of the studied phenomenon andallow the researcher to tailor each consecutive interview, i.e. change the inter-view questions, to acquire more in depth knowledge. However, care should betaken when changes are made to ensure that the interview results can still betriangulated, i.e. the interview questions must not diverge too much betweeninterviews.
Semi-structured interviews were extensively used during the thesis workboth to explore and describe the use of VGT and its associated CPLs [17].Further, interview guides were always used but they were seldom changed be-tween interviews, instead more in depth information was acquired through adhoc follow-up questions in each interview. The baseline of common questionswas kept to make triangulation of interview results easier. These interviewswere all recorded, transcribed and analyzed with less rigorous qualitative anal-ysis or Grounded Theory analysis [77], i.e. rigorous coding analysis [78].
Unstructured interviews: Finally, the least strict type of interviews areunstructured interviews [71] where interview guides are optional, but recom-mended, to guide the interview. This type of interview is therefore suitablefor exploratory studies [17] and were primarily used in the thesis work inpre-studies to acquire contextual information about the research companiesthrough general questions regarding the companies processes, practices, orga-nizations, etc. In addition to context information, they also provided baselineinformation for additional interviews.
1.3.4.2 Workshops
Workshops are often performed with groups of participants, similar to focusgroups [79] and their purpose is to explore, describe or explain a phenomenonunder study [80] through discussions, brainstorming [81], activity participa-tion, etc. As such, workshops can be a means to acquire both in depth andbroad information in a short amounts of time, as discussed by Young for thepurpose of requirements elicitation [82].
However, several prerequisites must be fulfilled for a workshop to be suc-cessful, for instance, the workshop participants must be a well chosen sample,i.e. with participants of varying experience, roles, age, gender, etc. This pre-requisite can be challenging to fulfill in industrial studies since access to suit-able participants is often restricted, for instance due to resource or schedulingconstraints, etc. In addition, some constellations of participants can add biasto the results. For instance, employees can be reluctant to give their honestopinions if their managers are present in the workshop which presents a threatto the results. Additionally, if a sample is too uniform it may not providerepresentative results for the whole company or other domains, which is athreat to the results external validity. Another challenge with workshops isto keep them in scope of the study, especially if lively, and perhaps interest-ing, discussions occur, and they should therefore be moderated. Because ofthese challenges, workshop results must also be triangulated with, for instance,

22 CHAPTER 1. INTRODUCTION
follow-up interviews, surveys, etc.A workshop can be designed ad hoc to achieve a specific research objective,
or performed with a standard workshop format, e.g. KJ-Shiba [83]. Regard-less, workshops must be thoroughly planned. This planning includes samplingof suitable participants, creation of workshop materials, planning the analysisprocedure, etc.
Workshops were used in several studies included in the thesis, for two rea-sons. First, to quickly acquire information about a research company’s con-texts, practices and tools. Hence, exploratory workshops with one or severalparticipants where unstructured or semi-structured interviews and visual aids,e.g. white-board drawings, were commonly used. Second, workshops wereused for result verification and triangulation where workshops began with apresentation of the study’s acquired results followed by discussion and analysisof key results with the workshop’s participants. These workshops, presentedin Papers B, C and E, were well planned, with predefined workshop materialssuch as interview questions, presentation materials, etc., but participants weremostly sampled with convenience sampling due to resource constraints.
1.3.4.3 Other
Interviews and workshops were the primary methods used in the case studiesincluded in this thesis. However, other methods were also used during thethesis work1, some of which will be briefly discussed in this section.
Document analysis: Interviews and workshops acquire first degree data [71,84], i.e. data directly from a source of information such as an interviewee. Inturn, second degree data is collected indirectly from a source, for instance,through transcription of a recorded interview. However, document analysisrelies on third degree data [17], which is data that has already been tran-scribed and potentially analyzed.
From a company perspective, document analysis can be a cost-effectivemethod of data transference but can be a time-consuming activity for theresearcher, especially in foreign or highly technical domains. Further, thirddegree data is created by a third person and can therefore include biases whichmeans that document root-source analysis is required to identify who createdthe document, for what purpose, the age of the information, etc. [17], i.e. toevaluate the documented information’s validity.
Document analysis was used in the thesis work to acquire informationabout the research companies’ processes and practices. In particular, testspecifications were analyzed to give input for empirical work with VGT at thestudied companies, e.g. in Paper A where manual test cases at Saab AB wereautomated with two different VGT tools.
Further, this method can be used in a survey to conduct systematic map-pings and systematic literature reviews [85] of published research papers. How-ever, due to the limited body of knowledge on VGT, no such study was per-formed during the thesis work.
Surveys: Surveys are performed on samples of people, documents, soft-ware, or other group [86] for the purpose of acquiring general conclusions
1In this instance, thesis work refers also to studies performed by the author but notincluded in the thesis.
1.3. RESEARCH PROBLEM AND METHODOLOGY 23
regarding an aspect of the sample [71]. For instance, a survey with people canserve to acquire their perceptions of a phenomenon, document surveys insteadaim at document synthesis [85], etc.
In software engineering research, surveys are often performed with ques-tionnaires as an alternative to structured interviews [71]. One benefit of ques-tionnaires is that they can be distributed to a large sample at low cost but ifthere is no incentive for the sample to answer the questionnaire, the partici-pant response-rate can be low, i.e. less than the rule of thumb of 60 percentthat is suggested for the survey to be considered valid.
Questionnaire questions can be multiple-choice, forced-choice or open, i.e.free text. Forced choice questions are often written as Likert scale ques-tions [76], i.e. on an approximated ratio-scale between, for instance, totallydisagree and totally agree. In turn, multiple choice questions can ask par-ticipants to rank concepts on ratio-scales, e.g. with the 100 dollar bill ap-proach [87]. However, questions can have other scales such as nominal, ordinalor interval scales [88]. These scales serve different purposes and it is thereforeimportant to choose the right type to be able to answer the study’s researchquestions. Regardless, questionnaire creation is a challenge since the questionsmust be unambiguous, complete, use context specific nomenclature, etc., tobe of high quality. Therefore, like interview guides, questionnaires must bereviewed and tested prior to use.
Questionnaires were used during the thesis work to verify previously gath-ered results and to acquire data in association with workshops. Explicitly,among the research papers included in this thesis, a questionnaire survey wasused in Paper E. The results of the surveys were then analyzed qualitativelyor with formal or descriptive statistics, discussed further in Section 1.3.6, totest the studies’ hypotheses or answer the studies’ research questions.
Observation: Observations are fundamental in research and can be usedin different settings and performed in different ways, e.g. structured or un-structured [89]. One way to perform an observation is the fly on the walltechnique, where the researcher is not allowed to influence the person, pro-cess, etc., being observed. Another type is the talk-aloud protocol, where theobserved person is asked to continuously describe what (s)he is doing [17]. Assuch, observations are a suitable practice to acquire information about a phe-nomenon in its actual context and can also provide the researcher with deeperunderstanding of domain-specific or technical aspects of the phenomenon.
However, observation studies are associated with several threats, for in-stance the Hawthorne effect, which causes the observed person to changehis/her behavior because they know they are being observed [90]. There-fore, the context of the observation must be taken into consideration as wellas ethical considerations, e.g. how, what and why something or someone isbeing observed [17]. An example of unethical observation would be to observea person without their knowledge.
Planned observation, with an observation guide, etc., was only used onceduring the thesis work to observe how manual testing was performed at acompany. However, observations were also used to help explain results fromthe empirical studies with VGT, i.e. in Papers A and D.
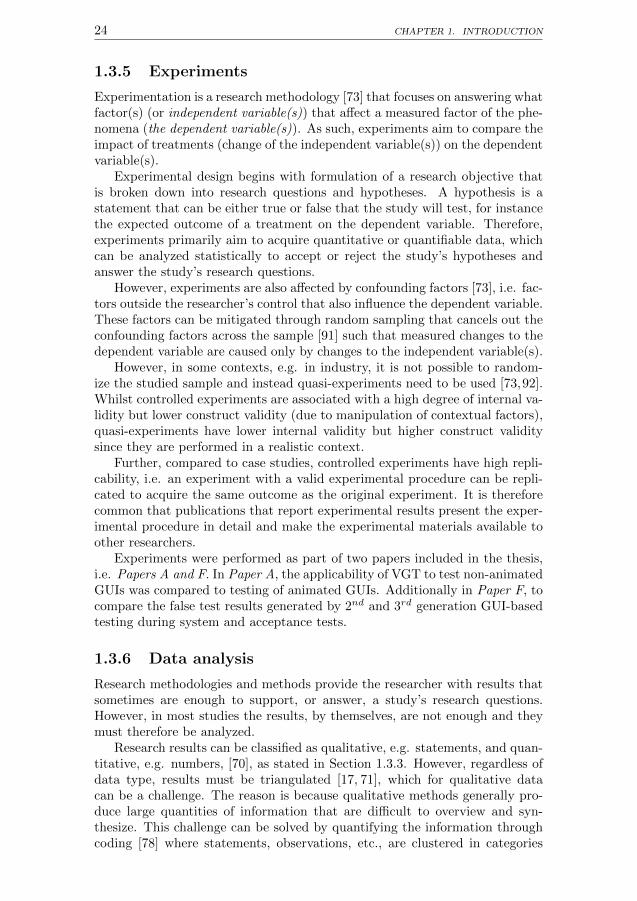
24 CHAPTER 1. INTRODUCTION
1.3.5 Experiments
Experimentation is a research methodology [73] that focuses on answering whatfactor(s) (or independent variable(s)) that affect a measured factor of the phe-nomena (the dependent variable(s)). As such, experiments aim to compare theimpact of treatments (change of the independent variable(s)) on the dependentvariable(s).
Experimental design begins with formulation of a research objective thatis broken down into research questions and hypotheses. A hypothesis is astatement that can be either true or false that the study will test, for instancethe expected outcome of a treatment on the dependent variable. Therefore,experiments primarily aim to acquire quantitative or quantifiable data, whichcan be analyzed statistically to accept or reject the study’s hypotheses andanswer the study’s research questions.
However, experiments are also affected by confounding factors [73], i.e. fac-tors outside the researcher’s control that also influence the dependent variable.These factors can be mitigated through random sampling that cancels out theconfounding factors across the sample [91] such that measured changes to thedependent variable are caused only by changes to the independent variable(s).
However, in some contexts, e.g. in industry, it is not possible to random-ize the studied sample and instead quasi-experiments need to be used [73,92].Whilst controlled experiments are associated with a high degree of internal va-lidity but lower construct validity (due to manipulation of contextual factors),quasi-experiments have lower internal validity but higher construct validitysince they are performed in a realistic context.
Further, compared to case studies, controlled experiments have high repli-cability, i.e. an experiment with a valid experimental procedure can be repli-cated to acquire the same outcome as the original experiment. It is thereforecommon that publications that report experimental results present the exper-imental procedure in detail and make the experimental materials available toother researchers.
Experiments were performed as part of two papers included in the thesis,i.e. Papers A and F. In Paper A, the applicability of VGT to test non-animatedGUIs was compared to testing of animated GUIs. Additionally in Paper F, tocompare the false test results generated by 2nd and 3rd generation GUI-basedtesting during system and acceptance tests.
1.3.6 Data analysis
Research methodologies and methods provide the researcher with results thatsometimes are enough to support, or answer, a study’s research questions.However, in most studies the results, by themselves, are not enough and theymust therefore be analyzed.
Research results can be classified as qualitative, e.g. statements, and quan-titative, e.g. numbers, [70], as stated in Section 1.3.3. However, regardless ofdata type, results must be triangulated [17, 71], which for qualitative datacan be a challenge. The reason is because qualitative methods generally pro-duce large quantities of information that are difficult to overview and syn-thesize. This challenge can be solved by quantifying the information throughcoding [78] where statements, observations, etc., are clustered in categories
1.3. RESEARCH PROBLEM AND METHODOLOGY 25
defined by codes that can then be analyzed individually to identify supportfor the study’s research question(s). This practice is key in Grounded Theoryresearch [77] and is recommended to acquire a strong chain of evidence [71]and can be performed in different ways. However, a general recommendationis that it is performed by several people to mitigate coding bias.
During the thesis work, coding was only used for the data analysis in PaperF since the study relied exclusively on qualitative data. Previous studies,included in the thesis, all include empirical work and/or quantitative data,which justified the use of less stringent analysis methods since the results ofthese studies were triangulated with data sources of different type.
Further, quantitative data can be analyzed statistically, either with de-scriptive or formal methods [93,94]. Descriptive statistics are used to visualizedata to provide an overview of the data, e.g. in graphs and plots, which forlarger data sets can be particularly helpful since it helps establish patterns,distributions and other insights to the data. Descriptive statistics were par-ticularly helpful in Paper D to visualize and draw conclusions regarding themaintenance costs and return on investment of VGT.
In contrast, formal statistics are mathematical methods that are used tocompare, correlate, or evaluate data to find statistically likely patterns, e.g.to compare if two data sets are (statistically) significantly different. Formalstatistical analysis was used in several of the studies included in the thesis, i.e.Papers A, D, E and F, most often performed with the Student T-Test, theWilcoxon rank-sum test or the Mann-Whitney U test [95].
Further, formal statistical methods can be split into two different cate-gories, parametric and non-parametric tests [93, 96], where parametric testsprovide statistical results of high precision but are associated with more pre-requisites than non-parametric tests. These prerequisites include that the dataset should be normally distributed, that the sample is of suitable size, etc.However, these prerequisites are often difficult to fulfill in industrial studiesand therefore it is argued that the use of parametric tests should be avoidedin favor of non-parametric tests in software engineering research [96], despitethe fact that non-parametric tests lower statistical precision. Due to the in-dustrial focus of the thesis work, most formal statistical analysis performed inthe included studies were non-parametric, limited primarily by lack of normaldistribution in the acquired data sets.
In summary, research results can be both qualitative and quantitative andanalyzed with both descriptive and formal statistics, all used during this thesiswork to strengthen the validity of the studies’ conclusions. Hence, quantitativedata was used to statistically compare VGT tools and VGT to other test tech-niques, triangulated with qualitative data to explain the quantitative resultsand vice versa.
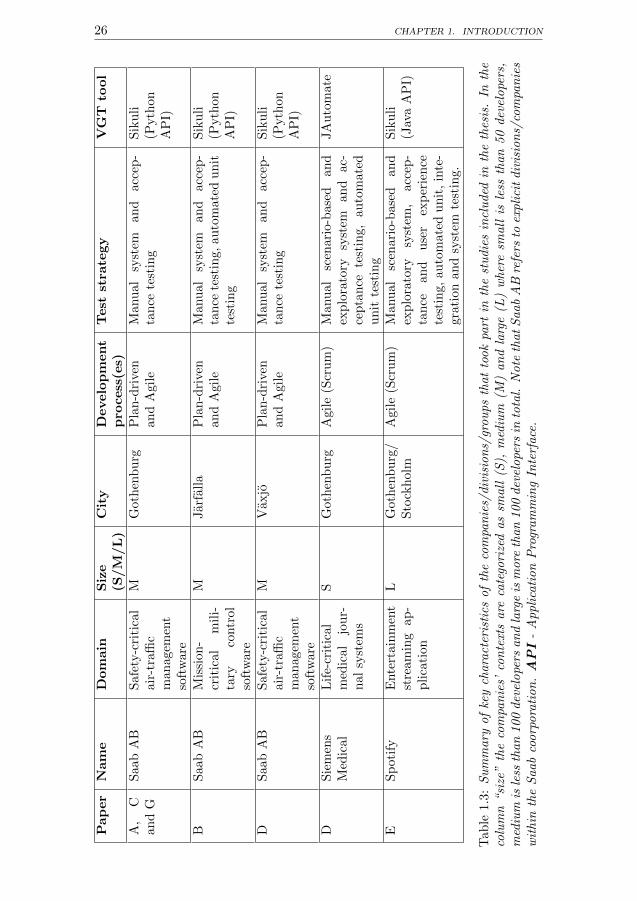
26 CHAPTER 1. INTRODUCTION
Pap
er
Nam
eD
om
ain
Siz
e(S
/M
/L
)C
ity
Develo
pm
ent
pro
cess
(es)
Test
stra
tegy
VG
Tto
ol
A,
Can
dG
Saa
bA
BS
afet
y-c
riti
cal
air-
traffi
cm
an
agem
ent
soft
ware
MG
oth
enb
urg
Pla
n-d
rive
nan
dA
gil
eM
anu
al
syst
eman
dacc
ep-
tan
cete
stin
gS
iku
li(P
yth
on
AP
I)
BS
aab
AB
Mis
sion
-cr
itic
al
mil
i-ta
ryco
ntr
ol
soft
ware
MJarf
all
aP
lan
-dri
ven
an
dA
gil
eM
anu
al
syst
eman
dacc
ep-
tan
cete
stin
g,au
tom
ate
du
nit
test
ing
Sik
uli
(Pyth
on
AP
I)
DS
aab
AB
Saf
ety-c
riti
cal
air-
traffi
cm
an
agem
ent
soft
ware
MV
axjo
Pla
n-d
rive
nan
dA
gil
eM
anu
al
syst
eman
dacc
ep-
tan
cete
stin
gS
iku
li(P
yth
on
AP
I)
DS
iem
ens
Med
ical
Lif
e-cr
itic
al
med
ical
jou
r-n
alsy
stem
s
SG
oth
enb
urg
Agil
e(S
cru
m)
Manu
al
scen
ari
o-b
ase
dan
dex
plo
rato
rysy
stem
an
dac-
cep
tan
cete
stin
g,
au
tom
ate
du
nit
test
ing
JA
uto
mate
ES
pot
ify
Ente
rtain
men
tst
ream
ing
ap
-p
lica
tion
LG
oth
enb
urg
/S
tock
holm
Agil
e(S
cru
m)
Manu
al
scen
ari
o-b
ase
dan
dex
plo
rato
rysy
stem
,acc
ep-
tan
cean
du
ser
exp
erie
nce
test
ing,
au
tom
ate
du
nit
,in
te-
gra
tion
an
dsy
stem
test
ing.
Sik
uli
(Jav
aA
PI)
Tab
le1.
3:S
um
mary
of
key
chara
cter
isti
csof
the
com
pan
ies/
div
isio
ns/
grou
ps
that
took
part
inth
est
udie
sin
clu
ded
inth
eth
esis
.In
the
colu
mn
“si
ze”
the
com
pan
ies’
con
text
sare
cate
gori
zed
as
small
(S),
med
ium
(M)
an
dla
rge
(L)
wher
esm
all
isle
ssth
an
50
dev
elope
rs,
med
ium
isle
ssth
an
100
dev
elope
rsan
dla
rge
ism
ore
than
100
dev
elope
rsin
tota
l.N
ote
that
Saab
AB
refe
rsto
expli
cit
div
isio
ns/
com
pan
ies
wit
hin
the
Saab
coorp
ora
tion
.A
PI
-A
ppli
cati
on
Pro
gram
min
gIn
terf
ace
.
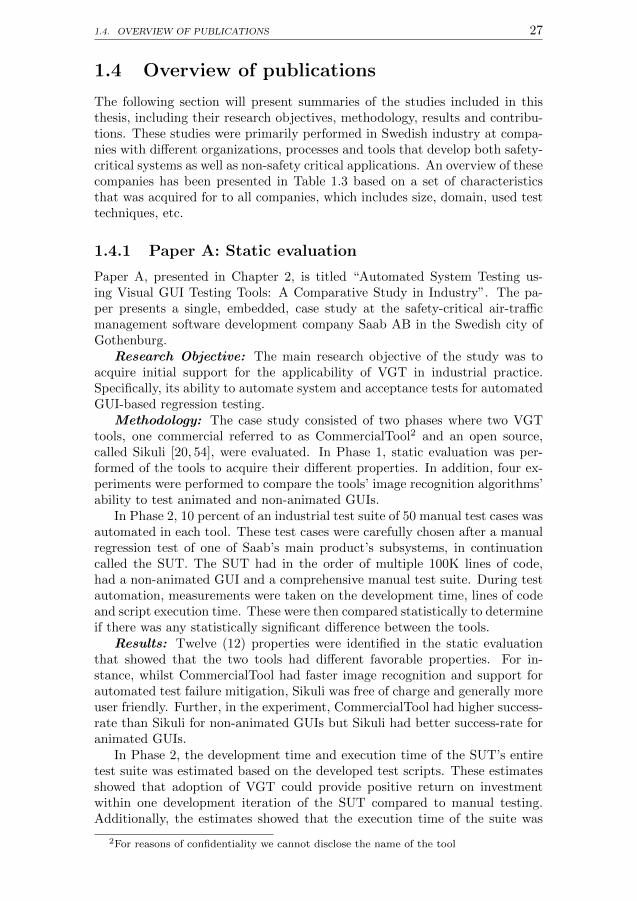
1.4. OVERVIEW OF PUBLICATIONS 27
1.4 Overview of publications
The following section will present summaries of the studies included in thisthesis, including their research objectives, methodology, results and contribu-tions. These studies were primarily performed in Swedish industry at compa-nies with different organizations, processes and tools that develop both safety-critical systems as well as non-safety critical applications. An overview of thesecompanies has been presented in Table 1.3 based on a set of characteristicsthat was acquired for to all companies, which includes size, domain, used testtechniques, etc.
1.4.1 Paper A: Static evaluation
Paper A, presented in Chapter 2, is titled “Automated System Testing us-ing Visual GUI Testing Tools: A Comparative Study in Industry”. The pa-per presents a single, embedded, case study at the safety-critical air-trafficmanagement software development company Saab AB in the Swedish city ofGothenburg.
Research Objective: The main research objective of the study was toacquire initial support for the applicability of VGT in industrial practice.Specifically, its ability to automate system and acceptance tests for automatedGUI-based regression testing.
Methodology: The case study consisted of two phases where two VGTtools, one commercial referred to as CommercialTool2 and an open source,called Sikuli [20, 54], were evaluated. In Phase 1, static evaluation was per-formed of the tools to acquire their different properties. In addition, four ex-periments were performed to compare the tools’ image recognition algorithms’ability to test animated and non-animated GUIs.
In Phase 2, 10 percent of an industrial test suite of 50 manual test cases wasautomated in each tool. These test cases were carefully chosen after a manualregression test of one of Saab’s main product’s subsystems, in continuationcalled the SUT. The SUT had in the order of multiple 100K lines of code,had a non-animated GUI and a comprehensive manual test suite. During testautomation, measurements were taken on the development time, lines of codeand script execution time. These were then compared statistically to determineif there was any statistically significant difference between the tools.
Results: Twelve (12) properties were identified in the static evaluationthat showed that the two tools had different favorable properties. For in-stance, whilst CommercialTool had faster image recognition and support forautomated test failure mitigation, Sikuli was free of charge and generally moreuser friendly. Further, in the experiment, CommercialTool had higher success-rate than Sikuli for non-animated GUIs but Sikuli had better success-rate foranimated GUIs.
In Phase 2, the development time and execution time of the SUT’s entiretest suite was estimated based on the developed test scripts. These estimatesshowed that adoption of VGT could provide positive return on investmentwithin one development iteration of the SUT compared to manual testing.Additionally, the estimates showed that the execution time of the suite was
2For reasons of confidentiality we cannot disclose the name of the tool
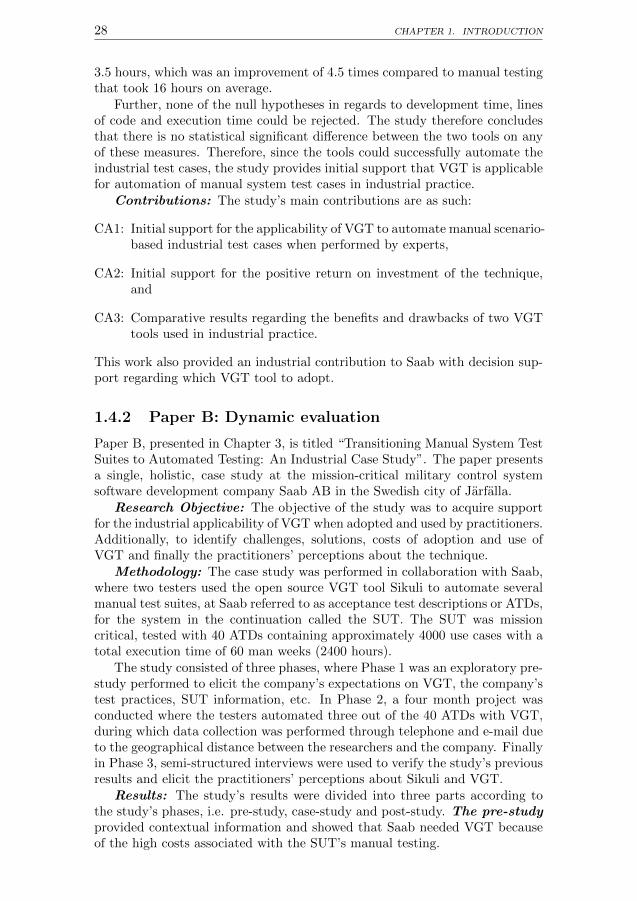
28 CHAPTER 1. INTRODUCTION
3.5 hours, which was an improvement of 4.5 times compared to manual testingthat took 16 hours on average.
Further, none of the null hypotheses in regards to development time, linesof code and execution time could be rejected. The study therefore concludesthat there is no statistical significant difference between the two tools on anyof these measures. Therefore, since the tools could successfully automate theindustrial test cases, the study provides initial support that VGT is applicablefor automation of manual system test cases in industrial practice.
Contributions: The study’s main contributions are as such:
CA1: Initial support for the applicability of VGT to automate manual scenario-based industrial test cases when performed by experts,
CA2: Initial support for the positive return on investment of the technique,and
CA3: Comparative results regarding the benefits and drawbacks of two VGTtools used in industrial practice.
This work also provided an industrial contribution to Saab with decision sup-port regarding which VGT tool to adopt.
1.4.2 Paper B: Dynamic evaluation
Paper B, presented in Chapter 3, is titled “Transitioning Manual System TestSuites to Automated Testing: An Industrial Case Study”. The paper presentsa single, holistic, case study at the mission-critical military control systemsoftware development company Saab AB in the Swedish city of Jarfalla.
Research Objective: The objective of the study was to acquire supportfor the industrial applicability of VGT when adopted and used by practitioners.Additionally, to identify challenges, solutions, costs of adoption and use ofVGT and finally the practitioners’ perceptions about the technique.
Methodology: The case study was performed in collaboration with Saab,where two testers used the open source VGT tool Sikuli to automate severalmanual test suites, at Saab referred to as acceptance test descriptions or ATDs,for the system in the continuation called the SUT. The SUT was missioncritical, tested with 40 ATDs containing approximately 4000 use cases with atotal execution time of 60 man weeks (2400 hours).
The study consisted of three phases, where Phase 1 was an exploratory pre-study performed to elicit the company’s expectations on VGT, the company’stest practices, SUT information, etc. In Phase 2, a four month project wasconducted where the testers automated three out of the 40 ATDs with VGT,during which data collection was performed through telephone and e-mail dueto the geographical distance between the researchers and the company. Finallyin Phase 3, semi-structured interviews were used to verify the study’s previousresults and elicit the practitioners’ perceptions about Sikuli and VGT.
Results: The study’s results were divided into three parts according tothe study’s phases, i.e. pre-study, case-study and post-study. The pre-studyprovided contextual information and showed that Saab needed VGT becauseof the high costs associated with the SUT’s manual testing.
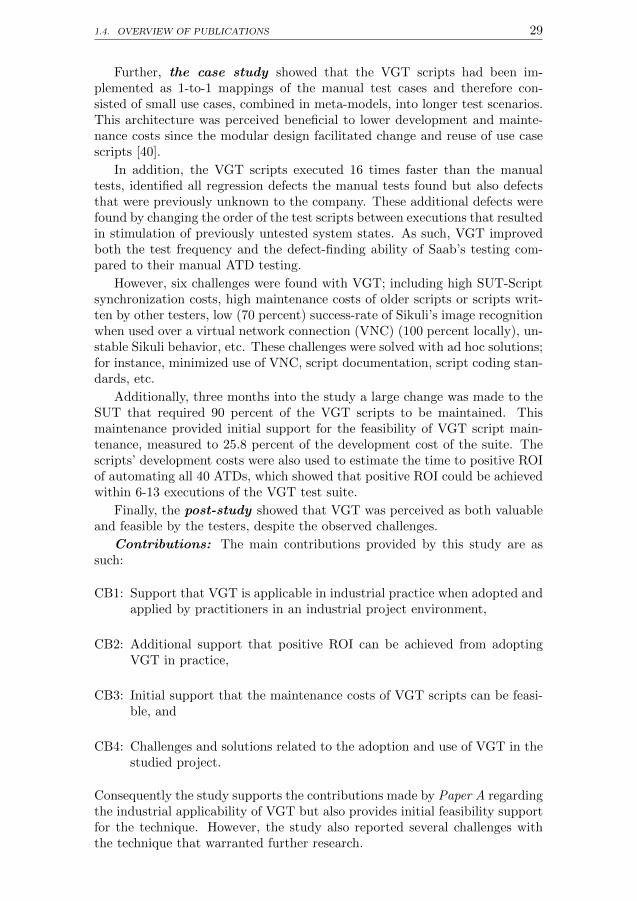
1.4. OVERVIEW OF PUBLICATIONS 29
Further, the case study showed that the VGT scripts had been im-plemented as 1-to-1 mappings of the manual test cases and therefore con-sisted of small use cases, combined in meta-models, into longer test scenarios.This architecture was perceived beneficial to lower development and mainte-nance costs since the modular design facilitated change and reuse of use casescripts [40].
In addition, the VGT scripts executed 16 times faster than the manualtests, identified all regression defects the manual tests found but also defectsthat were previously unknown to the company. These additional defects werefound by changing the order of the test scripts between executions that resultedin stimulation of previously untested system states. As such, VGT improvedboth the test frequency and the defect-finding ability of Saab’s testing com-pared to their manual ATD testing.
However, six challenges were found with VGT; including high SUT-Scriptsynchronization costs, high maintenance costs of older scripts or scripts writ-ten by other testers, low (70 percent) success-rate of Sikuli’s image recognitionwhen used over a virtual network connection (VNC) (100 percent locally), un-stable Sikuli behavior, etc. These challenges were solved with ad hoc solutions;for instance, minimized use of VNC, script documentation, script coding stan-dards, etc.
Additionally, three months into the study a large change was made to theSUT that required 90 percent of the VGT scripts to be maintained. Thismaintenance provided initial support for the feasibility of VGT script main-tenance, measured to 25.8 percent of the development cost of the suite. Thescripts’ development costs were also used to estimate the time to positive ROIof automating all 40 ATDs, which showed that positive ROI could be achievedwithin 6-13 executions of the VGT test suite.
Finally, the post-study showed that VGT was perceived as both valuableand feasible by the testers, despite the observed challenges.
Contributions: The main contributions provided by this study are assuch:
CB1: Support that VGT is applicable in industrial practice when adopted andapplied by practitioners in an industrial project environment,
CB2: Additional support that positive ROI can be achieved from adoptingVGT in practice,
CB3: Initial support that the maintenance costs of VGT scripts can be feasi-ble, and
CB4: Challenges and solutions related to the adoption and use of VGT in thestudied project.
Consequently the study supports the contributions made by Paper A regardingthe industrial applicability of VGT but also provides initial feasibility supportfor the technique. However, the study also reported several challenges withthe technique that warranted further research.
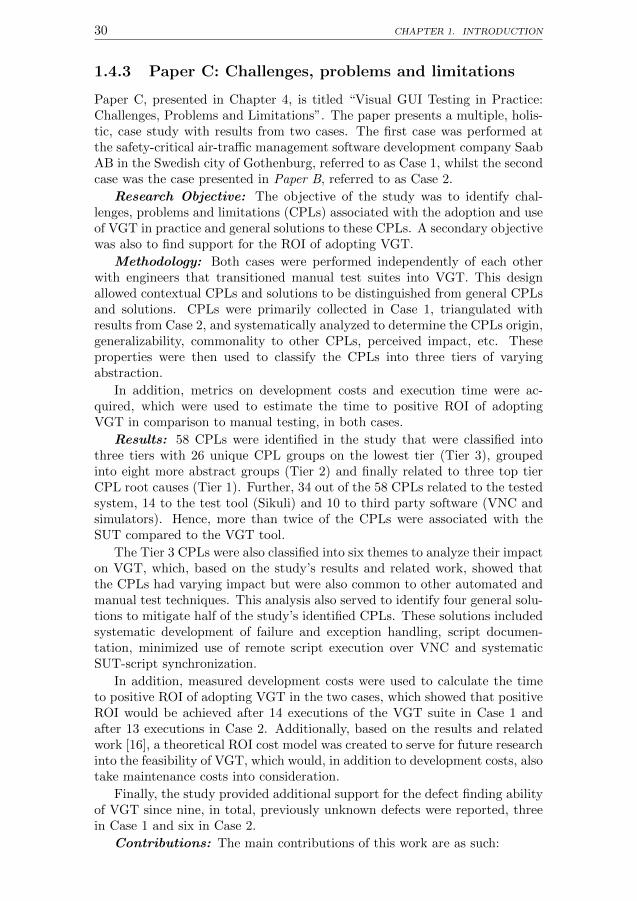
30 CHAPTER 1. INTRODUCTION
1.4.3 Paper C: Challenges, problems and limitations
Paper C, presented in Chapter 4, is titled “Visual GUI Testing in Practice:Challenges, Problems and Limitations”. The paper presents a multiple, holis-tic, case study with results from two cases. The first case was performed atthe safety-critical air-traffic management software development company SaabAB in the Swedish city of Gothenburg, referred to as Case 1, whilst the secondcase was the case presented in Paper B, referred to as Case 2.
Research Objective: The objective of the study was to identify chal-lenges, problems and limitations (CPLs) associated with the adoption and useof VGT in practice and general solutions to these CPLs. A secondary objectivewas also to find support for the ROI of adopting VGT.
Methodology: Both cases were performed independently of each otherwith engineers that transitioned manual test suites into VGT. This designallowed contextual CPLs and solutions to be distinguished from general CPLsand solutions. CPLs were primarily collected in Case 1, triangulated withresults from Case 2, and systematically analyzed to determine the CPLs origin,generalizability, commonality to other CPLs, perceived impact, etc. Theseproperties were then used to classify the CPLs into three tiers of varyingabstraction.
In addition, metrics on development costs and execution time were ac-quired, which were used to estimate the time to positive ROI of adoptingVGT in comparison to manual testing, in both cases.
Results: 58 CPLs were identified in the study that were classified intothree tiers with 26 unique CPL groups on the lowest tier (Tier 3), groupedinto eight more abstract groups (Tier 2) and finally related to three top tierCPL root causes (Tier 1). Further, 34 out of the 58 CPLs related to the testedsystem, 14 to the test tool (Sikuli) and 10 to third party software (VNC andsimulators). Hence, more than twice of the CPLs were associated with theSUT compared to the VGT tool.
The Tier 3 CPLs were also classified into six themes to analyze their impacton VGT, which, based on the study’s results and related work, showed thatthe CPLs had varying impact but were also common to other automated andmanual test techniques. This analysis also served to identify four general solu-tions to mitigate half of the study’s identified CPLs. These solutions includedsystematic development of failure and exception handling, script documen-tation, minimized use of remote script execution over VNC and systematicSUT-script synchronization.
In addition, measured development costs were used to calculate the timeto positive ROI of adopting VGT in the two cases, which showed that positiveROI would be achieved after 14 executions of the VGT suite in Case 1 andafter 13 executions in Case 2. Additionally, based on the results and relatedwork [16], a theoretical ROI cost model was created to serve for future researchinto the feasibility of VGT, which would, in addition to development costs, alsotake maintenance costs into consideration.
Finally, the study provided additional support for the defect finding abilityof VGT since nine, in total, previously unknown defects were reported, threein Case 1 and six in Case 2.
Contributions: The main contributions of this work are as such:

1.4. OVERVIEW OF PUBLICATIONS 31
CC1: 29 unique groups of challenges, problems and limitations (CPLs) thataffect the adoption or application of VGT in industrial practice,
CC2: Four general solutions that solve or mitigate roughly half of the identifiedCPLs, and
CC3: Results regarding the development costs, execution time, defect-findingability and ROI of the use of VGT in industrial practice.
Additionally, the paper provides a general contribution to the body of knowl-edge of automated testing that currently only holds limited empirical supportregarding CPLs [97].
1.4.4 Paper D: Maintenance and return on investment
Paper D, presented in Chapter 5, is titled “Maintenance of Automated TestSuites in Industry: An Empirical study on Visual GUI Testing”. The paperpresents a multiple, holistic, case study with results from the two companiesSaab AB in Vaxsjo and Siemens Medical.
Research Objective: The objective of the study was to evaluate themaintenance costs associated with VGT scripts. Hence, results essential tosupport the feasibility of the use of VGT in industrial practice.
Methodology: The study was divided into two phases performed at SiemensMedical and Saab AB that were chosen through convenient sampling sincecompanies that have used VGT for a longer period of time are rare.
Phase 1 was exploratory where three semi-structured interviews were per-formed to elicit practitioners’ perceptions about VGT, VGT maintenance andexperienced CPLs. At the time of the study, Siemens Medical had transitioned100 out of 500 manual test cases into VGT with the VGT tool JAutomate [67]for the purpose of lowering the costs associated with manual scenario-basedtesting and to raise the quality of one of the company’s systems.
In Phase 2, an empirical study was performed at Saab AB where a de-graded [16] VGT suite was maintained by a researcher and a developer in twosteps. First, the VGT suite was maintained for another version of the SUTwhich gave insights into the worst case maintenance costs of VGT suites. Sec-ond, the maintained VGT suite was migrated to a close variant to the SUTwhich gave insights into the costs of frequent maintenance of VGT suites. Fif-teen (15) representative test scripts were maintained in total during the study,where representativeness was determined through analysis of the VGT suiteand manual test specifications for the SUT. During the maintenance, measure-ments were taken on maintenance time per script, division of maintenance ofimages and script logic, number of found defects and script execution time.These measurements were then compared statistically to evaluate:
1. The difference in maintenance costs of frequent and infrequent mainte-nance.
2. The difference in maintenance costs of images and scripts, and
3. The difference between VGT development and maintenance costs,
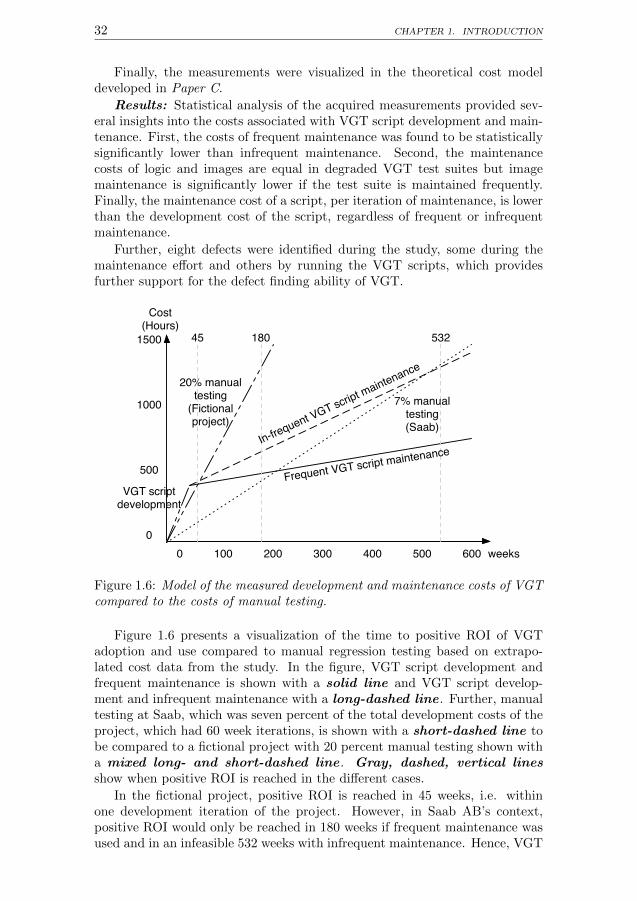
32 CHAPTER 1. INTRODUCTION
Finally, the measurements were visualized in the theoretical cost modeldeveloped in Paper C.
Results: Statistical analysis of the acquired measurements provided sev-eral insights into the costs associated with VGT script development and main-tenance. First, the costs of frequent maintenance was found to be statisticallysignificantly lower than infrequent maintenance. Second, the maintenancecosts of logic and images are equal in degraded VGT test suites but imagemaintenance is significantly lower if the test suite is maintained frequently.Finally, the maintenance cost of a script, per iteration of maintenance, is lowerthan the development cost of the script, regardless of frequent or infrequentmaintenance.
Further, eight defects were identified during the study, some during themaintenance effort and others by running the VGT scripts, which providesfurther support for the defect finding ability of VGT.
0 100 200 300 400 500 600
1500
1000
500
0
20% manualtesting
(Fictional project)
7% manualtesting(Saab)
In-frequent VGT script maintenance
Frequent VGT script maintenance
45 180 532
weeks
Cost(Hours)
VGT scriptdevelopment
Figure 1.6: Model of the measured development and maintenance costs of VGTcompared to the costs of manual testing.
Figure 1.6 presents a visualization of the time to positive ROI of VGTadoption and use compared to manual regression testing based on extrapo-lated cost data from the study. In the figure, VGT script development andfrequent maintenance is shown with a solid line and VGT script develop-ment and infrequent maintenance with a long-dashed line . Further, manualtesting at Saab, which was seven percent of the total development costs of theproject, which had 60 week iterations, is shown with a short-dashed line tobe compared to a fictional project with 20 percent manual testing shown witha mixed long- and short-dashed line . Gray, dashed, vertical linesshow when positive ROI is reached in the different cases.
In the fictional project, positive ROI is reached in 45 weeks, i.e. withinone development iteration of the project. However, in Saab AB’s context,positive ROI would only be reached in 180 weeks if frequent maintenance wasused and in an infeasible 532 weeks with infrequent maintenance. Hence, VGT
1.4. OVERVIEW OF PUBLICATIONS 33
script maintenance is feasible but a VGT suite requires frequent maintenance ifpositive ROI is to be reached in a reasonable amount of time. Additionally, thetime to positive ROI is dependent on the amount of manual testing performedin a project, i.e. in a project with more manual testing, positive ROI is reachedfaster. These results were supported by the interviews at Siemens Medical(Phase 1) where VGT script maintenance was associated with substantial costand required effort, i.e. up to 60 percent of the time spent on VGT each week.However, despite these challenges, the technique was still considered beneficial,valuable and mostly feasibly by the practitioners.
Contributions: The main contributions of this study are as such:
CD1: That maintenance of VGT scripts is feasible in practice, shown boththrough qualitative and quantitative results from two companies withtwo different VGT tools,
CD2: That maintenance of a VGT script:
(a) when performed frequently is significantly less costly than whenperformed infrequently,
(b) is significantly less costly per iteration of maintenance than devel-opment, and
(c) images are significantly less costly than maintenance of script logic.
CD3: That VGT scripts provide value to industrial practice, shown both withqualitative statements from practitioners and the technique’s defect find-ing ability where eight defects were found using the technique, and
CD4: A ROI cost model based on actual data from industrial practice thatverifies that this theoretical cost model is valid for automated test adop-tion and maintenance.
Hence, VGT can be feasible in practice but additional research was stillwarranted after the study to verify these results after long-term (years) use ofVGT in practice.
1.4.5 Paper E: Long-term use
Paper E, presented in Chapter 6, is titled “On the Long-term Use of VisualGUI Testing in Industrial Practice: A Case Study”. The paper presents asingle, embedded, case study with results from the company Spotify.
Research Objective: The objective of the study was to evaluate thelong-term use of VGT in industrial practice, including short- and long-termchallenges, problems and limitations (CPLs) and script maintenance costs. Asecondary objective was to evaluate what alternative techniques that are usedto VGT and to evaluate their benefits and drawbacks.
Methodology: The study was divided into three steps where Step 1 wasa pre-study, at Spotify, to acquire information about the company’s use ofVGT, willingness to participate in the study and what people to interview inthe study (acquired through snowballing sampling [98]), etc.
In Step 2, four interviews were conducted with five employees at Spotifythat had detailed knowledge about how VGT and alternative automated test
34 CHAPTER 1. INTRODUCTION
techniques were used at the company. Additionally, the interviews were com-plemented with two workshops, one exploratory in the beginning of the studyand one with one person to verify previously collected results and to identifythe company’s future plans for VGT.
Finally, VGT was statistically compared to an alternative test techniquedeveloped by Spotify (the Test Interface) based on properties acquired in theinterviews that were quantified based on the techniques’ stated benefits anddrawbacks.
Results: VGT was adopted at Spotify after an attempt to embed inter-faces for GUI testing (the Test interface) into the company’s main applicationhad failed due to lack of developer mandate and high costs. Further, be-cause the application lacked the prerequisites of most other test automationframeworks, VGT became the only option. VGT was adopted with the toolSikuli [54] and its success could be accounted to three factors:
1. The use of an incremental adoption process that began with a pilotproject,
2. The use of best engineering practices to create scripts, and
3. The use of a dedicated adoption team.
Several benefits were observed with VGT, such as value in terms of foundregression defects, robust script execution in terms of reported false test results,feasible script maintenance costs in most projects, support for testing of therelease ready product, support for integration of external applications withoutcode access into the tests, etc. Additionally, VGT integrated well with theopen source model-based testing tool Graphwalker for model-based Visual GUITesting (MBVGT). MBVGT made reuse and maintenance of scripts more cost-effective.
However, several drawbacks were also reported, such as costly maintenanceof images in scripts, inability to test non-deterministic data from databases,limited applicability to run tests on mobile devices, etc. Because of these draw-backs, Spotify abandoned VGT in several projects in favor of the originallyenvisioned “Test interface” solution which became realizable after the adop-tion of VGT due to VGT’s impact on the company’s testing culture. Hence,VGT had shown the benefits of automation which gave developers mandateto adopt more automation and create the Test interface. These interfacesare instrumented by Graphwalker models that use the interfaces in the sourcecode to collect state information from the application’s GUI components thatis then used to assert the application’s behavior. This approach is beneficialsince it notifies the developer if an interface is broken when the application iscompiled, which ensures that the test suites are always maintained.
Additionally, the Test interface has several benefits over VGT, such asbetter support for certain test objectives (e.g. tests with non-deterministicdata), faster and more robust test execution, etc. However, the Test interfacealso has drawbacks, such as inability to verify that the pictorial GUI conformsto the application’s specification, inability to perform interactions equal to ahuman user, required manual synchronization between application and scripts,lack of support for audio output testing, etc.

1.4. OVERVIEW OF PUBLICATIONS 35
Analysis based on quantification of these properties, i.e. benefits and draw-backs, also showed that there is significant difference between VGT and theTest interface. Hence, the techniques have divergent properties that make themore or less suitable in different contexts.
Finally, based on the study’s results, results from Papers B and C and re-lated work [99], a set of 14 guidelines were synthesized to provide practitionerswith decision support and guidance to avoid pitfalls during adoption, use andlong-term use of VGT in practice.
Contributions: The main contributions of this paper are that:
CE1: VGT can be used long-term in industrial practice, as shown by Spotify’suse of Sikuli for many years,
CE2: VGT has several benefits, including its flexible use that allows it tointegrate external applications into the tests and test products ready forcustomer delivery,
CE3: VGT has many challenges, including robustness issues, possibly due tothe immaturity of the technique’s tools,
CE4: There are alternatives to VGT in practice with benefits such as higherrobustness but with drawbacks that they do not verify that the pictorialGUI conforms to the system’s specification, etc.
CE5: A set of 14 guidelines to support the adoption, use and long-term use ofVGT in industrial practice.
The study thereby complements the missing results from Paper D regardingthe long-term feasibility of VGT in practice.
1.4.6 Paper F: VGT-GUITAR
Paper F, presented in Chapter 7, is titled “Conceptualization and Evaluationof Component-based Testing Unified with Visual GUI Testing: an EmpiricalStudy”. The paper presents a combined study with an experiment and a casestudy performed in an academic setting.
Research Objective: The objective of the study was to compare thedifferences in fault-finding ability of 2nd and 3rd generation (VGT) tools withrespect to false test results for system and acceptance tests. A secondaryobjective was to combine the tool GUITAR with Sikuli into a hybrid toolcalled VGT-GUITAR and evaluate the two tools’ capabilities on open sourcesoftware.
VGT-GUITAR: VGT-GUITAR is an experimental tool that was devel-oped based on the tool GUITAR’s GUI ripping and MBT functionality [58],explained in Section 1.2.3. VGT-GUITAR extends GUITAR’s ripper withbitmap ripping to acquire screenshots of the SUT’s GUI components. Thesescreenshots are then used during replay of test cases, generated by GUITAR,in a VGT driver (a Sikuli script) to interact with the SUT’s pictorial GUIrather than by hooking into the SUT. For additional detail about the tool, seeChapter 7.
Methodology: The study began with an experiment where a custom builtGUI-based application was mutated using GUI mutation operators, defined
36 CHAPTER 1. INTRODUCTION
during the study, to create 18 faulty versions of the application. A test suitewas then generated for the original version of the application that was executedwith GUITAR and VGT-GUITAR (Independent variable) on each mutant tomeasure the number of correctly identified mutants, false positives and falsenegative test results (Dependent variables). The dependent variables were thenanalyzed to compare the two techniques in terms of reported false positivesand negatives for system and acceptance tests, where system tests evaluatedthe SUT’s behavior whilst acceptance tests also took the SUT’s appearanceinto account. In addition the execution time of the scripts in the two toolswere recorded and compared.
The study was concluded with a case study where GUITAR and VGT-GUITAR were applied on three open source applications to identify supportfor the tools’ industrial applicability.
Results: Statistical analysis of the experiment’s results showed that 3rd
generation scripts report statistically significantly more false positives for sys-tem tests than 2nd generation tools and that 2nd generation tools report sta-tistically significantly more false negative results for acceptance tests. Theseresults could be explain by observations of the scripts’ behavior on differentmutants and relate to how the two techniques stimulate and assert the SUT’sbehavior, i.e. through hooks into the SUT or by image recognition. As anexample, if the GUI’s appearance was changed such that a human could stillinteract with it, e.g. by making a button larger, the 3rd generation scriptswould report a false positive result since the image recognition would fail.However, the 2nd generation scripts would pass since the hook to the buttonstill remained. In contrast, if the GUI’s appearance was changed such thata human could not interact with it, e.g. by making a button invisible, the2nd generation scripts would produce a false negative since the hook allowedthe script to interact with the invisible button. However, the 3rd generationscripts would successfully fail because the image recognition would not find amatch. The results of the experiment therefore indicate that a combination ofthe 2nd and 3rd generation techniques could be the most beneficial because oftheir complementary behavior for system and acceptance tests.
The proceeding case study did however show that VGT-GUITAR is notapplicable in industrial practice since the tool had zero percent success rateon any of the open source applications, caused by technical limitations in thetool, e.g. in reality it could not capture screenshots of all GUI components.Additionally, the test cases were generated for GUITAR that can, for instance,interact with a menu item without expanding the menu, i.e. functionalitythat is not supported by 3rd generation tools. Hence, further development isrequired to make VGT-GUITAR applicable in practice but the tool still showsproof-of-concept for fully automated 3rd generation GUI-based testing due toits successful use for the simpler application in the experiment.
Contributions: This study thereby provides the following main contri-butions:
CF1: Comparative results regarding the fault-finding ability of 2nd and 3rd
generation GUI-based tools in terms of false test results for system andacceptance tests.
CF2: Initial support that a completely automated 3rd generation test tool
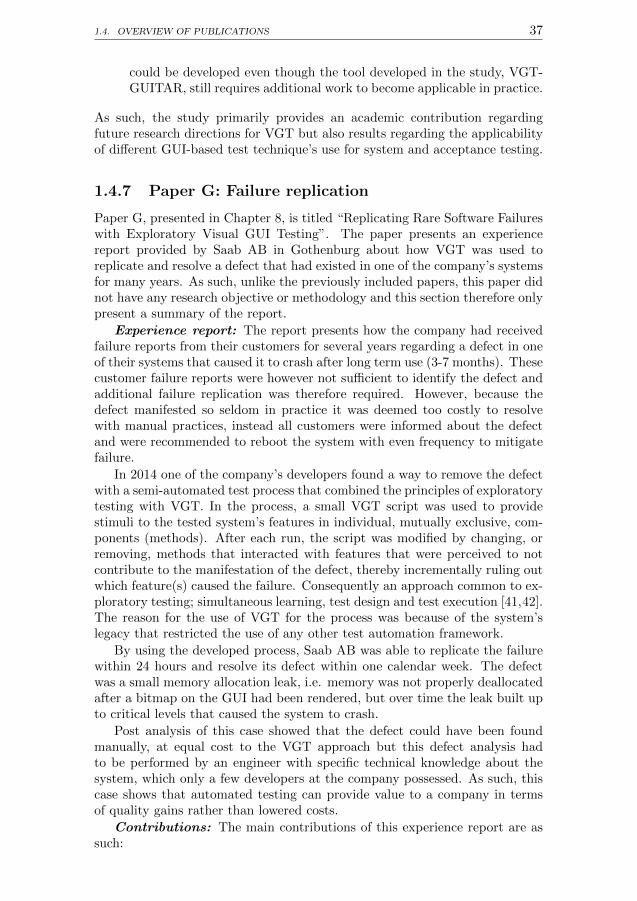
1.4. OVERVIEW OF PUBLICATIONS 37
could be developed even though the tool developed in the study, VGT-GUITAR, still requires additional work to become applicable in practice.
As such, the study primarily provides an academic contribution regardingfuture research directions for VGT but also results regarding the applicabilityof different GUI-based test technique’s use for system and acceptance testing.
1.4.7 Paper G: Failure replication
Paper G, presented in Chapter 8, is titled “Replicating Rare Software Failureswith Exploratory Visual GUI Testing”. The paper presents an experiencereport provided by Saab AB in Gothenburg about how VGT was used toreplicate and resolve a defect that had existed in one of the company’s systemsfor many years. As such, unlike the previously included papers, this paper didnot have any research objective or methodology and this section therefore onlypresent a summary of the report.
Experience report: The report presents how the company had receivedfailure reports from their customers for several years regarding a defect in oneof their systems that caused it to crash after long term use (3-7 months). Thesecustomer failure reports were however not sufficient to identify the defect andadditional failure replication was therefore required. However, because thedefect manifested so seldom in practice it was deemed too costly to resolvewith manual practices, instead all customers were informed about the defectand were recommended to reboot the system with even frequency to mitigatefailure.
In 2014 one of the company’s developers found a way to remove the defectwith a semi-automated test process that combined the principles of exploratorytesting with VGT. In the process, a small VGT script was used to providestimuli to the tested system’s features in individual, mutually exclusive, com-ponents (methods). After each run, the script was modified by changing, orremoving, methods that interacted with features that were perceived to notcontribute to the manifestation of the defect, thereby incrementally ruling outwhich feature(s) caused the failure. Consequently an approach common to ex-ploratory testing; simultaneous learning, test design and test execution [41,42].The reason for the use of VGT for the process was because of the system’slegacy that restricted the use of any other test automation framework.
By using the developed process, Saab AB was able to replicate the failurewithin 24 hours and resolve its defect within one calendar week. The defectwas a small memory allocation leak, i.e. memory was not properly deallocatedafter a bitmap on the GUI had been rendered, but over time the leak built upto critical levels that caused the system to crash.
Post analysis of this case showed that the defect could have been foundmanually, at equal cost to the VGT approach but this defect analysis hadto be performed by an engineer with specific technical knowledge about thesystem, which only a few developers at the company possessed. As such, thiscase shows that automated testing can provide value to a company in termsof quality gains rather than lowered costs.
Contributions: The main contributions of this experience report are assuch:
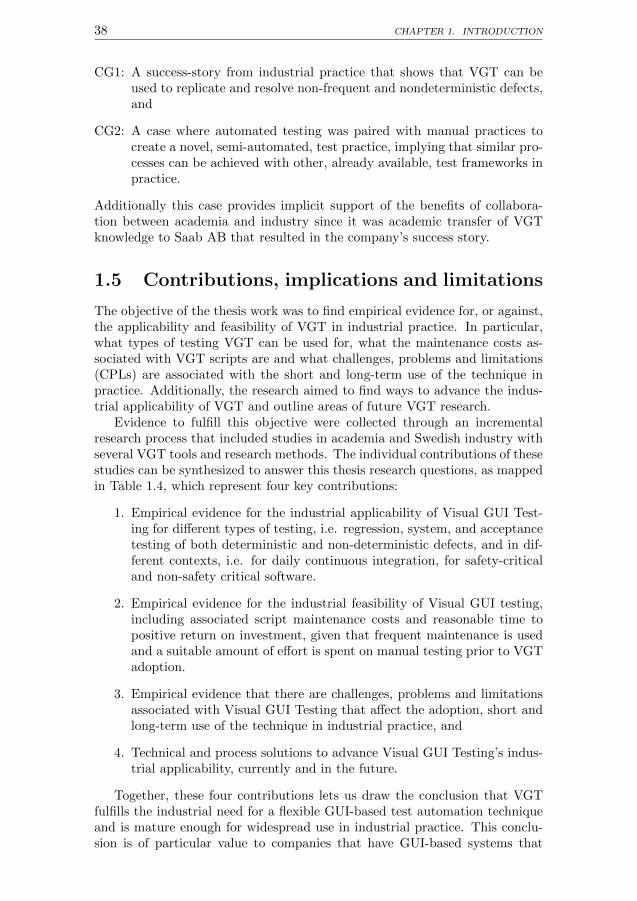
38 CHAPTER 1. INTRODUCTION
CG1: A success-story from industrial practice that shows that VGT can beused to replicate and resolve non-frequent and nondeterministic defects,and
CG2: A case where automated testing was paired with manual practices tocreate a novel, semi-automated, test practice, implying that similar pro-cesses can be achieved with other, already available, test frameworks inpractice.
Additionally this case provides implicit support of the benefits of collabora-tion between academia and industry since it was academic transfer of VGTknowledge to Saab AB that resulted in the company’s success story.
1.5 Contributions, implications and limitations
The objective of the thesis work was to find empirical evidence for, or against,the applicability and feasibility of VGT in industrial practice. In particular,what types of testing VGT can be used for, what the maintenance costs as-sociated with VGT scripts are and what challenges, problems and limitations(CPLs) are associated with the short and long-term use of the technique inpractice. Additionally, the research aimed to find ways to advance the indus-trial applicability of VGT and outline areas of future VGT research.
Evidence to fulfill this objective were collected through an incrementalresearch process that included studies in academia and Swedish industry withseveral VGT tools and research methods. The individual contributions of thesestudies can be synthesized to answer this thesis research questions, as mappedin Table 1.4, which represent four key contributions:
1. Empirical evidence for the industrial applicability of Visual GUI Test-ing for different types of testing, i.e. regression, system, and acceptancetesting of both deterministic and non-deterministic defects, and in dif-ferent contexts, i.e. for daily continuous integration, for safety-criticaland non-safety critical software.
2. Empirical evidence for the industrial feasibility of Visual GUI testing,including associated script maintenance costs and reasonable time topositive return on investment, given that frequent maintenance is usedand a suitable amount of effort is spent on manual testing prior to VGTadoption.
3. Empirical evidence that there are challenges, problems and limitationsassociated with Visual GUI Testing that affect the adoption, short andlong-term use of the technique in industrial practice, and
4. Technical and process solutions to advance Visual GUI Testing’s indus-trial applicability, currently and in the future.
Together, these four contributions lets us draw the conclusion that VGTfulfills the industrial need for a flexible GUI-based test automation techniqueand is mature enough for widespread use in industrial practice. This conclu-sion is of particular value to companies that have GUI-based systems that
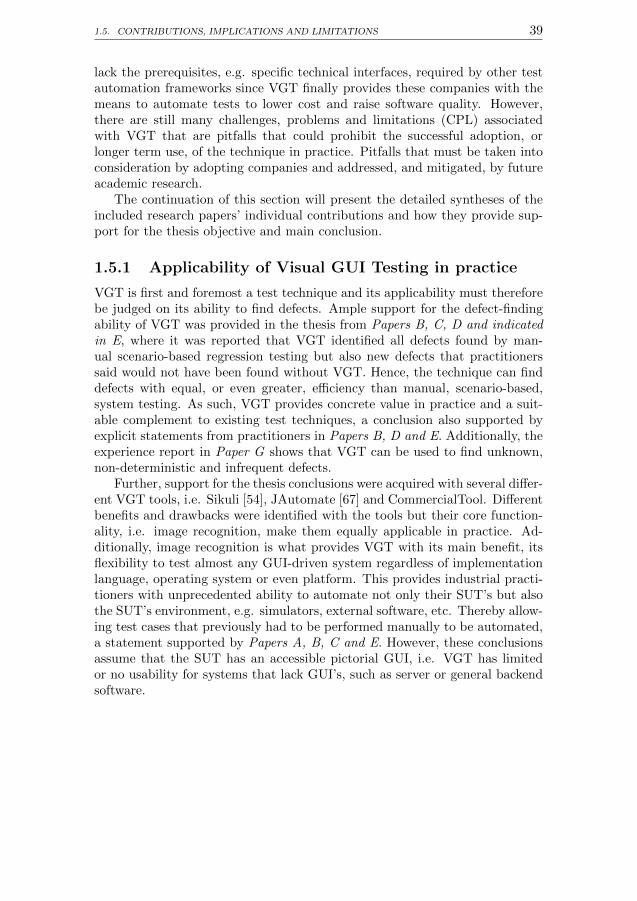
1.5. CONTRIBUTIONS, IMPLICATIONS AND LIMITATIONS 39
lack the prerequisites, e.g. specific technical interfaces, required by other testautomation frameworks since VGT finally provides these companies with themeans to automate tests to lower cost and raise software quality. However,there are still many challenges, problems and limitations (CPL) associatedwith VGT that are pitfalls that could prohibit the successful adoption, orlonger term use, of the technique in practice. Pitfalls that must be taken intoconsideration by adopting companies and addressed, and mitigated, by futureacademic research.
The continuation of this section will present the detailed syntheses of theincluded research papers’ individual contributions and how they provide sup-port for the thesis objective and main conclusion.
1.5.1 Applicability of Visual GUI Testing in practice
VGT is first and foremost a test technique and its applicability must thereforebe judged on its ability to find defects. Ample support for the defect-findingability of VGT was provided in the thesis from Papers B, C, D and indicatedin E, where it was reported that VGT identified all defects found by man-ual scenario-based regression testing but also new defects that practitionerssaid would not have been found without VGT. Hence, the technique can finddefects with equal, or even greater, efficiency than manual, scenario-based,system testing. As such, VGT provides concrete value in practice and a suit-able complement to existing test techniques, a conclusion also supported byexplicit statements from practitioners in Papers B, D and E. Additionally, theexperience report in Paper G shows that VGT can be used to find unknown,non-deterministic and infrequent defects.
Further, support for the thesis conclusions were acquired with several differ-ent VGT tools, i.e. Sikuli [54], JAutomate [67] and CommercialTool. Differentbenefits and drawbacks were identified with the tools but their core function-ality, i.e. image recognition, make them equally applicable in practice. Ad-ditionally, image recognition is what provides VGT with its main benefit, itsflexibility to test almost any GUI-driven system regardless of implementationlanguage, operating system or even platform. This provides industrial practi-tioners with unprecedented ability to automate not only their SUT’s but alsothe SUT’s environment, e.g. simulators, external software, etc. Thereby allow-ing test cases that previously had to be performed manually to be automated,a statement supported by Papers A, B, C and E. However, these conclusionsassume that the SUT has an accessible pictorial GUI, i.e. VGT has limitedor no usability for systems that lack GUI’s, such as server or general backendsoftware.
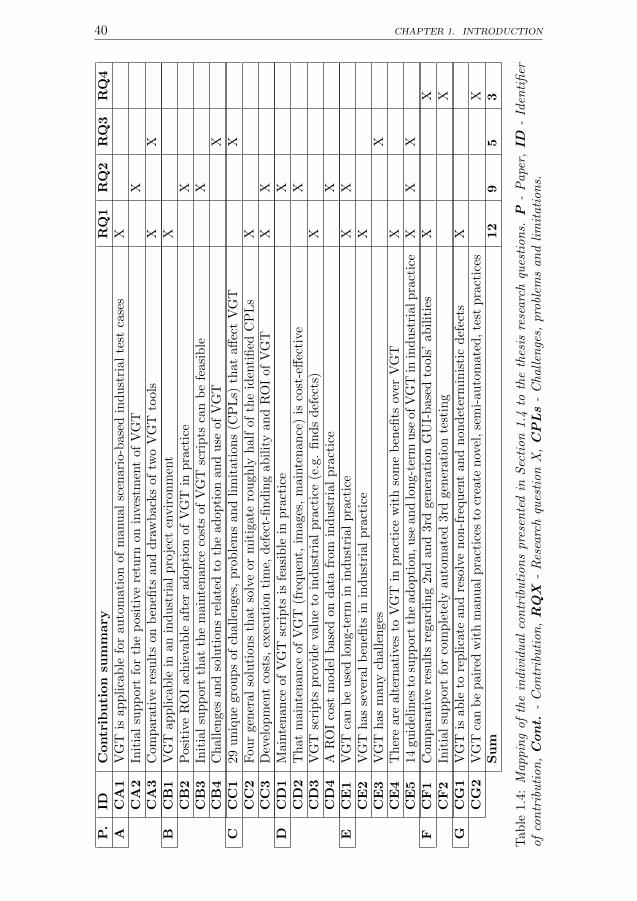
40 CHAPTER 1. INTRODUCTION
P.
IDC
ontr
ibu
tion
sum
mary
RQ
1R
Q2
RQ
3R
Q4
AC
A1
VG
Tis
app
lica
ble
for
au
tom
ati
on
of
manu
al
scen
ari
o-b
ase
din
du
stri
al
test
case
sX
CA
2In
itia
lsu
pp
ort
for
the
posi
tive
retu
rnon
inve
stm
ent
of
VG
TX
CA
3C
omp
arat
ive
resu
lts
on
ben
efits
an
dd
raw
back
sof
two
VG
Tto
ols
XX
BC
B1
VG
Tap
pli
cab
lein
an
ind
ust
rial
pro
ject
envir
on
men
tX
CB
2P
osit
ive
RO
Iach
ieva
ble
aft
erad
op
tion
of
VG
Tin
pra
ctic
eX
CB
3In
itia
lsu
pp
ort
that
the
main
ten
an
ceco
sts
of
VG
Tsc
rip
tsca
nb
efe
asi
ble
XC
B4
Ch
alle
nge
san
dso
luti
on
sre
late
dto
the
ad
op
tion
an
du
seof
VG
TX
CC
C1
29u
niq
ue
grou
ps
of
chall
enges
,p
rob
lem
san
dli
mit
ati
on
s(C
PL
s)th
at
aff
ect
VG
TX
CC
2F
our
gen
eral
solu
tion
sth
at
solv
eor
mit
igate
rou
gh
lyh
alf
of
the
iden
tifi
edC
PL
sX
CC
3D
evel
opm
ent
cost
s,ex
ecu
tion
tim
e,d
efec
t-fi
nd
ing
ab
ilit
yan
dR
OI
of
VG
TX
XD
CD
1M
ainte
nan
ceof
VG
Tsc
rip
tsis
feasi
ble
inp
ract
ice
XC
D2
Th
atm
ainte
nance
of
VG
T(f
requ
ent,
images
,m
ain
ten
an
ce)
isco
st-e
ffec
tive
XC
D3
VG
Tsc
rip
tsp
rovid
eva
lue
toin
du
stri
al
pra
ctic
e(e
.g.
fin
ds
def
ects
)X
CD
4A
RO
Ico
stm
od
elb
ase
don
data
from
ind
ust
rial
pra
ctic
eX
EC
E1
VG
Tca
nb
eu
sed
lon
g-t
erm
inin
du
stri
al
pra
ctic
eX
XC
E2
VG
Th
asse
vera
lb
enefi
tsin
ind
ust
rial
pra
ctic
eX
CE
3V
GT
has
man
ych
all
enges
XC
E4
Th
ere
are
alte
rnati
ves
toV
GT
inpra
ctic
ew
ith
som
eb
enefi
tsov
erV
GT
XC
E5
14gu
idel
ines
tosu
pp
ort
the
ad
op
tion
,u
sean
dlo
ng-t
erm
use
ofV
GT
inin
du
stri
alp
ract
ice
XX
XF
CF
1C
omp
arat
ive
resu
lts
regard
ing
2n
dan
d3rd
gen
erati
on
GU
I-b
ase
dto
ols
’ab
ilit
ies
XX
CF
2In
itia
lsu
pp
ort
for
com
ple
tely
au
tom
ate
d3rd
gen
erati
on
test
ing
XG
CG
1V
GT
isab
leto
rep
lica
tean
dre
solv
en
on
-fre
qu
ent
an
dn
ond
eter
min
isti
cd
efec
tsX
CG
2V
GT
can
be
pai
red
wit
hm
anu
alp
ract
ices
tocr
eate
nov
el,
sem
i-au
tom
ate
d,
test
pra
ctic
esX
Su
m12
95
3
Tab
le1.
4:M
appin
gof
the
indiv
idu
al
con
trib
uti
on
spre
sen
ted
inS
ecti
on
1.4
toth
eth
esis
rese
arc
hqu
esti
on
s.P
-P
ape
r,ID
-Id
enti
fier
of
con
trib
uti
on
,C
on
t.-
Con
trib
uti
on
,R
QX
-R
esea
rch
ques
tion
X,
CP
Ls
-C
hall
enge
s,pro
blem
san
dli
mit
ati
on
s.
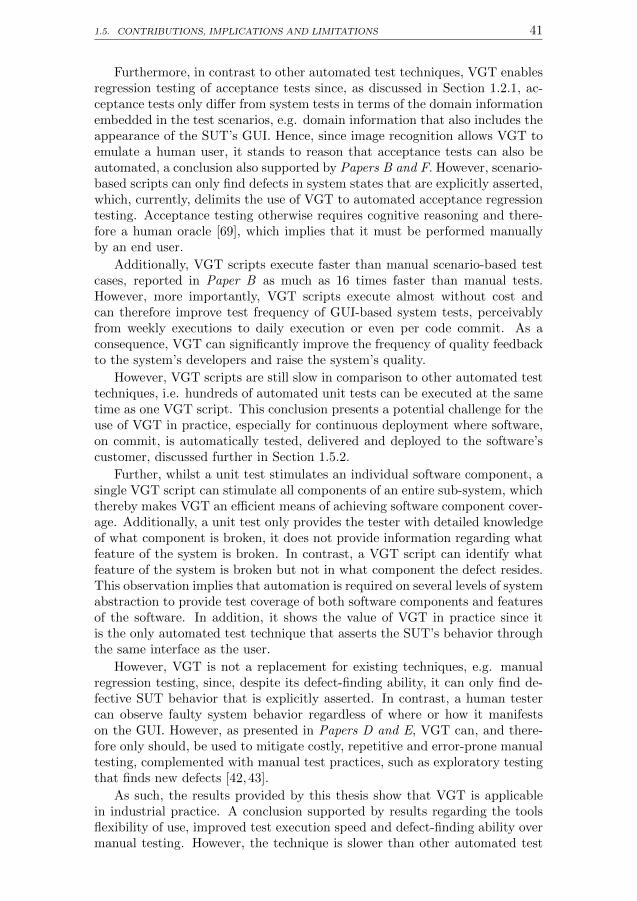
1.5. CONTRIBUTIONS, IMPLICATIONS AND LIMITATIONS 41
Furthermore, in contrast to other automated test techniques, VGT enablesregression testing of acceptance tests since, as discussed in Section 1.2.1, ac-ceptance tests only differ from system tests in terms of the domain informationembedded in the test scenarios, e.g. domain information that also includes theappearance of the SUT’s GUI. Hence, since image recognition allows VGT toemulate a human user, it stands to reason that acceptance tests can also beautomated, a conclusion also supported by Papers B and F. However, scenario-based scripts can only find defects in system states that are explicitly asserted,which, currently, delimits the use of VGT to automated acceptance regressiontesting. Acceptance testing otherwise requires cognitive reasoning and there-fore a human oracle [69], which implies that it must be performed manuallyby an end user.
Additionally, VGT scripts execute faster than manual scenario-based testcases, reported in Paper B as much as 16 times faster than manual tests.However, more importantly, VGT scripts execute almost without cost andcan therefore improve test frequency of GUI-based system tests, perceivablyfrom weekly executions to daily execution or even per code commit. As aconsequence, VGT can significantly improve the frequency of quality feedbackto the system’s developers and raise the system’s quality.
However, VGT scripts are still slow in comparison to other automated testtechniques, i.e. hundreds of automated unit tests can be executed at the sametime as one VGT script. This conclusion presents a potential challenge for theuse of VGT in practice, especially for continuous deployment where software,on commit, is automatically tested, delivered and deployed to the software’scustomer, discussed further in Section 1.5.2.
Further, whilst a unit test stimulates an individual software component, asingle VGT script can stimulate all components of an entire sub-system, whichthereby makes VGT an efficient means of achieving software component cover-age. Additionally, a unit test only provides the tester with detailed knowledgeof what component is broken, it does not provide information regarding whatfeature of the system is broken. In contrast, a VGT script can identify whatfeature of the system is broken but not in what component the defect resides.This observation implies that automation is required on several levels of systemabstraction to provide test coverage of both software components and featuresof the software. In addition, it shows the value of VGT in practice since itis the only automated test technique that asserts the SUT’s behavior throughthe same interface as the user.
However, VGT is not a replacement for existing techniques, e.g. manualregression testing, since, despite its defect-finding ability, it can only find de-fective SUT behavior that is explicitly asserted. In contrast, a human testercan observe faulty system behavior regardless of where or how it manifestson the GUI. However, as presented in Papers D and E, VGT can, and there-fore only should, be used to mitigate costly, repetitive and error-prone manualtesting, complemented with manual test practices, such as exploratory testingthat finds new defects [42,43].
As such, the results provided by this thesis show that VGT is applicablein industrial practice. A conclusion supported by results regarding the toolsflexibility of use, improved test execution speed and defect-finding ability overmanual testing. However, the technique is slower than other automated test

42 CHAPTER 1. INTRODUCTION
techniques, suffers from immature tooling and is suggested to report statis-tically significantly more false positives for system tests than 2nd generationGUI-based testing. VGT should therefore be complemented with other auto-mated test techniques to provide complete test coverage of a SUT, in particularin continuous delivery contexts.
1.5.2 Feasibility of Visual GUI Testing in practice
In order for VGT to be usable in practice it is not enough that it is applicable, italso needs to be feasible. Feasibility refers to the practical and cost-effective useof a technique over a longer period of time, which implies that the developmentand maintenance costs of scripts need to provide positive return on investment(ROI) compared to alternative testing practices, e.g. manual testing, overtime.
VGT is best compared to manual regression testing because both tech-niques fulfill the same test objective and use the same types of inputs andoutputs for SUT stimulation and assertion. Such a comparison is also valu-able since manual GUI-based testing is the only available alternative for manycompanies [100], e.g. due to SUT legacy or other missing prerequisites forother automated test techniques.
However, feasibility also involves test execution time since VGT is primarilyan automated regression testing technique which implies that VGT scriptsshould be executed frequently to provide fast feedback to developers, i.e. apractice that would be prohibited by too slow execution time.
Initial data on development costs and execution time of VGT scripts wereacquired in Papers A, B and C and were used in the respective papers to cal-culate time to positive ROI. However, these results were acquired for differentsized VGT suites and compared to varying manual test execution costs, whichmake them incomparable. Therefore the results were recalculated for the de-velopment, but not maintenance, of a fictional VGT suite of 100 test casesinstead of 10, 300 and 33 test cases reported in Papers A, B and C respec-tively. These fictional development costs were then compared to the averagetotal time spent on manual testing per iteration in the three cases (263 man-hours). Hence, in contrast to previous work where script development timewas compared to the cost of running the manual test suites. This comparisonthereby identifies how many times the VGT suite needs to be executed, af-ter development, to equal the amount of manual testing that could have beenperformed for the same cost, i.e. the number of executions that are requiredfor VGT adoption to provide positive ROI. Furthermore, the execution timeof each fictional test suite was calculated that gives insights into the frequencywith which the test suites can be executed in practice, i.e. hourly, daily or ononly an even less frequent basis. The inputs and results of these calculationsare presented in Table 1.5.
The table shows that the development costs of a VGT suite are consid-erable, i.e. in the order of hundreds of hours. However, once developed, theVGT suite provides positive ROI after 2.3 test suite executions, on average,compared to the total cost of manual testing with equivalent test cases.
Additionally, the table shows that the execution time of VGT suites can besignificant and we therefore conclude that execution of a full VGT suite does
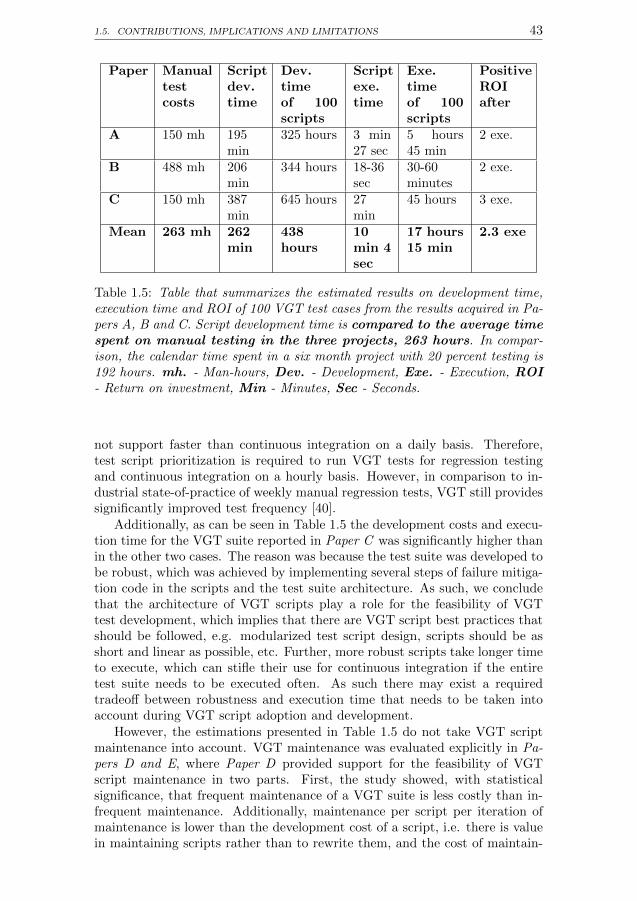
1.5. CONTRIBUTIONS, IMPLICATIONS AND LIMITATIONS 43
Paper Manualtestcosts
Scriptdev.time
Dev.timeof 100scripts
Scriptexe.time
Exe.timeof 100scripts
PositiveROIafter
A 150 mh 195min
325 hours 3 min27 sec
5 hours45 min
2 exe.
B 488 mh 206min
344 hours 18-36sec
30-60minutes
2 exe.
C 150 mh 387min
645 hours 27min
45 hours 3 exe.
Mean 263 mh 262min
438hours
10min 4sec
17 hours15 min
2.3 exe
Table 1.5: Table that summarizes the estimated results on development time,execution time and ROI of 100 VGT test cases from the results acquired in Pa-pers A, B and C. Script development time is compared to the average timespent on manual testing in the three projects, 263 hours. In compar-ison, the calendar time spent in a six month project with 20 percent testing is192 hours. mh. - Man-hours, Dev. - Development, Exe. - Execution, ROI- Return on investment, Min - Minutes, Sec - Seconds.
not support faster than continuous integration on a daily basis. Therefore,test script prioritization is required to run VGT tests for regression testingand continuous integration on a hourly basis. However, in comparison to in-dustrial state-of-practice of weekly manual regression tests, VGT still providessignificantly improved test frequency [40].
Additionally, as can be seen in Table 1.5 the development costs and execu-tion time for the VGT suite reported in Paper C was significantly higher thanin the other two cases. The reason was because the test suite was developed tobe robust, which was achieved by implementing several steps of failure mitiga-tion code in the scripts and the test suite architecture. As such, we concludethat the architecture of VGT scripts play a role for the feasibility of VGTtest development, which implies that there are VGT script best practices thatshould be followed, e.g. modularized test script design, scripts should be asshort and linear as possible, etc. Further, more robust scripts take longer timeto execute, which can stifle their use for continuous integration if the entiretest suite needs to be executed often. As such there may exist a requiredtradeoff between robustness and execution time that needs to be taken intoaccount during VGT script adoption and development.
However, the estimations presented in Table 1.5 do not take VGT scriptmaintenance into account. VGT maintenance was evaluated explicitly in Pa-pers D and E, where Paper D provided support for the feasibility of VGTscript maintenance in two parts. First, the study showed, with statisticalsignificance, that frequent maintenance of a VGT suite is less costly than in-frequent maintenance. Additionally, maintenance per script per iteration ofmaintenance is lower than the development cost of a script, i.e. there is valuein maintaining scripts rather than to rewrite them, and the cost of maintain-
44 CHAPTER 1. INTRODUCTION
ing images is lower than script logic. Second, the quantitative results werevisualized in a ROI cost model, presented in Section 1.4.4 in Figure 1.6. Theseresults indicate, in a best case, that the development and maintenance costs ofa VGT suite provides positive ROI within on development iteration, given thatat least 20 percent of the project’s cost is associated with manual testing andthat maintenance is performed frequently. However, if a company currentlyspends less time on manual testing and if scripts are maintained infrequently,the time to positive ROI could be several years, in Saab AB’s case 532 weeks(or over 10 years).
Consequently, successful long-term use of VGT has several prerequisites.First, VGT needs to be integrated into the company’s development and testprocess and the company’s organization needs to be adopted to the changedprocess, e.g. to facilitate the need for frequent maintenance. Second, thedeveloped VGT suite should follow engineering best practice, i.e. be basedon a modularized architecture, have suitable amounts of failure mitigation,etc [40]. Further, test scripts shall be kept as short and linear as possible tomitigate script complexity, which is also mitigated by coding standards thatimprove script readability. Third, test automation should first, and foremost,be performed of stable test cases since this practice mitigates unnecessarymaintenance costs and aligns with the techniques’ primary purpose to per-form regression testing. Additional factors were reported in Paper D, somethat are common to other automated test techniques, but it is unknown howcomprehensive this set of factors is and future research is therefore requiredto expand this set.
In summary we conclude that VGT is feasible in industrial practice withdevelopment and maintenance costs that are significant, yet manageable andprovide positive return on investment. However, there are still challengesassociated with the maintenance of VGT scripts that require suitable practices,organizational change as well as technical support, to be mitigated.
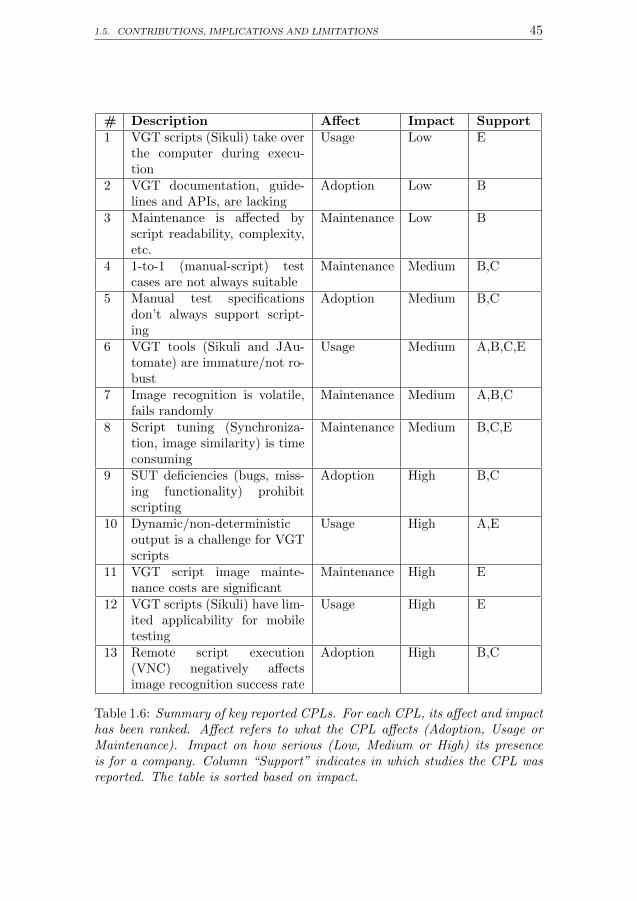
1.5. CONTRIBUTIONS, IMPLICATIONS AND LIMITATIONS 45
# Description Affect Impact Support1 VGT scripts (Sikuli) take over
the computer during execu-tion
Usage Low E
2 VGT documentation, guide-lines and APIs, are lacking
Adoption Low B
3 Maintenance is affected byscript readability, complexity,etc.
Maintenance Low B
4 1-to-1 (manual-script) testcases are not always suitable
Maintenance Medium B,C
5 Manual test specificationsdon’t always support script-ing
Adoption Medium B,C
6 VGT tools (Sikuli and JAu-tomate) are immature/not ro-bust
Usage Medium A,B,C,E
7 Image recognition is volatile,fails randomly
Maintenance Medium A,B,C
8 Script tuning (Synchroniza-tion, image similarity) is timeconsuming
Maintenance Medium B,C,E
9 SUT deficiencies (bugs, miss-ing functionality) prohibitscripting
Adoption High B,C
10 Dynamic/non-deterministicoutput is a challenge for VGTscripts
Usage High A,E
11 VGT script image mainte-nance costs are significant
Maintenance High E
12 VGT scripts (Sikuli) have lim-ited applicability for mobiletesting
Usage High E
13 Remote script execution(VNC) negatively affectsimage recognition success rate
Adoption High B,C
Table 1.6: Summary of key reported CPLs. For each CPL, its affect and impacthas been ranked. Affect refers to what the CPL affects (Adoption, Usage orMaintenance). Impact on how serious (Low, Medium or High) its presenceis for a company. Column “Support” indicates in which studies the CPL wasreported. The table is sorted based on impact.

46 CHAPTER 1. INTRODUCTION
Ph
ase
#G
uid
eli
ne
Desc
rip
tion
Ad
op
tion
1M
an
age
exp
ecta
tion
sIt
isn
ot
suit
able
/p
oss
ible
toau
tom
ate
anyth
ing
an
dev
eryth
ing
wit
hV
GT
,co
nsi
der
wh
at
isau
tom
ate
dan
dw
hy?
2In
cre
menta
ladop
tion
Ast
aged
ad
op
tion
pro
cess
that
incr
emen
tall
yev
alu
ate
sth
eva
lue
of
VG
Tis
suit
ab
leto
min
imiz
eco
stif
the
tech
niq
ue
isfo
un
du
nsu
itab
le.
3U
sea
ded
icate
dte
am
Ad
edic
ate
dte
am
can
iden
tify
how
/w
hen
/w
hy
tou
seV
GT
.4
Use
good
en
gin
eeri
ng
VG
Tco
sts
dep
end
on
the
arc
hit
ectu
reof
test
s/te
stsu
ites
an
den
gin
eeri
ng
bes
tp
ract
ices
shou
ldth
eref
ore
be
use
d,
e.g.
mod
ula
riza
tion
.5
Con
sid
er
use
dso
ftw
are
Diff
eren
tso
ftw
are
solu
tions,
e.g.
VG
Tto
ols
an
dth
ird
part
yso
ftw
are
,sh
ou
ldb
eev
alu
-ate
dto
fin
dth
eb
est
solu
tion
for
the
com
pany’s
nee
ds.
Use
6C
han
ge
role
sV
GT
can
requ
ire
new
role
sto
be
train
ed,
wh
ich
isass
oci
ate
dw
ith
ad
dit
ion
al
cost
.7
Develo
pm
ent
pro
cess
VG
Tsh
ou
ldb
ein
tegra
ted
into
the
dev
elop
men
tp
roce
ss,
e.g.
defi
nit
ion
of
don
e,an
dth
eS
UT
’sb
uil
dp
roce
ss,
i.e.
au
tom
ati
cex
ecu
tion
.8
Org
an
izati
on
New
role
sre
qu
ire
org
an
izati
on
al
chan
ges
that
can
dis
rup
td
evel
op
men
tb
efore
the
new
way
sof
work
ing
sett
le.
9C
od
econventi
on
sC
od
eco
nven
tion
sh
elp
imp
rove
read
ab
ilit
yan
dm
ain
tain
ab
ilit
yof
the
scri
pts
.10
Min
imiz
ere
mote
test
sF
or
dis
trib
ute
dsy
stem
s,V
GT
scri
pts
shou
ldb
eru
nlo
call
yor
use
VG
Tto
ols
wit
hb
uil
tin
rem
ote
test
exec
uti
on
sup
port
Lon
g-t
erm
11
Fre
qu
ent
main
ten
an
ce
Th
ete
stp
roce
ssn
eed
sto
pre
vent
test
case
sd
egra
dati
on
tokee
pV
GT
main
ten
an
ceco
sts
feasi
ble
lon
g-t
erm
.12
Measu
reT
he
cost
san
dva
lue
of
VG
Tsh
ou
ldb
em
easu
red
toid
enti
fyim
pro
vem
ent
poss
ibil
itie
s,e.
g.
new
way
sof
wri
tin
gsc
rip
ts.
13
Vers
ion
contr
ol
scri
pts
Wh
enth
enu
mb
erof
SU
Tva
riants
gro
w,
sod
oth
ete
stsu
ites
an
dth
eysh
ou
ldth
eref
ore
be
vers
ion
contr
oll
edto
ensu
reS
UT
com
pati
bil
ity.
14
SU
Tli
fe-c
ycle
Posi
tive
retu
rnon
inve
stm
ent
of
VG
Tad
op
tion
occ
urs
aft
erat
least
one
iter
ati
on
,so
how
long
wil
lth
eS
UT
live
?
Tab
le1.
7:S
um
mary
of
guid
elin
esto
con
sider
du
rin
gth
eadopti
on
,u
seor
lon
g-te
rmu
seof
VG
Tin
indu
stri
al
pra
ctic
e.

1.5. CONTRIBUTIONS, IMPLICATIONS AND LIMITATIONS 47
1.5.3 Challenges, problems and limitations with VisualGUI Testing in practice
Sections 1.5.1 and 1.5.2 showed that VGT is applicable and feasible in indus-trial practice but also mentioned challenges, problems and limitations (CPLs)with the technique. These CPLs were primarily acquired in Papers B, C andE and have been summarized in Table 1.6. In the table, each CPL has beenclassified based on what phase of VGT it affects the most, i.e. adoption, e.g.adoption, implementation or creation of test scripts, usage, e.g. running thetests or using the tests for specific test purposes or SUTs and maintenance, e.g.script maintenance or long-term use of VGT in a project. Further, the impactof each CPL is classified as low, medium or high, where low means that it isan annoyance but requires little or no mediation, medium means that it hasa negative effect that can be removed but requires mediation and high meansthat it has a negative effect but can only be mitigated, not removed, throughmediation. Mediation, in turn, implies change to a company’s procedures,organization, VGT scripts, SUT, etc.
Table 1.6 shows that many VGT CPLs relate to the technique’s or its tools’immaturity, e.g. lack of robustness of both image recognition and the toolsthemselves. As the technology matures these should be less of a problem.Further, contextual factors, such as the test environment, seems to play animportant role, e.g. scripting can be prohibited by poor manual test specifica-tions, external applications or defects in the SUT. These observations indicatean interplay between many factors and it is therefore unlikely that any one,or a simple, solution can be found to solve all the CPLs. Instead, as dis-cussed in Section 1.5.2, VGT requires process, organizational and technicalchanges to be applicable and feasible. Regardless, the results of this thesisshow that most CPLs can be solved or mitigated, as presented in Papers Band C. Consequently, no CPL was identified that prohibits the technique’s usein practice but several CPLs are considered more sever, e.g. the reported needfor substantial image maintenance in Paper E.
To provide practitioners with support to avoid these CPLs and the pitfallswith the VGT, Paper E presented a set of 14 guidelines for the adoption, useand long-term use of VGT in industrial practice. These guidelines are basedon best practices collected from all the studies presented in this thesis andhave been summarized in Table 1.7. However, this set of guidelines is notcomprehensive and future research is therefore required to expand this list.
Consequently, the results of this thesis show that there are many CPLs as-sociated with VGT that must be considered by industrial practitioners duringthe adoption, use or maintenance of VGT or VGT scripts. However, theseCPLs also provide an academic contribution regarding potential future re-search areas, i.e. future research to improve the technique’s applicability andfeasibility in practice.
1.5.4 Solutions to advance Visual GUI Testing
The conclusion that VGT is applicable and feasible in industrial practice opensup the possibility to also focus research on the advancement of the technique’suse in practice. Advances that were studied in two of the thesis included
48 CHAPTER 1. INTRODUCTION
papers, i.e. Papers F and G.
In Paper F, initial research was performed towards fully automated VGTby creating a proof-of-concept tool, VGT-GUITAR. VGT-GUITAR was shownnot to be applicable in practice due to technical limitations in the tool but thestudy outlines a foundation for flexible, automated, GUI-based, exploratorytesting, i.e. an approach that could have considerable impact in practice tolower test related costs and improve software quality. Additionally, this ap-proach could perceivably mitigate the development and image maintenancecosts of VGT through automated acquisition of images from the SUT. Hence,a technical advancement that would improve the applicability and feasibilityof the current VGT technique in practice.
Further, Paper G reported a novel test process for semi-automated faultreplication with VGT. The process combines the practices of exploratory test-ing with stimuli provided by a simple VGT script and advances VGT by show-ing its applicability for finding infrequent and non-deterministic defects. Inaddition, the process provides companies with a means of improving theirlong-term test practices since long-term tests are generally performed overweeks or months in practice but generally without SUT stimuli. VGT couldprovide such stimuli on the same level of abstraction as a human user andthereby improve the representativeness of the test results for actual use of theSUT in practice.
These individual contributions imply that VGT is applicable for more thanregression testing in practice, an observations that roots in its ability to emu-late end-use behavior. Further, these results imply that VGT can be used incontexts when the expected output can not be acquired as an oracle, instead,a more basic oracle, e.g. a crash oracle, can be used together with a humanoracle to find defects, as reported in Paper G. Paper F also indicates that ex-pected outputs can be automatically acquired through GUI ripping but futurework is required to develop and evaluate the theoretical foundation presentedin Paper F.
In summary, solutions already exist to advance the applicability of VGT,e.g. by combining VGT with human oracles in semi-automated test practicesor processes. Further, advances in tooling can, through future work, enablenew and more advanced types of automated GUI-based testing based on VGT.
1.5.5 Implications
This thesis presents results with implications for both industrial practice andacademia, e.g. decision support for practitioners and input for future academicresearch.
1.5.5.1 Implications for practice
The main implication of this thesis is that VGT can be adopted and used inindustrial practice, also over longer periods of time. This implies that compa-nies with test (or software) related problems such as lacking interfaces requiredby other test frameworks, e.g. due to SUT legacy, or high test related costs,etc., now have a viable option for test automation. Additionally, adoption ofVGT can help improve the test automation culture in a company, i.e. endorse
1.5. CONTRIBUTIONS, IMPLICATIONS AND LIMITATIONS 49
or mandate process, organizational or SUT changes that enable additional testautomation in a company, as reported in Paper E.
For companies that have test automation, VGT provides a complementto their existing testing toolbox. In particular, VGT can provide high-leveltest automation for companies that currently test only on lower levels of sys-tem abstraction. However, VGT is not a replacement for manual GUI-basedtesting, instead it provides a suitable complement to mitigate the need forrepetitive manual testing. This can reduce costs for the company by releasingresources, i.e. testers, which can instead focus on other types of testing, e.g.exploratory testing. Additionally, it may also raise the enjoyment of daily workfor the individual, i.e. the human tester or developer. Statements supportedby interview results from Papers B, D and E.
Further, because VGT scripts can run more frequently than manual tests,VGT can improve system quality [40]. This is an important implication of thiswork because it is not only of industrial benefit, but also of benefit to society,especially for safety-critical software systems, e.g. air-traffic management andmedical systems, since improved quality can imply higher safety.
Another implication is that defect identification of infrequent and non-deterministic defects, e.g. defects that only manifest after longer periods ofmanual system interaction, are no longer out of scope due to cost. This resultalso implies that companies can improve their long-term test practices withcontinuous, user-emulated, stimuli that improve the tests’ representativenessfor use of the system in practice, as shown in Paper G.
Consequently, VGT provides several benefits to industrial practice by im-proving companies’ test processes and thereby their software quality, improvedsoftware quality that benefits society as a whole.
1.5.5.2 Future research
This thesis provides fundamental support to the body of knowledge on VGTregarding the technique’s applicability and feasibility. As such, this researchpresents a stepping stone for future research to advance the technique andautomated testing in practice. In this section we have divided future researchinto five different tracks; fundamental, technical, process, psychological andrelated research, and discuss how each track could be pursued.
Fundamental : Fundamental future research on VGT regards additionalsupport for the conclusions of this thesis, e.g. studies in more companiesand contexts. The studies included in this thesis were performed with severalcompanies, VGT tools and domains but more work is required to strengthenthe body of knowledge of VGT and to ensure the generalizability of the results.Future work can also identify more CPLs and solutions to said CPLs as well asquantitative support for the long-term applicability of VGT. Hence, researchin more types of contexts, companies and for other types of systems, e.g. web-systems, but also longitudinal research that follows the entire VGT life cyclefrom adoption to use to long-term use of the technique.
Technical : Technical future research refers to technical advancement ofthe technique itself, its tools and the image recognition algorithms it is builton. These improvements could help mitigate the CPLs identified with VGT,e.g. the robustness of available VGT tools, image recognition algorithms as
50 CHAPTER 1. INTRODUCTION
well as costs associated with image maintenance.
In addition, this track refers to research into novel technical solutions basedon VGT such as completely automated VGT, as outlined by Paper F. Thisresearch could also help solve the image maintenance CPL associated withVGT, for instance through GUI ripping which would also allow VGT scriptsto easily be migrated between variants of a SUT, since, as reported in Paper E,test script logic can be reused between variants of an application but imagescannot.
Process: This track regards research into processes and practices to im-prove the adoption, use or maintenance of VGT, the importance of whichdiscussed in Papers D and E. For instance, adoption of VGT should be per-formed incrementally, developed test scripts should be short and linear, thetest suite should have a modularized architecture, etc. Paper E presenteda set of best practice guidelines for VGT but additional work is required tocreate a more comprehensive set and to evaluate the current ones validity andimpact in more companies and domains. This track also includes research intohow VGT should be incorporated with other test techniques and practices ina company, e.g. when and how to use VGT to lower cost and raise softwarequality. As discussed in Section 1.5.1, VGT can test that a SUT’s features areworking correctly but not where in the code a defect is, and VGT thereforeneeds to be complemented with testing on lower levels of system abstraction,especially for continuous delivery and deployment [45]. However, how to effi-ciently combine VGT with other automated test techniques is still a subjectof future research.
Consequently, this track primarily focuses on research into improving bestpractice guidelines for how VGT should be adopted and used in industrialpractice and in different contexts. In addition, this track includes developmentof novel practices and processes, as presented in Paper G, i.e. processes thatmake use of VGT for semi-automated testing.
Psychology : The thesis explored the enjoyment of using VGT in PapersB and D but enjoyment is only one factor that affect the use of a tool ortechnique in practice, other factors such as stress, motivation, etc. are alsoof interest. Hence, psychological factors that could affect practitioners’ per-ception of the technique and which could potentially be improved throughimproved tooling or practices. This research could also help answer why VGThas only seen moderate adoption in practice so far and why adoption of VGTseems to facilitate adoption of additional automation in a company as reportedin Paper E. Additionally, this research could provide further insights to guidethe research in the aforementioned fundamental and process oriented researchtracks, e.g. what factors to focus on to improve the technique’s applicabilityor feasibility in practice.
Related research: This track relates to generalization of the results ofthis thesis for other automated test techniques. For instance, this thesis re-ports several CPLs and solutions that are general to other automated testtechniques. However, future research is required to analyze if said solutionsare applicable for other test techniques in practice. Further, only a few solu-tions were reported for the CPLs, but it is possible that solutions that exist forother techniques can be migrated to solve VGT CPLs. Hence, cross-technicalmigration of solutions to common CPLs.
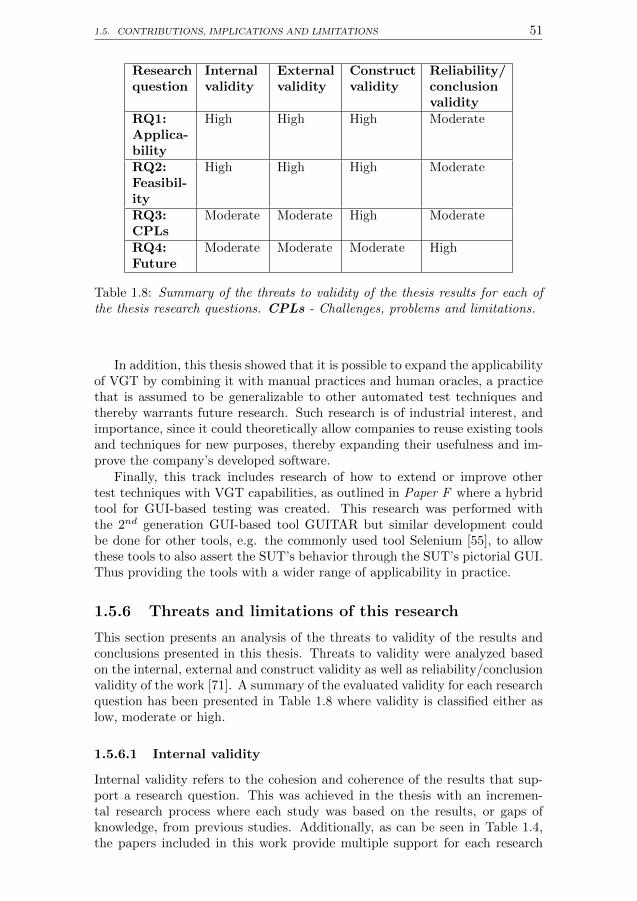
1.5. CONTRIBUTIONS, IMPLICATIONS AND LIMITATIONS 51
Researchquestion
Internalvalidity
Externalvalidity
Constructvalidity
Reliability/conclusionvalidity
RQ1:Applica-bility
High High High Moderate
RQ2:Feasibil-ity
High High High Moderate
RQ3:CPLs
Moderate Moderate High Moderate
RQ4:Future
Moderate Moderate Moderate High
Table 1.8: Summary of the threats to validity of the thesis results for each ofthe thesis research questions. CPLs - Challenges, problems and limitations.
In addition, this thesis showed that it is possible to expand the applicabilityof VGT by combining it with manual practices and human oracles, a practicethat is assumed to be generalizable to other automated test techniques andthereby warrants future research. Such research is of industrial interest, andimportance, since it could theoretically allow companies to reuse existing toolsand techniques for new purposes, thereby expanding their usefulness and im-prove the company’s developed software.
Finally, this track includes research of how to extend or improve othertest techniques with VGT capabilities, as outlined in Paper F where a hybridtool for GUI-based testing was created. This research was performed withthe 2nd generation GUI-based tool GUITAR but similar development couldbe done for other tools, e.g. the commonly used tool Selenium [55], to allowthese tools to also assert the SUT’s behavior through the SUT’s pictorial GUI.Thus providing the tools with a wider range of applicability in practice.
1.5.6 Threats and limitations of this research
This section presents an analysis of the threats to validity of the results andconclusions presented in this thesis. Threats to validity were analyzed basedon the internal, external and construct validity as well as reliability/conclusionvalidity of the work [71]. A summary of the evaluated validity for each researchquestion has been presented in Table 1.8 where validity is classified either aslow, moderate or high.
1.5.6.1 Internal validity
Internal validity refers to the cohesion and coherence of the results that sup-port a research question. This was achieved in the thesis with an incremen-tal research process where each study was based on the results, or gaps ofknowledge, from previous studies. Additionally, as can be seen in Table 1.4,the papers included in this work provide multiple support for each research
52 CHAPTER 1. INTRODUCTION
question and also results that complement each other. For instance, the quan-titative results regarding the feasibility of VGT (Papers B and D could betriangulated by statements from practitioners that had used the technique fora longer period of time (Papers D and E). Similar connections were found forresults that support the applicability, for instance regarding the technique’sdefect finding ability, both for regression testing (Papers B, C, D and E ) andfor infrequent/non-deterministic defects, (Paper F ). Therefore the internal va-lidity of the conclusions for research questions 1 and 2 are considered high.
However, the internal validity of identified CPLs is only considerate mod-erate because different, unique, CPLs were identified in different studies. Thisobservation implies that there could be additional CPLs that can emerge inother companies and domains.
Lastly, the internal validity regarding advances of VGT are also perceivedto be moderate because these results were only provided from two studies, i.e.Paper F and G, which had specific focuses that are perceived narrow comparedto the many possible advances to VGT as outlined in Section 1.5.5.2.
1.5.6.2 External validity
External validity refers to the generalizability of the results or conclusions forother contexts and domains. The external validity of the conclusions regard-ing the applicability and feasibility of VGT are considered high because theresults for these conclusions were acquired in different companies and withdifferent VGT tools. Additionally, the research results come from both com-panies developing safety-critical software as well as agile companies developingnon-safety-critical applications.
CPLs were acquired in the same contexts as the technique’s applicabilityand feasibility but many of the reported CPLs were context dependent and itis unknown how comprehensive the set of identified CPLs are. Therefore theexternal validity for this research question is only considered moderate. How-ever, the reported practitioner guidelines were triangulated with both studieson VGT in different contexts and domains as well as related research. As suchthe external validity of these guidelines is considered high, but more work isrequired to expand and evaluate this set of guidelines in the future.
Finally, for VGT advances, the external validity of the results are onlyconsidered moderate because the thesis only includes two studies, Papers Fand G, which provide insights into explicit advances of the technique and it istherefore unknown how valuable advances in these areas would be for differentindustrial contexts and domains.
1.5.6.3 Construct validity
Construct validity refers to the research context’s ability to provide valid re-sults to answer the study’s research questions. Most of the studies presentedin this thesis were conducted in industrial practice and they are therefore per-ceived to have provided results of high construct validity to research questions1, 2 and 3. However, research question 4, had less industrial support, onlyPaper G, whilst the other main contributor to the question, Paper F, was per-formed as an experiment in an academic setting with software applications,
1.6. THESIS SUMMARY 53
and tools, with limited representativeness for software in industrial practice.Therefore, the construct validity for question 4 is only considered moderate.
1.5.6.4 Reliability/conclusion validity
Reliability/conclusion validity refers to the ability to replicate the study withthe same results. The majority of the studies presented in this thesis were in-dustrial case studies which implies that none of these studies can be replicatedexactly. To mitigate this threat, the research methodology of each study hasbeen presented in detail, a practice that is perceived to allow the validity ofthe studies to be judged without replication, triangulate the studies’ resultsbetween the studies and replicate the studies in similar contexts. Further,an effort has been made in this thesis to outline the overall research processfor the thesis work. However, due to the lack of replicability, of the major-ity of the studies, the overall reliability/conclusion validity of this researchis considered moderate with the exception of the study presented in PaperF that presents an academic experiment that would be replicable by anotherresearcher provided the study’s research materials.
1.6 Thesis summary
The objective of this thesis was to find evidence for, or against, the indus-trial applicability and feasibility of Visual GUI Testing (VGT). This objectivewas motivated by the industrial need for a flexible technique to test softwaresystems at high levels of system abstraction to alleviate the need for manualtesting techniques that are often costly, tedious and error-prone.
The thesis work followed an incremental research methodology that beganwith exploratory studies to evaluate the applicability of VGT in practice. Theresearch proceeded with studies to explain the challenges, problems and limi-tations (CPLs) and maintenance costs associated with the technique and wasconcluded with a study to verify the previously collected results and acquireevidence for the long-term use of VGT in industrial practice. Lastly, potentialadvances of VGT were evaluated that also outlined new areas of research anddevelopment for, or based on, VGT.
The results of these studies show that VGT is applicable and feasible inindustrial practice, where applicability was supported by results on:
� Faster test execution speed and improved test frequency over manualtesting,
� Equal or greater defect finding ability than manual test cases,
� Ability to identify infrequent and non-deterministic defects that are toocostly to find manually,
� Ability to verify the conformance of a SUT’s behavior and appearancethrough the SUT’s pictorial GUI, and
� Flexibility of use for any system with a GUI regardless of implementationlanguage, operating system or platform.
54 CHAPTER 1. INTRODUCTION
In turn, the feasibility of the technique was supported by results on:
� Positive return on investment (ROI) of VGT adoption if frequent main-tenance is performed,
� Maintenance costs that per iteration of maintenance per script are sig-nificantly lower than the development cost per script,
� Script execution times that allow VGT to be used for daily continu-ous integration, development and delivery, which also contributes to theapplicability of VGT, and
� Results from industry that show its feasible use over many months oreven years.
However, acquisition of these results also uncovered many challenges, prob-lems and limitations associated with the technique, which include, but werenot limited to:
� Robustness problems associated with present-day VGT tools and theimage recognition algorithms they use,
� Substantial costs associated with maintenance of images,
� Required, costly to achieve, synchronization between scripts and SUTexecution, and
� Environmental factors that affect the adoption, use or maintenance ofVGT scripts, but also
� 14 practitioner oriented guidelines that serve to ease the adoption anduse of VGT in industrial practice.
However, none of the identified CPLs was perceived, in our studies, to prohibitthe use of VGT in industrial practice.
Because of the identified support for VGT, advances to the technique itselfwere also evaluated. First, by combining VGT with automated GUI com-ponent ripping, model-based testing and test case generation a more fullyautomated VGT approach was outlined. However, only initial results wereacquired but enough to warrant future research which could help mitigate thecosts of development and need for image maintenance reported from indus-trial practice. Second, an experience report from industry reported the useof VGT in a semi-automated exploratory process, which provides a broaderresearch contribution since it shows that automated tools and techniques canbe combined with manual practices to cover additional test objectives.
In summary, this thesis shows that VGT is applicable and feasible in in-dustrial practice with several benefits over manual testing. The thesis alsoprovides cost information and CPLs that are pitfalls that industrial practi-tioners must consider to make an informed decisions about VGT adoption. Assuch, this work provides a clear contribution for a wider industrial adoptionof Visual GUI Testing. In addition, the thesis advances the knowledge onGUI-based testing and outlines several important areas of future research.

Papers A – G not included in the online version.

Bibliography
[1] B. Hailpern and P. Santhanam, “Software debugging, testing, and veri-fication,” IBM Systems Journal, vol. 41, no. 1, pp. 4–12, 2002.
[2] M. Grechanik, Q. Xie, and C. Fu, “Maintaining and evolving GUI-directed test scripts,” in Software Engineering, 2009. ICSE 2009. IEEE31st International Conference on. IEEE, 2009, pp. 408–418.
[3] ——, “Creating GUI testing tools using accessibility technologies,”in Software Testing, Verification and Validation Workshops, 2009.ICSTW’09. International Conference on. IEEE, 2009, pp. 243–250.
[4] M. Finsterwalder, “Automating acceptance tests for GUI applications inan extreme programming environment,” in Proceedings of the 2nd Inter-national Conference on eXtreme Programming and Flexible Processes inSoftware Engineering. Citeseer, 2001, pp. 114–117.
[5] A. Leitner, I. Ciupa, B. Meyer, and M. Howard, “Reconciling manualand automated testing: The autotest experience,” in System Sciences,2007. HICSS 2007. 40th Annual Hawaii International Conference on.IEEE, 2007, pp. 261a–261a.
[6] A. Memon, “GUI testing: Pitfalls and process,” IEEE Computer, vol. 35,no. 8, pp. 87–88, 2002.
[7] E. Dustin, J. Rashka, and J. Paul, Automated software testing: intro-duction, management, and performance. Addison-Wesley Professional,1999.
[8] A. Onoma, W. Tsai, M. Poonawala, and H. Suganuma, “Regressiontesting in an industrial environment,” Communications of the ACM,vol. 41, no. 5, pp. 81–86, 1998.
[9] G. Rothermel, R. Untch, C. Chu, and M. Harrold, “Prioritizing testcases for regression testing,” Software Engineering, IEEE Transactionson, vol. 27, no. 10, pp. 929–948, 2001.
[10] M. Grechanik, Q. Xie, and C. Fu, “Experimental assessment of manualversus tool-based maintenance of GUI-directed test scripts,” in Soft-ware Maintenance, 2009. ICSM 2009. IEEE International Conferenceon. IEEE, 2009, pp. 9–18.
235

236 BIBLIOGRAPHY
[11] Y. Cheon and G. Leavens, “A simple and practical approach to unittesting: The JML and JUnit way,” ECOOP 2002Object-Oriented Pro-gramming, pp. 1789–1901, 2006.
[12] E. Sjosten-Andersson and L. Pareto, “Costs and Benefits of Structure-aware Capture/Replay tools,” SERPS06, p. 3, 2006.
[13] F. Zaraket, W. Masri, M. Adam, D. Hammoud, R. Hamzeh, R. Farhat,E. Khamissi, and J. Noujaim, “GUICOP: Specification-Based GUI Test-ing,” in Software Testing, Verification and Validation (ICST), 2012IEEE Fifth International Conference on. IEEE, 2012, pp. 747–751.
[14] M. Olan, “Unit testing: test early, test often,” Journal of ComputingSciences in Colleges, vol. 19, no. 2, pp. 319–328, 2003.
[15] E. Weyuker, “Testing component-based software: A cautionary tale,”Software, IEEE, vol. 15, no. 5, pp. 54–59, 1998.
[16] S. Berner, R. Weber, and R. Keller, “Observations and lessons learnedfrom automated testing,” in Proceedings of the 27th international con-ference on Software engineering. ACM, 2005, pp. 571–579.
[17] P. Runeson and M. Host, “Guidelines for conducting and reporting casestudy research in software engineering,” Empirical Software Engineering,vol. 14, no. 2, pp. 131–164, 2009.
[18] R. Potter, Triggers: GUIding automation with pixels to achieve dataaccess. University of Maryland, Center for Automation Research, Hu-man/Computer Interaction Laboratory, 1992, pp. 361–382.
[19] L. Zettlemoyer and R. St Amant, “A visual medium for programmaticcontrol of interactive applications,” in Proceedings of the SIGCHI con-ference on Human factors in computing systems: the CHI is the limit.ACM, 1999, pp. 199–206.
[20] T. Yeh, T. Chang, and R. Miller, “Sikuli: using GUI screenshots forsearch and automation,” in Proceedings of the 22nd annual ACM sym-posium on User interface software and technology. ACM, 2009, pp.183–192.
[21] B. A. Kitchenham, T. Dyba, and M. Jorgensen, “Evidence-based soft-ware engineering,” in Proceedings of the 26th international conferenceon software engineering. IEEE Computer Society, 2004, pp. 273–281.
[22] I. Sommerville, Software engineering, 6th ed. Addison-Wesley Profes-sional, 2000.
[23] M. Huo, J. Verner, L. Zhu, and M. A. Babar, “Software quality and agilemethods,” in Computer Software and Applications Conference, 2004.COMPSAC 2004. Proceedings of the 28th Annual International. IEEE,2004, pp. 520–525.
[24] J. Highsmith and A. Cockburn, “Agile software development: The busi-ness of innovation,” Computer, vol. 34, no. 9, pp. 120–127, 2001.
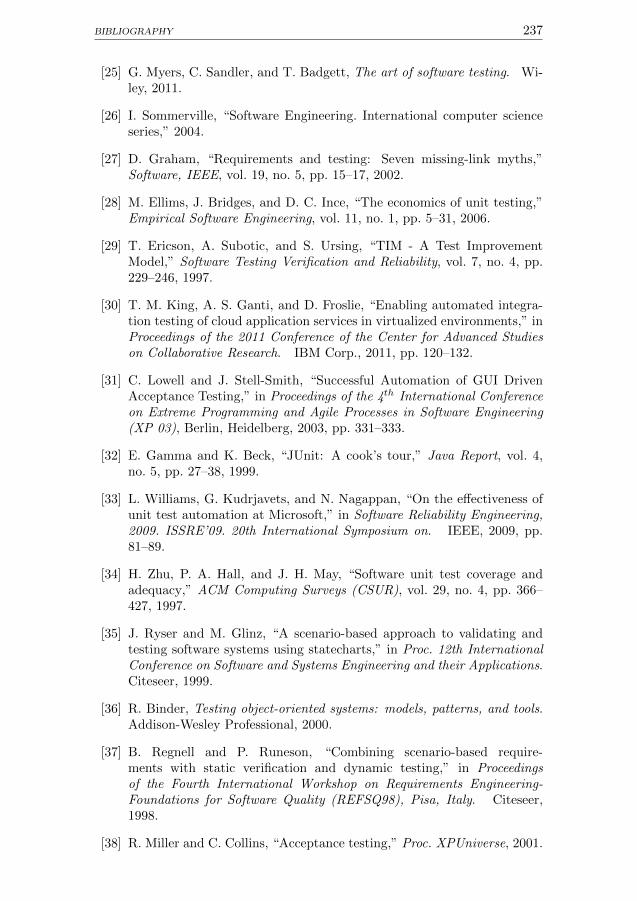
BIBLIOGRAPHY 237
[25] G. Myers, C. Sandler, and T. Badgett, The art of software testing. Wi-ley, 2011.
[26] I. Sommerville, “Software Engineering. International computer scienceseries,” 2004.
[27] D. Graham, “Requirements and testing: Seven missing-link myths,”Software, IEEE, vol. 19, no. 5, pp. 15–17, 2002.
[28] M. Ellims, J. Bridges, and D. C. Ince, “The economics of unit testing,”Empirical Software Engineering, vol. 11, no. 1, pp. 5–31, 2006.
[29] T. Ericson, A. Subotic, and S. Ursing, “TIM - A Test ImprovementModel,” Software Testing Verification and Reliability, vol. 7, no. 4, pp.229–246, 1997.
[30] T. M. King, A. S. Ganti, and D. Froslie, “Enabling automated integra-tion testing of cloud application services in virtualized environments,” inProceedings of the 2011 Conference of the Center for Advanced Studieson Collaborative Research. IBM Corp., 2011, pp. 120–132.
[31] C. Lowell and J. Stell-Smith, “Successful Automation of GUI DrivenAcceptance Testing,” in Proceedings of the 4th International Conferenceon Extreme Programming and Agile Processes in Software Engineering(XP 03), Berlin, Heidelberg, 2003, pp. 331–333.
[32] E. Gamma and K. Beck, “JUnit: A cook’s tour,” Java Report, vol. 4,no. 5, pp. 27–38, 1999.
[33] L. Williams, G. Kudrjavets, and N. Nagappan, “On the effectiveness ofunit test automation at Microsoft,” in Software Reliability Engineering,2009. ISSRE’09. 20th International Symposium on. IEEE, 2009, pp.81–89.
[34] H. Zhu, P. A. Hall, and J. H. May, “Software unit test coverage andadequacy,” ACM Computing Surveys (CSUR), vol. 29, no. 4, pp. 366–427, 1997.
[35] J. Ryser and M. Glinz, “A scenario-based approach to validating andtesting software systems using statecharts,” in Proc. 12th InternationalConference on Software and Systems Engineering and their Applications.Citeseer, 1999.
[36] R. Binder, Testing object-oriented systems: models, patterns, and tools.Addison-Wesley Professional, 2000.
[37] B. Regnell and P. Runeson, “Combining scenario-based require-ments with static verification and dynamic testing,” in Proceedingsof the Fourth International Workshop on Requirements Engineering-Foundations for Software Quality (REFSQ98), Pisa, Italy. Citeseer,1998.
[38] R. Miller and C. Collins, “Acceptance testing,” Proc. XPUniverse, 2001.
238 BIBLIOGRAPHY
[39] Q. Yang, J. J. Li, and D. M. Weiss, “A survey of coverage-based testingtools,” The Computer Journal, vol. 52, no. 5, pp. 589–597, 2009.
[40] D. M. Rafi, K. R. K. Moses, K. Petersen, and M. Mantyla, “Benefits andlimitations of automated software testing: Systematic literature reviewand practitioner survey,” in Automation of Software Test (AST), 20127th International Workshop on. IEEE, 2012, pp. 36–42.
[41] J. Itkonen, M. V. Mantyla, and C. Lassenius, “Defect detection effi-ciency: Test case based vs. exploratory testing,” in Empirical SoftwareEngineering and Measurement, 2007. ESEM 2007. First InternationalSymposium on. IEEE, 2007, pp. 61–70.
[42] J. Itkonen and K. Rautiainen, “Exploratory testing: a multiple casestudy,” in 2005 International Symposium on Empirical Software Engi-neering, 2005. IEEE, 2005, p. 10.
[43] W. Afzal, A. N. Ghazi, J. Itkonen, R. Torkar, A. Andrews, and K. Bhatti,“An experiment on the effectiveness and efficiency of exploratory test-ing,” Empirical Software Engineering, pp. 1–35, 2014.
[44] P. Schipani, “End User Involvement in Exploratory Test Automationfor Web Applications,” Ph.D. dissertation, TU Delft, Delft University ofTechnology, 2011.
[45] H. Holmstrom-Olsson, H. Alahyari, and J. Bosch, “Climbing the” Stair-way to Heaven”–A Mulitiple-Case Study Exploring Barriers in the Tran-sition from Agile Development towards Continuous Deployment of Soft-ware,” in Software Engineering and Advanced Applications (SEAA),2012 38th EUROMICRO Conference on. IEEE, 2012, pp. 392–399.
[46] M. Kim, T. Zimmermann, and N. Nagappan, “A field study of refactor-ing challenges and benefits,” in Proceedings of the ACM SIGSOFT 20thInternational Symposium on the Foundations of Software Engineering.ACM, 2012, p. 50.
[47] K. Beck, M. Beedle, A. Van Bennekum, A. Cockburn, W. Cunning-ham, M. Fowler, J. Grenning, J. Highsmith, A. Hunt, R. Jeffries et al.,“Manifesto for agile software development,” Software Engineering: APractitioner’s Approach, 2001.
[48] K. Beck and C. Andres, Extreme programming explained: embracechange. Addison-Wesley Professional, 2004.
[49] Z. A. Barmi, A. H. Ebrahimi, and R. Feldt, “Alignment of requirementsspecification and testing: A systematic mapping study,” in SoftwareTesting, Verification and Validation Workshops (ICSTW), 2011 IEEEFourth International Conference on. IEEE, 2011, pp. 476–485.
[50] E. Alegroth, R. Feldt, and L. Ryrholm, “Visual gui testing in practice:challenges, problemsand limitations,” Empirical Software Engineering,vol. 20, no. 3, pp. 694–744, 2014.
BIBLIOGRAPHY 239
[51] E. Alegroth, Z. Gao, R. Oliveira, and A. Memon, “Conceptualizationand Evaluation of Component-based Testing Unified with Visual GUITesting: an Empirical Study,” in Proceedings of the 8th IEEE Inter-national Conference on Software Testing, Verification and Validation(ICST 2015), Graz, 2015.
[52] E. Horowitz and Z. Singhera, “Graphical user interface testing,” Tech-nical report Us C-C S-93-5, vol. 4, no. 8, 1993.
[53] L. Gomez, I. Neamtiu, T. Azim, and T. Millstein, “Reran: Timing-andtouch-sensitive record and replay for android,” in Software Engineering(ICSE), 2013 35th International Conference on. IEEE, 2013, pp. 72–81.
[54] T. Chang, T. Yeh, and R. Miller, “GUI testing using computer vision,”in Proceedings of the 28th international conference on Human factors incomputing systems. ACM, 2010, pp. 1535–1544.
[55] A. Holmes and M. Kellogg, “Automating functional tests using Sele-nium,” in Agile Conference, 2006. IEEE, 2006, pp. 6–pp.
[56] T. Lalwani, M. Garg, C. Burmaan, and A. Arora, UFT/QTP InterviewUnplugged: And I Thought I Knew UFT!, 2nd ed. KnowledgeInbox,2013.
[57] W.-K. Chen, T.-H. Tsai, and H.-H. Chao, “Integration of specification-based and CR-based approaches for GUI testing,” in Advanced Informa-tion Networking and Applications, 2005. AINA 2005. 19th InternationalConference on, vol. 1. IEEE, 2005, pp. 967–972.
[58] B. N. Nguyen, B. Robbins, I. Banerjee, and A. Memon, “GUITAR: an in-novative tool for automated testing of GUI-driven software,” AutomatedSoftware Engineering, vol. 21, no. 1, pp. 65–105, 2014.
[59] I. K. El-Far and J. A. Whittaker, “Model-Based Software Testing,” En-cyclopedia of Software Engineering, 2001.
[60] A. C. Dias Neto, R. Subramanyan, M. Vieira, and G. H. Travassos, “Asurvey on model-based testing approaches: a systematic review,” in Pro-ceedings of the 1st ACM international workshop on Empirical assessmentof software engineering languages and technologies: held in conjunctionwith the 22nd IEEE/ACM International Conference on Automated Soft-ware Engineering (ASE) 2007. ACM, 2007, pp. 31–36.
[61] P. Frohlich and J. Link, “Automated test case generation from dy-namic models,” ECOOP 2000 Object-Oriented Programming, pp. 472–491, 2000.
[62] M. Utting and B. Legeard, Practical model-based testing: a tools ap-proach. Morgan Kaufmann, 2007.
[63] M. Fowler, UML distilled: a brief guide to the standard object modelinglanguage. Addison-Wesley Professional, 2004.
240 BIBLIOGRAPHY
[64] E. Alegroth, “On the Industrial Applicability of Visual GUI Testing,”Department of Computer Science and Engineering, Software Engineering(Chalmers), Chalmers University of Technology, Goteborg, Tech. Rep.,2013.
[65] E. Borjesson and R. Feldt, “Automated System Testing using Visual GUITesting Tools: A Comparative Study in Industry,” in Software Testing,Verification and Validation (ICST), 2012 IEEE Fifth International Con-ference on. IEEE, 2012, pp. 350–359.
[66] T.-H. Chang, “Using graphical representation of user interfaces as visualreferences,” in Proceedings of the 24th annual ACM symposium adjuncton User interface software and technology. ACM, 2011, pp. 27–30.
[67] E. Alegroth, R. Feldt, and H. Olsson, “JAutomate: a Tool for System-and Acceptance-test Automation,” ICST, 2012.
[68] TestPlant. (2013, Feb.) eggPlant. [Online]. Available:http://www.testplant.com/
[69] M. Harman, P. McMinn, M. Shahbaz, and S. Yoo, “A comprehensive sur-vey of trends in oracles for software testing,” Technical Report ResearchMemoranda CS-13-01, Department of Computer Science, University ofSheffield, Tech. Rep., 2013.
[70] R. Harrison and M. Wells, “A meta-analysis of multidisciplinary re-search,” in Conference on Empirical Assessment in Software Engineering(EASE), 2000, pp. 1–15.
[71] P. Runeson, M. Host, A. Rainer, and B. Regnell, Case study research insoftware engineering: Guidelines and examples. John Wiley & Sons,2012.
[72] J. A. Maxwell, Qualitative research design: An interactive approach.Sage Publications, Incorporated, 2004.
[73] C. Wohlin, P. Runeson, and M. Host, Experimentation in software engi-neering: an introduction. Springer Netherlands, 2000.
[74] M. Brydon-Miller, D. Greenwood, and P. Maguire, “Why action re-search?” Action research, vol. 1, no. 1, pp. 9–28, 2003.
[75] C. Robson, Real world research: a resource for social scientists andpractitioner-researchers. Blackwell Oxford, 2002, vol. 2.
[76] M. Matell and J. Jacoby, “Is there an optimal number of alternatives forLikert scale items? I. Reliability and validity.” Educational and psycho-logical measurement, 1971.
[77] B. G. Glaser and A. L. Strauss, The discovery of grounded theory: Strate-gies for qualitative research. Transaction Publishers, 2009.
[78] C. B. Seaman, “Qualitative methods in empirical studies of software en-gineering,” Software Engineering, IEEE Transactions on, vol. 25, no. 4,pp. 557–572, 1999.
BIBLIOGRAPHY 241
[79] R. Barbour and J. Kitzinger, Developing focus group research: politics,theory and practice. Sage Publications Limited, 1999.
[80] T. Gorschek, C. Wohlin, P. Carre, and S. Larsson, “A model for tech-nology transfer in practice,” Software, IEEE, vol. 23, no. 6, pp. 88–95,2006.
[81] S. Kausar, S. Tariq, S. Riaz, and A. Khanum, “Guidelines for the selec-tion of elicitation techniques,” in Emerging Technologies (ICET), 20106th International Conference on. IEEE, 2010, pp. 265–269.
[82] R. R. Young, “Recommended requirements gathering practices,”CrossTalk, vol. 15, no. 4, pp. 9–12, 2002.
[83] S. Shiba, “The Steps of KJ: Shiba Method,” 1987.
[84] T. C. Lethbridge, S. E. Sim, and J. Singer, “Studying software engineers:Data collection techniques for software field studies,” Empirical softwareengineering, vol. 10, no. 3, pp. 311–341, 2005.
[85] B. Kitchenham, “Procedures for performing systematic reviews,” Keele,UK, Keele University, vol. 33, no. 2004, pp. 1–26, 2004.
[86] F. J. Fowler Jr, Survey research methods. Sage publications, 2008.
[87] P. Berander and A. Andrews, “Requirements Prioritization,” Engineer-ing and Managing Software Requirements, 2005.
[88] A. Bowling, Techniques of questionnaire design. Open University Press,Maidenhead, UK, 2005.
[89] A. Bryman, “The debate about quantitative and qualitative research: aquestion of method or epistemology?” British Journal of Sociology, pp.75–92, 1984.
[90] G. Wickstrom and T. Bendix, “The” Hawthorne effect”what did theoriginal Hawthorne studies actually show?” Scandinavian journal ofwork, environment & health, pp. 363–367, 2000.
[91] V. Kampenes, T. Dyba, J. Hannay, and D. K Sjøberg, “A systematicreview of quasi-experiments in software engineering,” Information andSoftware Technology, vol. 51, no. 1, pp. 71–82, 2009.
[92] T. D. Cook, D. T. Campbell, and A. Day, Quasi-experimentation: Design& analysis issues for field settings. Houghton Mifflin Boston, 1979.
[93] L. Briand, K. El Emam, and S. Morasca, “On the application of measure-ment theory in software engineering,” Empirical Software Engineering,vol. 1, no. 1, pp. 61–88, 1996.
[94] B. A. Kitchenham, S. L. Pfleeger, L. M. Pickard, P. W. Jones, D. C.Hoaglin, K. El Emam, and J. Rosenberg, “Preliminary guidelines forempirical research in software engineering,” Software Engineering, IEEETransactions on, vol. 28, no. 8, pp. 721–734, 2002.

242 BIBLIOGRAPHY
[95] W. H. Kruskal, “Historical notes on the Wilcoxon unpaired two-sampletest,” Journal of the American Statistical Association, vol. 52, no. 279,pp. 356–360, 1957.
[96] A. Arcuri and L. Briand, “A practical guide for using statistical tests toassess randomized algorithms in software engineering,” in IEEE Inter-national Conference on Software Engineering (ICSE), 2011.
[97] D. Rafi, K. Moses, K. Petersen, and M. Mantyla, “Benefits and limita-tions of automated software testing: Systematic literature review andpractitioner survey,” in Automation of Software Test (AST), 2012 7thInternational Workshop on, june 2012, pp. 36 –42.
[98] C. Kendall, L. R. Kerr, R. C. Gondim, G. L. Werneck, R. H. M. Macena,M. K. Pontes, L. G. Johnston, K. Sabin, and W. McFarland, “An empir-ical comparison of respondent-driven sampling, time location sampling,and snowball sampling for behavioral surveillance in men who have sexwith men, Fortaleza, Brazil,” AIDS and Behavior, vol. 12, no. 1, pp.97–104, 2008.
[99] T. Hellmann, E. Moazzen, A. Sharma, M. Z. Akbar, J. Sillito, F. Maureret al., “An Exploratory Study of Automated GUI Testing: Goals, Issues,and Best Practices,” 2014.
[100] D. Hoffman, “Cost benefits analysis of test automation,” STAR West,vol. 99, 1999.
[101] P. Li, T. Huynh, M. Reformat, and J. Miller, “A practical approach totesting GUI systems,” Empirical Software Engineering, vol. 12, no. 4,pp. 331–357, 2007.
[102] P. Hsia, D. Kung, and C. Sell, “Software requirements and acceptancetesting,” Annals of software Engineering, vol. 3, no. 1, pp. 291–317, 1997.
[103] P. Hsia, J. Gao, J. Samuel, D. Kung, Y. Toyoshima, and C. Chen,“Behavior-based acceptance testing of software systems: a formal sce-nario approach,” in Computer Software and Applications Conference,1994. COMPSAC 94. Proceedings., Eighteenth Annual International.IEEE, 1994, pp. 293–298.
[104] T. Graves, M. Harrold, J. Kim, A. Porter, and G. Rothermel, “An em-pirical study of regression test selection techniques,” ACM Transactionson Software Engineering and Methodology (TOSEM), vol. 10, no. 2, pp.184–208, 2001.
[105] D. Chelimsky, D. Astels, Z. Dennis, A. Hellesoy, B. Helmkamp, andD. North, “The RSpec Book: Behaviour Driven Development withRSpec, Cucumber, and Friends,” Pragmatic Bookshelf, 2010.
[106] A. Adamoli, D. Zaparanuks, M. Jovic, and M. Hauswirth, “AutomatedGUI performance testing,” Software Quality Journal, pp. 1–39, 2011.
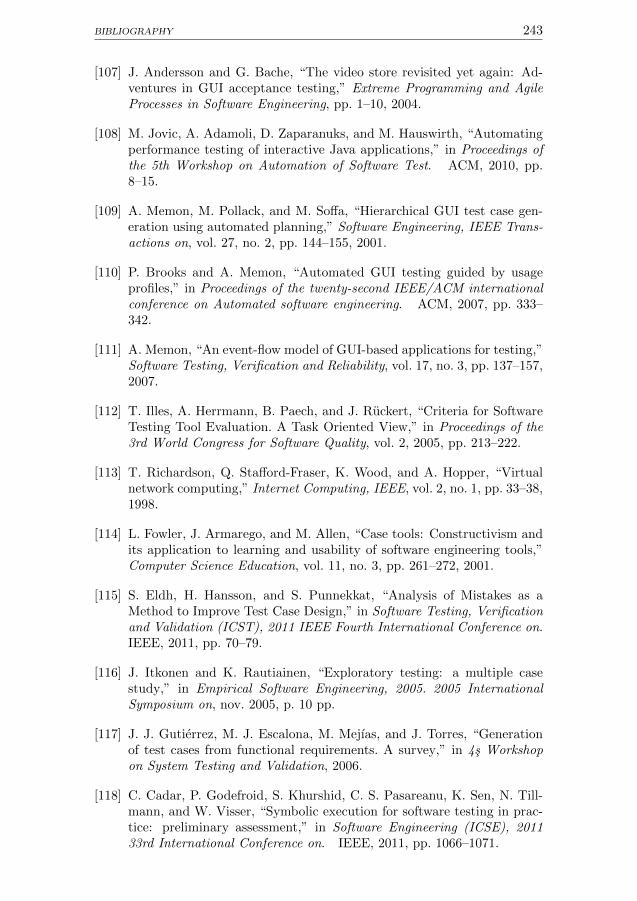
BIBLIOGRAPHY 243
[107] J. Andersson and G. Bache, “The video store revisited yet again: Ad-ventures in GUI acceptance testing,” Extreme Programming and AgileProcesses in Software Engineering, pp. 1–10, 2004.
[108] M. Jovic, A. Adamoli, D. Zaparanuks, and M. Hauswirth, “Automatingperformance testing of interactive Java applications,” in Proceedings ofthe 5th Workshop on Automation of Software Test. ACM, 2010, pp.8–15.
[109] A. Memon, M. Pollack, and M. Soffa, “Hierarchical GUI test case gen-eration using automated planning,” Software Engineering, IEEE Trans-actions on, vol. 27, no. 2, pp. 144–155, 2001.
[110] P. Brooks and A. Memon, “Automated GUI testing guided by usageprofiles,” in Proceedings of the twenty-second IEEE/ACM internationalconference on Automated software engineering. ACM, 2007, pp. 333–342.
[111] A. Memon, “An event-flow model of GUI-based applications for testing,”Software Testing, Verification and Reliability, vol. 17, no. 3, pp. 137–157,2007.
[112] T. Illes, A. Herrmann, B. Paech, and J. Ruckert, “Criteria for SoftwareTesting Tool Evaluation. A Task Oriented View,” in Proceedings of the3rd World Congress for Software Quality, vol. 2, 2005, pp. 213–222.
[113] T. Richardson, Q. Stafford-Fraser, K. Wood, and A. Hopper, “Virtualnetwork computing,” Internet Computing, IEEE, vol. 2, no. 1, pp. 33–38,1998.
[114] L. Fowler, J. Armarego, and M. Allen, “Case tools: Constructivism andits application to learning and usability of software engineering tools,”Computer Science Education, vol. 11, no. 3, pp. 261–272, 2001.
[115] S. Eldh, H. Hansson, and S. Punnekkat, “Analysis of Mistakes as aMethod to Improve Test Case Design,” in Software Testing, Verificationand Validation (ICST), 2011 IEEE Fourth International Conference on.IEEE, 2011, pp. 70–79.
[116] J. Itkonen and K. Rautiainen, “Exploratory testing: a multiple casestudy,” in Empirical Software Engineering, 2005. 2005 InternationalSymposium on, nov. 2005, p. 10 pp.
[117] J. J. Gutierrez, M. J. Escalona, M. Mejıas, and J. Torres, “Generationof test cases from functional requirements. A survey,” in 4s Workshopon System Testing and Validation, 2006.
[118] C. Cadar, P. Godefroid, S. Khurshid, C. S. Pasareanu, K. Sen, N. Till-mann, and W. Visser, “Symbolic execution for software testing in prac-tice: preliminary assessment,” in Software Engineering (ICSE), 201133rd International Conference on. IEEE, 2011, pp. 1066–1071.
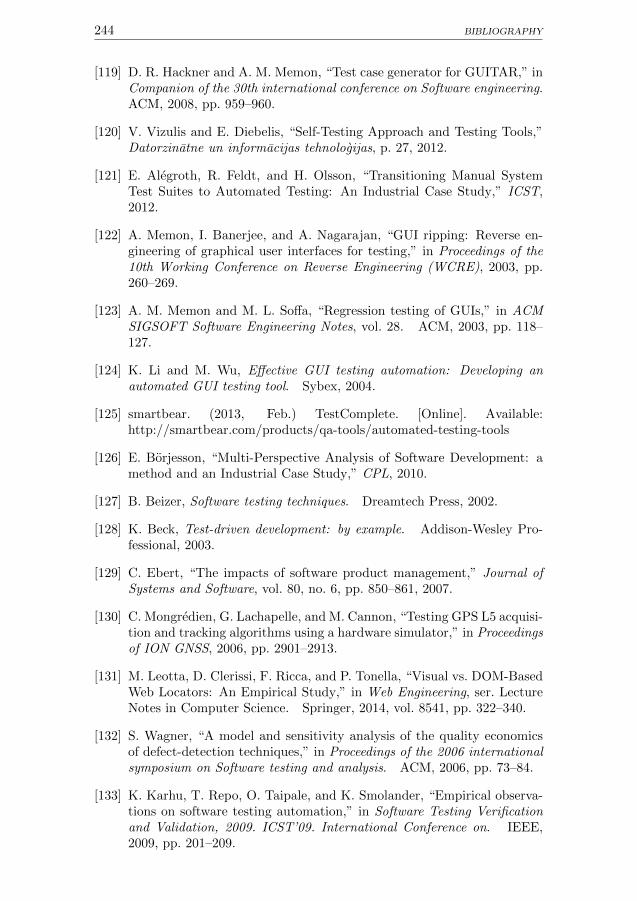
244 BIBLIOGRAPHY
[119] D. R. Hackner and A. M. Memon, “Test case generator for GUITAR,” inCompanion of the 30th international conference on Software engineering.ACM, 2008, pp. 959–960.
[120] V. Vizulis and E. Diebelis, “Self-Testing Approach and Testing Tools,”Datorzinatne un informacijas tehnologijas, p. 27, 2012.
[121] E. Alegroth, R. Feldt, and H. Olsson, “Transitioning Manual SystemTest Suites to Automated Testing: An Industrial Case Study,” ICST,2012.
[122] A. Memon, I. Banerjee, and A. Nagarajan, “GUI ripping: Reverse en-gineering of graphical user interfaces for testing,” in Proceedings of the10th Working Conference on Reverse Engineering (WCRE), 2003, pp.260–269.
[123] A. M. Memon and M. L. Soffa, “Regression testing of GUIs,” in ACMSIGSOFT Software Engineering Notes, vol. 28. ACM, 2003, pp. 118–127.
[124] K. Li and M. Wu, Effective GUI testing automation: Developing anautomated GUI testing tool. Sybex, 2004.
[125] smartbear. (2013, Feb.) TestComplete. [Online]. Available:http://smartbear.com/products/qa-tools/automated-testing-tools
[126] E. Borjesson, “Multi-Perspective Analysis of Software Development: amethod and an Industrial Case Study,” CPL, 2010.
[127] B. Beizer, Software testing techniques. Dreamtech Press, 2002.
[128] K. Beck, Test-driven development: by example. Addison-Wesley Pro-fessional, 2003.
[129] C. Ebert, “The impacts of software product management,” Journal ofSystems and Software, vol. 80, no. 6, pp. 850–861, 2007.
[130] C. Mongredien, G. Lachapelle, and M. Cannon, “Testing GPS L5 acquisi-tion and tracking algorithms using a hardware simulator,” in Proceedingsof ION GNSS, 2006, pp. 2901–2913.
[131] M. Leotta, D. Clerissi, F. Ricca, and P. Tonella, “Visual vs. DOM-BasedWeb Locators: An Empirical Study,” in Web Engineering, ser. LectureNotes in Computer Science. Springer, 2014, vol. 8541, pp. 322–340.
[132] S. Wagner, “A model and sensitivity analysis of the quality economicsof defect-detection techniques,” in Proceedings of the 2006 internationalsymposium on Software testing and analysis. ACM, 2006, pp. 73–84.
[133] K. Karhu, T. Repo, O. Taipale, and K. Smolander, “Empirical observa-tions on software testing automation,” in Software Testing Verificationand Validation, 2009. ICST’09. International Conference on. IEEE,2009, pp. 201–209.

BIBLIOGRAPHY 245
[134] C. Liu, “Platform-independent and tool-neutral test descriptions for au-tomated software testing,” in Proceedings of the 22nd international con-ference on Software engineering. ACM, 2000, pp. 713–715.
[135] M. Fewster and D. Graham, Software test automation: effective use oftest execution tools. ACM Press/Addison-Wesley Publishing Co., 1999.
[136] M. Leotta, D. Clerissi, F. Ricca, and P. Tonella, “Capture-replay vs.programmable web testing: An empirical assessment during test caseevolution,” in Reverse Engineering (WCRE), 2013 20th Working Con-ference on. IEEE, 2013, pp. 272–281.
[137] A. Kornecki and J. Zalewski, “Certification of software for real-timesafety-critical systems: state of the art,” Innovations in Systems andSoftware Engineering, vol. 5, no. 2, pp. 149–161, 2009.
[138] A. Hofer and W. F. Tichy, “Status of empirical research in software engi-neering,” in Empirical Software Engineering Issues. Critical Assessmentand Future Directions. Springer, 2007, pp. 10–19.
[139] E. Borjesson and R. Feldt, “Automated system testing using visual GUItesting tools: A comparative study in industry,” in Software Testing,Verification and Validation (ICST), 2012 IEEE Fifth International Con-ference on. IEEE, 2012, pp. 350–359.
[140] A. Marchenko, P. Abrahamsson, and T. Ihme, “Long-term effects oftest-driven development a case study,” in Agile Processes in SoftwareEngineering and Extreme Programming. Springer, 2009, pp. 13–22.
[141] H. Kniberg and A. Ivarsson, “Scaling Agile@ Spotify,” online], UCVOF,ucvox. files. wordpress. com/2012/11/113617905-scaling-Agile-spotify-11. pdf, 2012.
[142] N. Olsson and K. Karl. (2015) Graphwalker: The Open Source Model-Based Testing Tool. [Online]. Available: http://graphwalker.org/index
[143] J. Carver, “The use of grounded theory in empirical software engineer-ing,” in Empirical Software Engineering Issues. Critical Assessment andFuture Directions. Springer, 2007, pp. 42–42.
[144] J. Saldana, The coding manual for qualitative researchers. Sage, 2012,no. 14.
[145] M. Weinstein. (2002) TAMS Analyzer for Macintosh OS X: The nativeOpen source, Macintosh Qualitative Research Tool. [Online]. Available:http://tamsys.sourceforge.net/
[146] C. Wohlin and A. Aurum, “Towards a decision-making structure forselecting a research design in empirical software engineering,” EmpiricalSoftware Engineering, pp. 1–29, 2014.
[147] N. J. Nilsson, Principles of artificial intelligence. Tioga Publishing,1980.
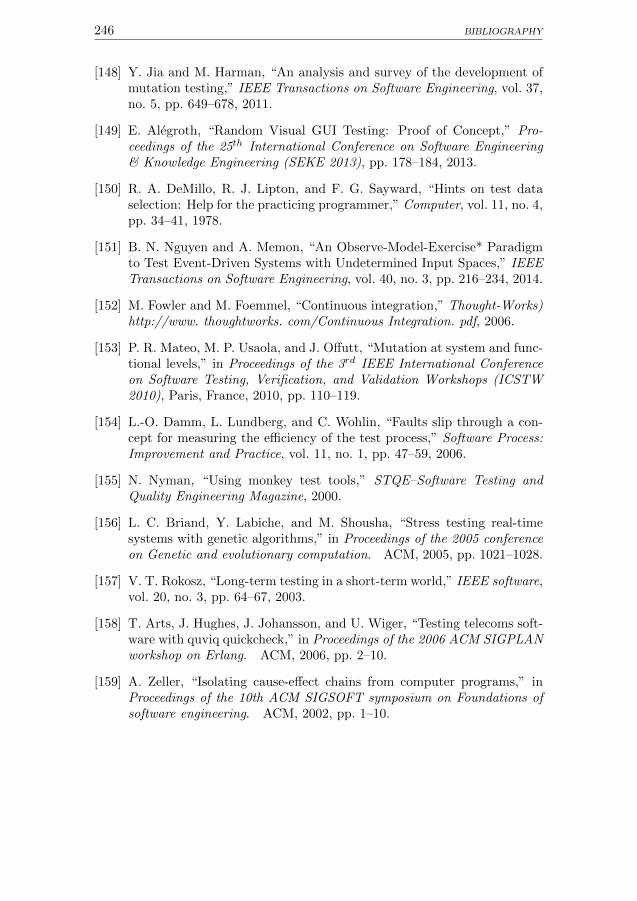
246 BIBLIOGRAPHY
[148] Y. Jia and M. Harman, “An analysis and survey of the development ofmutation testing,” IEEE Transactions on Software Engineering, vol. 37,no. 5, pp. 649–678, 2011.
[149] E. Alegroth, “Random Visual GUI Testing: Proof of Concept,” Pro-ceedings of the 25th International Conference on Software Engineering& Knowledge Engineering (SEKE 2013), pp. 178–184, 2013.
[150] R. A. DeMillo, R. J. Lipton, and F. G. Sayward, “Hints on test dataselection: Help for the practicing programmer,” Computer, vol. 11, no. 4,pp. 34–41, 1978.
[151] B. N. Nguyen and A. Memon, “An Observe-Model-Exercise* Paradigmto Test Event-Driven Systems with Undetermined Input Spaces,” IEEETransactions on Software Engineering, vol. 40, no. 3, pp. 216–234, 2014.
[152] M. Fowler and M. Foemmel, “Continuous integration,” Thought-Works)http://www. thoughtworks. com/Continuous Integration. pdf, 2006.
[153] P. R. Mateo, M. P. Usaola, and J. Offutt, “Mutation at system and func-tional levels,” in Proceedings of the 3rd IEEE International Conferenceon Software Testing, Verification, and Validation Workshops (ICSTW2010), Paris, France, 2010, pp. 110–119.
[154] L.-O. Damm, L. Lundberg, and C. Wohlin, “Faults slip through a con-cept for measuring the efficiency of the test process,” Software Process:Improvement and Practice, vol. 11, no. 1, pp. 47–59, 2006.
[155] N. Nyman, “Using monkey test tools,” STQE–Software Testing andQuality Engineering Magazine, 2000.
[156] L. C. Briand, Y. Labiche, and M. Shousha, “Stress testing real-timesystems with genetic algorithms,” in Proceedings of the 2005 conferenceon Genetic and evolutionary computation. ACM, 2005, pp. 1021–1028.
[157] V. T. Rokosz, “Long-term testing in a short-term world,” IEEE software,vol. 20, no. 3, pp. 64–67, 2003.
[158] T. Arts, J. Hughes, J. Johansson, and U. Wiger, “Testing telecoms soft-ware with quviq quickcheck,” in Proceedings of the 2006 ACM SIGPLANworkshop on Erlang. ACM, 2006, pp. 2–10.
[159] A. Zeller, “Isolating cause-effect chains from computer programs,” inProceedings of the 10th ACM SIGSOFT symposium on Foundations ofsoftware engineering. ACM, 2002, pp. 1–10.


![[Srijan Wednesday Webinars] Automating Visual Regression using ‘Galen’](https://img.pdfslide.us/doc/110x75/58a3935a1a28abb1348b491f/srijan-wednesday-webinars-automating-visual-regression-using-galen.jpg)