Embed Size (px)
DESCRIPTION
Visual Encoding. Andrew Chan CPSC 533C January 20, 2003. Overview. What is a visual encoding? How can it amplify our cognition? How do we map data into a visual form? What kinds of information visualization exist?. Visual Encoding Defined. - PowerPoint PPT Presentation
Citation preview

1
Visual Encoding
Andrew ChanCPSC 533C
January 20, 2003
2
Overview• What is a visual encoding?• How can it amplify our cognition?• How do we map data into a visual form?• What kinds of information visualization exist?

3
Visual Encoding Defined• “Visual encoding is the mapping of
information to display elements”– Tamara Munzner, Ph.D. dissertation
http://graphics.stanford.edu/papers/munzner_thesis/
4
“. . . [H]uman intelligence is highly flexible and adaptive, superb at inventing procedures and objects that overcome its own limits. The real powers come from devising external aids that enhance cognitive abilities.

5
“How have we increased memory, thought, and reasoning? By the invention of external aids: It is things that make us smart.”
- Don Norman

6
Amplifying Cognition• Increased resources• Reduced search• Enhanced recognition of patterns• Perceptual inference• Perceptual monitoring• Manipulable medium
7
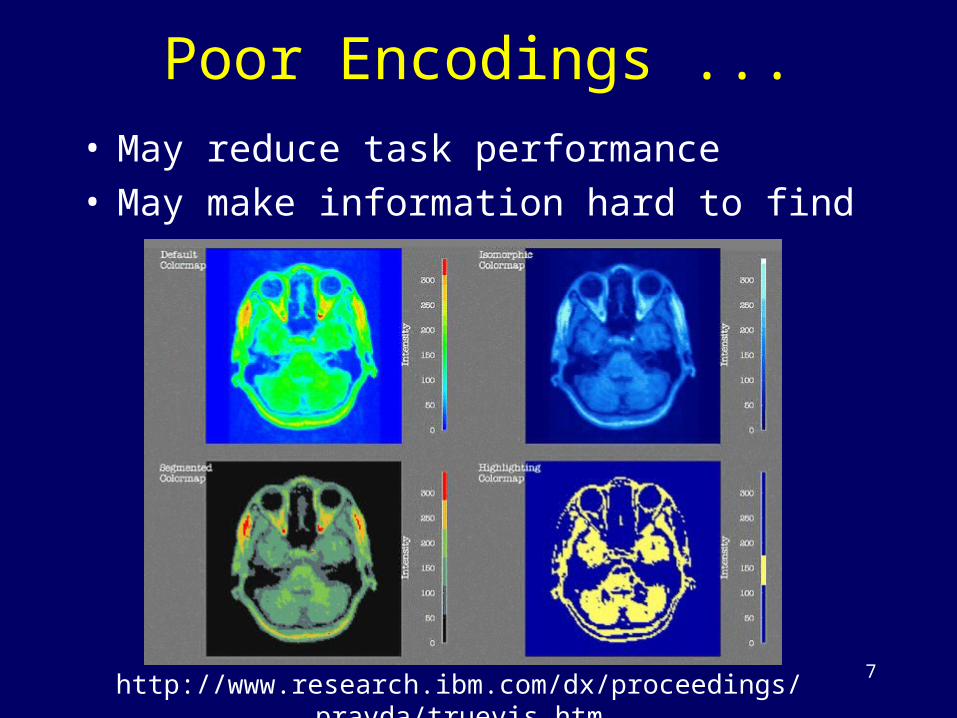
Poor Encodings ...• May reduce task performance• May make information hard to find
http://www.research.ibm.com/dx/proceedings/pravda/truevis.htm

8
Or worse ...• The Challenger shuttle disaster was linked to
a misunderstood diagram

9
Knowledge Crystallization• The general process used when people have
a task to complete

10
Infovis at Different Levels• Infosphere• Information workspace• Visual knowledge tools• Visual objects
11
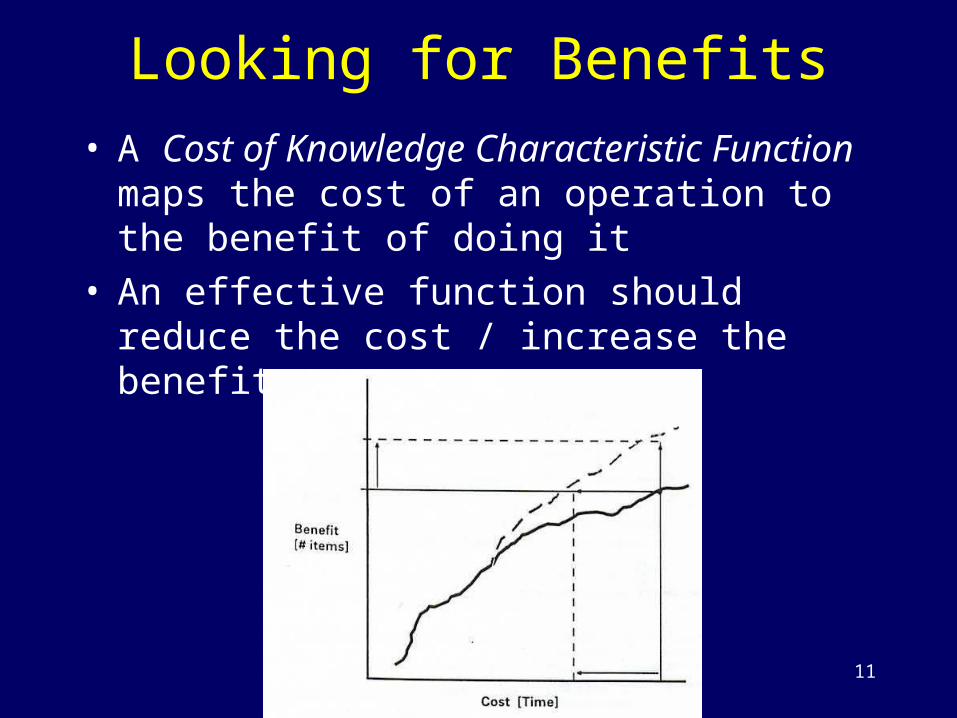
Looking for Benefits• A Cost of Knowledge Characteristic Function
maps the cost of an operation to the benefit of doing it
• An effective function should reduce the cost / increase the benefit

12
Mapping Data to Visual Form

13
Raw Data• Usually represented as a relation or set of
relations to give it some structure
• A relation is a set of tuples in the form: <valueix, valueiy>, <valuejx, valuejy> ...

14
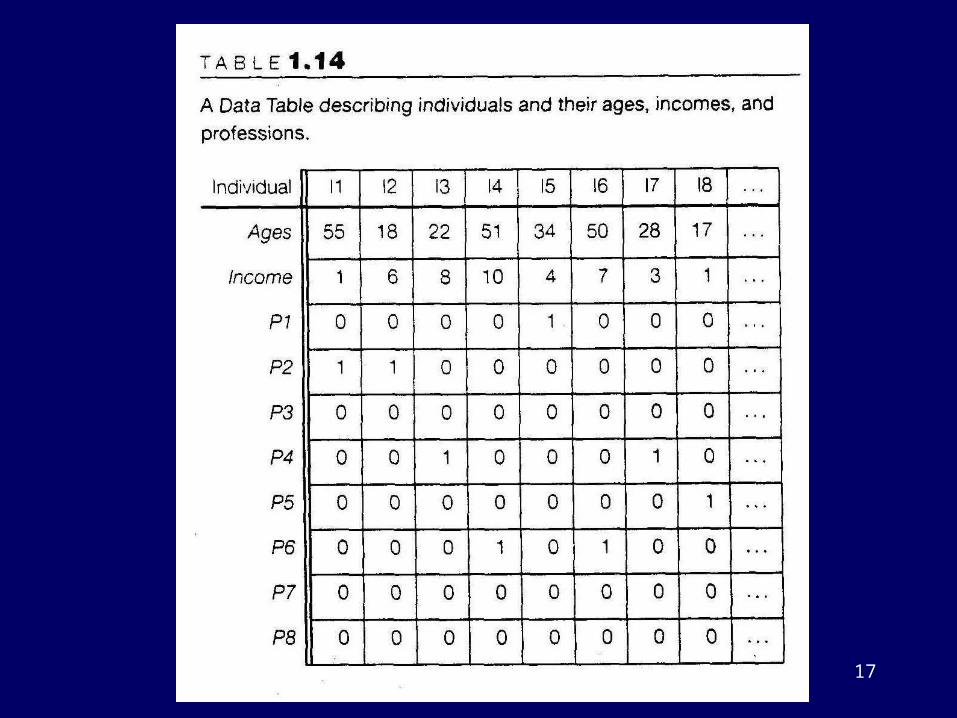
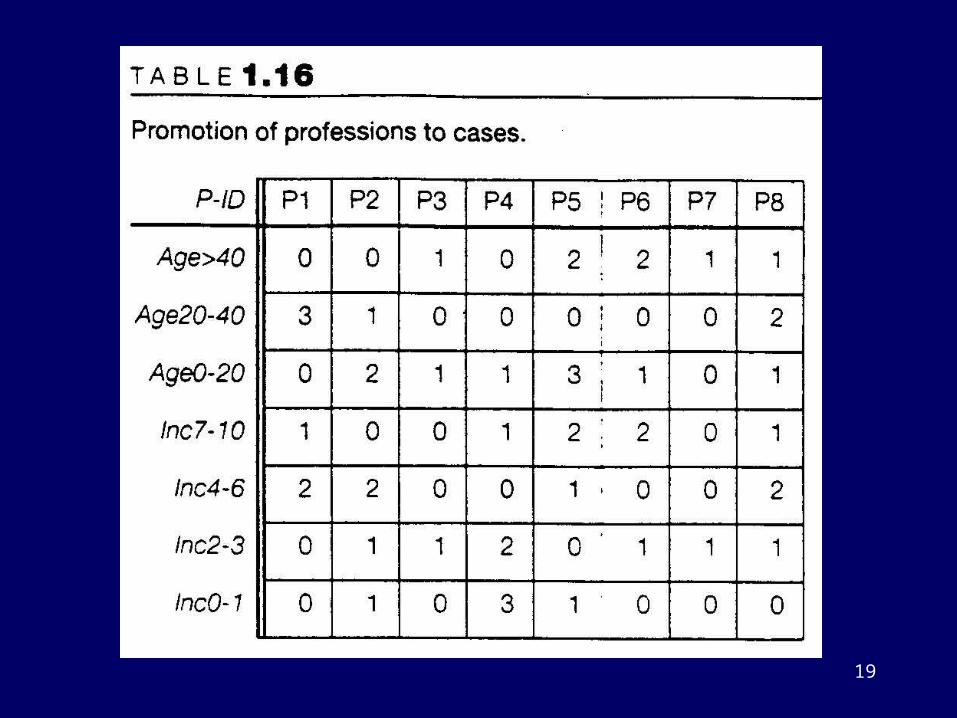
Data Tables• Contain data and metadata
15
Note:
Dimensionality can have different meanings:– number of input variables– number of output variables– number of input and output variables– number of spatial dimensions in data
16
Data Transformations• Four types of data transformations:
– Values to derived values– Structure to derived structure– Values to derived structure– Structure to derived values
17

18
19
20
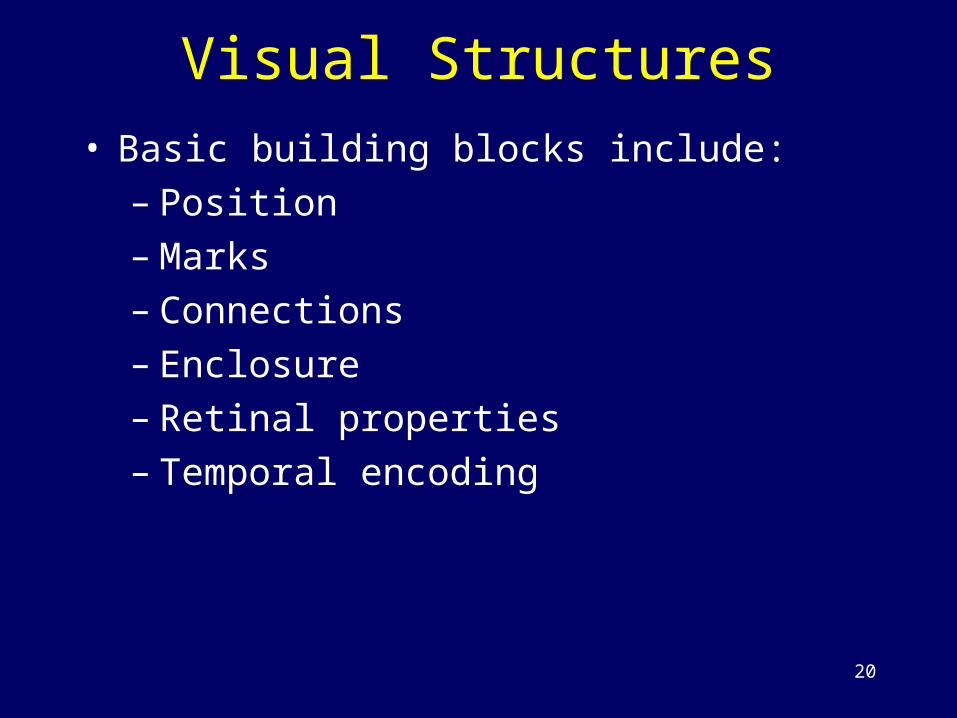
Visual Structures• Basic building blocks include:
– Position– Marks– Connections– Enclosure– Retinal properties– Temporal encoding

21
Position• Fundamental aspect of visual structure• Four possible axes: unstructured, nominal,
ordinal, quantitative• Techniques to maximize its use:
– Composition– Alignment– Folding– Recursion– Overloading

22
Marks• Four types:
– points– lines– areas– volumes
23
Connections and Enclosure• Connections show a relationship between
objects• Enclosure can also indicate related objects

24
Retinal Properties• Include colour, size, texture, shape, orientation

25
Temporal Encoding• Humans are very sensitive to changes in
mark position and their retinal properties• Data shown may or may not be time-based

26
View Transformations• Make a static presentation interactive• Three common transformations:
– Location probes– Viewport controls– Distortions
27
Infovis Examples

28
Scientific Visualization
29
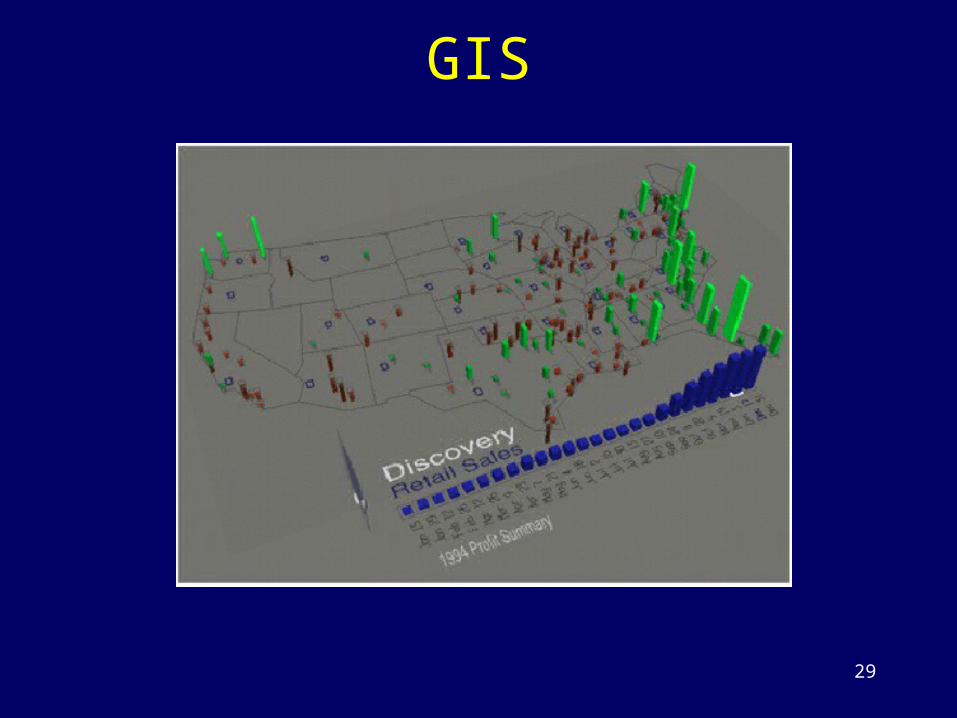
GIS

30
Multi-Dimensional Scattergraphs

31
Worlds-Within-Worlds
32
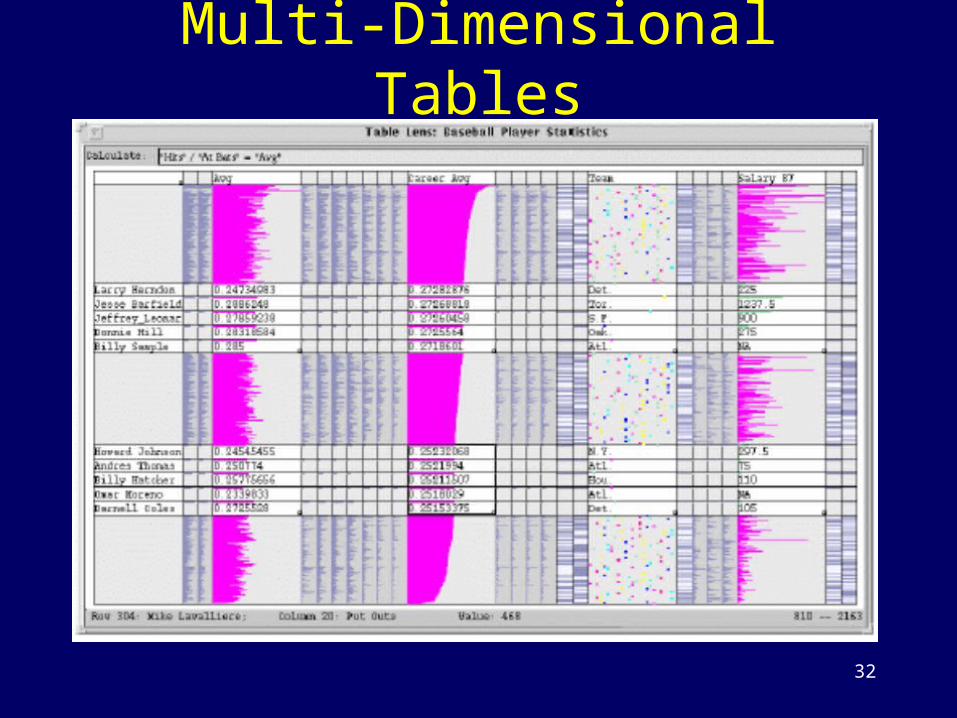
Multi-Dimensional Tables
33
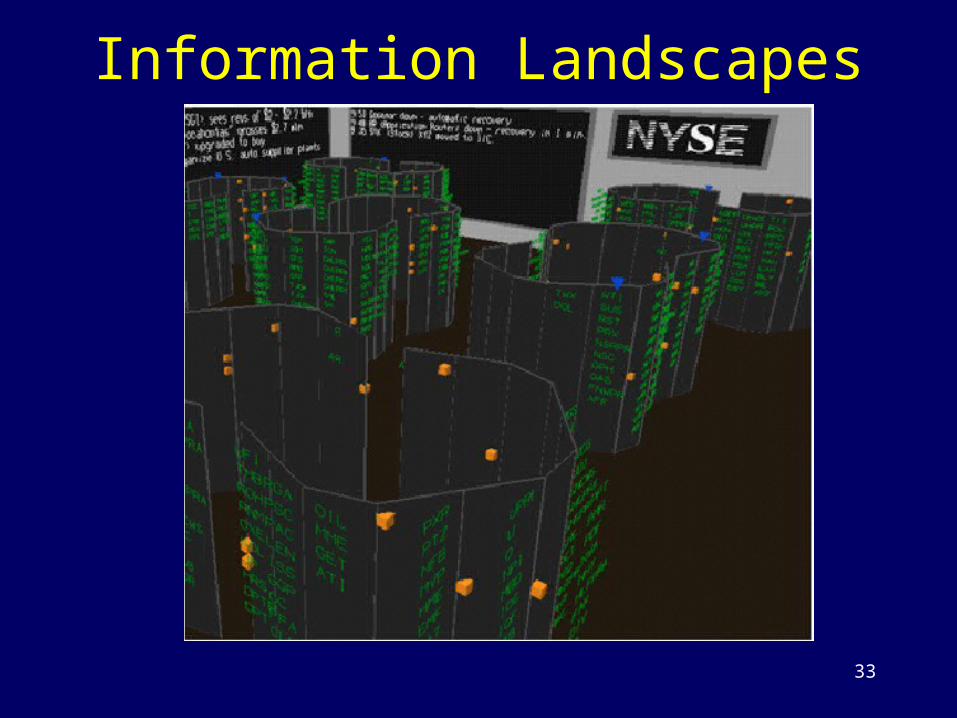
Information Landscapes
34
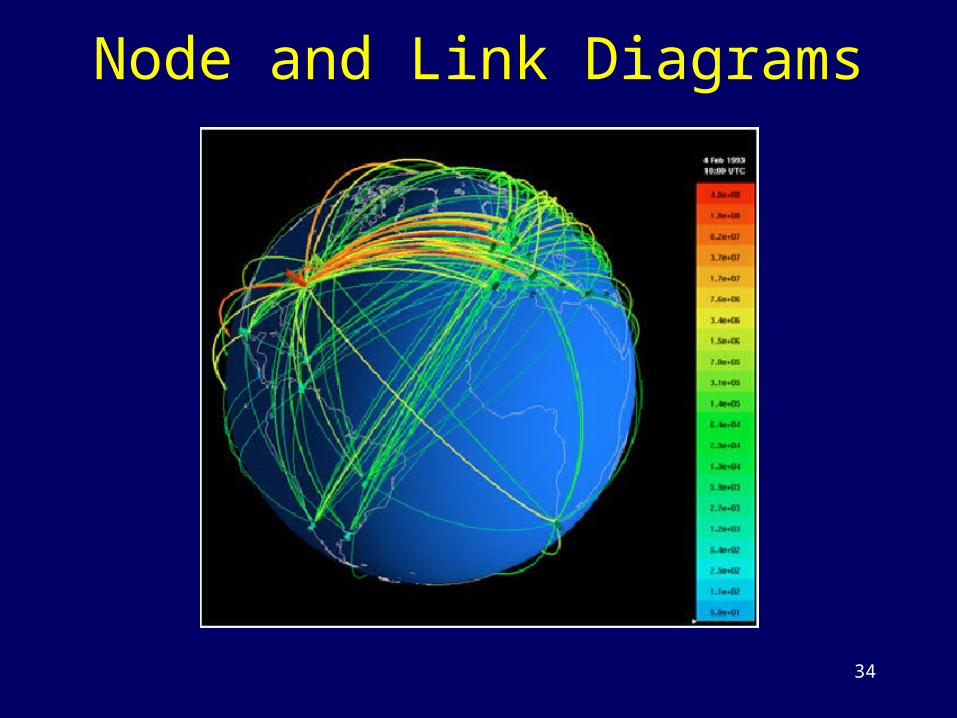
Node and Link Diagrams

35
Trees

36
Special Data Transforms