Embed Size (px)
Citation preview
Visual and Instrumental Assessments ofColor Differences in Automotive Coatings
Omar G�omezAQ4 ,1* Esther Perales,1 El�ısabet Chorro,1
Francisco J. Burgos,2 Valent�ın Viqueira,1
Meritxell Vilaseca,2 Francisco M. Mart�ınez-Verd�uAQ1 ,1
Jaume Pujol21Color & Vision Group, University of Alicante, Carretera De San Vicente Del Raspeig S/N 03690, AlicanteAQ2 , Spain
2Center for Sensors, Instruments and Systems Development (Cd6), Technical University of Catalonia (UPC), Rambla De Sant Nebridi, 10, Terrassa
08222, Spain
Received 22 October 2014; revised 31 March 2015; accepted 31 March 2015
Abstract: The interest in gonioapparent pigments (metal-lic, pearlescent, interference, or diffractive) has increasedin the last few years, especially for applications in theautomotive industry. To assure a proper characterizationof colors with gonioapparent pigments, commercial devi-ces have appeared to characterize the color in differentgeometries, which are called multiangle spectrophotome-ters. As the gonioapparent pigments and multiangleinstruments are relatively new, no studies exist regardingthe instrumental-based procedure followed in the indus-try, and if the results provided are in agreement with theobserver perception.Consequently, the main objective of this study was toexamine the correlation of the instrumental color differ-ences with visual assessments. The instrumental color dif-ference was calculated with the color difference formulaAUDI2000 (specific for this sector) between the pairs ofsimilar samples of three types of coated panels (solid,metallic, and pearlescent). The values measured by a tel-espectroradiometer in a directional lighting booth andthe colorimetric values obtained by means of a multian-gle spectrophotometer BYK-mac were considered for thispurpose. Additionally, a visual experiment was conductedto quantify the color difference by using the gray-scalemethod.The results revealed that an acceptable instrumental cor-relation existed despite the visual and the instrumental
correlation being worse. In particular, it was checkedthat observers accepted a larger number of color pairs,that is, the visual color difference was smaller than thetolerance demanded by the industry (derived fromAUDI2000). VC 2015 Wiley Periodicals, Inc. Col Res Appl, 00, 000–
000, 2015; Published Online 00 Month 2015 in Wiley Online Library
(wileyonlinelibrary.com). DOI 10.1002/col.21964
Key words: vision; color; color measurement; perceptionpsychology; psychophysics; industrial inspection
INTRODUCTION
The interest in gonioapparent pigments applied in many
industries (cosmetics, inks, etc.) continues increasing day
by day, especially in the automotive sector. This sector
has undergone many changes and updates in the last
years1,2 from employing only paints without visual effect
to use many of them containing gonioapparent pigments
providing new and attractive visual effects by combining
variable color and texture according to irradiation and
viewing directions.
Goniochromatism is a change in any or all attributes of
color of a specimen on change in angular illuminating–
viewing conditions but without change in light source or
observer.3 This happens when the material that is under
evaluation includes gonioapparent pigments. Therefore, it
is possible to classify the materials into three types
according to the pigment recipe and its colorimetric
behavior4–6: solid, metallic, and pearlescent or interfer-
ence coatings (Fig. F11, right). The solid color includes
only scattering pigments, and hence, the perceived color
*Correspondence to: Omar G�omez(e-mail:[email protected])
Contract grant sponsors: EMRP, EMRP participating countries within EUR-
AMET, the European Union.
VC 2015 Wiley Periodicals, Inc.
Volume 00, Number 00, Month 2015 1
J_ID: COL Customer A_ID: COL21964 Cadmus Art: COL21964 Ed. Ref. No.: COL-14-101.R3 Date: 8-April-15 Stage: Page: 1
ID: thangaraj.n Time: 20:21 I Path: N:/3b2/COL#/Vol00000/150022/APPFile/JW-COL#150022
does not show significant changes owing to the variation
of the direction of lighting and/or detection. The metallic
coating includes metallic pigments that provide a color
shift mainly in lightness. The pearlescent coating includes
in its recipe pearlescent pigments (even solid pigments)
that provide a color shift mainly owing to a hue and a
chroma change.
Currently, in the automotive sector, color quality of auto-
motive coatings with gonioapparent pigments is performed
by characterizing the color under different measurement
geometries.5,7–10 For this, commercial devices, called mul-
tiangle spectrophotometers, are able to characterize the
color in different geometries, such as BYK-mac, or X-Rite
MA98, which satisfy ASTM and DIN standards.11–14
Although multiangle spectrophotometers are commonly
used in the automotive industry, there are few studies
focused on the correlation between instrumental measure-
ments and visual assessments by using rightly directional
lighting booths.15–17 In other words, there are no studies
to check if the procedure followed in the industry, mainly
based on the instrumental measures of a multiangle spec-
trophotometer, would match the decision that an observer
would give.18 Therefore, the conventional approach using
a diffuse lighting booth and an integrating sphere spec-
troradiometer is not valid for gonioapparent colors, and
hence it is necessary to use a commercial directional
lighting booth such as the gonio-vision box from Merck
or the byko-spectra effect cabinet from BYK-Gardner.
The purpose of this study is to study the correlation of
the visual and instrumental assessment of the color differ-
ences between pairs of similar samples. The instrumental
measurements were made with two different measurement
devices: BYK-mac multiangle spectrophotometer and PR-
650 telespectroradiometer. In addition, a psychophysical
experiment that included a directional lighting booth was
designed to obtain the visual assessments to quantify the
COLOR
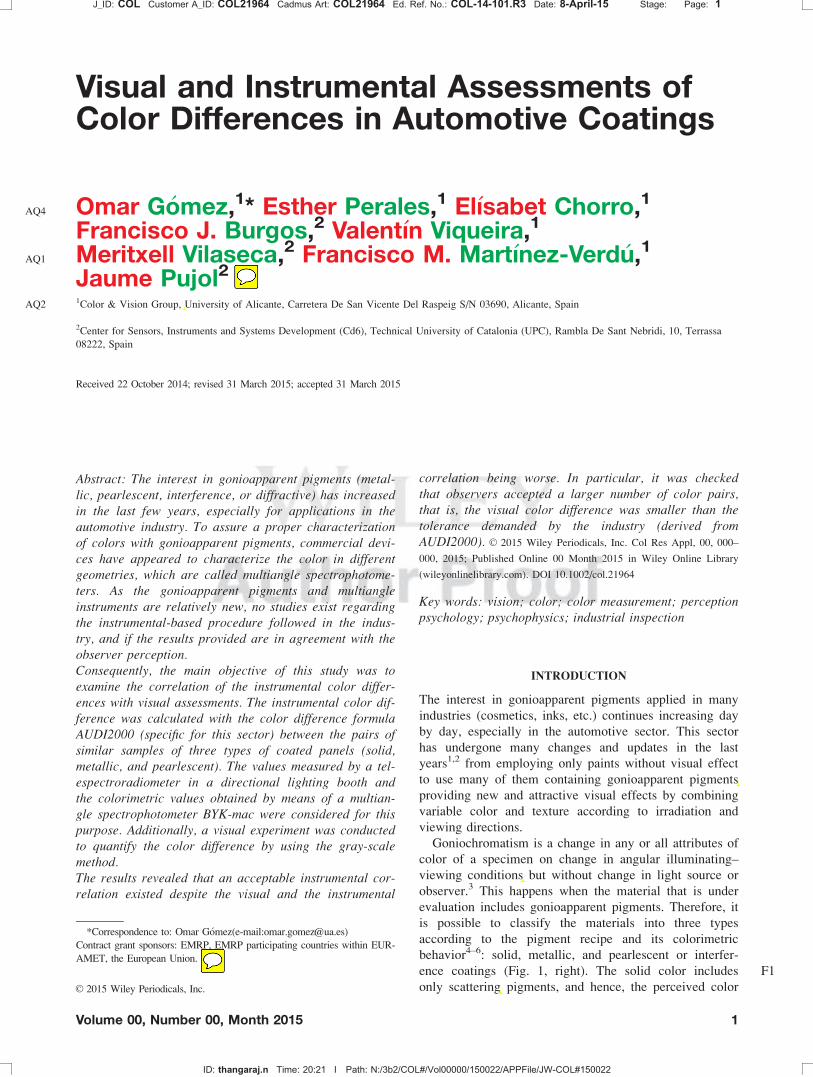
Fig. 1. Left: Color appearance of the 60 assessed color pairs. Right: Colorimetric behavior according to the pigmentrecipe.
J_ID: COL Customer A_ID: COL21964 Cadmus Art: COL21964 Ed. Ref. No.: COL-14-101.R3 Date: 8-April-15 Stage: Page: 2
ID: thangaraj.n Time: 20:21 I Path: N:/3b2/COL#/Vol00000/150022/APPFile/JW-COL#150022
2 COLOR research and application
color difference by the comparison with a standard gray
scale for color differences.
MATERIALS AND METHODS
A total set of 60 pairs of different samples from solid,
metallic, and pearlescent pigments were selected (Fig. 1,
left). For this study, knowing previously the pigment for-
mulation of this panels was not important though it could
be interested in other future studies, because we only
focused in the optical and colorimetric behavior, not
structural (pigments type, size, shape, etc.). Figure 1(a)
(left) shows the a*b* and L*C* chromatic diagrams with
the representation of the 20 solid color pairs. The differ-
ent colors indicate the different measurement geometries,
and the different symbol, circle, and square, the two color
samples of one color pairs. Figure 1(b) (left) shows the
representation at both chromatic diagrams for the metallic
color pairs. Finally, Fig. 1(c) (left) shows the pearlescent
color pairs. In this figure, it can be seen that the color
gamut associated with the selected color samples and the
behavior of each kind of pigment, solid, metallic, and
pearlescent.
The color differences between pairs of samples were
calculated by the color difference Formula (1)
AUDI2000,19,20 based on the CIELAB color space. This
color difference formula was developed by and is used by
AUDI, without being endorsed by any standardization
body till now, with the main purpose to manage the color
tolerances varying depending on the specific application,
paint batch acceptance, color matching for add-on parts
in the car body, refinish, and so forth.
AUDI2000 color difference formula was especially
designed for materials with gonioapparent pigments; then,
it considers the changes that these materials show depend-
ing on the angle of illumination and observation (flop) as
follows:
DEc ¼
ffiffiffiffiffiffiffiffiffiffiffiffiffiffiffiffiffiffiffiffiffiffiffiffiffiffiffiffiffiffiffiffiffiffiffiffiffiffiffiffiffiffiffiffiffiffiffiffiffiffiffiffiffiffiffiffiffiffiffiffiffiffiffiffiffiffiffiffiffiffiffiffiffiffiffiffiffiffiffiffiffiffiffiDLc
sDL;cgDL
� �2
1DCc
sDC;cgDC
� �2
1DHc
sDH;cgDH
� �2s
(1)
sDLci¼jL�ci
2L�ci11j
ci112ci
� �2=3
10:002C�4510:33 (2)
¼ sDLci;Flop1sDLci;Solid10:33 (3)
sDCci¼ 1:478
jC�ci2C�ci11
jci112ci
� �10:014C�4510:27 (4)
¼ sDCci;Flop1sDCci;Solid10:27 (5)
sDHci¼ 0:800
jC�ci2C�ci11
jci112ci
� �10:004C�4510:30 (6)
¼ sDHci;Flop1sDHci;Solid10:30 (7)
Where “s” are the weighting functions and “g” are the
parametric factors for each term, lightness, chroma, and
hue, and c is referred to the measurement geometry, with
ci � {15�,. . .,110�}. To obtain a weighting for the mea-
surement angle of 110�, we use half the value of the flop
term from the angle, 75�. For the negative effect angle
215�, we specified to use the weighting for the 15� angle
multiplied by a factor 1.2..20
In this study, the instrumental evaluation is carried out
using two different strategies. On the one hand, the color
difference was calculated by using the measurement data
performed by the commercial multiangle spectrophotome-
ter BYK-mac. This is a device that measures the samples
by contact in six different geometries. This methodology
is called “direct measurement,” and it is the usual proce-
dure in the automotive sector.
On the other hand, a system consisting of the telespec-
troradiometer PR-650, and the directional lighting booth,
the byko-effect spectra cabinet (from BYK-Gardner)21
was used to obtain the real spectral color stimulus and
the corresponding colorimetric values of all samples with-
out contact, never used in the automotive sector, in spite
of having directional lighting booths in this sector. The
main advantage of this indirect system is that it collects
exactly what the observer would perceive, the PR-650 has
a telecentric lens, with a measuring area of 1� and the
distance to the spot area was about 55 cm. For this rea-
son, this methodology was called “(true) visual simu-
lation.” In addition, a reference white placed at the same
position as the samples was measured with the spectrora-
diometer to allow transformations to CIELAB color space
by means of the absolute XYZ values (in cd/m2), ena-
bling us to apply absolute colorimetry into relative color-
imetry as it is usual in color appearance models.22 The
byko-effect cabinet was selected owing to the fact that it
allowed measuring the same geometries of illumination/
observation that the BYK-mac. It is important to mention
that the luminaire of the byko-effect spectra cabinet is a
not a good D65 simulator if not it is closer to a D50 sim-
ulator.23,24 We referred to both methodologies as direct
measurement and visual simulation; however, it is impor-
tant to point out that both arise from different instru-
ments. But, obviously, the method described above can
be applied to other directional lighting booths, with or not
the same nominal geometries common with other multi-
angle spectrophotometers.
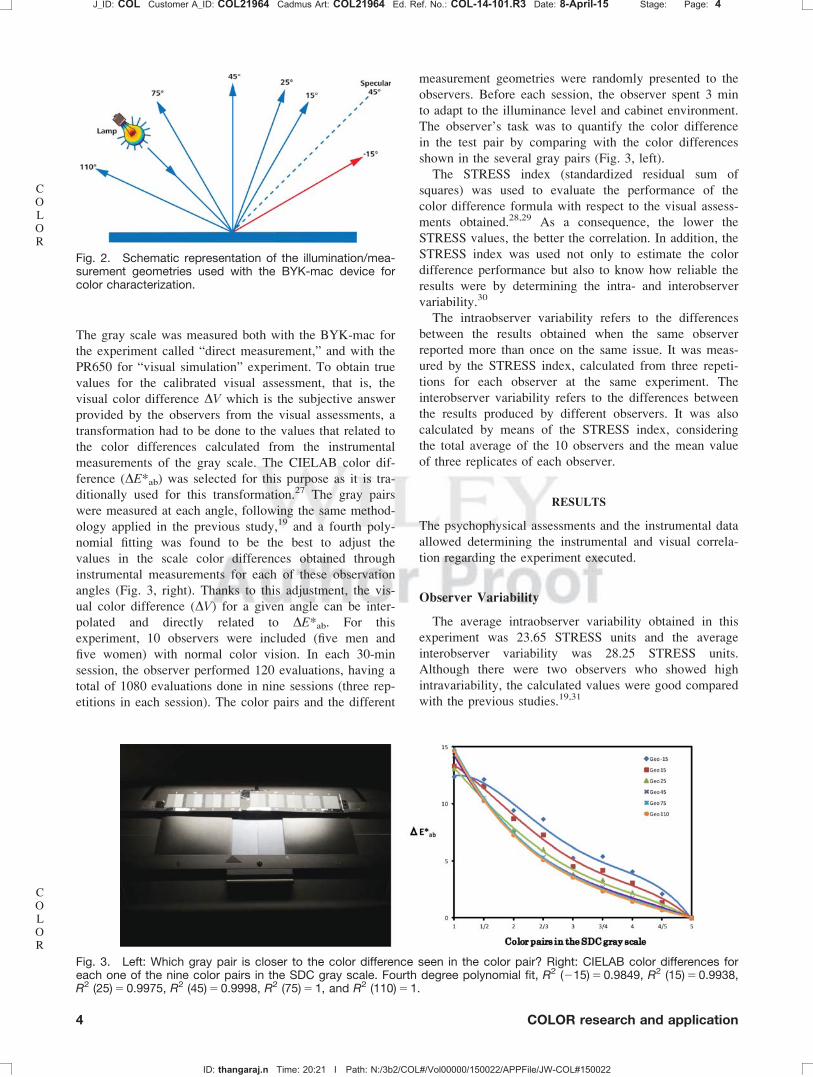
The measurement geometries used were fixed by the
multiangle spectrophotometer and the lighting booth:
45as-15, 45as15, 45as25, 45as45, 45as75, and 45as110,
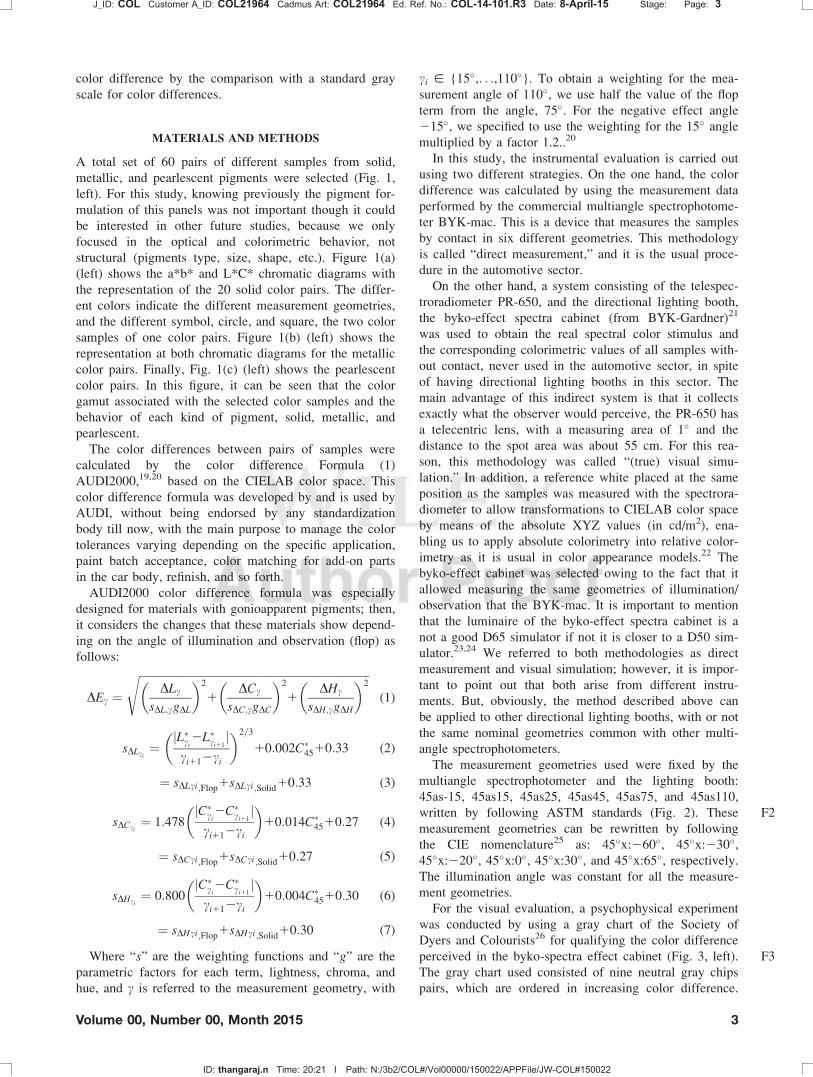
written by following ASTM standards (Fig. F22). These
measurement geometries can be rewritten by following
the CIE nomenclature25 as: 45�x:260�, 45�x:230�,45�x:220�, 45�x:0�, 45�x:30�, and 45�x:65�, respectively.
The illumination angle was constant for all the measure-
ment geometries.
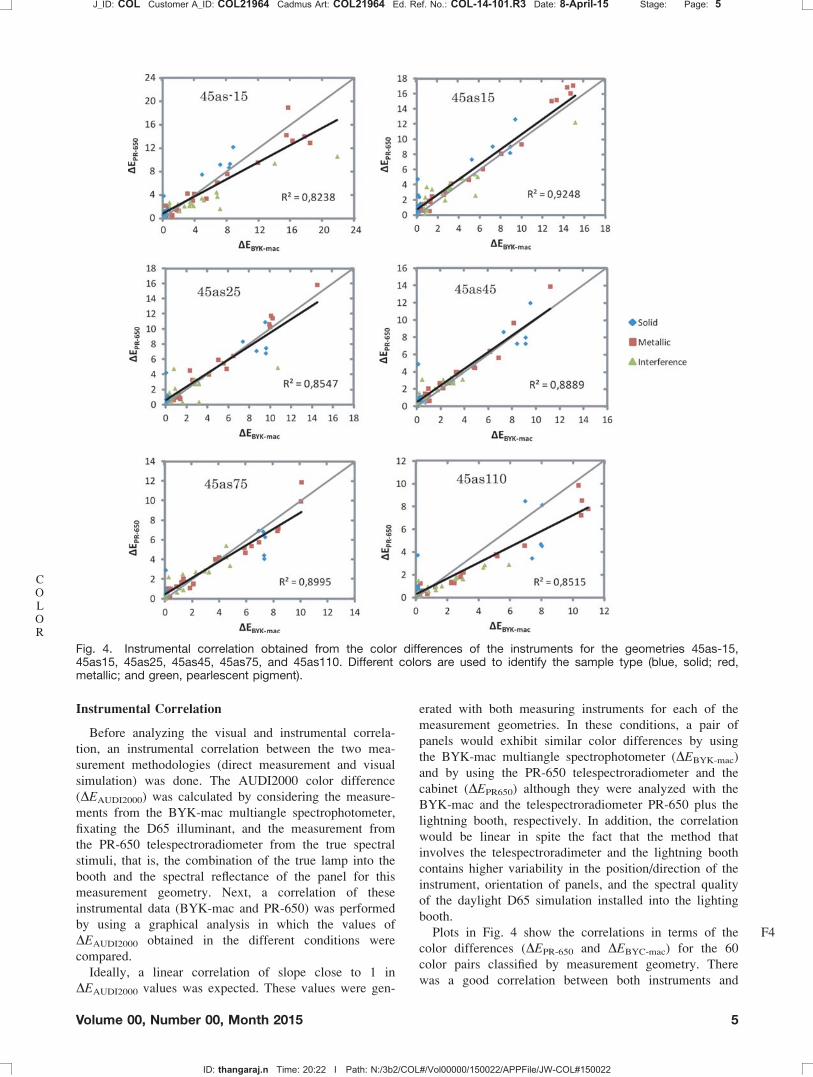
For the visual evaluation, a psychophysical experiment
was conducted by using a gray chart of the Society of
Dyers and Colourists26 for qualifying the color difference
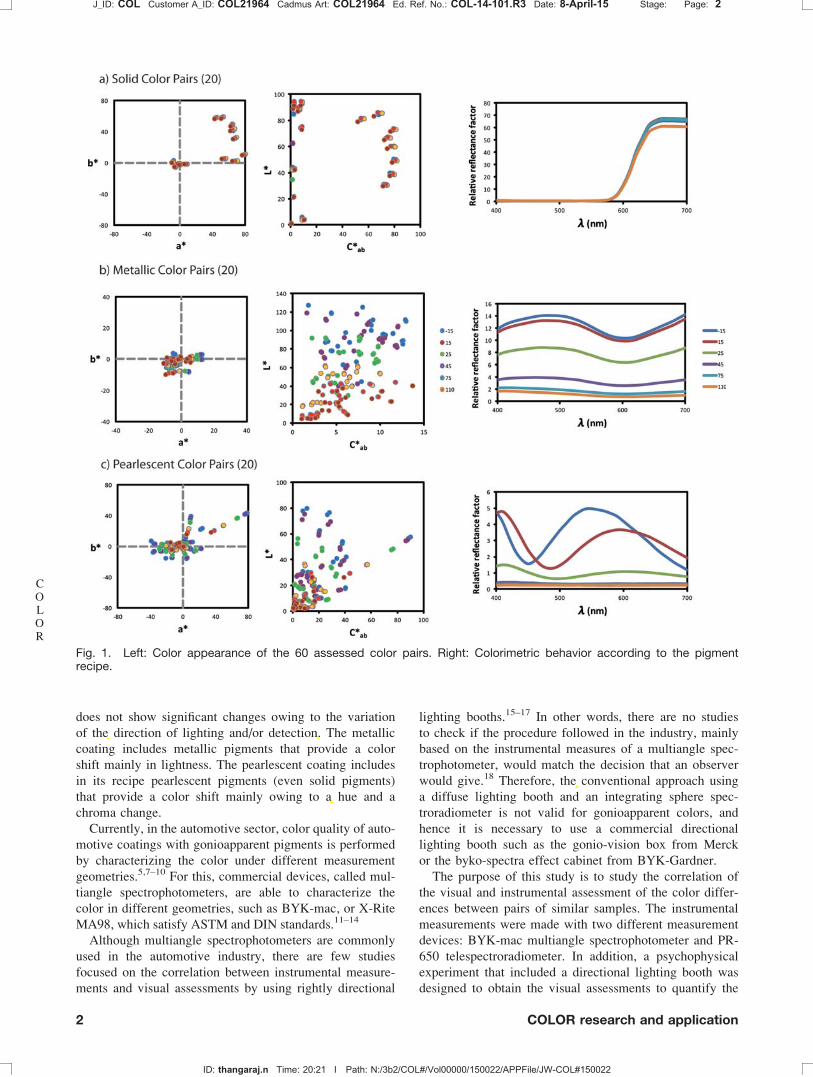
perceived in the byko-spectra effect cabinet (Fig. F33, left).
The gray chart used consisted of nine neutral gray chips
pairs, which are ordered in increasing color difference.
J_ID: COL Customer A_ID: COL21964 Cadmus Art: COL21964 Ed. Ref. No.: COL-14-101.R3 Date: 8-April-15 Stage: Page: 3
ID: thangaraj.n Time: 20:21 I Path: N:/3b2/COL#/Vol00000/150022/APPFile/JW-COL#150022
Volume 00, Number 00, Month 2015 3
The gray scale was measured both with the BYK-mac for
the experiment called “direct measurement,” and with the
PR650 for “visual simulation” experiment. To obtain true
values for the calibrated visual assessment, that is, the
visual color difference DV which is the subjective answer
provided by the observers from the visual assessments, a
transformation had to be done to the values that related to
the color differences calculated from the instrumental
measurements of the gray scale. The CIELAB color dif-
ference (DE*ab) was selected for this purpose as it is tra-
ditionally used for this transformation.27 The gray pairs
were measured at each angle, following the same method-
ology applied in the previous study,19 and a fourth poly-
nomial fitting was found to be the best to adjust the
values in the scale color differences obtained through
instrumental measurements for each of these observation
angles (Fig. 3, right). Thanks to this adjustment, the vis-
ual color difference (DV) for a given angle can be inter-
polated and directly related to DE*ab. For this
experiment, 10 observers were included (five men and
five women) with normal color vision. In each 30-min
session, the observer performed 120 evaluations, having a
total of 1080 evaluations done in nine sessions (three rep-
etitions in each session). The color pairs and the different
measurement geometries were randomly presented to the
observers. Before each session, the observer spent 3 min
to adapt to the illuminance level and cabinet environment.
The observer’s task was to quantify the color difference
in the test pair by comparing with the color differences
shown in the several gray pairs (Fig. 3, left).
The STRESS index (standardized residual sum of
squares) was used to evaluate the performance of the
color difference formula with respect to the visual assess-
ments obtained.28,29 As a consequence, the lower the
STRESS values, the better the correlation. In addition, the
STRESS index was used not only to estimate the color
difference performance but also to know how reliable the
results were by determining the intra- and interobserver
variability.30
The intraobserver variability refers to the differences
between the results obtained when the same observer
reported more than once on the same issue. It was meas-
ured by the STRESS index, calculated from three repeti-
tions for each observer at the same experiment. The
interobserver variability refers to the differences between
the results produced by different observers. It was also
calculated by means of the STRESS index, considering
the total average of the 10 observers and the mean value
of three replicates of each observer.
RESULTS
The psychophysical assessments and the instrumental data
allowed determining the instrumental and visual correla-
tion regarding the experiment executed.
Observer Variability
The average intraobserver variability obtained in this
experiment was 23.65 STRESS units and the average
interobserver variability was 28.25 STRESS units.
Although there were two observers who showed high
intravariability, the calculated values were good compared
with the previous studies.19,31
COLOR
Fig. 2. Schematic representation of the illumination/mea-surement geometries used with the BYK-mac device forcolor characterization.
COLOR
Fig. 3. Left: Which gray pair is closer to the color difference seen in the color pair? Right: CIELAB color differences foreach one of the nine color pairs in the SDC gray scale. Fourth degree polynomial fit, R2 (215) 5 0.9849, R2 (15) 5 0.9938,R2 (25) 5 0.9975, R2 (45) 5 0.9998, R2 (75) 5 1, and R2 (110) 5 1.
J_ID: COL Customer A_ID: COL21964 Cadmus Art: COL21964 Ed. Ref. No.: COL-14-101.R3 Date: 8-April-15 Stage: Page: 4
ID: thangaraj.n Time: 20:21 I Path: N:/3b2/COL#/Vol00000/150022/APPFile/JW-COL#150022
4 COLOR research and application
Instrumental Correlation
Before analyzing the visual and instrumental correla-
tion, an instrumental correlation between the two mea-
surement methodologies (direct measurement and visual
simulation) was done. The AUDI2000 color difference
(DEAUDI2000) was calculated by considering the measure-
ments from the BYK-mac multiangle spectrophotometer,
fixating the D65 illuminant, and the measurement from
the PR-650 telespectroradiometer from the true spectral
stimuli, that is, the combination of the true lamp into the
booth and the spectral reflectance of the panel for this
measurement geometry. Next, a correlation of these
instrumental data (BYK-mac and PR-650) was performed
by using a graphical analysis in which the values of
DEAUDI2000 obtained in the different conditions were
compared.
Ideally, a linear correlation of slope close to 1 in
DEAUDI2000 values was expected. These values were gen-
erated with both measuring instruments for each of the
measurement geometries. In these conditions, a pair of
panels would exhibit similar color differences by using
the BYK-mac multiangle spectrophotometer (DEBYK-mac)
and by using the PR-650 telespectroradiometer and the
cabinet (DEPR650) although they were analyzed with the
BYK-mac and the telespectroradiometer PR-650 plus the
lightning booth, respectively. In addition, the correlation
would be linear in spite the fact that the method that
involves the telespectroradimeter and the lightning booth
contains higher variability in the position/direction of the
instrument, orientation of panels, and the spectral quality
of the daylight D65 simulation installed into the lighting
booth.
Plots in Fig. F44 show the correlations in terms of the
color differences (DEPR-650 and DEBYC-mac) for the 60
color pairs classified by measurement geometry. There
was a good correlation between both instruments and
COLOR
Fig. 4. Instrumental correlation obtained from the color differences of the instruments for the geometries 45as-15,45as15, 45as25, 45as45, 45as75, and 45as110. Different colors are used to identify the sample type (blue, solid; red,metallic; and green, pearlescent pigment).
J_ID: COL Customer A_ID: COL21964 Cadmus Art: COL21964 Ed. Ref. No.: COL-14-101.R3 Date: 8-April-15 Stage: Page: 5
ID: thangaraj.n Time: 20:22 I Path: N:/3b2/COL#/Vol00000/150022/APPFile/JW-COL#150022
Volume 00, Number 00, Month 2015 5
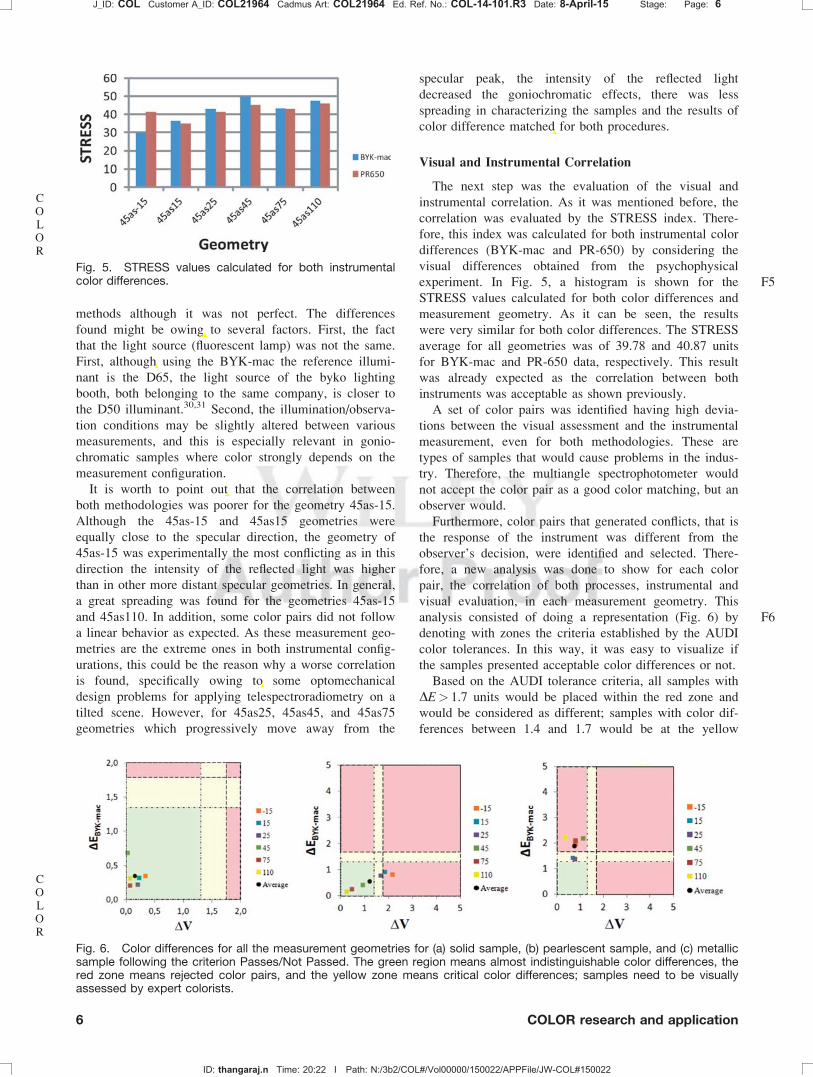
methods although it was not perfect. The differences
found might be owing to several factors. First, the fact
that the light source (fluorescent lamp) was not the same.
First, although using the BYK-mac the reference illumi-
nant is the D65, the light source of the byko lighting
booth, both belonging to the same company, is closer to
the D50 illuminant.30,31 Second, the illumination/observa-
tion conditions may be slightly altered between various
measurements, and this is especially relevant in gonio-
chromatic samples where color strongly depends on the
measurement configuration.
It is worth to point out that the correlation between
both methodologies was poorer for the geometry 45as-15.
Although the 45as-15 and 45as15 geometries were
equally close to the specular direction, the geometry of
45as-15 was experimentally the most conflicting as in this
direction the intensity of the reflected light was higher
than in other more distant specular geometries. In general,
a great spreading was found for the geometries 45as-15
and 45as110. In addition, some color pairs did not follow
a linear behavior as expected. As these measurement geo-
metries are the extreme ones in both instrumental config-
urations, this could be the reason why a worse correlation
is found, specifically owing to some optomechanical
design problems for applying telespectroradiometry on a
tilted scene. However, for 45as25, 45as45, and 45as75
geometries which progressively move away from the
specular peak, the intensity of the reflected light
decreased the goniochromatic effects, there was less
spreading in characterizing the samples and the results of
color difference matched for both procedures.
Visual and Instrumental Correlation
The next step was the evaluation of the visual and
instrumental correlation. As it was mentioned before, the
correlation was evaluated by the STRESS index. There-
fore, this index was calculated for both instrumental color
differences (BYK-mac and PR-650) by considering the
visual differences obtained from the psychophysical
experiment. In Fig. F55, a histogram is shown for the
STRESS values calculated for both color differences and
measurement geometry. As it can be seen, the results
were very similar for both color differences. The STRESS
average for all geometries was of 39.78 and 40.87 units
for BYK-mac and PR-650 data, respectively. This result
was already expected as the correlation between both
instruments was acceptable as shown previously.
A set of color pairs was identified having high devia-
tions between the visual assessment and the instrumental
measurement, even for both methodologies. These are
types of samples that would cause problems in the indus-
try. Therefore, the multiangle spectrophotometer would
not accept the color pair as a good color matching, but an
observer would.
Furthermore, color pairs that generated conflicts, that is
the response of the instrument was different from the
observer’s decision, were identified and selected. There-
fore, a new analysis was done to show for each color
pair, the correlation of both processes, instrumental and
visual evaluation, in each measurement geometry. This
analysis consisted of doing a representation (Fig. F66) by
denoting with zones the criteria established by the AUDI
color tolerances. In this way, it was easy to visualize if
the samples presented acceptable color differences or not.
Based on the AUDI tolerance criteria, all samples with
DE> 1.7 units would be placed within the red zone and
would be considered as different; samples with color dif-
ferences between 1.4 and 1.7 would be at the yellow
COLOR
Fig. 5. STRESS values calculated for both instrumentalcolor differences.
COLOR
Fig. 6. Color differences for all the measurement geometries for (a) solid sample, (b) pearlescent sample, and (c) metallicsample following the criterion Passes/Not Passed. The green region means almost indistinguishable color differences, thered zone means rejected color pairs, and the yellow zone means critical color differences; samples need to be visuallyassessed by expert colorists.
J_ID: COL Customer A_ID: COL21964 Cadmus Art: COL21964 Ed. Ref. No.: COL-14-101.R3 Date: 8-April-15 Stage: Page: 6
ID: thangaraj.n Time: 20:22 I Path: N:/3b2/COL#/Vol00000/150022/APPFile/JW-COL#150022
6 COLOR research and application
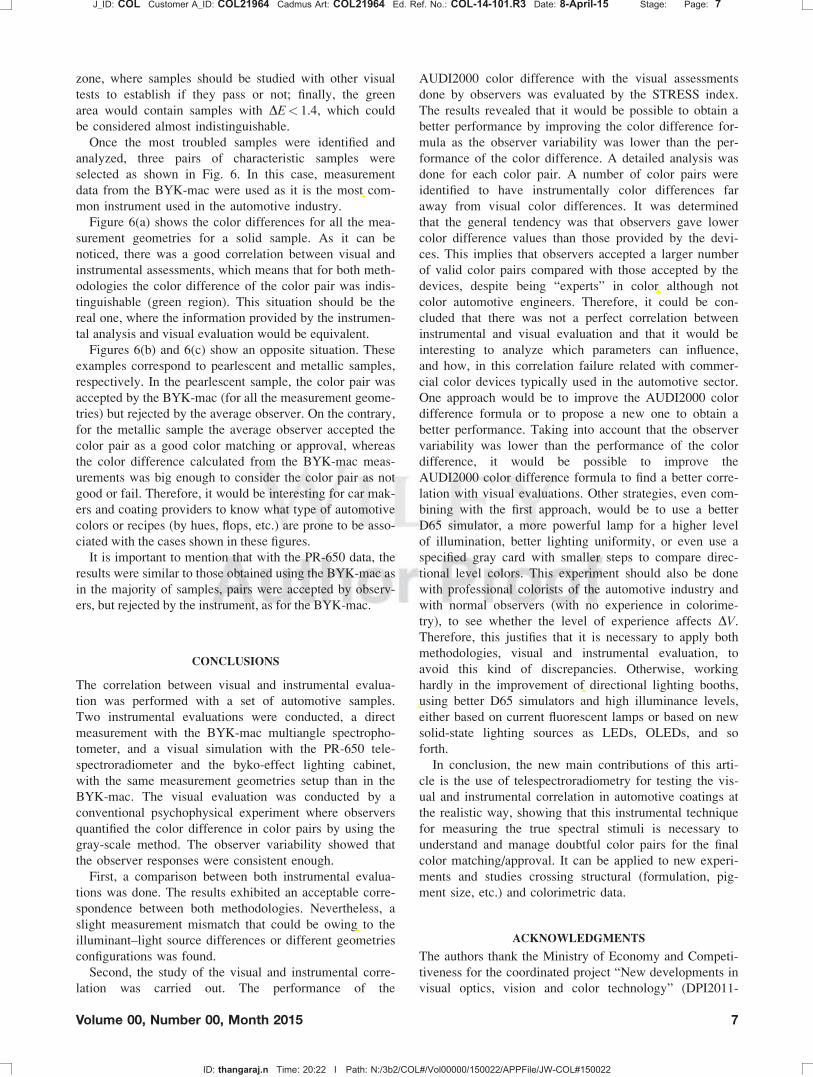
zone, where samples should be studied with other visual
tests to establish if they pass or not; finally, the green
area would contain samples with DE< 1.4, which could
be considered almost indistinguishable.
Once the most troubled samples were identified and
analyzed, three pairs of characteristic samples were
selected as shown in Fig. 6. In this case, measurement
data from the BYK-mac were used as it is the most com-
mon instrument used in the automotive industry.
Figure 6(a) shows the color differences for all the mea-
surement geometries for a solid sample. As it can be
noticed, there was a good correlation between visual and
instrumental assessments, which means that for both meth-
odologies the color difference of the color pair was indis-
tinguishable (green region). This situation should be the
real one, where the information provided by the instrumen-
tal analysis and visual evaluation would be equivalent.
Figures 6(b) and 6(c) show an opposite situation. These
examples correspond to pearlescent and metallic samples,
respectively. In the pearlescent sample, the color pair was
accepted by the BYK-mac (for all the measurement geome-
tries) but rejected by the average observer. On the contrary,
for the metallic sample the average observer accepted the
color pair as a good color matching or approval, whereas
the color difference calculated from the BYK-mac meas-
urements was big enough to consider the color pair as not
good or fail. Therefore, it would be interesting for car mak-
ers and coating providers to know what type of automotive
colors or recipes (by hues, flops, etc.) are prone to be asso-
ciated with the cases shown in these figures.
It is important to mention that with the PR-650 data, the
results were similar to those obtained using the BYK-mac as
in the majority of samples, pairs were accepted by observ-
ers, but rejected by the instrument, as for the BYK-mac.
CONCLUSIONS
The correlation between visual and instrumental evalua-
tion was performed with a set of automotive samples.
Two instrumental evaluations were conducted, a direct
measurement with the BYK-mac multiangle spectropho-
tometer, and a visual simulation with the PR-650 tele-
spectroradiometer and the byko-effect lighting cabinet,
with the same measurement geometries setup than in the
BYK-mac. The visual evaluation was conducted by a
conventional psychophysical experiment where observers
quantified the color difference in color pairs by using the
gray-scale method. The observer variability showed that
the observer responses were consistent enough.
First, a comparison between both instrumental evalua-
tions was done. The results exhibited an acceptable corre-
spondence between both methodologies. Nevertheless, a
slight measurement mismatch that could be owing to the
illuminant–light source differences or different geometries
configurations was found.
Second, the study of the visual and instrumental corre-
lation was carried out. The performance of the
AUDI2000 color difference with the visual assessments
done by observers was evaluated by the STRESS index.
The results revealed that it would be possible to obtain a
better performance by improving the color difference for-
mula as the observer variability was lower than the per-
formance of the color difference. A detailed analysis was
done for each color pair. A number of color pairs were
identified to have instrumentally color differences far
away from visual color differences. It was determined
that the general tendency was that observers gave lower
color difference values than those provided by the devi-
ces. This implies that observers accepted a larger number
of valid color pairs compared with those accepted by the
devices, despite being “experts” in color although not
color automotive engineers. Therefore, it could be con-
cluded that there was not a perfect correlation between
instrumental and visual evaluation and that it would be
interesting to analyze which parameters can influence,
and how, in this correlation failure related with commer-
cial color devices typically used in the automotive sector.
One approach would be to improve the AUDI2000 color
difference formula or to propose a new one to obtain a
better performance. Taking into account that the observer
variability was lower than the performance of the color
difference, it would be possible to improve the
AUDI2000 color difference formula to find a better corre-
lation with visual evaluations. Other strategies, even com-
bining with the first approach, would be to use a better
D65 simulator, a more powerful lamp for a higher level
of illumination, better lighting uniformity, or even use a
specified gray card with smaller steps to compare direc-
tional level colors. This experiment should also be done
with professional colorists of the automotive industry and
with normal observers (with no experience in colorime-
try), to see whether the level of experience affects DV.
Therefore, this justifies that it is necessary to apply both
methodologies, visual and instrumental evaluation, to
avoid this kind of discrepancies. Otherwise, working
hardly in the improvement of directional lighting booths,
using better D65 simulators and high illuminance levels,
either based on current fluorescent lamps or based on new
solid-state lighting sources as LEDs, OLEDs, and so
forth.
In conclusion, the new main contributions of this arti-
cle is the use of telespectroradiometry for testing the vis-
ual and instrumental correlation in automotive coatings at
the realistic way, showing that this instrumental technique
for measuring the true spectral stimuli is necessary to
understand and manage doubtful color pairs for the final
color matching/approval. It can be applied to new experi-
ments and studies crossing structural (formulation, pig-
ment size, etc.) and colorimetric data.
ACKNOWLEDGMENTS
The authors thank the Ministry of Economy and Competi-
tiveness for the coordinated project “New developments in
visual optics, vision and color technology” (DPI2011-
J_ID: COL Customer A_ID: COL21964 Cadmus Art: COL21964 Ed. Ref. No.: COL-14-101.R3 Date: 8-April-15 Stage: Page: 7
ID: thangaraj.n Time: 20:22 I Path: N:/3b2/COL#/Vol00000/150022/APPFile/JW-COL#150022
Volume 00, Number 00, Month 2015 7
30090-C02). Francisco Javier Burgos also thanks the
Autonomous Government of Catalonia for his predoctoral
fellowship grant and Omar G�omez to the Ministry of Econ-
omy and Competitiveness for his predoctoral fellowship
(FPI BES-2012-053080).
1. Brock T, Groteklaes M, Mischke P. European Coatings Handbook.
Hannover: Vincentz Network; 2010.
2. Streitberger HJ, D€ossel KF. Automotive Paints and Coatings, 2nd edi-
tion. Wienheim: Wiley-VCH; 2008.
3. ASTM E284-13b. Standard Terminology of Appearance. Consho-
hocken: American Society for Testing Materials.AQ3
4. Maile FJ, Pfaff G, Reynders P. Effect pigments—Past, present and
future. Prog Org Coat 2005;54:150–163.
5. Klein GA. Industrial Color Physics. New York: Springer; 2010.
6. Pfaff G. Special Effect Pigments, 2nd edition. Hannover: Vincentz Net-
work; 2008.
7. Chorro E, Mart�ınez-Verd�u F, campos J, Pons A. Colorimetric and spec-
tral evaluation of the optical anisotropy of metallic and pearlescent
samples. J Mod Opt 2009;56:1457–1465.
8. Schanda J. Colorimetry: Understanding the CIE System. New York:
John Wiley & Sons; 2007.
9. Baba G, Suzuki K. Gonio-spectrophotometric analysis of white and
chromatic reference materials. Anal Chim Acta 1999;380:173–182.
10. Kirchner EJJ, Ravi J. Setting tolerances on color and texture for auto-
motive coatings. Color Res Appl 2012;39:88–98.
11. DIN-6175-2. Tolerances for Automotive Paint. Part 2: Goniochromatic
Paints. Berlin, Germany: Deutsches Institut f€ur Normung; 2001.
12. ASTM E2194-12. Standard Practice for Multiangle Color Measurement
of Metal Flake Pigmented Materials. Conshohocken: American Society
for Testing Materials.
13. ASTM E2539-12. Standard Practice for Multiangle Color Measurement
of Interference Pigments. Conshohocken: American Society for Testing
Materials.
14. Perales E, Chorro E, Viqueira V, Martınez-Verdu FM. Reproducibility
comparison among multiangle spectrophotometers. Color Res Appl
2013;38:160–167.
15. Huang M, Chen G, Liu H, Cui G, Luo MR, Liao N, Melgosa M,
Zhang Y, Zheng C.A comparison of different psychophysical methods
for color-difference evaluation, in Proceedings AIC Colour 2013, New-
castle, UK; 2013.
16. G�omez O, Burgos FJ, Perales E, Chorro E, Viqueira V, Mart�ınez-
Verd�u FM, Pujol J. Preliminary comparative performance of the
AUDI2000 and CIEDE2000 color difference formulas by visual assess-
ments in directional lighting booth, in Proceedings AIC Colour 2013,
Vol. 4. Newcastle, UK; 2013. p 1545–1548.
17. Burgos FJ, Perales E, G�omez O, Chorro E, Viqueira V, Mart�ınez-
Verd�u FM, Pujol J. Instrumental and visual correlation between a
multiangle spectrophotometer and a directional lighting booth, in
Proceedings AIC Colour 2013, Vol. 4. Newcastle, UK; 2013. p 1373–
1376.
18. Longley WV. Automotive color certification. Color Res Appl 1995;20:
50–54.
19. Melgosa M, Mart�ınez-Garc�ıa J, G�omez-Robledo L, Perales E,
Mart�ınez-Verd�u FM, Dauser T. Measuring color differences in automo-
tive samples with lightness flop: A test of the audi2000 color-difference
formula. Opt Express 2014;22:3458–3467.
20. Dauser T. Audi Color Tolerance Formulas (Private communication).
2012.
21. Experience the byko-spectra effect. Available at: https://www.youtube.
com/watch?v=7j6oBkDKnjE.
22. Fairchild MD. Color Appearance Models, Published Online: 18 June
2013. DOI: 10.1002/9781118653128.ch20.
23. Perales E, Chorro E, Werner C, Viqueira V, G�omez O, Mart�ınez-Verd�uFM. Influence of spectral power distribution of light sources on the
color appearance of goniochromatic colours. CIE Centenary Confer-
ence, Paris; 2013.
24. Mart�ınez-Verd�u F, Perales E, Viqueira V, Chorro E, Burgos FJ, Pujol
J. Comparison of colorimetric features of some current lighting booths
for obtaining a right visual and instrumental correlation for gonio-
apparent coatings and plastics. Proceedings of CIE 2012 Lighting Qual-
ity and Energy Efficiency. 2012. p 692–705.
25. 25. Commission Internationale de l’�Eclairage (CIE), Colorimetry, 3rd
edition. CIE Publication 15:2004, Vienna: CIE Central Bureau, 2004.
26. http://www.sdcenterprises.co.uk/products/sdc-assessment-aids/grey-scale/
See also ISO 105–A02:1993. Test for colour fastness—Part A02: Gray
scale for assessing change in colour. Geneva, Switzerland: International
Organization for Standardization.
27. Guan SS, Luo MR. Investigation of parametric effects using small col-
our differences. Color Res Appl 1999;24:331–343.
28. Garc�ıa PA, Huertas R, Melgosa M, Cui G. Measurement of the rela-
tionship between perceived and computed color differences. J Opt Soc
Am A 2007;24:1823–1829.
29. Kirchner E, Dekker N. Performance measures of color-difference equa-
tions: Correlation coefficient versus standardized residual sum of
squares. J Opt Soc Am A 2011;28:1841–1848.
30. Melgosa M, Garc�ıa PA, G�omez-Robledo L, Shamey R, Hinks D, Cui
G, Luo MR. Notes on the application of the standardized residual sum
of squares index for the assessment of intra- and inter-observer variabil-
ity in color difference experiments. J Opt Soc Am A 2011;28:949–953.
31. Huang M, Liu H, Cui G, Luo MR, Melgosa M. Evaluation of threshold
color differences using printed samples. J Opt Soc Am A 2012;29:
883–891.
J_ID: COL Customer A_ID: COL21964 Cadmus Art: COL21964 Ed. Ref. No.: COL-14-101.R3 Date: 8-April-15 Stage: Page: 8
ID: thangaraj.n Time: 20:22 I Path: N:/3b2/COL#/Vol00000/150022/APPFile/JW-COL#150022
8 COLOR research and application
AQ1: Please confirm that all author names are OK and are set with first name first, surname last.
AQ2: Please provide division/department for the given affiliations.
AQ3: Please provide the year of publication for Refs. 3, 12, 13.
AQ4: Please confirm that given names (red) and surnames/family names (green) have been identified correctly.
J_ID: COL Customer A_ID: COL21964 Cadmus Art: COL21964 Ed. Ref. No.: COL-14-101.R3 Date: 8-April-15 Stage: Page: 9
ID: thangaraj.n Time: 20:22 I Path: N:/3b2/COL#/Vol00000/150022/APPFile/JW-COL#150022