Embed Size (px)
Citation preview


Visi t or Services Projec t
Joshua Tree Na t ional Monument
Margaret Littlejohn
Repor t 3 9
November 1991
Ms. Margaret Littlejohn is VSP Western Coordinator, National Park Service
based at the Cooperative Park Studies Unit, University of Idaho. I thank Sarah Murphy-Scher, Harriet Darley, Rick McIntyre and staff at Joshua Tree National Monument fortheir assistance with this study. The VSP acknowledges the Public Opinion Lab of theSocial and Economic Sciences Research Center, Washington State University for itstechnical assistance.

Visi t or Services Projec t
Joshua Tree Na t ional Monumen t
Re p or t Sum m ar y
• This report describes the results of a visitor study at Joshua Tree National Monumentduring April 18-24, 1991. A total of 492 questionnaires were distributed and 409returned, an 83% response rate.
• This report profiles Joshua Tree visitors. A separate appendix has their commentsabout the park and their visit. A summary of these comments is included in this reportand the appendix.
• Visitors were commonly families (44%) or friends (31%); often in groups of two(51%). Thirty-three percent of visitors were 26-40 years old. Most (53%) wererepeat visitors to Joshua Tree.
• Visitors from foreign countries comprised 13% of the total visitation and commonlycame from Germany (42%), Canada (22%) and Great Britain (13%). Americanscame from California (76%) with smaller numbers from many other states.
• Sixty-eight percent of the visitors spent less than one day in the park. Most visitorsviewed scenery (87%) and visited the visitor center (54%). At Joshua Tree, mostvisitors went to Jumbo Rocks, Cholla Cactus Garden, Hidden Valley and CottonwoodSprings. More of the visitors stopped first at the Oasis Visitor Center, Hidden Valleyand Cottonwood Springs.
• Many visitors entered at the Joshua Tree (west) entrance (40%) and exited there(39%). A majority (52%) relied on previous visits as their information source aboutthe monument. One-third (34%) of visitors had never visited the Oasis Visitor Center;36% had visited once. Most (84%) came to view/study scenery, plants, and wildlife.
• The most used interpretive/visitor service was the park brochure/map. Rangerassistance was the most important and best quality service which visitors rated.
• The most used maintenance service was the paved roads. Campgrounds, restrooms,trails and garbage disposal were the most important maintenance services. Trails,garbage disposal, visitor center buildings and picnic areas were the highest qualityservices, according to visitors.
• Of those reporting expenditures during their visit, the average visitor group spent $72.00 in the Joshua Tree area; the average per capita expenditure was $31.00.
• Most visitors (71%) watched rock climbing activities during their visit. Eightypercent of them enjoyed watching. They made many additional comments.
__________
For more information about the Visitor Services Project, please contact Dr. Gary E.Machlis, Sociology Project Leader, University of Idaho Cooperative Park Studies Unit,College of Forestry, Wildlife and Range Sciences, Moscow, Idaho 83843 or call (208)885-7129.
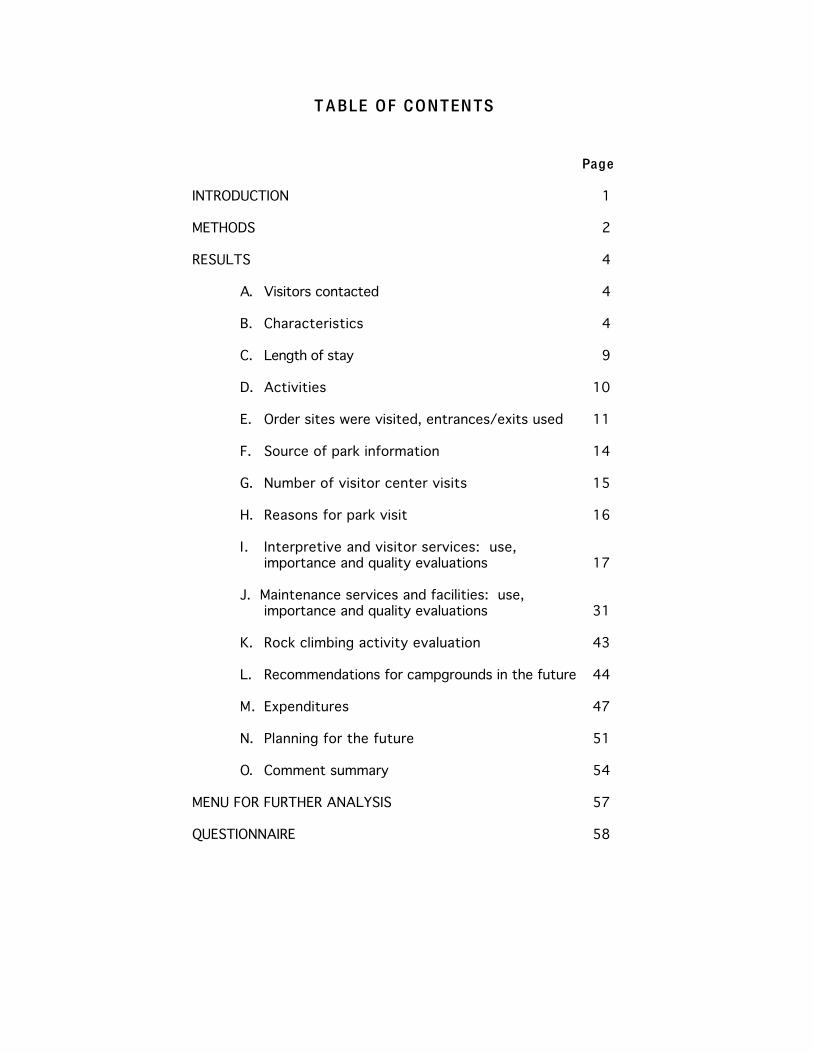
T ABLE OF CONTENTS
Page
INTRODUCTION 1
METHODS 2
RESULTS 4
A. Visitors contacted 4
B. Characteristics 4
C. Length of stay 9
D. Activities 10
E. Order sites were visited, entrances/exits used 11
F. Source of park information 14
G. Number of visitor center visits 15
H. Reasons for park visit 16
I. Interpretive and visitor services: use,importance and quality evaluations 17
J. Maintenance services and facilities: use,importance and quality evaluations 31
K. Rock climbing activity evaluation 43
L. Recommendations for campgrounds in the future 44
M. Expenditures 47
N. Planning for the future 51
O. Comment summary 54
MENU FOR FURTHER ANALYSIS 57
QUESTIONNAIRE 58

1
INTRODUCTION
This report describes the results of a study of visitors at Joshua Tree National
Monument (referred to as "Joshua Tree"). This visitor study was conducted April 18-
24, 1991 by the National Park Service (NPS) Visitor Services Project (VSP), part of
the Cooperative Park Studies Unit at the University of Idaho.
A Methods section discusses the procedures and limitations of the study. The
Results section follows, including a summary of visitor comments. Next, a Menu for
Further Analysis helps managers request additional analyses. The final section has a
copy of the Questionnaire. The separate appendix includes a comment summary and the
visitors' unedited comments.
Many of this report's graphs resemble the example below. The large numbers
refer to explanations following the graph.
SAMPLE ONLY
0 25 50 75 100
First visit
2-4 visits
5-9 visits
10 or more visits
N=250 individuals
40%
30%
20%
10%
Figure 4 : Num b er o f v isi t s
Times visited
Number of individuals
1
2
3
4
5
1: The figure title is a general description of the graph's information.
2: A note above gives the 'N', or number of cases in the sample, and a specific description of
the information in the chart. Use C A U TIO N when interpreting any data where the sample
size is less than 30 as the results may be unreliable.
3: Vertical information describes categories.
4: Horizontal information shows the item number in each category; proportions may be shown.
5: In most graphs, percentages are included to provide additional explanation.

2
METHODS
General s t ra t egy
Interviews were conducted and questionnaires distributed to a sample of selected
visitors entering Joshua Tree during April 18-24, 1991. Visitors completed the
questionnaire during or after their trip and then returned it by mail.
Quest ionnaire design and adminis t ra t ion
The questionnaire design used the standard format of previous Visitor Services
Project studies. See the end of this report for a copy of the questionnaire.
Visitors were sampled using a selected interval as they entered Joshua Tree at the
main park entrances: West (Joshua Tree), North (Twentynine Palms) and South
(Cottonwood) entrances. In this report, the entrances are referred to by the names in
the parentheses.
Visitor groups were greeted, briefly introduced to the purpose of the study and
asked to participate. If visitors agreed, the interview took approximately two minutes.
These interviews included determining group size and the age of the adult who would
complete the questionnaire. This individual was asked his or her name, address and
telephone number for the later mailing of a reminder-thank you postcard.
Da t a analysis
Two weeks following the survey, a reminder-thank you postcard was mailed to
all participants. Replacement questionnaires were mailed to participants who had not
returned their questionnaires four weeks after the survey. Returned questionnaires
were coded and entered into a computer. Frequency distributions and cross-tabulations
were calculated using a standard statistical software package. Respondents' comments
were summarized.
Sample si z e , missing da t a and repor t ing errors
This study collected information on both visitor groups and individual group
members. Thus, the sample size ("N"), varies from figure to figure. For example,
while Figure 1 shows information for 399 groups, Figure 3 presents data for 1053
individuals. A note above each figure's graph specifies the information illustrated.
Occasionally, a respondent may not have answered all of the questions, or may
have answered some incorrectly. Unanswered questions create missing data and cause

3
the number in the sample to vary from figure to figure. For example, although 409
questionnaires were returned, Figure 1 shows data for only 399 respondents.
Questions answered incorrectly due to carelessness, misunderstanding directions
and so forth, turn up in the data as reporting errors. These create small data
inconsistencies.
Limi t a t ions
Like all surveys, this study has limitations which should be considered when
interpreting the results.
1. It is not possible to know whether visitor responses reflect actual behavior.
This disadvantage applies to all such studies and is reduced by having visitors fill out the
questionnaire as they visit the park.
2. The data reflect visitor use patterns of visitors to the selected sites during the
study period of April 18-24, 1991. The results do not necessarily apply to visitors
using other sites in the park or to visitors during other times of the year.
3. Caution is advised when interpreting any data with a sample size of less than
30, as the results may be unreliable. Whenever the sample size is less than 30, the
word "C A UTIO N" is included in the graph, figure or table.


5
0 50 100 150 200 250
1
2
3
4
5
6-10
11+
Group
size
N=399 visitor groups
4%
4%
4%
13%
12%
51%
12%
Number of respondents
Figure 1 : V isi t o r g roup si z es
0 50 100 150 200
Alone
Family
Friends
Family and friends
Guided tour group
Other
<1%
3%
8%
31%
44%
13%
N=396 visitor groups;
percentages do not equal 100 due to rounding.
Group type
Number of respondents
Figure 2 : V isi t or group t y p es

6
0 20 40 60 80 100 120 140
10 or younger
11-15
16-20
21-25
26-30
31-35
36-40
41-45
46-50
51-55
56-60
61-65
66-70
71-75
76 or older
N=1053 individuals;percentages do not equal 100 due to rounding.
4%
4%
8%
9%
6%
5%
5%
9%10%
10%
13%
8%
2%
3%5%
Age group
(years)
Number of respondents
Figure 3 : V isi t o r a g es
0 100 200 300 400 500
First visit
2-4 visits
5-9 visits
10 or more visits
Times
visited
N=921 individuals
15%
10%
28%
47%
Number of individuals
Figure 4 : Num b er o f v isi t s

7
Map 1 : Pro p or t ion o f f o re ign v isi t o rs b y coun t ry
T a ble 2 : Pro p or t ion o f v isi t o rs f ro m f o re ign coun t riesN=123 individuals from foreign countries
Coun t ry Number o f % o f foreign in d iv id u a ls v is i t o rs Germany 52 42Canada 27 22Great Britain 16 13Switzerland 10 8Holland 6 5Austria 4 3Italy 3 2Israel 2 2Australia 1 1France 1 1Yugoslavia 1 1

8
Ma p 2 : Pro p or t ion o f v isi t o rs f ro m e ach s t a t e
T a ble 3 : Pro p or t ion o f v isi t o rs f ro m e ach s t a t eN=827 individuals;
percentages do not equal 100 due to rounding.
State Number o f % of in d iv id u a ls v isi t o rs California 632 76
New York 17 2
Colorado 16 2
Arizona 10 1
Florida 9 1
Massachusetts 9 1
Washington 9 1
Pennsylvania 8 1
Connecticut 7 1
Illinois 7 1
Michigan 7 1
Vermont 7 1
Texas 6 1
Kansas 5 1
Maryland 5 1
North Carolina 5 1
Nevada 5 1
Oregon 5 1
Wyoming 5 1
Other states/D.C. (23) 53 6

9
C. Leng t h o f s t a y
Sixty-eight percent of the visitors spent less than one day at Joshua Tree, while
16% spent two days, as in Figure 5. Another 16% spent 3 days or more. In Figure 6,
65% of the visitors who stayed less than one day spent three to six hours. Nine percent
spent 9-21 hours.
0 50 100 150 200 250 300
<1
1
2
3
4
5
6 or more
N=400 visitor groups;
2%
3%
6%
16%
68%
1%
Days
stayed
5%
percentages do not equal 100 due to rounding.
Number of respondents
Figure 5 : Leng t h o f s t a y b y Joshua T re e v isi t ors
0 10 20 30 40 50 60 70
1
2
3
4
5
6
7
8
9 or more
N=270 visitor groups
Hours
stayed
9%
6%
3%
13%
13%
25%
14%
12%
5%
Number of respondents
Figure 6 : Leng t h o f s t a y b y v isi t ors who sp en tless t han one da y a t Joshua T re e

10
D. A c t iv i t ies
Figure 7 shows the proportion of visitor groups who participated in each activity
during their visit. Common activities were sightseeing (87%), visiting the visitor
center (54%), and walking nature trails (49%). Twenty-two percent of the visitors
described "other" activities they pursued including photography, viewing/studying
wildflowers, driving through, birdwatching and many other activities.
0 100 200 300 400
Other
Horseback ride
Backpack overnight
Attend rgr.-led prog.
Bike
Technical climb
Day hike crosscountry
Camp
Boulder scramble
Visit hist./archeo. sites
Day hike on trails
Picnic
Walk nature trails
Visit visitor center
Sightsee
Activity
87%
54%
49%
22%
36%
30%
9%
27%
28%
30%
2%
12%
2%
N=409 visitor groups;
percentages do not equal 100 because
visitors could do more than one activity.
4%
0%
Number of respondents
Figure 7 : Pro p or t ion o f v isi t o r g roups par t icipa t ing in e achac t iv i t y


13
Visitors most frequently first entered the park through the Joshua Tree entrance
(40%) or Twentynine Palms entrance (36%), as shown in Figure 8. Figure 9 shows
that most visitors' last exit from the park was through the Joshua Tree entrance (39%)
or Cottonwood Spring entrance (35%). "Other" exits used included the Geology Tour
Road and 49 Palms area.
0 50 100 150 200
Other
Indian Cove
Black Rock Canyon
Cottonwood Spring
Twentynine Palms
Joshua Tree
Entrance
used
40%
2%
2%
36%
20%
N=402 visitor groups;
percentages do not equal 100 due to rounding.
<1%
Number of respondents
Figure 8 : Loca t ions wh ere v isi t o rs f irs t e n t e re d Joshua T re e
0 50 100 150 200
Other
Indian Cove
Black Rock Canyon
Twentynine Palms
Cottonwood Spring
Joshua Tree
Exit
used
39%
2%
1%
35%
22%
N=399 visitor groups
1%
Number of respondents
Figure 9 : Loca t ions where v isi t o rs las t exi t e d Joshua T re e

14
F . Sourc e o f p ark in f o rm a t ion
The most often used source of information about the monument was previous
visit(s) (52%), as shown in Figure 10. Other sources included advice from friends or
relatives (38%) and maps (34%). The least used source was written inquiries to the
monument (1%). "Other" sources included climbing guides/magazines, motel/hotel
information, and an auto club.
0 50 100 150 200 250
Other
Written inquiry
Telephone inquiry
No info before visit
Newspaper/mag. article
Travel guide/tour book
Maps
Advice-friends/relatives
Previous visit(s)
N=409 visitor groups;
percentages do not equal 100 because
visitors could list more than one info source.
52%
38%
34%
14%
28%
11%
5%
1%
11%
Information
source
Number of respondents
Figure 1 0 : Source o f in f orma t ion ab ou t Joshua T re e

15
G. Num b er o f v isi t o r c e n t e r v isi t s
Visitors were asked the number of times they had visited the Oasis Visitor
Center, including this visit. Over one-third (36%) said they had visited once, and over
one-third (34%) had never visited the Oasis Visitor Center (see Figure 11).
0 20 40 60 80 100 120 140
Have never visited
One visit
2-4 visits
5-9 visits
10 or more visits
N=393 visitor groups;
36%
18%
7%
6%
percentages do not equal 100 due to rounding.
Times
visited
34%
Number of individuals
Figure 1 1 : Num b er o f v isi t o r c e n t e r v isi t s

16
H. Re asons f o r p ark v isi t
Visitors were asked to select their reasons for visiting Joshua Tree from a list
provided to them. Eight-four percent said they came to view/study scenery, plants, and
wildlife (see Figure 12). Smaller number of visitors listed participating in recreation
(43%), and view or studying cultural/historical sites (22%) as their reasons for
visiting. Twenty-one percent listed "other" reasons for coming including to photograph,
picnic, see wildflowers, drive through and many others.
0 100 200 300 400
Other
View/study
cultural/historical sites
Participate in recreation
View/study scenery,
plants, wildlife
N=409 visitor groups;
84%
43%
22%
21%
percentages do not equal 100 because
visitors could list more than one reason.
Reasons for
visiting
Number of respondents
Figure 1 2 : Re asons f or v isi t ing Joshua T re e

17
I. In t e rpre t iv e and v isi t o r se rv ic es: use , im p or t anc eand quali t y e valua t ions
The most commonly used interpretive or visitor services were the park
brochure/map (83%) and the park entrance station personnel (58%), as shown in
Figure 13. The least used services were the Keys Ranch tour and volunteer/ranger-led
programs, each at 4%.
0 100 200 300 400
VIP/rgr.-led programs
Keys Ranch tour
Backcountry reg. boards
Geology Tour Road
Ranger assistance
Other info brochures
VC exhibits/slide show
VC sales publs.
Park newspaper
VC personnel
Roadside exhibits
Self-guided nature trails
Park entr. sta. personnel
Park brochure/map
N=409 visitor groups;
34%
83%
25%
23%
40%
4%
Service
used
12%
44%
8%
4%
48%
58%
19%
6%
percentages do not equal 100 because
visitors could use more than one service.
Number of respondents
Figure 1 3 : Use o f in t e rpre t iv e and v isi t o r se rv ic es
18
Visitors rated the importance and quality of interpretive and visitor services
they used. Visitors rated the services' importance on a five point scale: 1=extremely
important, 2=very important, 3=moderately important, 4=somewhat important, and
5=not important. Visitors also used a five point scale to rate the quality of the services
they used: 1=very good, 2=good, 3=average, 4=poor, and 5=very poor.
Figure 14 shows the average importance and quality rating for each service.
Services were all rated above average in importance and quality. Some services were
not rated by enough visitors to provide reliable results. Ranger assistance, the park
brochure/map, visitor center personnel and entrance station personnel were the most
important services; ranger assistance, visitor center personnel, and entrance station
personnel were the highest quality services.
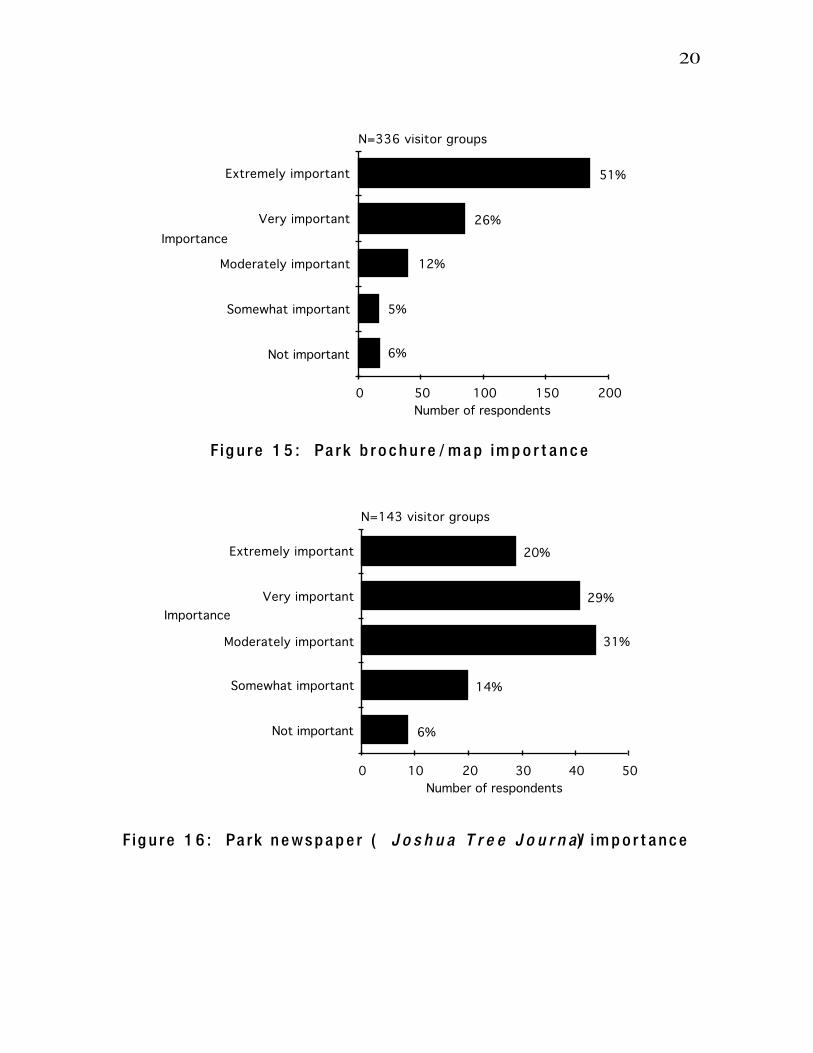
Figures 15-25 show that several services received the highest "very important"
to "extremely important" ratings: Geology tour road, ranger assistance, park
brochure/map, and visitor center personnel. Services receiving the highest "somewhat
important" to "not important" ratings were the park newspaper, visitor center
exhibits/slide show and roadside exhibits. Too few visitors rated the importance of
volunteer/ranger-led programs, Keys Ranch tours, and backcountry registration boards
to provide reliable information, so those graphs are not included.
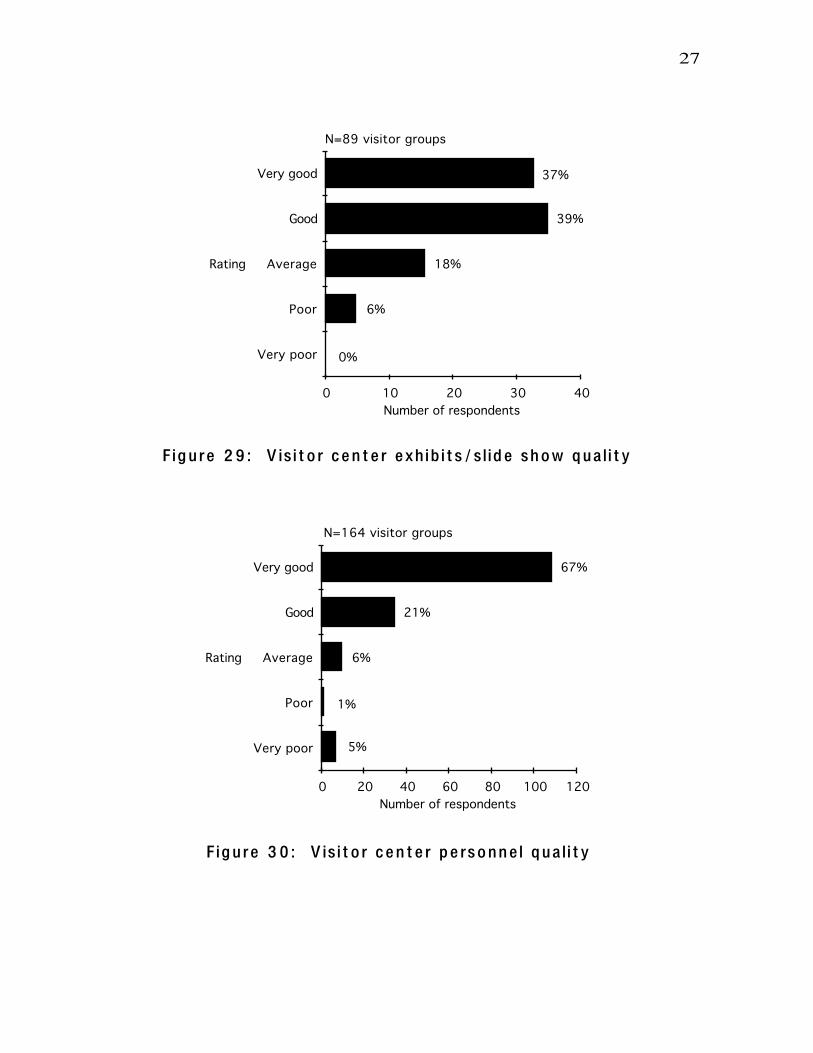
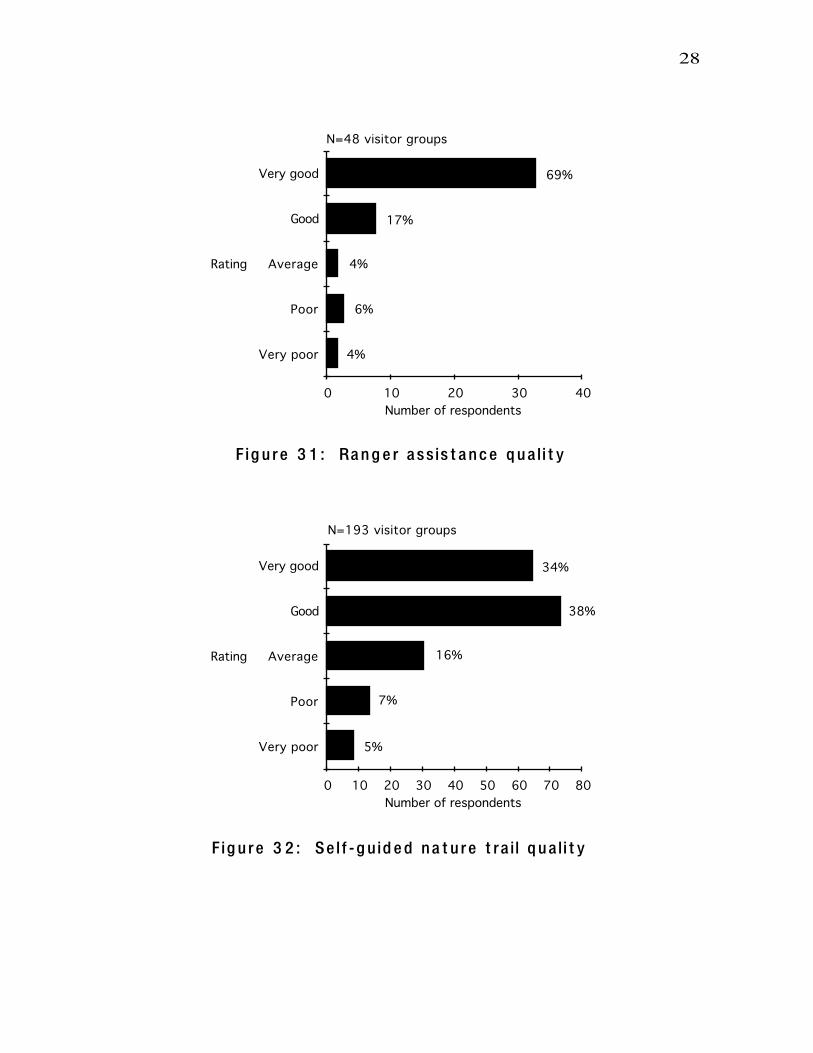
Figures 26-35 show that several services were given high "good" to "very good"
ratings: visitor center personnel, ranger assistance and entrance station personnel. The
service receiving the highest "poor" to "very poor" quality ratings was roadside exhibits.
Too few visitors rated the quality of volunteer/ranger-led programs, Keys Ranch tours,
geology tour road, and backcountry registration boards to provide reliable information,
so those graphs are not included.

19
5 4 3 2 1
2
1
4
5
V er y Im p or t an t
No t Impor t an t
V e r y Good Quali t y
•
brochure/map
•park
newspaper
•
•
•
•
•
• v.c. sales
publications
v.c. exhibits
v.c. personnel
ranger assistanceself-guided nature trails
roadside exhibits
•
•entr. sta. personnelother info brochures
V ery Po or Quali t y
Figure 1 4 : A v erag e ra t ings o f se rv ice imp or t ance and quali t y
C A U TIO N : T h e in t e r p r e t i v e a n d v is i t o r s e r v ic e s n o t in c lu d e d in t h e a b o v eg r a p h w e r e r a t e d b y t o o f e w v is i t o r s t o p r o v i d e r e l i a b l e r e s u l t s .
20
0 50 100 150 200
Not important
Somewhat important
Moderately important
Very important
Extremely important
N=336 visitor groups
Importance
51%
26%
12%
5%
6%
Number of respondents
Figure 1 5 : Park b rochure / map im p or t anc e
0 10 20 30 40 50
Not important
Somewhat important
Moderately important
Very important
Extremely important
N=143 visitor groups
Importance
20%
29%
31%
14%
6%
Number of respondents
Figure 1 6 : Park newspap er ( J o s h u a T r e e J o u r n a l) impor t ance

21
0 5 10 15 20 25 30
Not important
Somewhat important
Moderately important
Very important
Extremely important
N=92 visitor groups
Importance
32%
27%
27%
9%
5%
Number of respondents
Figure 1 7 : V isi t o r cen t e r sales publica t ion imp or t ance
0 10 20 30 40
Not important
Somewhat important
Moderately important
Very important
Extremely important
N=102 visitor groups;
Importance
percentages do not equal 100 due to rounding.
28%
32%
25%
10%
6%
Number of respondents
Figure 1 8 : V isi t o r cen t e r exhibi t s / slid e show imp or t ance

22
0 20 40 60 80 100
Not important
Somewhat important
Moderately important
Very important
Extremely important
N=166 visitor groups
Importance
51%
24%
13%
7%
5%
Number of respondents
Figure 1 9 : V isi t o r c en t e r p e rsonnel im p or t anc e
0 5 10 15 20 25 30
Not important
Somewhat important
Moderately important
Very important
Extremely important
N=51 visitor groups;
Importance
percentages do not equal 100 due to rounding.
59%
20%
14%
4%
4%
Number of respondents
Figure 2 0 : Rang er assis t anc e im p or t anc e

23
0 10 20 30 40 50 60 70 80
Not important
Somewhat important
Moderately important
Very important
Extremely important
N=193 visitor groups;
Importance
percentages do not equal 100 due to rounding.
38%
35%
14%
7%
7%
Number of respondents
Figure 2 1 : Sel f - guid e d na t ure t rail imp or t ance
0 2 4 6 8 10 12 14
Not important
Somewhat important
Moderately important
Very important
Extremely important
N=30 visitor groups;
Importance
percentages do not equal 100 due to rounding.
37%
43%
13%
3%
3%
Number of respondents
Figure 2 2 : Ge olog y t our road impor t ance

24
0 10 20 30 40 50 60
Not important
Somewhat important
Moderately important
Very important
Extremely important
N=179 visitor groups
Importance
28%
30%
27%
9%
6%
Number of respondents
Figure 2 3 : Roadsid e exhibi t impor t ance
0 5 10 15 20 25 30
Not important
Somewhat important
Moderately important
Very important
Extremely important
N=80 visitor groups
Importance
30%
36%
24%
4%
6%
Number of respondents
Figure 2 4 : O t her in f orma t ional b rochures im p or t ance

25
0 20 40 60 80 100 120
Not important
Somewhat important
Moderately important
Very important
Extremely important
N=238 visitor groups;
Importance
percentages do not equal 100 due to rounding.
45%
26%
18%
6%
6%
Number of respondents
Figure 2 5 : Park e n t ranc e s t a t ion p e rsonnel im p or t anc e
0 20 40 60 80 100 120 140
Very poor
Poor
Average
Good
Very good
N=326 visitor groups;
percentages do not equal 100 due to rounding.
42%
34%
15%
5%
5%
Rating
Number of respondents
Figure 2 6 : Park brochure / map quali t y

26
0 10 20 30 40 50 60
Very poor
Poor
Average
Good
Very good
N=137 visitor groups
39%
35%
21%
3%
2%
Rating
Number of respondents
Figure 2 7 : Park newspap er ( J o s h u a T r e e J o u r n a l) quali t y
0 10 20 30 40 50
Very poor
Poor
Average
Good
Very good
N=99 visitor groups
49%
29%
16%
4%
2%
Rating
Number of respondents
Figure 2 8 : V isi t or cen t e r sales publica t ion quali t y
27
0 10 20 30 40
Very poor
Poor
Average
Good
Very good
N=89 visitor groups
37%
39%
18%
6%
0%
Rating
Number of respondents
Figure 2 9 : V isi t or cen t e r exhibi t s / slid e show quali t y
0 20 40 60 80 100 120
Very poor
Poor
Average
Good
Very good
N=164 visitor groups
67%
21%
6%
1%
5%
Rating
Number of respondents
Figure 3 0 : V isi t or cen t e r p e rsonnel quali t y
28
0 10 20 30 40
Very poor
Poor
Average
Good
Very good
N=48 visitor groups
69%
17%
4%
6%
4%
Rating
Number of respondents
Figure 3 1 : Rang er assis t anc e quali t y
0 10 20 30 40 50 60 70 80
Very poor
Poor
Average
Good
Very good
N=193 visitor groups
34%
38%
16%
7%
5%
Rating
Number of respondents
Figure 3 2 : Sel f -guid e d na t ure t rail quali t y

29
0 10 20 30 40 50 60 70
Very poor
Poor
Average
Good
Very good
N=181 visitor groups;
percentages do not equal 100 due to rounding.
27%
34%
23%
11%
6%
Rating
Number of respondents
Figure 3 3 : Roadside exhibi t quali t y
0 10 20 30 40
Very poor
Poor
Average
Good
Very good
N=79 visitor groups
41%
39%
15%
5%
0%
Rating
Number of respondents
Figure 3 4 : O t her in f orma t ional b rochure quali t y

30
0 20 40 60 80 100 120 140 160
Very poor
Poor
Average
Good
Very good
N=237 visitor groups;
percentages do not equal 100 due to rounding.
65%
19%
4%
3%
8%
Rating
Number of respondents
Figure 3 5 : Park en t ranc e s t a t ion p e rsonnel quali t y
31
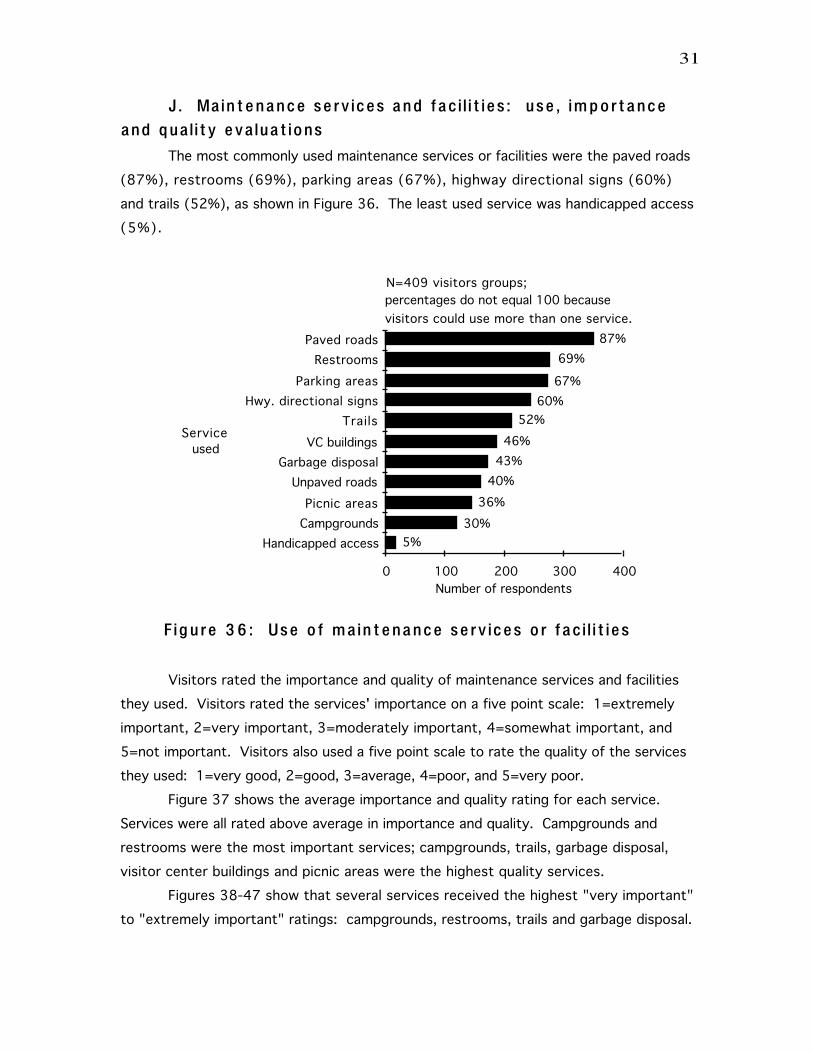
J. Main t enance se rv ices and f acili t ies: use , im p or t anceand quali t y e valua t ions
The most commonly used maintenance services or facilities were the paved roads
(87%), restrooms (69%), parking areas (67%), highway directional signs (60%)
and trails (52%), as shown in Figure 36. The least used service was handicapped access
(5%).
0 100 200 300 400
Handicapped access
Campgrounds
Picnic areas
Unpaved roads
Garbage disposal
VC buildings
Trails
Hwy. directional signs
Parking areas
Restrooms
Paved roads
Service
used
N=409 visitors groups;
87%
69%
67%
60%
52%
percentages do not equal 100 because
visitors could use more than one service.
46%
43%
40%
36%
30%
5%
Number of respondents
Figure 3 6 : Use o f main t e nanc e se rv ic es o r f acili t ies
Visitors rated the importance and quality of maintenance services and facilities
they used. Visitors rated the services' importance on a five point scale: 1=extremely
important, 2=very important, 3=moderately important, 4=somewhat important, and
5=not important. Visitors also used a five point scale to rate the quality of the services
they used: 1=very good, 2=good, 3=average, 4=poor, and 5=very poor.
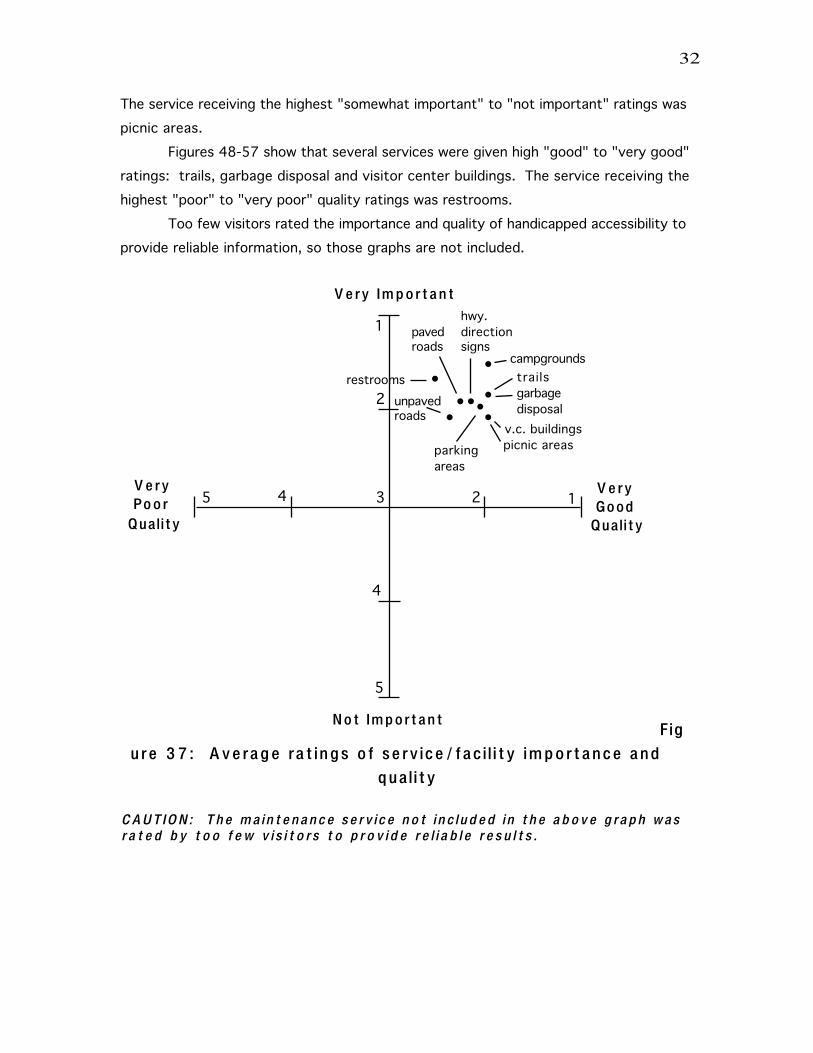
Figure 37 shows the average importance and quality rating for each service.
Services were all rated above average in importance and quality. Campgrounds and
restrooms were the most important services; campgrounds, trails, garbage disposal,
visitor center buildings and picnic areas were the highest quality services.
Figures 38-47 show that several services received the highest "very important"
to "extremely important" ratings: campgrounds, restrooms, trails and garbage disposal.
32
The service receiving the highest "somewhat important" to "not important" ratings was
picnic areas.
Figures 48-57 show that several services were given high "good" to "very good"
ratings: trails, garbage disposal and visitor center buildings. The service receiving the
highest "poor" to "very poor" quality ratings was restrooms.
Too few visitors rated the importance and quality of handicapped accessibility to
provide reliable information, so those graphs are not included.
5 4 3 2 1
2
1
4
5
V er y Im p or t an t
No t Impor t an t
V e r y Po or Quali t y
V e r y Good Quali t y
•
•••
•
•
•
•
picnic areas
restrooms
campgrounds
paved roads
unpaved roads
trails
hwy.
direction signs
v.c. buildings
parking
areas
garbage
disposal
Figure 3 7 : A v e ra g e ra t ings o f se rv ic e / f acili t y im p or t anc e and
quali t y
C A U TIO N : T h e m ain t e n a n c e s e r v ic e n o t in c lu d e d in t h e a b o v e g ra p h w asr a t e d b y t o o f e w v is i t o r s t o p r o v i d e r e l i a b l e r e s u l t s .

33
0 10 20 30 40 50 60 70
Not important
Somewhat important
Moderately important
Very important
Extremely important
N=149 visitor groups
Importance
44%
27%
15%
8%
6%
Number of respondents
Figure 3 8 : Picnic are a im p or t ance
0 50 100 150 200
Not important
Somewhat important
Moderately important
Very important
Extremely important
N=282 visitor groups
Importance
67%
16%
7%
2%
8%
Number of respondents
Figure 3 9 : Res t ro o m im p or t ance

34
0 20 40 60 80 100
Not important
Somewhat important
Moderately important
Very important
Extremely important
N=121 visitor groups
Importance
74%
16%
3%
0%
7%
Number of respondents
Figure 4 0 : Campground impor t ance
0 50 100 150 200
Not important
Somewhat important
Moderately important
Very important
Extremely important
N=361 visitor groups;
Importance
percentages do not equal 100 due to rounding.
46%
30%
14%
1%
8%
Number of respondents
Figure 4 1 : Pa v e d road impor t ance

35
0 10 20 30 40 50 60 70
Not important
Somewhat important
Moderately important
Very important
Extremely important
N=169 visitor groups;
Importance
percentages do not equal 100 due to rounding.
39%
31%
20%
4%
7%
Number of respondents
Figure 4 2 : Unpav e d road impor t ance
0 20 40 60 80 100 120 140
Not important
Somewhat important
Moderately important
Very important
Extremely important
N=215 visitor groups
Importance
56%
26%
9%
2%
7%
Number of respondents
Figure 4 3 : T rail imp or t ance

36
0 20 40 60 80 100 120 140
Not important
Somewhat important
Moderately important
Very important
Extremely important
N=252 visitor groups
Importance
54%
25%
9%
4%
8%
Number of respondents
Figure 4 4 : Highwa y direc t ional sign impor t ance
0 10 20 30 40 50 60 70
Not important
Somewhat important
Moderately important
Very important
Extremely important
N=189 visitor groups
Importance
37%
36%
14%
8%
5%
Number of respondents
Figure 4 5 : V isi t or cen t e r building impor t ance

37
0 20 40 60 80 100 120 140
Not important
Somewhat important
Moderately important
Very important
Extremely important
N=277 visitor groups
Importance
45%
29%
14%
5%
7%
Number of respondents
Figure 4 6 : Parking are a im p or t anc e
0 20 40 60 80 100 120
Not important
Somewhat important
Moderately important
Very important
Extremely important
N=178 visitor groups
Importance
58%
24%
8%
2%
8%
Number of respondents
Figure 4 7 : Garbag e disposal impor t ance

38
0 10 20 30 40 50 60
Very poor
Poor
Average
Good
Very good
N=146 visitor groups
41%
36%
19%
3%
1%
Rating
Number of respondents
Figure 4 8 : Picnic are a quali t y
0 10 20 30 40 50 60 70 80 90
Very poor
Poor
Average
Good
Very good
N=273 visitor groups
23%
28%
30%
11%
8%
Rating
Number of respondents
Figure 4 9 : Res t ro om quali t y

39
0 10 20 30 40 50
Very poor
Poor
Average
Good
Very good
N=118 visitor groups
40%
36%
16%
4%
4%
Rating
Number of respondents
Figure 5 0 : Campground quali t y
0 20 40 60 80 100 120 140
Very poor
Poor
Average
Good
Very good
N=349 visitor groups;
percentages do not equal 100 due to rounding.
30%
35%
24%
7%
3%
Rating
Number of respondents
Figure 5 1 : Pav e d road quali t y

40
0 10 20 30 40 50 60
Very poor
Poor
Average
Good
Very good
N=161 visitor groups
24%
36%
28%
9%
3%
Rating
Number of respondents
Figure 5 2 : Unpav ed road quali t y
0 10 20 30 40 50 60 70 80 90
Very poor
Poor
Average
Good
Very good
N=209 visitor groups
41%
39%
13%
3%
4%
Rating
Number of respondents
Figure 5 3 : T rail quali t y

41
0 20 40 60 80 100
Very poor
Poor
Average
Good
Very good
N=244 visitor groups;
percentages do not equal 100 due to rounding.
39%
30%
19%
7%
6%
Rating
Number of respondents
Figure 5 4 : Highway direc t ional sign quali t y
0 10 20 30 40 50 60 70 80
Very poor
Poor
Average
Good
Very good
N=187 visitor groups;
percentages do not equal 100 due to rounding.
40%
39%
14%
5%
3%
Rating
Number of respondents
Figure 5 5 : V isi t or cen t er building quali t y

42
0 20 40 60 80 100 120
Very poor
Poor
Average
Good
Very good
N=274 visitor groups
36%
37%
18%
4%
5%
Rating
Number of respondents
Figure 5 6 : Parking are a quali t y
0 10 20 30 40 50 60 70 80
Very poor
Poor
Average
Good
Very good
N=176 visitor groups;
percentages do not equal 100 due to rounding.
42%
38%
11%
5%
5%
Rating
Number of respondents
Figure 5 7 : Garbag e disposal quali t y

43
K. Rock climbing ac t iv i t y e valua t ion
Visitors were asked if they observed any rock climbing activities during this
visit. The 71% of visitors who responded that they had seen rock climbing (Figure 58)
were then asked if they enjoyed watching. Eighty percent said they enjoyed watching,
10% said no and 11% had no opinion (see Figure 59). Those who answered no were
asked to explain why; their reasons included that this activity was too intrusive, it
defaces rocks, appears dangerous, scares wildlife and several other reasons.
0 50 100 150 200 250 300
No
Yes
N=405 visitor groups
71%
29%
Observe rock
climbing?
Number of respondents
Figure 5 8 : Propor t ion o f v isi t ors who o bserv e d rock clim bingac t iv i t ie s
0 50 100 150 200 250
No opinion
No
Yes
N=274 visitor groups;
percentages do not equal 100 due to rounding.
80%
10%
11%
Enjoyobserving rock
climbing?
Number of respondents
Figure 5 9 : Propor t ion o f v isi t ors who enjo y e d o bserving rockclim bing ac t iv i t ies

44
L. Reco mm enda t ions f or camp grounds in t he f u t ure
Visitors were asked about their recommendations for campgrounds in the future.
About the need for more tent campsites, 35% of visitors said yes; 51% had no opinion
(see Figure 60). About the need for more RV sites, 41% of visitors said no; 42% had no
opinion (Figure 61). Visitors were asked if they would use a walk-in (less than one-
fourth mile) campground, and 35% responded that it is likely that they would use it and
35% said it is unlikely that they would use it (Figure 62). When asked if more
monument campgrounds should be on a reservation system, 40% said no, 40% had no
opinion and 20% said yes (Figure 63).
0 50 100 150 200
No opinion
No
Yes
N=388 visitor groups;
percentages do not equal 100 due to rounding.
35%
15%
51%
More tent
campsites?
Number of respondents
Figure 6 0 : V isi t ors ' opinions ab ou t more t en t campsi t es

45
0 20 40 60 80 100 120 140 160 180
No opinion
No
Yes
N=389 visitor groups
17%
41%
42%
More RV
campsites?
Number of respondents
Figure 6 1 : V isi t ors ' opinions ab ou t more RV campsi t es
0 20 40 60 80 100 120 140
Don't know
No, unlikely
Yes, likely
N=387 visitor groups
35%
35%
30%
Use walk-in
campground?
Number of respondents
Figure 6 2 : V isi t ors likely use o f walk-in campground

46
0 20 40 60 80 100 120 140 160
No opinion
No
Yes
N=383 visitor groups
20%
40%
40%
More reserve
campgrounds?
Number of respondents
Figure 6 3 : V isi t o rs ' p re f e rence f or addi t ional cam p groundson r ese rv a t ion s y s t e m

47
M. Exp endi t ures
Of visitors who spent money during their visit, 62% spent $100 or less for
lodging, food, travel and other expenses in the Joshua Tree area (see Figure 64). As
Figure 65 shows, equal proportions of money (34%) were spent for lodging and food.
Including visitors who spent no money, the average visitor group expenditure for
the visit was $72.00; the average per capita amount spent was $31.00.
When asked to report their expenditures for lodging/camping, 66% said they
spent no money and 23% spent $50.00 or less (see Figure 66).
Figures 67-69 show that visitor groups often spent no money for travel (30%),
food (36%), and other items (55%) during their visit to Joshua Tree. Others spent
$25.00 or less for travel (56%), food (36%), and other items (37%).
0 20 40 60 80 100 120 140 160 180
No money spent
$1-50
$51-100
$101-150
$151-200
$201-250
$251 or more
N=389 visitor groups;
percentages do not equal 100 due to rounding.
Amount
spent
6%
2%
3%
6%
18%
44%
22%
Number of respondents
Figure 6 4 : T o t al v isi t o r exp endi t ures

48
N=389 visitor groups;
34%
34%
20%
13%
percentages do not equal 100 due to rounding.
Lodging
Travel
Food
Other
Figure 6 5 : Pro p or t ion o f v isi t o r exp endi t ures b y ca t e g ory
0 50 100 150 200 250
No money spent
$25 or less
$26-50
$51-75
$76-100
$101-125
$126-150
$151 or more
N=345 visitor groups
Amount
spent
3%
1%
1%
3%
3%
10%
13%
66%
Number of respondents
Figure 6 6 : T o t al v isi t or exp enses f or lodging

49
0 50 100 150 200 250
No money spent
$25 or less
$26-50
$51-75
$76-100
$101-125
$126-150
$151 or more
N=362 visitor groups;
percentages do not equal 100 due to rounding.
Amount
spent
<1%
<1%
<1%
1%
1%
56%
30%
11%
Number of respondents
Figure 6 7 : T o t al v isi t o r exp e nses f o r t ra v e l
0 20 40 60 80 100 120 140
No money spent
$25 or less
$26-50
$51-75
$76-100
$101-125
$126-150
$151 or more
N=363 visitor groups;
percentages do not equal 100 due to rounding.
Amount
spent
37%
36%
16%
4%
3%
1%
1%
3%
Number of respondents
Figure 6 8 : T o t al v isi t o r exp enses f o r f o o d

50
0 20 40 60 80 100 120 140 160 180
No money spent
$25 or less
$26-50
$51-75
$76-100
$101-125
$126-150
$151 or more
N=314 visitor groups;
percentages do not equal 100 due to rounding.
Amount
spent
55%
37%
3%
1%
2%
1%
1%
1%
Number of respondents
Figure 6 9 : T o t al v isi t o r exp e nses f o r o t he r i t e ms

51
N. Planning f o r t he f u t ure
Visitors were asked "If you were a park manager planning for the future of
Joshua Tree National Monument, what would you propose? Please be specific." A
summary of their responses is listed below.
Planning f or t he fu t ureN=670 comments;
many visitors made more than one comment.
Comment Number of times mentioned PERSONNEL
Increase staff 2Other comments 4
IN TERPRET IV E SERV ICES
NonpersonalImprove maps--need more detail/mileages 11Improve self-guided trails/sign quality 10Provide more information on history/mines 9Provide more plant identification 8Need more short nature trails 7Publicize more widely 7Improve roadside exhibits 7Improve sales operation/items 6Improve visitor center operation/information 6Encourage visitors to get out of vehicles, see & do more 4Don't publicize park any more 3Provide more geological information on site 3Continue to educate about desert preservation/rules 3Sell desert plant seeds/seedlings 2Organize "friends" volunteer groups 2Teach proper backcountry use 2Produce TV specials/videos on desert environment 2Other comments 10
Pe rso nalNeed more ranger programs 10Continue ranger programs 2Publicize ranger programs better 2Provide guided auto tour 2Provide information at entrances 2Other comments 4

52
F ACILITIES AND MAINTENANCE
GeneralImprove toilets/restrooms 18Improve signing 15Provide water in monument 13Provide showers 11Toilets/restrooms should be cleaner/better maintained 7Provide more picnic tables/areas 6Need more restrooms/toilets along monument road 6Maintain current facilities 5Provide more trash cans 4Need more parking 3Improve restrooms for handicapped 2Improve and maintain picnic areas 2Provide water stations 2Provide recycling containers 2Other comments 6
CampgroundsAdd more campsites 25Separate tent and RV campsites 14No more/limit number of campsites 13Improve campgrounds 11Need more and larger campsites for RV's 8Provide walk-in campsites for tent campers 8Campsites too close together 8Limit number of RV campsites 6Provide less RV camping, more tent camping 3Provide/improve grills/firepits 3Don't provide hookups 3Provide hookups 2Reduce number of campsites 2Provide more campsites with trees 2Sell firewood for camping 2
RoadsImprove road maintenance 20Improve roads/accessibility 8Need more larger roadside pullouts 7No new roads 6No one-way loop road 5Would like auto access to Geology Tour Road 4Improve signing identifying roadside pullouts 4Don't put in one way loop road w/o involving public 3Need road from Black Rock Canyon to rest of park 2
T r a i l sNeed more hiking trails 9Need better marked trails 6Provide unpaved cross-country mt. bike trails 4Improve trails 2Provide benches along trails for elderly 2Other comments 2

53
PO LICIES
Take camping reservations 14Change current fee systems 8Need better enforcement of park rules 8Need better safety warnings/faster first aid availability 6Continue to allow access for climbers 4Better enforcement of current camping regulations 4Impose additional rock climbing restrictions 4Limit or allow no off road vehicle use/parking 4Improve entrance/camping registration systems 4Provide emergency phone system along road 3Ban music making/RV generators 3Allow roadside parking 3Enforce camping length of stay limit 2Allow use of power drills/bolts on climbing routes 2Don't take camping reservations 2Restrict low-flying aircraft 2Let technical climbing develop with climbers' input 2Maintain current fee systems 2Restrict/ban RV's 2Work with user groups--be flexible 2Provide additional funding to park 2Other comments 15
RESOURCE MANAGEMENT
Fine as it is 31Keep it natural--pristine desert, undeveloped 17Minimize development/human impact 14Allow no further development/additional buildings 13Don't allow overcrowding/limit people/vehicles 11Allow access to more of park/add roads 6Provide shuttle bus when traffic warrants 5Don't change anything--balance beauty/accessibility 4Protect/preserve natural & historic resources 4Need store near monument entrance 3Provide horseback riding 2Suggest separate climbing area for climbers only 2Expand park 2Need restaurant/curio shop/movie theater 2Increase wildlife visibility 2Need more revegetation/more publicity on it 2Provide camping outside monument 2Other comments 14
GENERA L IMPRESSIONS
Improve local community services/appearance 3Other comments 7

54
O. Comm en t summary - In t roduc t ion
Visitors were asked if there was anything else they wanted to tell us about their
visit. A summary of their comments appears below, and in a separate appendix which
also contains their unedited comments. Some comments offer specific suggestions on how
to improve visitors' visits; others describe what visitors enjoyed or did not enjoy.
Visi t or Commen t Summary
N=607 comments;
many visitors made more than one comment.
Comment Number of times mentioned PERSONNEL
Rangers friendly, helpful, knowledgeable 16Need more rangers 2One ranger unfriendly 2Other comments 7
IN TERPRET IV E SERV ICES
NonpersonalImprove roadside exhibits 6Provide more information on park resources 4Provide information on park-specific plants/animals 3Improve visitor center exhibits 2More to learn about than we thought 2Exhibits well done 2Provide highlights/safety information for each season 2Enjoyed interpretive brochures 2Map needs improved 2Add Indian/archeological artifacts to visitor center exhibits 2Explain Lost Horse Mine mining operation 2Provide more info/tours on revegetation 2Publicize more widely 2Other comments 10
Pe rso nalOffer more ranger programs on weekdays 5Would like tours on geology 2
F ACILITIES AND MAINTENANCE
GeneralClean, well-maintained 16Improve signing 9Add campgrounds 9Improve campground operations 7

55
Nice/clean facilities 7Improve outhouses/maintenance 5Improve camping registration system 5Do not make park road one way 4Improve trail marking 4Repair roads 4Need more outhouses 3Don't increase number of paved roads 3Need more parking/pullouts 3Separate RV from tent campsites 3Campgrounds well designed 2Add picnic areas/tables 2Other comments 7
PO LICIES
Enforce campground noise rules better, esp. weekends 5Need more enforcement of rule infractions 4Take camping reservations 3There should be no entrance fee 2Rock climbing should not be allowed in campgrounds 2Limit climbers to one area 2Other comments 8
RESOURCE MANAGEMENT
Enjoyed wildflowers 25Keep it as natural/undeveloped as possible 22Keep it the way it is 11Appreciate your efforts to balance preservation/use 7Climbers would like their views understood 5Enjoyed clean air 3Saw a tortoise 3Don't allow overcrowding to ruin park 2Allow no motels/hotels/stores/concessions in park 2Sorry to see smog at park 2Other comments 13
V ISIT OR SERV ICES PROJECT
This is second questionnaire returned 2Other comments 4
NA TIONAL PARK SERVICE
Comments 2

56
GENERA L IMPRESSIONS
Enjoyed visit 77Beautiful/great place 72Hope/plan to return 30Have visited many times 20Quiet/peaceful/relaxing 18Good job 9Would have liked to stay longer 7Always bring friend/relatives to see monument 7Enjoyed climbing 7Enjoyed hiking 6One of favorite places 5Enjoyed camping 4Enjoyed learning about desert, plants, Indians 3Nice escape from city 3Enjoyed scenic views 3Lucky to live near monument 3Will tell others about monument 2Hold special events to bring more people to monument 2Hope it will become national park 2Enjoy weekdays most 2Enjoyed watching climbing 2Climbers care more/impact monument less than others 2Didn't appreciate noise 2Other comments 20


59
A nalysis Ord e r F ormVisi t o r Se rv ic es Pro j e c t
Re por t 3 9 (Joshua Tre e )
Date of request: / /
Person requesting analysis:
Phone number (commercial):
The following list has the variables available for comparison from the visitor surveyconducted in your park. Use this list to find the characteristics for which you want torequest additional two-way and three-way comparisons.
• Group size • Activity • Interp. service use
• Group type • Order sites visited • Interp. service importance
• Age • Entrance used • Interp. service quality
• State residence • Exit used • Maint. service use
• Country residence • Source of park info • Maint. service importance
• Number of visits • Number of V.C. visits • Maint. service quality
• Length of stay • Reasons for park visit • Rock climbing observed
• Rock climbing enjoyed • Future tent camping • Future RV camping
• Future walk-in camp • Future camp reservations • Total expenses
• Lodging expenses • Travel expenses • Food expenses
• Other expenses
Two-way comparisons (please write in the appropriate variables from the above list)
by
by
by
Three-way comparisons (please write in the appropriate variables from the above list)
by by
by by
by by
Special instructions
Mail t o :
Coopera t iv e Park S t udies Uni tCollege o f Fores t ry , Wildli f e , and Range Sciences
Univ ersi t y o f IdahoMoscow, Idaho 8 3 8 4 3

58
QUESTIONNAIRE

NPS D-52 November 1991

61
Pu blica t ions o f t h e V isi t o r Se rv ic es Pro j e c t
A number of publications have been prepared as part of the Visitor Services Project.Reports 1-4 are available at cost from the University of Idaho Cooperative Park StudiesUnit upon request. All other reports are available from the respective parks in whichthe studies were conducted.
1. Mapping interpretive services: A pilotstudy at Grand Teton National Park, 1983.
21. Everglades National Park, 1989.
2. Mapping interpretive services:Identifying barriers to adoption anddiffusion of the method, 1984.
22. Statue of Liberty National Monument,1990.
3. Mapping interpretive services: A follow-up study at Yellowstone National Park andMt. Rushmore National Memorial, 1984.
23. The White House Tours, President's Park,1990.
4. Mapping visitor populations: A pilot studyat Yellowstone National Park, 1984.
24. Lincoln Home National Historic Site,1990.
5. North Cascades National Park ServiceComplex, 1985.
25. Yellowstone National Park, 1990.
6. Crater Lake National Park, 1986. 26. Delaware Water Gap National RecreationArea, 1990.
7. Gettysburg National Military Park, 1987. 27. Muir Woods National Monument, 1990. 8. Independence National Historical Park,
1987.28. Canyonlands National Park, 1990.
9. Valley Forge National Historical Park,1987.
29. White Sands National Monument, 1990.
10. Colonial National Historical Park, 1988. 30. National Monuments, 1991.11. Grand Teton National Park, 1988. 31. Kenai Fjords National Park, 1991.12. Harpers Ferry National Historical Park,
1988.32. Gateway National Recreation Area, 1991.
13. Mesa Verde National Park, 1988. 33. Petersburg National Battlefield, 1991.14. Shenandoah National Park, 1988. 34. Death Valley National Monument, 1991.15. Yellowstone National Park, 1988. 35. Glacier National Park, 1991.16. Independence National Historical Park:
Four Seasons Study, 1988.36. Scott's Bluff National Monument, 1991.
17. Glen Canyon National Recreation Area,1989.
37. John Day Fossil Beds National Monument,1991.
18. Denali National Park and Preserve, 1989. 38. Jean Lafitte National Historical Park,1991.
19. Bryce Canyon National Park, 1989. 39. Joshua Tree National Monument, 1991.20. Craters of the Moon National Monument,
1989.
For more information about the Visitor Services Project, please contact Dr. Gary E.Machlis, University of Idaho Cooperative Park Studies Unit, College of Forestry,Wildlife and Range Sciences, Moscow, Idaho 83843 or call (208) 885-7129.

Visi t or Services Projec t
Joshua Tree Na t ional Monument
A p p endix
Visi t or Serv ices Pro jec t Re p or t 3 9Coopera t iv e Park S t udies Uni t
Visi t or Services Projec t
Joshua Tree Na t ional Monument
A p p endix
Margaret Littlejohn
Repor t 3 9
November 1991
This volume contains a summary of comments to Question 17 made by visitors whoparticipated in the study. The summary is followed by their unedited comments.
Ms. Margaret Littlejohn is VSP Western Coordinator, National Park Service
based at the Cooperative Park Studies Unit, University of Idaho. I thank Sarah Murphy-Scher, Harriet Darley, Rick McIntyre and staff at Joshua Tree National Monument fortheir assistance with this study. The VSP acknowledges the Public Opinion Lab of theSocial and Economic Sciences Research Center, Washington State University for itstechnical assistance.


1
Visi t or Commen t Summary
N=607 comments;
many visitors made more than one comment.
Comment Number of times mentioned PERSONNEL
Rangers friendly, helpful, knowledgeable 16Need more rangers 2One ranger unfriendly 2Other comments 7
IN TERPRET IV E SERV ICES
NonpersonalImprove roadside exhibits 6Provide more information on park resources 4Provide information on park-specific plants/animals 3Improve visitor center exhibits 2More to learn about than we thought 2Exhibits well done 2Provide highlights/safety information for each season 2Enjoyed interpretive brochures 2Map needs improved 2Add Indian/archeological artifacts to visitor center exhibits 2Explain Lost Horse Mine mining operation 2Provide more info/tours on revegetation 2Publicize more widely 2Other comments 10
Pe rso nalOffer more ranger programs on weekdays 5Would like tours on geology 2
F ACILITIES AND MAINTENANCE
GeneralClean, well-maintained 16Improve signing 9Add campgrounds 9Improve campground operations 7Nice/clean facilities 7Improve outhouses/maintenance 5Improve camping registration system 5Do not make park road one way 4Improve trail marking 4Repair roads 4Need more outhouses 3Don't increase number of paved roads 3

2
Need more parking/pullouts 3Separate RV from tent campsites 3Campgrounds well designed 2Add picnic areas/tables 2Other comments 7
PO LICIES
Enforce campground noise rules better, esp. weekends 5Need more enforcement of rule infractions 4Take camping reservations 3There should be no entrance fee 2Rock climbing should not be allowed in campgrounds 2Limit climbers to one area 2Other comments 8
RESOURCE MANAGEMENT
Enjoyed wildflowers 25Keep it as natural/undeveloped as possible 22Keep it the way it is 11Appreciate your efforts to balance preservation/use 7Climbers would like their views understood 5Enjoyed clean air 3Saw a tortoise 3Don't allow overcrowding to ruin park 2Allow no motels/hotels/stores/concessions in park 2Sorry to see smog at park 2Other comments 13
V ISIT OR SERV ICES PROJECT
This is second questionnaire returned 2Other comments 4
NA TIONAL PARK SERVICE
Comments 2

3
GENERA L IMPRESSIONS
Enjoyed visit 77Beautiful/great place 72Hope/plan to return 30Have visited many times 20Quiet/peaceful/relaxing 18Good job 9Would have liked to stay longer 7Always bring friend/relatives to see monument 7Enjoyed climbing 7Enjoyed hiking 6One of favorite places 5Enjoyed camping 4Enjoyed learning about desert, plants, Indians 3Nice escape from city 3Enjoyed scenic views 3Lucky to live near monument 3Will tell others about monument 2Hold special events to bring more people to monument 2Hope it will become national park 2Enjoy weekdays most 2Enjoyed watching climbing 2Climbers care more/impact monument less than others 2Didn't appreciate noise 2Other comments 20