Embed Size (px)
Citation preview
Visit Note– Mid/Small Cap
Plastiblends India Ltd
21st July 2015
Analyst Details
Sunny Agrawal
022-61802831
2
About Masterbatch
Shareholding (%)
Chart: PIL vs. Sensex
Plastiblends India Ltd (PIL) is India’s largest manufacturer and exporter of colour & additive masterbatches and
thermoplastic compounds for the plastic processing industry. The company has total installed capacity of ~85000 tonnes
spread across Daman and Roorkee. The company exports to more than 40 countries worldwide and have a strong foot hold
in the global market. During FY10-FY15, Sales, EBITDA and PAT has grown at CAGR of 18.6%, 20.7% and 18.3% to Rs
4944 mn, Rs 508 mn and Rs 272 mn respectively. The company belongs to Kolsite group, which also have presence
across engineering (Kabra Extrusions) and box strappings business (Maharashtra Plastic and Industries).
Masterbatch: Masterbatch is a solid or liquid additive used for colouring (colour masterbatch) or imparting other properties
to plastics (additive masterbatch). Colouring masterbatch is use to give colour/shade (red, orange, green, etc) to plastic
products. Properties imparting masterbatch can be used to impart properties such as strength, effect/feel (metal or
pearlescent), bio-degradable, UV stabiliser, antioxidant, etc. Masterbatch market can be classified into four segments -
additive, color, white and black.
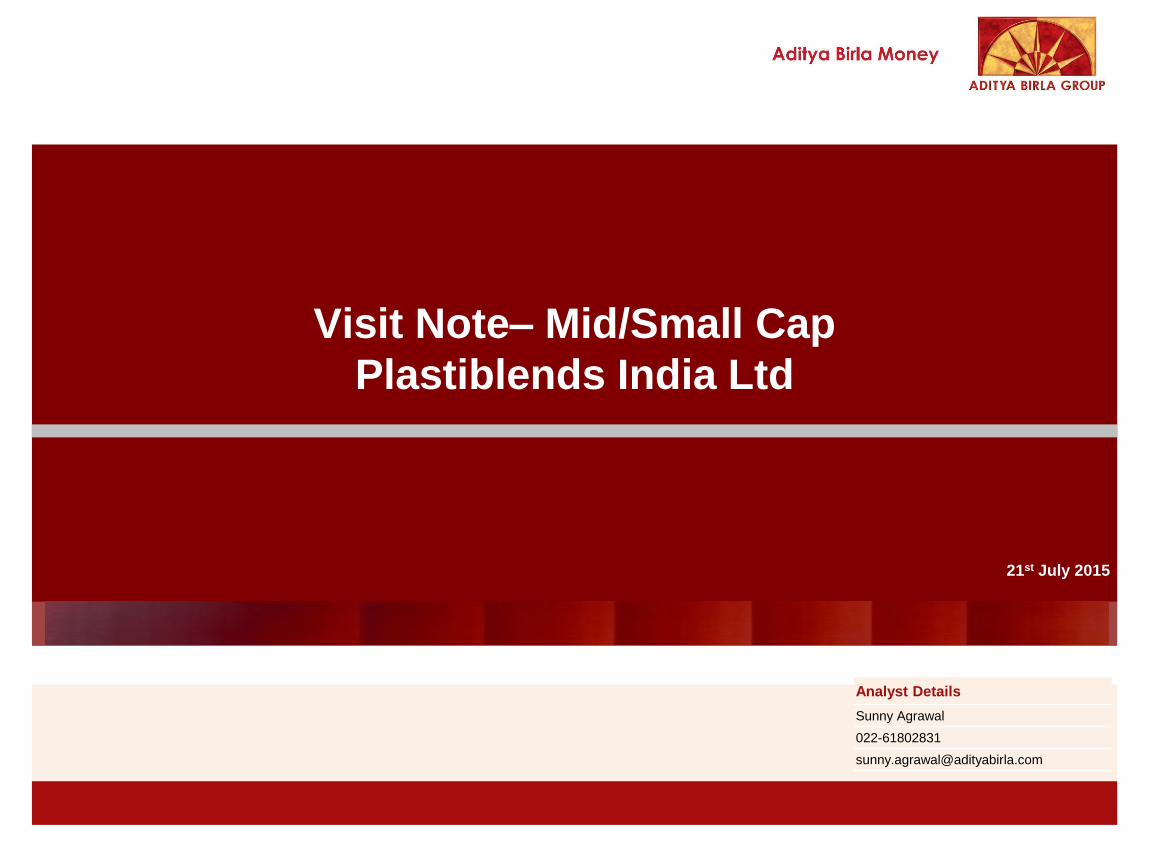
Manufacturing process: Masterbatch is produced by encapsulating minimum 2 or more ingredients (pigments, additives
etc) in a polymer medium with an equipment called as "extruder". The strands coming out of an extruder are then cooled
and cut into a granular shape. Masterbatch manufacturing is a physical mixing process of ingredients carried under heat and
shear.
Company Data
BSE Code 523648
NSE Code PLASTIBLEN
Equity Capital (` mn) 65.0
Face Value (`) 5.0
Market Cap (` bn) 4.7
Avg Daily Volume (Qtly) 20302
52 week H/L (`) 368.6/191.0
Source: NSE, BSE
Source: BSE
Source: ABML Research, Capitaline
Plastiblends India Ltd | Speciality Chemicals | CMP: Rs 359.9 NOT RATED; OUTLOOK: Positive
Company Background
Holders Jun15 Mar15 Dec14
Promoters 61.77 61.76 61.76
FIIs 1.85 1.77 1.77
MFs/Banks & FI’s 0.07 0.07 0.08
Public & Others 36.31 36.40 36.39
Recently, we got an opportunity to interact with Mr Anand Kabra, CEO and ED of Plastiblends. Few months back, we also
had opportunity to visit company’s manufacturing plant in Daman. Following are the key takeaway of the meetings.
Screw and Barrel - for mixing Die – for making threads
Water tank – for cooling
Shredder– for making granules
Input Hoppers – for polymer, pigments etc
Heater – for melting
Diagram 1 : Manufacturing process of Masterbatch
80
100
120
140
160
180
Jul-14
Sep-1
4
Nov-
14
Dec-
14
Feb
-15
Apr-
15
May-
15
Jul-15
Rela
tive P
erf
orm
ance
Plastiblends Return Sensex Return
3
Chart 1 : Country-wise per capita plastic consumption (Kg/Capita)
• Key raw materials: Key raw material required for manufacturing masterbatches are - LDPE, HDPE, Pigments, Additives, Carbon Black, Titanium Dioxide, Calcium
Carbonate etc
• End user market for masterbatch: Agriculture, Appliances, Automotive and Transportation, Electricals, Electronics and telecommunication, Healthcare and
Pharma, Packaging, Textiles, Wire & Cable etc
• The growth of masterbatch industry is totally reliant on the growth in the consumption of plastic/polymer products by end users in the Indian and international
market.
• Plastics are rapidly replacing items like wood, steel, rubber etc. Demand is increasing for high performance plastics in major end-user industries like agriculture,
packaging, automobile, consumer durables, telecom etc.
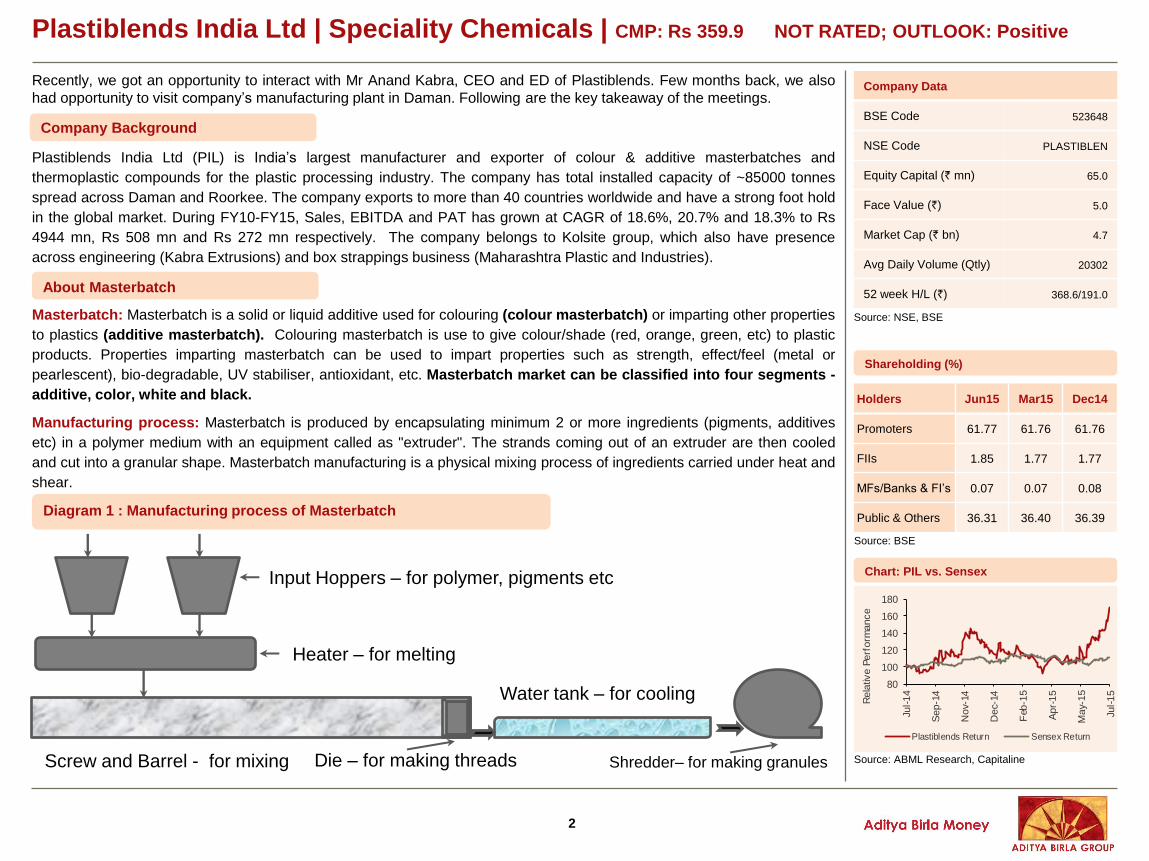
• Per capita plastic consumption in India is very miniscule at 10 Kg as compared to other emerging countries like China and Brazil. (Refer Chart 1)
• Plastic consumption in India is dominant in Western (47%) and Northern (23%) region (Refer Chart 2) .
Source: FICCI, ABM Research Source: PlastIndia, ABM Research
Chart 2: India's regionwise plastic consumption (%)
10
32
45
65
109
27
0 20 40 60 80 100 120
India
Brazil
China
Europe
USA
World Avg
Western47
Northern23
Southern21
Eastern9
Plastiblends India Ltd | Speciality Chemicals | CMP: Rs 359.9
4
Source: FICCI, ABM Research Source: Industry Data, ABM Research
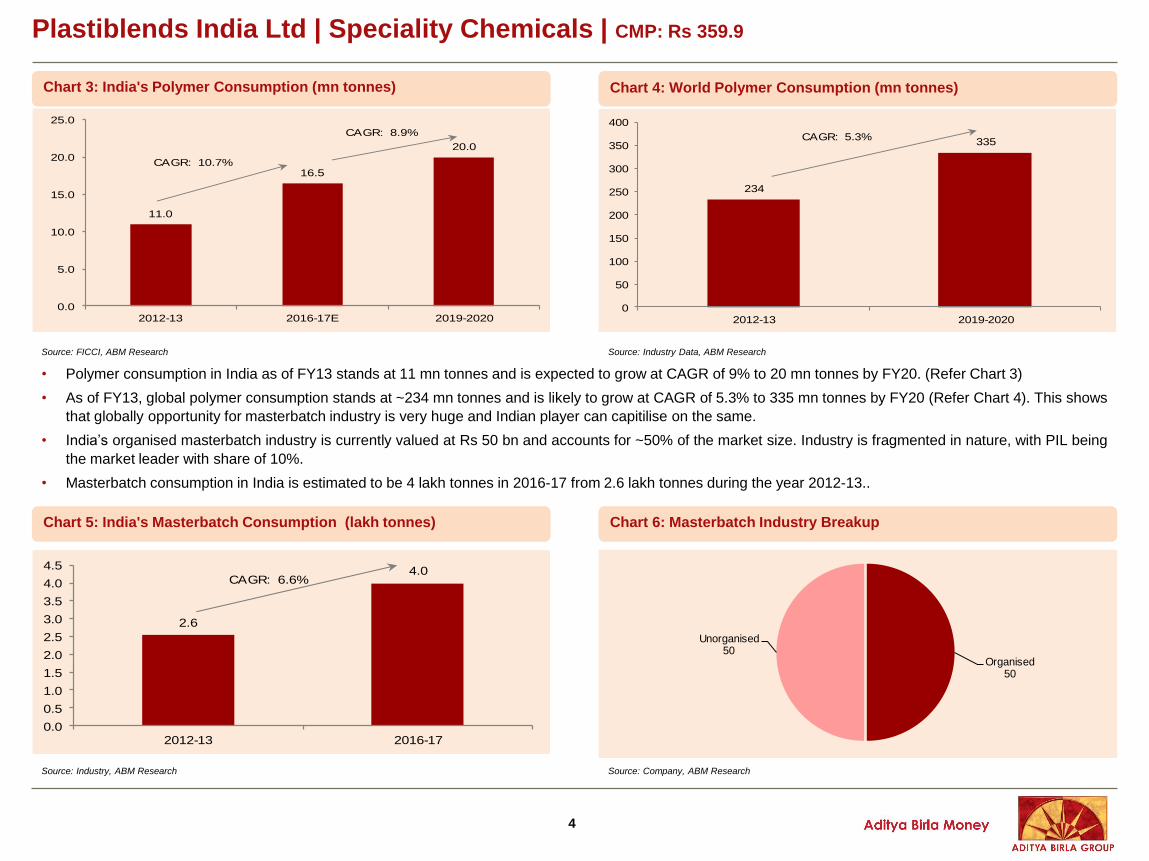
• Polymer consumption in India as of FY13 stands at 11 mn tonnes and is expected to grow at CAGR of 9% to 20 mn tonnes by FY20. (Refer Chart 3)
• As of FY13, global polymer consumption stands at ~234 mn tonnes and is likely to grow at CAGR of 5.3% to 335 mn tonnes by FY20 (Refer Chart 4). This shows
that globally opportunity for masterbatch industry is very huge and Indian player can capitilise on the same.
• India’s organised masterbatch industry is currently valued at Rs 50 bn and accounts for ~50% of the market size. Industry is fragmented in nature, with PIL being
the market leader with share of 10%.
• Masterbatch consumption in India is estimated to be 4 lakh tonnes in 2016-17 from 2.6 lakh tonnes during the year 2012-13..
Chart 3: India's Polymer Consumption (mn tonnes) Chart 4: World Polymer Consumption (mn tonnes)
11.0
16.5
20.0
0.0
5.0
10.0
15.0
20.0
25.0
2012-13 2016-17E 2019-2020
CAGR: 10.7%
CAGR: 8.9%
234
335
0
50
100
150
200
250
300
350
400
2012-13 2019-2020
CAGR: 5.3%
Chart 5: India's Masterbatch Consumption (lakh tonnes) Chart 6: Masterbatch Industry Breakup
2.6
4.0
0.0
0.5
1.0
1.5
2.0
2.5
3.0
3.5
4.0
4.5
2012-13 2016-17
CAGR: 6.6%
Organised 50
Unorganised50
Source: Industry, ABM Research Source: Company, ABM Research
Plastiblends India Ltd | Speciality Chemicals | CMP: Rs 359.9
5
Plastiblends India Ltd | Speciality Chemicals | CMP: Rs 359.9
PIL’s Capacity and Expansion Plans
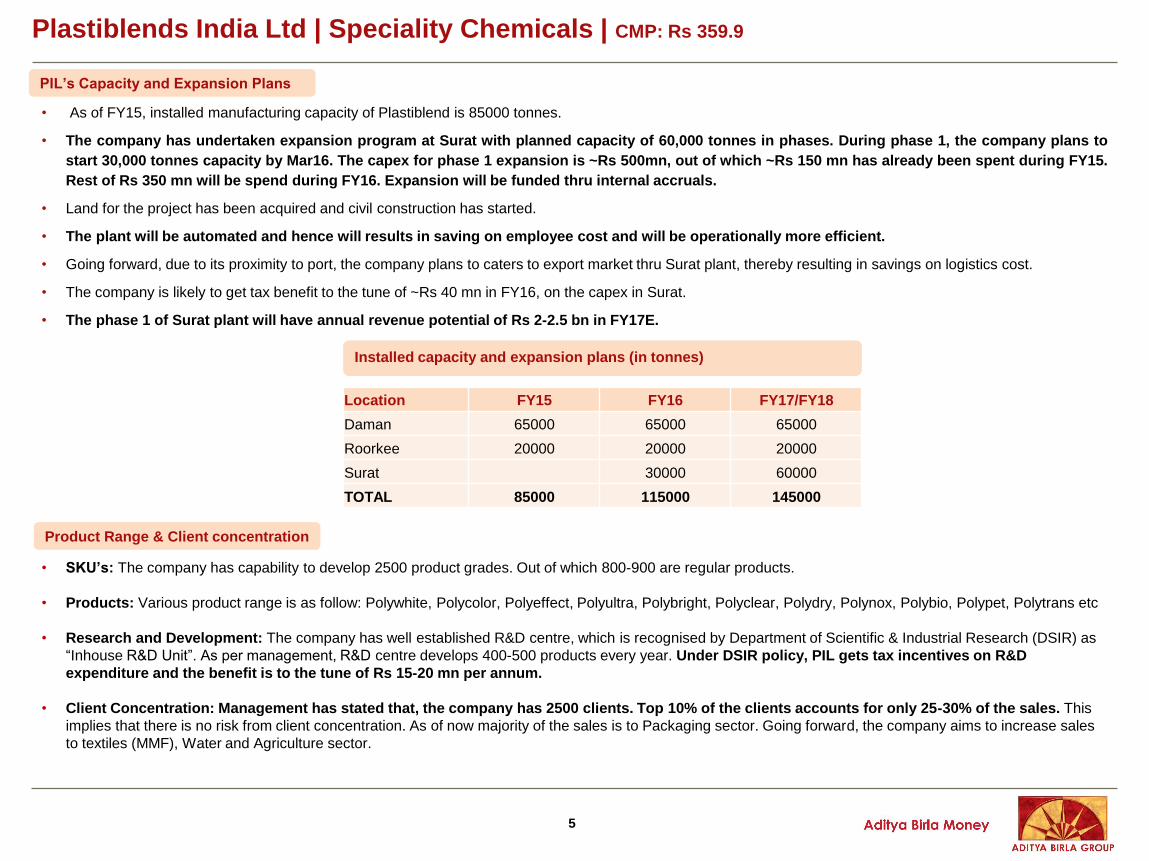
• As of FY15, installed manufacturing capacity of Plastiblend is 85000 tonnes.
• The company has undertaken expansion program at Surat with planned capacity of 60,000 tonnes in phases. During phase 1, the company plans to
start 30,000 tonnes capacity by Mar16. The capex for phase 1 expansion is ~Rs 500mn, out of which ~Rs 150 mn has already been spent during FY15.
Rest of Rs 350 mn will be spend during FY16. Expansion will be funded thru internal accruals.
• Land for the project has been acquired and civil construction has started.
• The plant will be automated and hence will results in saving on employee cost and will be operationally more efficient.
• Going forward, due to its proximity to port, the company plans to caters to export market thru Surat plant, thereby resulting in savings on logistics cost.
• The company is likely to get tax benefit to the tune of ~Rs 40 mn in FY16, on the capex in Surat.
• The phase 1 of Surat plant will have annual revenue potential of Rs 2-2.5 bn in FY17E.
Location FY15 FY16 FY17/FY18
Daman 65000 65000 65000
Roorkee 20000 20000 20000
Surat 30000 60000
TOTAL 85000 115000 145000
Product Range & Client concentration
• SKU’s: The company has capability to develop 2500 product grades. Out of which 800-900 are regular products.
• Products: Various product range is as follow: Polywhite, Polycolor, Polyeffect, Polyultra, Polybright, Polyclear, Polydry, Polynox, Polybio, Polypet, Polytrans etc
• Research and Development: The company has well established R&D centre, which is recognised by Department of Scientific & Industrial Research (DSIR) as
“Inhouse R&D Unit”. As per management, R&D centre develops 400-500 products every year. Under DSIR policy, PIL gets tax incentives on R&D
expenditure and the benefit is to the tune of Rs 15-20 mn per annum.
• Client Concentration: Management has stated that, the company has 2500 clients. Top 10% of the clients accounts for only 25-30% of the sales. This
implies that there is no risk from client concentration. As of now majority of the sales is to Packaging sector. Going forward, the company aims to increase sales
to textiles (MMF), Water and Agriculture sector.
Installed capacity and expansion plans (in tonnes)
6
Plastiblends India Ltd | Speciality Chemicals | CMP: Rs 359.9
Financial Analysis
Net Sales and Export Trend Analysis
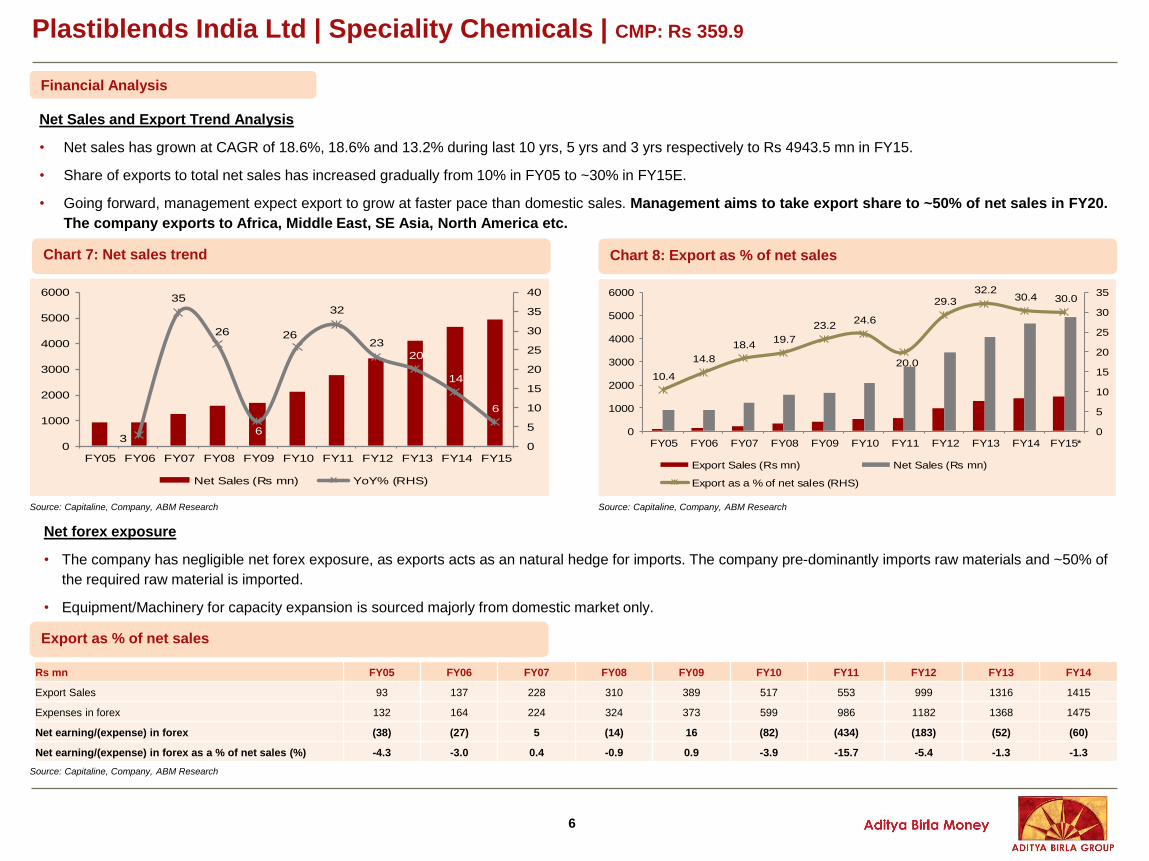
• Net sales has grown at CAGR of 18.6%, 18.6% and 13.2% during last 10 yrs, 5 yrs and 3 yrs respectively to Rs 4943.5 mn in FY15.
• Share of exports to total net sales has increased gradually from 10% in FY05 to ~30% in FY15E.
• Going forward, management expect export to grow at faster pace than domestic sales. Management aims to take export share to ~50% of net sales in FY20.
The company exports to Africa, Middle East, SE Asia, North America etc.
Net forex exposure
• The company has negligible net forex exposure, as exports acts as an natural hedge for imports. The company pre-dominantly imports raw materials and ~50% of
the required raw material is imported.
• Equipment/Machinery for capacity expansion is sourced majorly from domestic market only.
Rs mn FY05 FY06 FY07 FY08 FY09 FY10 FY11 FY12 FY13 FY14
Export Sales 93 137 228 310 389 517 553 999 1316 1415
Expenses in forex 132 164 224 324 373 599 986 1182 1368 1475
Net earning/(expense) in forex (38) (27) 5 (14) 16 (82) (434) (183) (52) (60)
Net earning/(expense) in forex as a % of net sales (%) -4.3 -3.0 0.4 -0.9 0.9 -3.9 -15.7 -5.4 -1.3 -1.3
Chart 7: Net sales trend Chart 8: Export as % of net sales
3
35
26
6
26
32
23
20
14
6
0
5
10
15
20
25
30
35
40
0
1000
2000
3000
4000
5000
6000
FY05 FY06 FY07 FY08 FY09 FY10 FY11 FY12 FY13 FY14 FY15
Net Sales (Rs mn) YoY% (RHS)
10.4
14.8
18.419.7
23.224.6
20.0
29.332.2
30.4 30.0
0
5
10
15
20
25
30
35
0
1000
2000
3000
4000
5000
6000
FY05 FY06 FY07 FY08 FY09 FY10 FY11 FY12 FY13 FY14 FY15*
Export Sales (Rs mn) Net Sales (Rs mn)
Export as a % of net sales (RHS)
Export as % of net sales
Source: Capitaline, Company, ABM Research
Source: Capitaline, Company, ABM Research Source: Capitaline, Company, ABM Research
7
Plastiblends India Ltd | Speciality Chemicals | CMP: Rs 359.9
Financial Analysis
Pricing policy and Margin profile
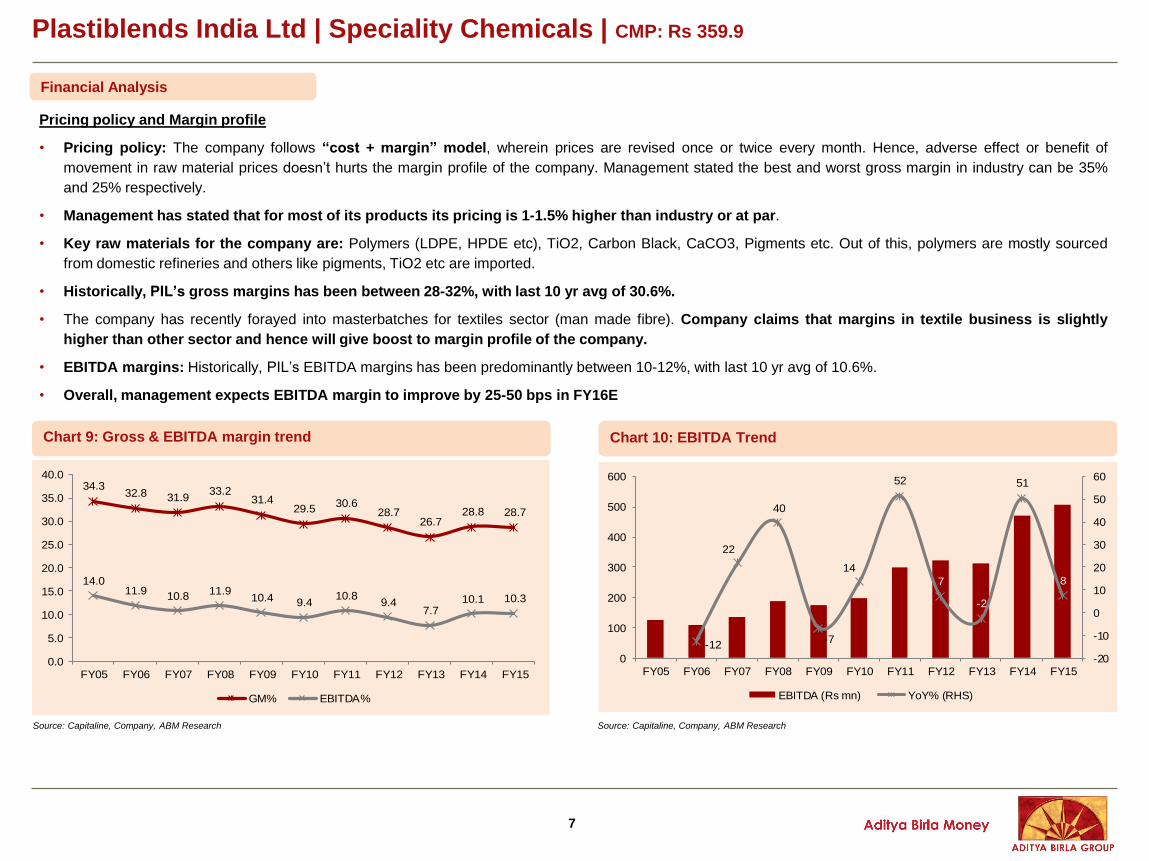
• Pricing policy: The company follows “cost + margin” model, wherein prices are revised once or twice every month. Hence, adverse effect or benefit of
movement in raw material prices doesn’t hurts the margin profile of the company. Management stated the best and worst gross margin in industry can be 35%
and 25% respectively.
• Management has stated that for most of its products its pricing is 1-1.5% higher than industry or at par.
• Key raw materials for the company are: Polymers (LDPE, HPDE etc), TiO2, Carbon Black, CaCO3, Pigments etc. Out of this, polymers are mostly sourced
from domestic refineries and others like pigments, TiO2 etc are imported.
• Historically, PIL’s gross margins has been between 28-32%, with last 10 yr avg of 30.6%.
• The company has recently forayed into masterbatches for textiles sector (man made fibre). Company claims that margins in textile business is slightly
higher than other sector and hence will give boost to margin profile of the company.
• EBITDA margins: Historically, PIL’s EBITDA margins has been predominantly between 10-12%, with last 10 yr avg of 10.6%.
• Overall, management expects EBITDA margin to improve by 25-50 bps in FY16E
Chart 9: Gross & EBITDA margin trend Chart 10: EBITDA Trend
34.332.8 31.9
33.231.4
29.530.6
28.726.7
28.8 28.7
14.011.9
10.811.9
10.4 9.410.8
9.47.7
10.1 10.3
0.0
5.0
10.0
15.0
20.0
25.0
30.0
35.0
40.0
FY05 FY06 FY07 FY08 FY09 FY10 FY11 FY12 FY13 FY14 FY15
GM% EBITDA%
-12
22
40
-7
14
52
7
-2
51
8
-20
-10
0
10
20
30
40
50
60
0
100
200
300
400
500
600
FY05 FY06 FY07 FY08 FY09 FY10 FY11 FY12 FY13 FY14 FY15
EBITDA (Rs mn) YoY% (RHS)
Source: Capitaline, Company, ABM Research Source: Capitaline, Company, ABM Research
8
Financial Analysis
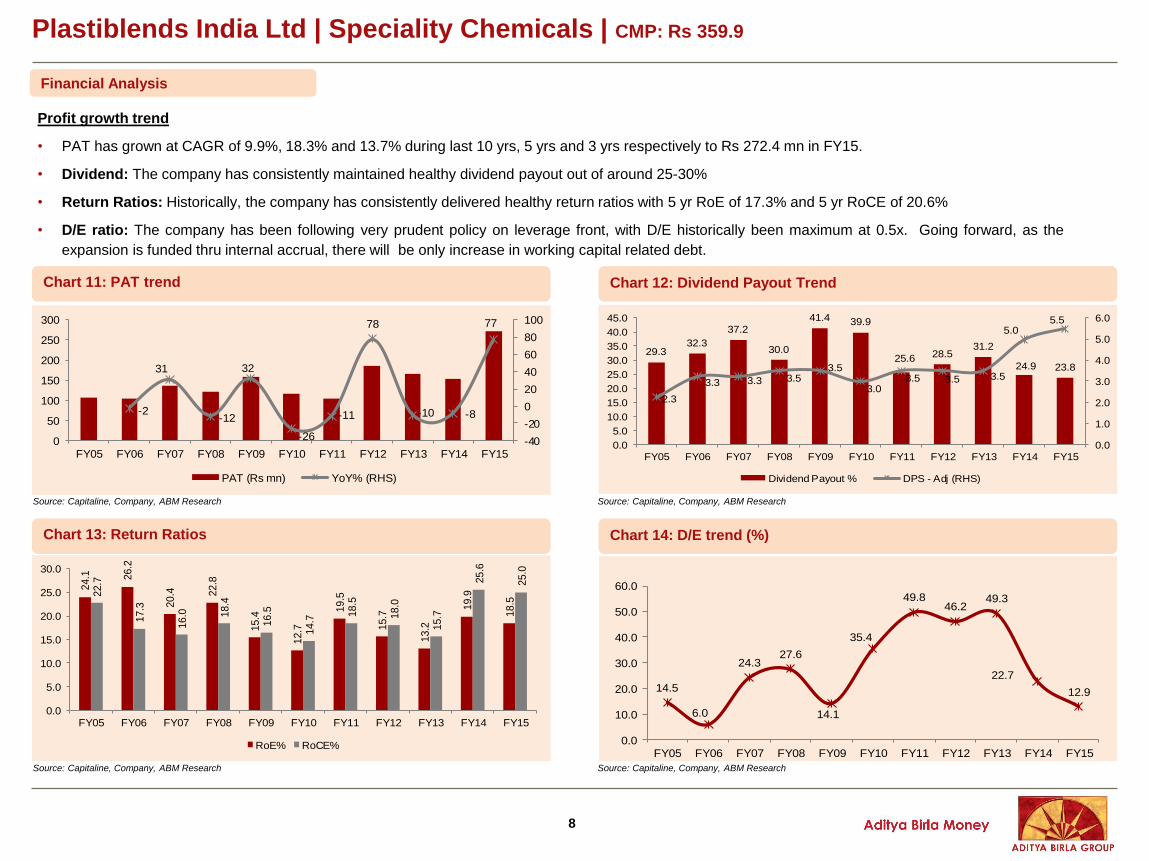
Profit growth trend
• PAT has grown at CAGR of 9.9%, 18.3% and 13.7% during last 10 yrs, 5 yrs and 3 yrs respectively to Rs 272.4 mn in FY15.
• Dividend: The company has consistently maintained healthy dividend payout out of around 25-30%
• Return Ratios: Historically, the company has consistently delivered healthy return ratios with 5 yr RoE of 17.3% and 5 yr RoCE of 20.6%
• D/E ratio: The company has been following very prudent policy on leverage front, with D/E historically been maximum at 0.5x. Going forward, as the
expansion is funded thru internal accrual, there will be only increase in working capital related debt.
Chart 11: PAT trend Chart 12: Dividend Payout Trend
-2
31
-12
32
-26
-11
78
-10 -8
77
-40
-20
0
20
40
60
80
100
0
50
100
150
200
250
300
FY05 FY06 FY07 FY08 FY09 FY10 FY11 FY12 FY13 FY14 FY15
PAT (Rs mn) YoY% (RHS)
2.3
3.3 3.3 3.53.5
3.03.5 3.5 3.5
5.05.5
29.332.3
37.2
30.0
41.4 39.9
25.6 28.531.2
24.9 23.8
0.0
1.0
2.0
3.0
4.0
5.0
6.0
0.0
5.0
10.0
15.0
20.0
25.0
30.0
35.0
40.0
45.0
FY05 FY06 FY07 FY08 FY09 FY10 FY11 FY12 FY13 FY14 FY15
Dividend Payout % DPS - Adj (RHS)
Chart 13: Return Ratios Chart 14: D/E trend (%)
24.1 26.2
20.4 2
2.8
15.4
12.7
19.5
15.7
13.2
19.9
18.5
22.7
17.3
16.0 1
8.4
16.5
14.7
18.5
18.0
15.7
25.6
25.0
0.0
5.0
10.0
15.0
20.0
25.0
30.0
FY05 FY06 FY07 FY08 FY09 FY10 FY11 FY12 FY13 FY14 FY15
RoE% RoCE%
14.5
6.0
24.327.6
14.1
35.4
49.846.2
49.3
22.7
12.9
0.0
10.0
20.0
30.0
40.0
50.0
60.0
FY05 FY06 FY07 FY08 FY09 FY10 FY11 FY12 FY13 FY14 FY15
Plastiblends India Ltd | Speciality Chemicals | CMP: Rs 359.9
Source: Capitaline, Company, ABM Research Source: Capitaline, Company, ABM Research
Source: Capitaline, Company, ABM Research Source: Capitaline, Company, ABM Research
9
Plastiblends India Ltd | Speciality Chemicals | CMP: Rs 359.9
Outlook and Valuations
Competitors
• International Peers: All the leading international major are present in India. Key amongst them are Ampacet Corporation (US), Schulman Inc (US), Polyone
Corporation (US), BASF SA (Germany), Cabot Corporation (US) & Clariant AG (France). Last year, Clariant India has acquired Vadodara-based Plastichemix
Industries for Rs 1.4 bn. The combined entity has posted CY14 topline of Rs 2.4 bn for masterbatch business.
• Domestic Peers: Among domestic players key are Poddar Pigments (FY15 Sales: Rs 3.2 bn), Kalpena Industries etc
Outlook & Valuations
• Growth of masterbatch business is purely volume driven; as companies in this industry has to pass-on any increase/decrease in prices of raw material to end
consumer. Growth opportunity exists both in domestic as well as export market.
• This business is steady 9-11% EBITDA margin business; with very little scope of margin improvement based on pricing. Product mix change (white, black, colour,
additives) can change the margin profile.
• Global opportunity is huge. India benefits on cost arbitrage front and has better and reliable quality.
• To some extent, especially for specialised masterbatch, this business is also driven by relationship and trust factor between supplier and end user.
• R&D and hence new product developments is the key differentiating factor among various players.
• Growth of masterbatch industry is reliant on growth on consumption of plastic in economy. As of now, packaging accounts for dominant share of consumption
amongst end user. Going forward, agriculture and infrastructure will drive the faster growth.
• Being fragmented, with unorganised sector accounting for 50% of the industry, implementation of GST will make unorganised sector non-competitive.
This industry will be one of the key beneficiary of implementation of GST in India.
• PIL has undertaken capacity expansion program (from current 85,000 tonnes to 1,15,000 tonnes by Mar16), benefits of which will be reflected in
FY17E. Existing capacity is enough to take care of FY16E growth.
• During FY15, sales volume was ~61,000 tonnes and is likely to touch 70,000-72,000 tonnes in FY16E, implying volume growth of 15-18%, mainly aided
by increase in exports.
• At CMP, the business is available P/E multiple of 15.9x FY15 earnings. Looking at the quality of earnings and 15-18% earnings growth outlook, we
believe the valuations are attractive and there is likelihood of re-rating.
• Looking at the strong balance sheet, healthy return ratios, decent dividend payout, modest growth outlook and decent valuation, we have POSITIVE
outlook on Plastiblends India Ltd. We have NOT RATED the company.
Key Risk Factors
• Increasing competition from well-established international players
• Low entry barrier to business
• Growth is dependent on the growth of plastic industry and any slowdown in the same will hamper the growth of the masterbatch industry.
• Ban on usage of any kind particular plastic products may affect PIL’s growth.
10
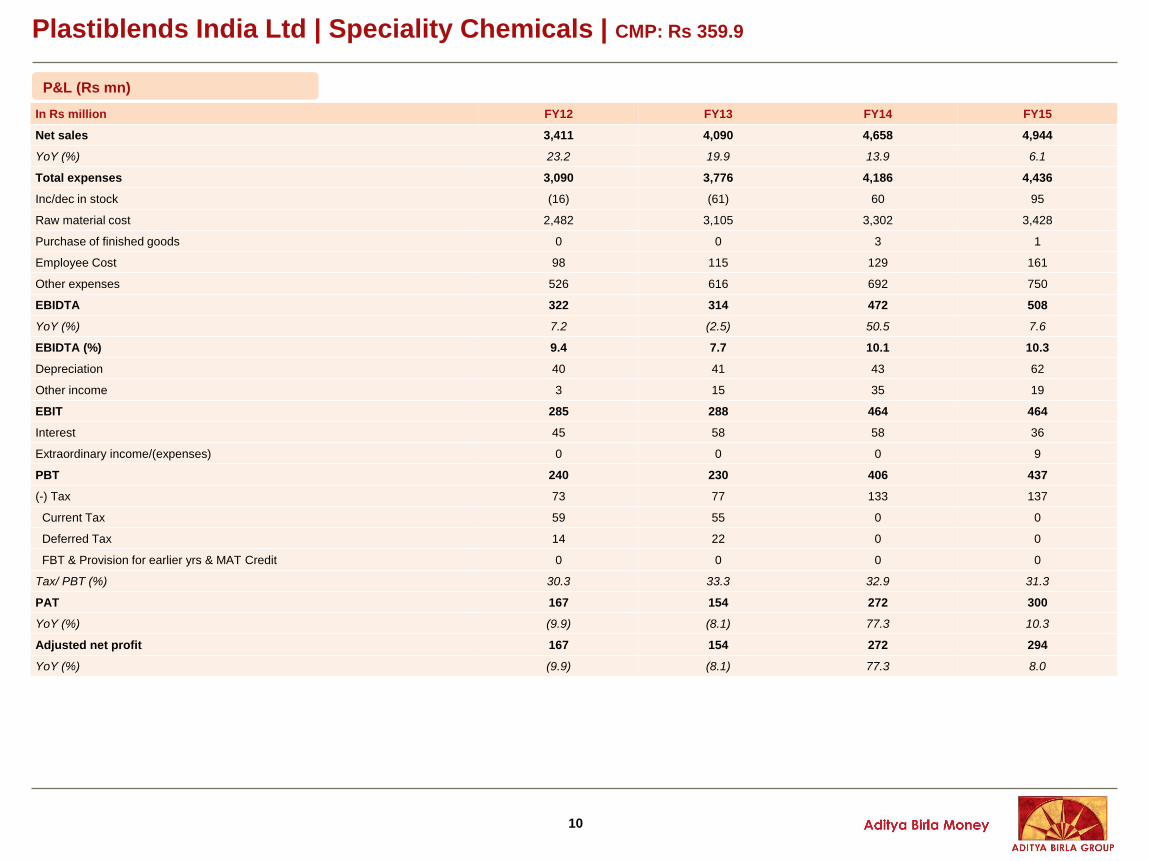
In Rs million FY12 FY13 FY14 FY15
Net sales 3,411 4,090 4,658 4,944
YoY (%) 23.2 19.9 13.9 6.1
Total expenses 3,090 3,776 4,186 4,436
Inc/dec in stock (16) (61) 60 95
Raw material cost 2,482 3,105 3,302 3,428
Purchase of finished goods 0 0 3 1
Employee Cost 98 115 129 161
Other expenses 526 616 692 750
EBIDTA 322 314 472 508
YoY (%) 7.2 (2.5) 50.5 7.6
EBIDTA (%) 9.4 7.7 10.1 10.3
Depreciation 40 41 43 62
Other income 3 15 35 19
EBIT 285 288 464 464
Interest 45 58 58 36
Extraordinary income/(expenses) 0 0 0 9
PBT 240 230 406 437
(-) Tax 73 77 133 137
Current Tax 59 55 0 0
Deferred Tax 14 22 0 0
FBT & Provision for earlier yrs & MAT Credit 0 0 0 0
Tax/ PBT (%) 30.3 33.3 32.9 31.3
PAT 167 154 272 300
YoY (%) (9.9) (8.1) 77.3 10.3
Adjusted net profit 167 154 272 294
YoY (%) (9.9) (8.1) 77.3 8.0
P&L (Rs mn)
Plastiblends India Ltd | Speciality Chemicals | CMP: Rs 359.9
11
Balance Sheet (Rs mn)
Plastiblends India Ltd | Speciality Chemicals | CMP: Rs 359.9
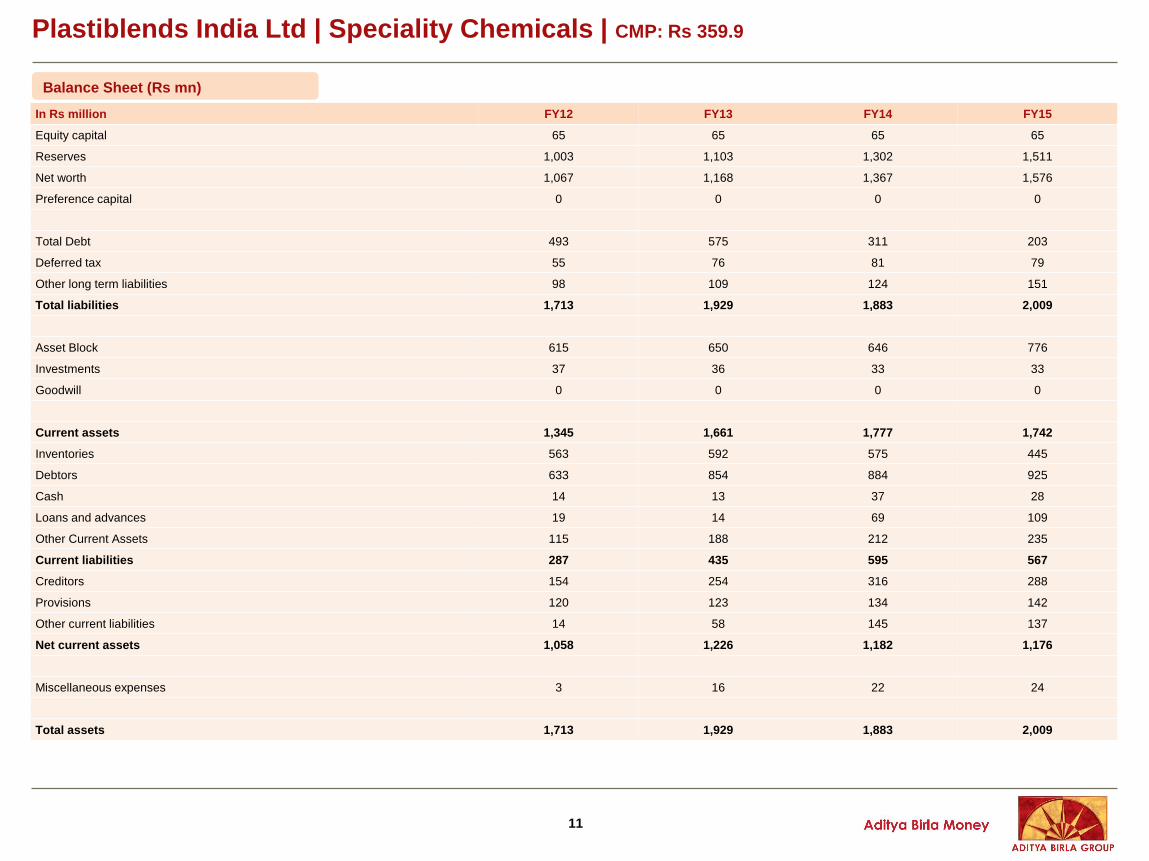
In Rs million FY12 FY13 FY14 FY15
Equity capital 65 65 65 65
Reserves 1,003 1,103 1,302 1,511
Net worth 1,067 1,168 1,367 1,576
Preference capital 0 0 0 0
Total Debt 493 575 311 203
Deferred tax 55 76 81 79
Other long term liabilities 98 109 124 151
Total liabilities 1,713 1,929 1,883 2,009
Asset Block 615 650 646 776
Investments 37 36 33 33
Goodwill 0 0 0 0
Current assets 1,345 1,661 1,777 1,742
Inventories 563 592 575 445
Debtors 633 854 884 925
Cash 14 13 37 28
Loans and advances 19 14 69 109
Other Current Assets 115 188 212 235
Current liabilities 287 435 595 567
Creditors 154 254 316 288
Provisions 120 123 134 142
Other current liabilities 14 58 145 137
Net current assets 1,058 1,226 1,182 1,176
Miscellaneous expenses 3 16 22 24
Total assets 1,713 1,929 1,883 2,009
12
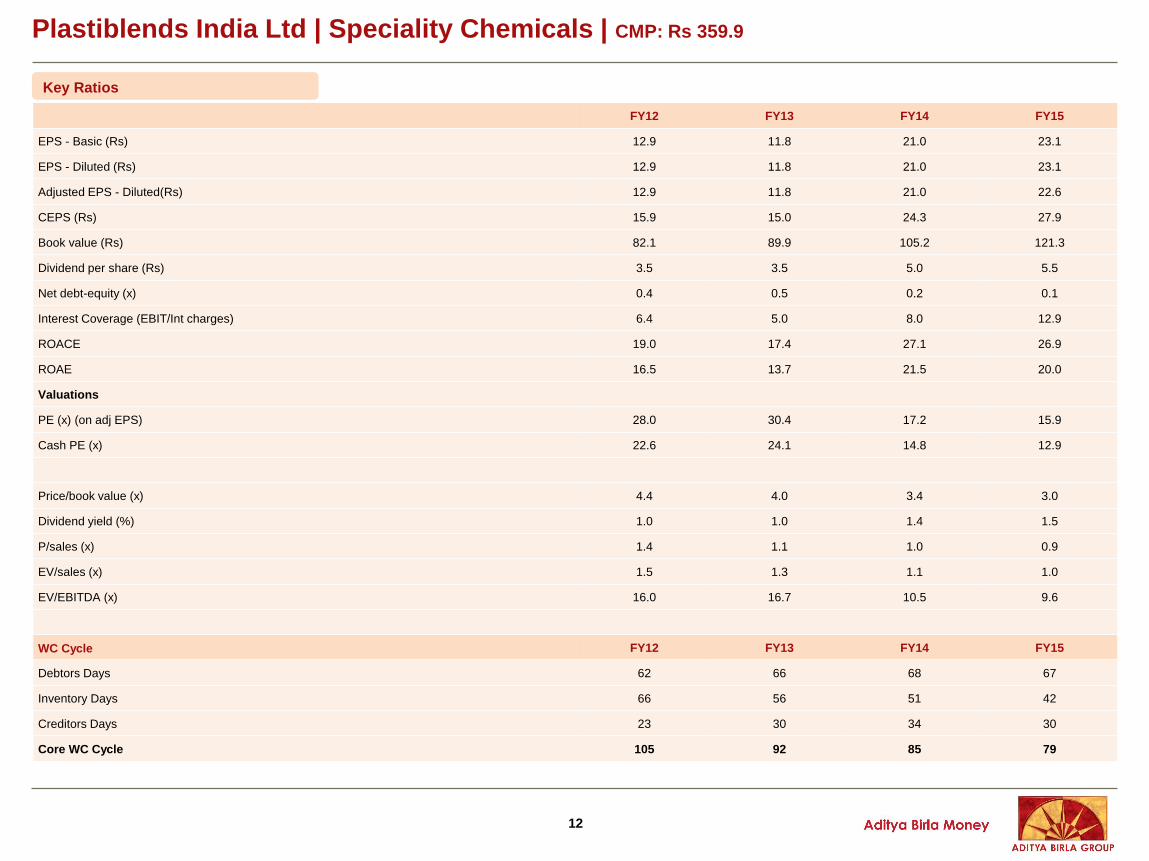
FY12 FY13 FY14 FY15
EPS - Basic (Rs) 12.9 11.8 21.0 23.1
EPS - Diluted (Rs) 12.9 11.8 21.0 23.1
Adjusted EPS - Diluted(Rs) 12.9 11.8 21.0 22.6
CEPS (Rs) 15.9 15.0 24.3 27.9
Book value (Rs) 82.1 89.9 105.2 121.3
Dividend per share (Rs) 3.5 3.5 5.0 5.5
Net debt-equity (x) 0.4 0.5 0.2 0.1
Interest Coverage (EBIT/Int charges) 6.4 5.0 8.0 12.9
ROACE 19.0 17.4 27.1 26.9
ROAE 16.5 13.7 21.5 20.0
Valuations
PE (x) (on adj EPS) 28.0 30.4 17.2 15.9
Cash PE (x) 22.6 24.1 14.8 12.9
Price/book value (x) 4.4 4.0 3.4 3.0
Dividend yield (%) 1.0 1.0 1.4 1.5
P/sales (x) 1.4 1.1 1.0 0.9
EV/sales (x) 1.5 1.3 1.1 1.0
EV/EBITDA (x) 16.0 16.7 10.5 9.6
WC Cycle FY12 FY13 FY14 FY15
Debtors Days 62 66 68 67
Inventory Days 66 56 51 42
Creditors Days 23 30 34 30
Core WC Cycle 105 92 85 79
Key Ratios
Plastiblends India Ltd | Speciality Chemicals | CMP: Rs 359.9
13
Research Team
Vivek Mahajan Hemant Thukral
Head of Research Head – Derivatives Desk
022-61802820 022-61802870
[email protected] [email protected]
Fundamental Team
Sunny Agrawal FMCG/Cement/Mid Caps 022-61802831 [email protected]
Shreyans Mehta Construction/Real Estate 022-61802829 [email protected]
Jaymin Trivedi Banking & Finance 022-61802833 [email protected]
Pradeep Parkar Database Analyst 022-61207625 [email protected]
Quantitative Team
Sudeep Shah Sr.Technical Analyst 022-61802837 [email protected]
Rahil Vora Technical Analyst 022-61802834 [email protected]
Soni Patnaik Derivative Analyst 022-61802832 [email protected]
Advisory Support
Suresh Gardas Advisory Desk 022-61207619 [email protected]
Salim Hajiani Advisory Desk 022-61207618 [email protected]
Mohan Jaiswal Executive – Research Support 022-61802838 [email protected]
ABML research is also accessible in Bloomberg at ABMR
14
Disclaimer:
This document is not for public distribution and is meant solely for the personal information of the authorised recipient. No part of the
information must be altered, transmitted, copied, distributed or reproduced in any form to any other person. Persons into whose
possession this document may come are required to observe these restrictions. This document is for general information purposes
only and does not constitute an investment advice or an offer to sell or solicitation of an offer to buy / sell any security and is not
intended for distribution in countries where distribution of such material is subject to any licensing, registration or other legal
requirements.
The information, opinion, views contained in this document are as per prevailing conditions and are of the date of appearing on this
material only and are subject to change. No reliance may be placed for any purpose whatsoever on the information contained in this
document or on its completeness. Neither Aditya Birla Money Limited (ABML) nor any person connected with it accepts any liability or
loss arising from the use of this document. The views and opinions expressed herein by the author in the document are his own and do
not reflect the views of Aditya Birla Money Limited or any of its associate or group companies. The information set out herein may be
subject to updating, completion, revision, verification and amendment and such information may change materially. Past performance
is no guarantee and does not indicate or guide to future performance.
Nothing in this document is intended to constitute legal, tax or investment advice, or an opinion regarding the appropriateness of any
investment, or a solicitation of any type. The contents in this document are intended for general information purposes only. This
document or information mentioned therefore should not form the basis of and should not be relied upon in connection with making
any investment. The investment may not be suited to all the categories of investors. The recipients should therefore obtain your own
professional, legal, tax and financial advice and assessment of their risk profile and financial condition before considering any decision.
Aditya Birla Money Limited, its associate and group companies, its directors, associates, employees from time to time may have
various interests/ positions in any of the securities of the Company(ies) mentioned therein or be engaged in any other transactions
involving such securities or otherwise in other securities of the companies / organisation mentioned in the document or may have other
potential conflict of interest with respect of any recommendation and / related information and opinions.