Embed Size (px)
Citation preview
Ambit Capital and / or its affiliates do and seek to do business including investment banking with companies covered in its research reports. As a result, investors should be aware that Ambit Capital may have a conflict of interest that could affect the objectivity of this report. Investors should not consider this report as the only factor in making their investment decision.
VISIT NOTE MACA IN EQUITY November 10, 2014
Catapulting to a global force
Mahindra CIE’s (MCIE) extant operations across India/ Europe are set to become more profitable as it plugs into CIE’s global operations and adapts to CIE’s methods. CIE’s track record of turning around flailing companies and its relationships with global auto majors provides confidence that EBITDA margins/RoCE are set to improve multi-fold from better controls/ process but more importantly widening client/product portfolio. Valuations have improved materially (15x FY17 EPS) but can rerate further as MCIE transforms into a global force, and becomes platform for CIE’s India/Asia aspirations.
Competitive position: MEDIUM Changes to this position: POSITIVE Successful auto ancillaries need scale and wider presence Besides rationalisation of the vendor base by auto OEMs, rising investment in technology and the need for a global manufacturing base have necessitated critical mass and wider geographical presence for component suppliers. Mahindra CIE (MCIE), as part of CIE, will become a global forging powerhouse (forging revenue of ~US$630mn) and will also get access to most of the important global auto markets; this should drive business/sourcing benefits. A portfolio of products for clients across the world and emerging India With CIE Automotive taking over MCIE, MCIE will have a portfolio and the ability to develop products for major auto markets across platforms (especially PVs) and demand cycles. MCIE can leverage CIE’s relationships for global and Indian supplies and bring in PV products (like cross car beams) from CIE’s portfolio into India. Simultaneously, CIE Automotive through MCIE can get a foothold in India, which is an emerging secular growth market unlike the niche and difficult markets of China and Russia.
CIE’s track record lends confidence for European business turnaround CIE in the initial 2-3 years will focus on improving the EBITDA margin of 2.8% of the erstwhile Mahindra Forgings’ European (MFE) plants (40% of revenues, 13% of EBITDA in FY14). CIE’s strong track record of profitability (14% margin at European plants) and turning around flailing businesses (Autoforjas and Pemsa) through intense cost focus, decentralisation and process improvement make us confident of an MFE turnaround. MFE’s margins have already improved to 7.2% in 2QFY15 due to price increase/employee rationalisation. Valuations to get rich as MCIE transforms to a credible global supplier Consensus expects consolidated EBITDA margin to increase to 12.2%/13.4% in FY16/17 from 7.2% in FY14. Over FY14-17, consensus expects EBITDA/PBT CAGR of 27%/117%; low capex needs would expand RoCE to 16% in FY17 from 5.2% in FY14. On FY17 basis, the stock is trading at 8.0x EBITDA and 14.7x EPS, implying a 30-35% discount to peers (Bharat Forge). Whilst its RoCEs may remain behind peers, we see the business metamorphosing to the shape and form of other leading Indian auto ancillaries.
Mahindra CIE AutomotiveNOT RATED
Auto & Auto Ancillaries
Recommendation Mcap (bn): Rs19/US$0.3 3M ADV (mn): Rs56/US$0.9 CMP: Rs204 TP (12 mths): NA Downside (%): NA
Flags Accounting: AMBER Predictability: AMBER Earnings Momentum: GREEN
Catalysts
Margin improvement in Europe (ex-CIE) – consensus expectation of 9.2% margin in FY16 (vs 2.8% in FY14)
Recovery in domestic PV industry (we expect 12% volume CAGR over FY14-17 vs decline of 6% in FY14)
Performance
Source: Bloomberg, Ambit Capital research
050100150200250
19,000 21,000 23,000 25,000 27,000 29,000
Nov
-13
Dec
-13
Jan-
14
Ma
r-14
Ma
y-1
4
Jun
-14
Jul-
14
Sep-
14
Oct
-14
Sensex Mahindra CIE (Rs)
Analyst Details
Ashvin Shetty, CFA
+91 22 3043 3285
Ritu Modi
+91 22 3043 3292 [email protected]
Key financials – Mahindra CIE (consolidated) (please see note below) Year to March (Rs mn) FY10 FY11 FY12 FY13 FY14
Net Sales 13,274 19,245 24,403 50,623 54,387
EBITDA (88) 1,798 2,083 3,329 3,935
EBITDA (%) -0.7% 9.3% 8.5% 6.6% 7.2%
EPS (Rs) (17.0) 1.3 5.7 (3.3) (3.4)
RoCE (%) -10% 4% 7% 2% 3%
RoE (%) -19% 1% 6% -7% -7%
EV/EBITDA (x) NM 13.8 11.9 25.2 20.8
Source: Company, Ambit Capital research. Note: Financials for Mahindra Forgings (MFL) from FY10 to FY12 and proforma for Mahindra CIE (including MFL and other entities to be merged) for FY13 and FY14

Mahindra CIE Automotive
November 10, 2014 Ambit Capital Pvt. Ltd. Page 2
Prelude to the Mahindra CIE alliance Mahindra Systech was created in 2004 to capitalise on the opportunities presented by the growth of the Indian automobile component industry as a result of increasing domestic vehicle production as well as growing emphasis on Low Cost Country (LCC) sourcing for Global Automotive OEMs.
With the promise of creating an automotive supplier that could lead in ‘Systems and Technologies’, Systech was formed through an amalgamation of Mahindra group companies combined with a series of acquisitions in India and around the world. The Systech automotive component businesses (represented by separate companies) covered a product portfolio spanning stampings, castings, forgings, gears, magnetic products and composites, with operations in India, Germany, Italy and the UK. The details of individual companies within the Systech division are explained in Exhibit 12.
We focus here on the journey of Mahindra Forgings Limited which was the flagship company contributing nearly 60% to M&M’s Systech division’s revenues and the performance of which, we believe, played a crucial part in M&M’s Systech division entering into an alliance with CIE Automotive.
Mahindra Forgings grew aggressively through acquisitions in the last decade
Mahindra Forgings Limited (MFL – incorporated as Mahindra Automotive Steels), a subsidiary of Mahindra & Mahindra (M&M) forayed into the forgings business through the acquisition of Chakan unit of Amforge Industries in 2006. Initially, MFL supplied forged and machined products to the domestic passenger vehicle industry. Over the years, MFL expanded its geographical presence (Europe), product categories (commercial vehicle segment) as well as the client base (Daimler, MAN, John Deere, etc) through several overseas acquisitions. By December 2006, MFL had established a strong presence in the European market by acquiring Stokes Group (based in UK), Jeco Holdings AG and Schöneweiss & Co. GmbH (both based in Germany)
Exhibit 1: MFL’s acquisitions in the last decade
Year Target Acquisition cost (Rs mn) Stake acquired
Revenues (Rs mn) - at the time of
acquisition
Apr-05 Amforge Chakan Plant 1,400 100% NA
Jan-06 Stokes 250 99.5% 1,911
Nov-06 Jeco Holdings 8,170 67.9% 10,797
Dec-06 Schöneweiss 4,085 100%* 5,336
Source: Industry, Company, Ambit Capital research. Note: * voting power acquired = 90.47%
Initially these acquisitions were carried out directly by M&M and were later merged into MFL in FY08. As a result, MFL’s revenues grew from just about Rs2bn in FY06 (the year of incorporation) to Rs23bn by FY08, with Europe accounting for a lion’s share (~90%) of business operations in FY08. The consideration paid for these acquisitions as well as consolidation of debt of acquired entities meant that the consolidated net debt/(cash):equity increased from (0.1)x as at end-FY06 to 1.1x by end-FY09.

Mahindra CIE Automotive
November 10, 2014 Ambit Capital Pvt. Ltd. Page 3
Exhibit 2: Whilst MFL’s standalone revenues increased by a CAGR of only 4% over FY06-08…
Source: Company, Ambit Capital research
Exhibit 3: …inorganic acquisitions boosted consolidated revenues (CAGR of 241% over FY06-08)
Source: Company, Ambit Capital research
2008-09 downturn significantly impacted business performance
With the onset of the economic crisis of FY09, revenues declined; the FY09 consolidated performance was helped by a strong performance in 1HFY09, when revenues grew 25% YoY and EBITDA grew 44% YoY. However, the performance of the company deteriorated significantly in 2HFY09, with revenues declining 30% YoY. Overall, consolidated revenues declined nearly 43% in FY10 vs the FY08 levels.
The slowdown in revenues was accompanied by deterioration in the consolidated margin which plummeted from 7.9% in FY08 to -0.7% in FY10.
Exhibit 4: Whilst MFL’s standalone performance grew from strength to strength…
Source: Company, Ambit Capital research
Exhibit 5: …the slowdown in Europe led to consolidated revenues declining by 24% over FY08-10
Source: Company, Ambit Capital research
A short-lived revival in FY11 and FY12
After a severe slump in FY09, which lasted through most of FY10 (heavy trucks volumes in Germany declined by >60% in FY10), demand for heavy trucks started to pick up in 2HFY10, with a strong recovery in 4QFY10. This recovery sustained in FY11 (up 45%) and FY12 (up 27%), with volumes reaching 60-65% of the pre-2008-09 crisis. With an improvement in volumes, consolidated EBITDA margin improved from -0.7% in FY10 to 8.5% in FY12.
However, this recovery was short-lived, with the slowdown setting in once again. Registration of heavy trucks in Germany contracted by 9% in 1HFY13. The decline in growth continued in 2HFY13, with heavy truck registrations in Germany contracting by 17.5% YoY. The operational performance of Mahindra Forgings Europe (MFE) was
-12.0%
-7.0%
-2.0%
3.0%
8.0%
13.0%
1,800
1,850
1,900
1,950
2,000
2,050
2,100
2,150
2,200FY
06
FY07
FY08
Revenues (Rs mn) - LHS EBITDA margin RoE
-12.0%
-7.0%
-2.0%
3.0%
8.0%
13.0%
-
5,000
10,000
15,000
20,000
25,000
FY06
FY07
FY08
Revenues (Rs mn) - LHS EBITDA margin RoE
-7.0%
-2.0%
3.0%
8.0%
13.0%
18.0%
1,600
1,800
2,000
2,200
2,400
2,600
2,800
3,000
FY08
FY09
FY10
Revenues (Rs mn) - LHS EBITDA margin RoE
-20.0%
-15.0%
-10.0%
-5.0%
0.0%
5.0%
10.0%
10,000
12,000
14,000
16,000
18,000
20,000
22,000
24,000
FY08
FY09
FY10
Revenues (Rs mn) - LHS EBITDA margin RoE
FY09 performance was impacted by the downturn in 2HFY09 YoY growth 1HFY09 2HFY09 FY09
Revenues 25% -30% -3%
EBITDA 44% -129% -35%
Source: Company, Ambit Capital research
FY11 and FY12 saw a rebound in performance
Source: Company, Ambit Capital research
0.0%2.5%5.0%7.5%10.0%12.5%
10,000 12,500 15,000 17,500 20,000 22,500 25,000
FY1
0
FY1
1
FY1
2
Revenues (Rs mn)EBITDA margin

Mahindra CIE Automotive
November 10, 2014 Ambit Capital Pvt. Ltd. Page 4
affected by this decline in sales. Average monthly sales at MFE, Germany, declined continuously in 9MFY13.
The EBITDA margin declined from 8.5% in FY12 to 1.9% in FY13. Besides the negative impact of lower revenues, the margin was also impacted by the following specific factors:
(a) Significant operational problems at Schoeneweiss & Co. GmbH (MFE’s second-largest plant) which led to deterioration in its PBT margin (from -0.7% in FY12 to -13.5% in FY13)
(b) Increase in employee costs due to demands from the unions which were backed by the government to boost demand in the economy (wages in Germany increased by 11.7% between January 2009 and May 2012)1;
(c) Higher product development costs associated with meeting the requirements of Euro VI;
(d) Increase in power costs due to Germany moving away from the cheaper nuclear power plants to costlier renewable energy options. Between 2008 and 2013, power tariffs increased by ~34%; furthermore, these increases were not compensated by the customers1; and
(e) In order to generate sales, the company undertook many low-margin orders.
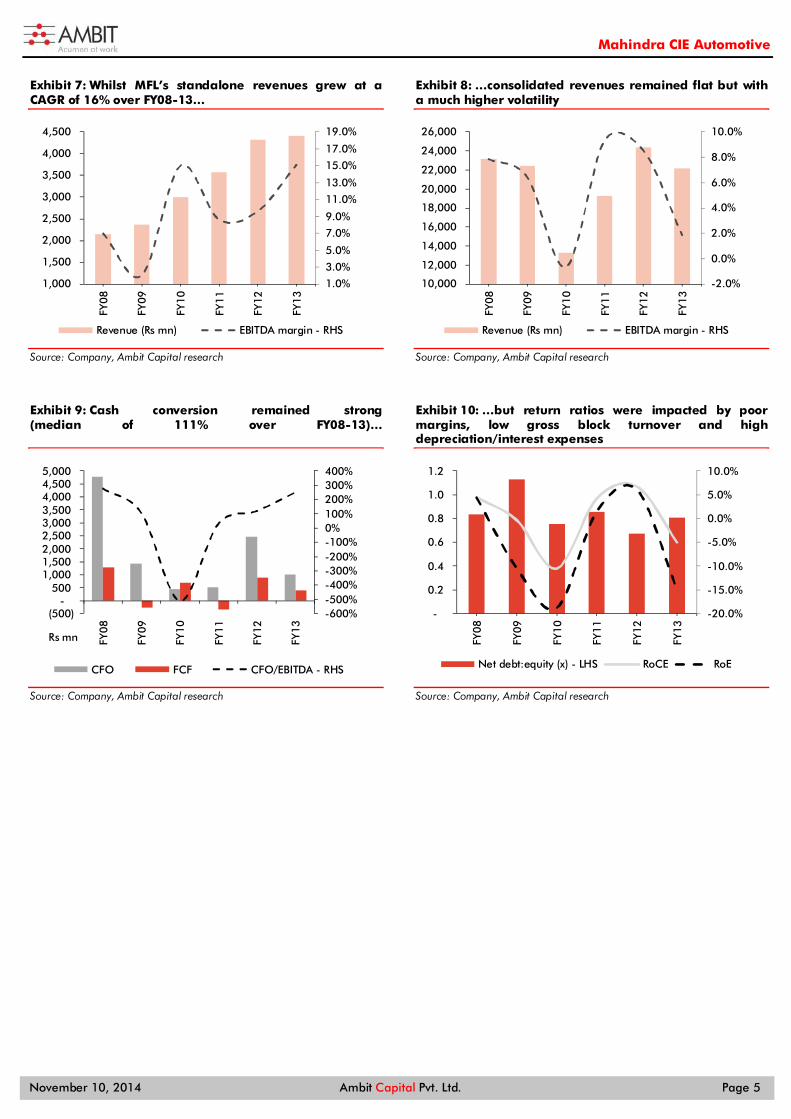
The strong performance at the domestic level (EBITDA margin increasing from 7.0% in FY08 to 15.1% in FY13) was unable to offset the weakness in the European business which adversely affected the company’s consolidated margins. EBITDA margin declined from 7.9% in FY08 to 1.9% in FY13 and RoCE declined to -4.9% (from 9.0% in FY08). Deteriorating profitability also led to consolidated CFO declining from Rs5bn in FY08 to Rs1bn in FY13.
Exhibit 6: Deterioration in EBITDA margin driven by increase in employee costs, power and fuel and subcontracting charges
FY08 FY09 FY10 FY11 FY12 FY13 Change in bps
FY08-13 FY12-13
Raw material costs 48.3% 49.1% 48.1% 46.0% 44.6% 45.1% (313) 58
Employees costs 24.1% 24.0% 27.3% 22.0% 23.8% 28.1% 409 438
Power & fuel 5.5% 6.2% 8.0% 7.0% 7.0% 7.2% 163 18
Freight & forwarding 2.1% 1.3% 1.5% 1.3% 1.4% 1.2% (92) (15)
Repairs & maintenance 4.3% 4.1% 3.5% 3.4% 3.8% 4.8% 45 99 Subcontracting, hire & service charges 2.1% 2.1% 1.3% 3.6% 4.4% 4.5% 243 15
Stores & spares consumed 1.5% 2.9% 3.7% 3.2% 2.9% 3.3% 173 39
Others 4.2% 3.9% 7.3% 4.1% 3.8% 3.9% (29) 16
EBITDA 7.9% 6.4% -0.7% 9.3% 8.5% 1.9% (599) (667)
Source: Company, Ambit Capital research
1FY13 MFL Annual Report – Management discussion and analysis
Operational problems impacted Schoeneweiss’ performance
Source: Company, Ambit Capital research
-20.0%
-10.0%
0.0%
10.0%
1,000 2,000 3,000 4,000 5,000 6,000 7,000
FY09
FY10
FY11
FY12
FY13
Gross sales (Rs mn)PBT margin
Average monthly sales at MFE declined in 9MFY13 (Euro mn)
Source: Company, Ambit Capital research
15
17
19
21
23
FY12
1QFY
13
2QFY
13
3QFY
13
4QFY
13
Mahindra CIE Automotive
November 10, 2014 Ambit Capital Pvt. Ltd. Page 5
Exhibit 7: Whilst MFL’s standalone revenues grew at a CAGR of 16% over FY08-13…
Source: Company, Ambit Capital research
Exhibit 8: …consolidated revenues remained flat but with a much higher volatility
Source: Company, Ambit Capital research
Exhibit 9: Cash conversion remained strong (median of 111% over FY08-13)…
Source: Company, Ambit Capital research
Exhibit 10: …but return ratios were impacted by poor margins, low gross block turnover and high depreciation/interest expenses
Source: Company, Ambit Capital research
1.0%
3.0%
5.0%
7.0%
9.0%
11.0%
13.0%
15.0%
17.0%
19.0%
1,000
1,500
2,000
2,500
3,000
3,500
4,000
4,500
FY08
FY09
FY10
FY11
FY12
FY13
Revenue (Rs mn) EBITDA margin - RHS
-2.0%
0.0%
2.0%
4.0%
6.0%
8.0%
10.0%
10,000
12,000
14,000
16,000
18,000
20,000
22,000
24,000
26,000
FY08
FY09
FY10
FY11
FY12
FY13
Revenue (Rs mn) EBITDA margin - RHS
-600%-500%-400%-300%-200%-100%0%100%200%300%400%
(500) -
500 1,000 1,500 2,000 2,500 3,000 3,500 4,000 4,500 5,000
FY08
FY09
FY10
FY11
FY12
FY13
CFO FCF CFO/EBITDA - RHS
Rs mn
-20.0%
-15.0%
-10.0%
-5.0%
0.0%
5.0%
10.0%
-
0.2
0.4
0.6
0.8
1.0
1.2FY
08
FY09
FY10
FY11
FY12
FY13
Net debt:equity (x) - LHS RoCE RoE

Mahindra CIE Automotive
November 10, 2014 Ambit Capital Pvt. Ltd. Page 6
Systech partners with CIE, a rising global player On the back of significant business challenges faced by MFL, M&M’s Systech division entered into an alliance with CIE Automotive (Spain) in June 2013. Besides MFL, the alliance involves other listed and unlisted auto component entities of M&M (together comprising the Mahindra Systech division except engineering services represented by Mahindra Engineering Services Limited). The key terms and structure of the deal are:
Structure and key terms of the deal
MFL to be renamed as Mahindra CIE. This step has since been concluded.
CIE Automotive, Spain (via its subsidiary Autometal) to purchase M&M’s stake in MFL, Mahindra Composites and Mahindra Hinoday. The cash consideration received by M&M would be re-invested by it for purchase of a 13.5% stake in CIE Automotive. The deal is thus largely cash-neutral for M&M and CIE. This step has since been concluded. As a result, now CIE owns 78.3% in MFL (now renamed as Mahindra CIE), 61.7% in Mahindra Composites and 65.0% in Mahindra Hinoday. On the other hand, M&M’s stake in Mahindra CIE (earlier MFL) has come down to 0.3% but it now owns 12.4% in CIE Automotive.
All the companies of the Systech division other than MFL (now Mahindra CIE) to be merged into Mahindra CIE. This step is currently pending (the approval of Bombay High Court was received recently however approvals of the Foreign Investment Promotion Board and the Reserve Bank of India are still pending). Since M&M continues to own a majority stake in three of the Systech division companies viz. Mahindra Gears, Metalcastello and Mahindra Ugine Steel Co (MUSCO), once these three companies are merged into Mahindra CIE, M&M’s stake would rise from the current 0.3% to a higher level (M&M’s and CIE’s eventual ownership in Mahindra CIE explained below).
CIE Forgings’ European plants situated in Spain and Lithuania would be merged into Mahindra CIE. (This step is pending.)
Post the conclusion of all the steps, CIE would eventually own the majority control (around 53% equity stake) in Mahindra CIE (MCIE), with M&M as a significant minority shareholder (the second-largest shareholder at around 20% stake). Furthermore, M&M would own around 12.4% stake in CIE Automotive at the global level (which would enable M&M to have further indirect equity interest in MCIE). The M&M Group will have three directors on the board of the merged entity (MCIE), whilst CIE will have four directors. M&M will also have two Board positions at CIE Automotive.

Mahindra CIE Automotive
November 10, 2014 Ambit Capital Pvt. Ltd. Page 7
Exhibit 11: Snapshot of merger
Source: Company filings, Ambit Capital research Note: Red font indicates listed entities; dashed line indicates entities/divisions merged to form Mahindra CIE. Mahindra Systech is not a legal entity but a sector of the Mahindra Group which oversees the Autocomp, Engineering Services, Steel & Aerospace businesses. For purposes of this presentation, Systech refers to the Autocomp business only
Post the conclusion of the merger, the business-wise exposure of MCIE would be as follows: Forgings – 67%, Stampings – 13%, Gears – 9%, Castings/Magnetics – 10% and Composites – 1%. The geography-wise exposure would be: India – 35%, outside India (mainly Europe) – 65%.
Exhibit 12: Snapshot of businesses (based on FY14 numbers)
Business / Company Geography Mcap (US$mn)
Revenues (Rs mn)
EBITDA (Rs mn) Margin PAT
(Rs mn)
Net Debt
(Rs mn)
Net debt: Equity (x) RoCE RoE CFO/
EBITDA FCF
(Rs mn)
Forgings
Mahindra Forgings Europe 22,240 623 2.8% Mahindra Forgings India 3,865 523 13.5%
Mahindra Forgings Ltd Europe + India 310 25,908 1,087 4.2% (732) 6,349 1.0 -1% -11% 194% 1,378
CIE Forgings* Europe Not listed 10,424 1,390 13.3% 392 4,169 1.7 NA 16% 61% 299
Stampings Mahindra Ugine Steel Co India 286 7,230 510 7.1% (410) (379) (0.1) 11% -11% 149% 1,736
Composites Mahindra Composites India 13 660 24 3.7% (2) 76 0.5 2% -1% 129% 15
Gears Mahindra Gears India Not listed 1,455 201 13.8% 61 431 0.6 8% 9% 113% (66)
Metalcastello Europe Not listed 3,539 206 5.8% (515) 4,094 5.5 -9% -69% -2% (341)
Casting/Magnetics Mahindra Hinoday India Not listed 5,170 518 10.0% 151 1,113 0.72 10% 10% 84% 333
Total 54,387 3,935 7.2% (1,066) 15,754
Source: Company filings, Ambit Capital research. Note: CFO is post tax for calculation of CFO/EBITDA; * CIE Forgings’ financials are for FY13

Mahindra CIE Automotive
November 10, 2014 Ambit Capital Pvt. Ltd. Page 8
Exhibit 13: Snapshot of businesses (continued)
Business / Company Geography Mcap (US$ mn)
Major shareholders (ex-M&M) Major competitors
Forgings
Mahindra Forgings Ltd Europe + India 310 Sundaram MF, Blackrock, SBI, UTI Asset Management
Bharat Forge, Amtek Auto
CIE Forgings Europe Not listed
Stampings
Mahindra Ugine Steel Co India 286
Prudential Management, Sundaram Asset Management, UTI Asset Management, LIC
JBM Auto
Composites
Mahindra Composites India 13 Prudential Management
Gears
Mahindra Gears India Not listed IDBI Trusteeship Bharat Gears, Shanti Gears
Metalcastello Europe Not listed
Casting/Magnets
Mahindra Hinoday India Not listed IVF Trustee Company Nelcast, Kirloskar Ferrous Industries
Source: Company, BSE, Bloomberg, Ambit Capital research
At the current market price of MCIE and the expanded share capital (from 92mn to ~325mn) post the conclusion of the merger, the market capitalisation of MCIE works out to US$1,081mn and enterprise valuation works out to US$1,334mn.
Exhibit 14: Swap ratios for various entities involved in the merger
Company FY14 O/S shares Swap ratio Shares in merged entity
Mahindra Forgings 93 1.0 93
CIE Forgings Europe 60 1.1 65
Mahindra Ugine Steel Co 33 2.8 93
Mahindra Composites 4 0.9 4
Mahindra Investments* 80 0.2 14
Metalcastello 23 0.2 5
Mahindra Hinoday 47 1.1 51
Total 325
Source: Company, Ambit Capital research. Note: * Holding company of Mahindra Gears & Transmission

Mahindra CIE Automotive
November 10, 2014 Ambit Capital Pvt. Ltd. Page 9
Alliance benefits all! Rationale from M&M’s perspective – A foothold in global automotive component supplier space
The benefits to M&M from the alliance are:
(a) CIE has a strong track record of turning around businesses. The European business constituted more than 80% of total revenues of the erstwhile MFL. Given CIE’s track record of turning around operations, expertise of and proximity to the European markets, it could play a better role than M&M in handling the turnaround efforts at MFL’s European operations.
(b) M&M becomes the second-largest shareholder with a 12.4% stake (with two Board seats) in CIE Automotive, which post control of MCIE would become one of the largest global auto component companies (75th largest auto component supplier by revenues). At the same time, M&M would continue to retain a significant minority ownership interest at the MCIE level.
(c) The merger provides M&M with a significant ownership presence in all major automotive growth markets (India, Brazil, Europe, NAFTA).
(d) The CIE alliance can be leveraged for building relationships with global OEMs (particularly European and North American players like Volkswagen, BMW, Renault, Ford and General Motors) with which CIE has a well-established relationship.
(e) There is a possibility of new product introductions from CIE’s global PV portfolio into the Indian market which would not have been possible without the alliance.
Exhibit 15: Benefits to M&M through this alliance
Source: Company presentation

Mahindra CIE Automotive
November 10, 2014 Ambit Capital Pvt. Ltd. Page 10
Rationale from CIE’s perspective – A foothold in Indian market and opportunity to turn around Systech’s European operations
CIE Automotive would benefit from the merger in the following ways:
(a) As part of its growth strategy, CIE has been constantly looking for newer opportunities and newer markets where it can get significant market share. Whilst CIE has entered countries like China and Russia, CIE has concluded that its presence in these geographies would be limited towards specific niche products. On the other hand, with strong long-term opportunity for industry growth and low cost structure, CIE has identified India as its gateway to the Asian and ASEAN markets.
Exhibit 16: CIE’s strategy
Country/Region Market situation Strategy
India PV market expected to grow from 3.7mn to 10mn units p.a. in the next 10 years
Enter now to take advantage from the beginning
China Growing market but impossible to have significant market share and thus difficult to obtain profitability
Growth only in strategic products
Russia Difficult market situation and difficult to get market share
Develop only strategic products (aluminum engine parts and forging crankshafts)
Source: Company presentation
(b) CIE being a turnaround specialist with existing profitable operations in Europe gets the opportunity to turnaround the profitability levels at MFE (CIE has a strong track record of profitability and turnaround explained in subsequent sections).
(c) It can increase its presence in existing markets through potential new clients and products.
Synergies from a bigger combined entity
The need for larger size and wider presence to garner bigger business share
Besides rationalisation of the vendor base by the OEMs (to bring down their procurement costs), there is an increased need for critical mass and presence for automotive component suppliers. These needs are driven by:
(a) Rising investment in technology/differentiation: The shortening product lifecycle at OEMs and new emission and light weighting norms require greater product development capabilities. As a result, suppliers are likely to focus more on engineering for differentiation. This requires investments by suppliers in R&D which can be justified by a certain scale of the business. MCIE will have a turnover of close to US$900mn and hence will be well positioned to make investments in product development capabilities.
(b) Requirement of global presence: Vehicle platforms and standards are converging globally driven by the need to maximise the number of the products per platform. There is an increasing trend of customers seeking global suppliers (OEMs themselves and Tier-1 suppliers) for global platforms. Cost imperatives as well as timeliness of delivery require these suppliers to have a local presence. MCIE would be amongst the few suppliers with one of the widest geographical presence amongst the most important auto markets of the world and hence it will be well positioned to exploit these trends.

Mahindra CIE Automotive
November 10, 2014 Ambit Capital Pvt. Ltd. Page 11
Exhibit 17: The alliance covers the most important auto markets (except Korea/Japan)
Source: Company presentation. Note: Red areas indicate where CIE is already present and Blue indicates where CIE will have a presence through MCIE
(c) Cost benefits from scale: MCIE, post the completion of the merger process, will become one of the largest global forging companies in the world with a strong presence across Indian PV, European CVs and European PV markets.
Exhibit 18: MCIE will become a global forging powerhouse
MF – India MF - Europe
CIE - Europe Germany UK
Key forging products
Crankshafts, stub axles, steering knuckles, suspension/chassis parts, gear blanks
Front axle beams, steering knuckles, pitman arms, ball joints
Shafts, gears, spindles, , levers, flanges
Crankshafts
Key vehicle categories
Utility vehicles (54%), passenger cars (26%) Commercial vehicles Passenger vehicles Passenger cars
Key customers M&M, Tata Motors and Maruti Suzuki Daimler, Volvo BMW, Renault,
Volkswagen Volkswagen
Sales (US$ mn) 70 360 200
Source: Company, Ambit Capital research. Note: MF- Mahindra Forgings
MCIE’s forging business will have a turnover of approximately US$630mn (based on FY14 revenues). This will place it amongst the top global forging companies like ThyssenKrupp and Bharat Forge. Furthermore, outside of MCIE, CIE has presence in Brazil, Mexico (which is also used for exporting to USA) and China.
The wide geographical presence as well as the large size would enable access to global supply chain and large scale sourcing benefits (specialty steel is the key raw material for forged components). Besides better pricing on raw materials, there could be cost optimisation benefits in procurement, designing and logistics costs.
Post the merger, MCIE will be amongst the top global forging companies
US$ mn Remarks
Bharat Forge 705
Does not include turnover of its non-auto business
Mahindra CIE 630
May include small portion of revenues pertaining to non-auto business
Source: Company, Ambit Capital research

Mahindra CIE Automotive
November 10, 2014 Ambit Capital Pvt. Ltd. Page 12
The course correction Turnaround of MFE, the key near-term target The focus of CIE in the first phase would be towards fiscal consolidation and turning around the weak businesses (mainly MFE). CIE has a stated fiscal strategy of net debt of <2x EBITDA (amongst other things). As of end-FY13, MCIE’s (proforma assuming completion of merger) net debt (Rs15.8bn) was much ahead of this at 4.7x EBITDA. CIE aims to undertake the following steps to achieve its target for Mahindra CIE:
Focus towards improvement in the profitability (EBITDA margin) of Mahindra Forgings’ European business (Germany and UK plants) from the current EBITDA margin level of 2.8% to a level of 8-10% in the initial 18-24 months. (How this will be achieved is explained in the following section).
CIE plans to introduce new products from its global product portfolio (like cross car beams and common rails) into the India operations particularly in the passenger vehicle space over the next 18 months.
Leverage CIE’s strong relationships with global OEMs (particularly European and North American players like Ford, BMW, Renault, General Motors, Volkswagen) to increase the market share for the Indian operations.
Given that the current capacity utilisation levels (60-65% in the Indian business and around 70-72% in the European business) leaves headroom for future growth, the company would limit its capex spend to debottlenecking of the existing capacities and maintenance capex. Capex spend for Mahindra CIE (across all businesses) would be contained between Rs2.5bn and Rs3bn for the next three years.
Plans to turnaround MFE From a peak margin of 9.0% in FY11, the margin of MFE declined to -0.3% in FY13 on the back of factors mentioned in the preceding sections. The improvement in profitability at MFE is one of the primary targets over the initial three years. The turnaround in profitability at MFE is planned to be achieved through: (a) Price correction: The company plans to improve pricing across select products
and select customers; (b) Power subsidy: High power cost in Germany was one of the primary drivers for
sharp increase in manufacturing costs. Going forward, the German government has announced an annual power subsidy of €4mn-5mn. This subsidy is likely to continue till the nuclear plants are shutdown in Germany (which is likely till 2018).
(c) Improve productivity: The company plans to leverage CIE’s expertise to improve productivity through reducing cycle times, increasing life of dies and improving process flows and layout.
(d) Reducing employee cost: The company plans to bring down employee costs through selective outsourcing such as that of low value-add products.
The plan is to improve the EBITDA margin to the level of about 10% over 18-24 months through the above steps.

Mahindra CIE Automotive
November 10, 2014 Ambit Capital Pvt. Ltd. Page 13
Exhibit 19: Near-term strategy
Source: Company, Ambit Capital research
The management has clearly indicated that their focus is on improving profitability rather than growth. As a result, even if volumes were to be negatively impacted due to possible slowdown in the economy, they plan to achieve their target of EBITDA margin improvement.

Mahindra CIE Automotive
November 10, 2014 Ambit Capital Pvt. Ltd. Page 14
Can MCIE’s European business be turned around? CIE has a strong track record of profitability and turnaround a) CIE’s intense cost focus helps earn much better margin vs peers: CIE’s
differentiating factors vis-à-vis peers is its intense cost control measures across cost items (mainly corporate overheads). This is achieved through decentralised management of various plants which are independently given targets of RoCEs and EBIT margins.
CIE’s EBITDA margin has been significantly higher than that of its peers. CIE’s margin for CY13 was at 13.1% vs 2.6% for MFE and 5.1% for Bharat Forge Europe (BFE). MFE and BFE have higher gross margins than CIE due to a greater proportion of high-margin machining products. However, CIE’s much lower employee costs and ‘other expenses’ more than make up for its lower gross margin. CIE’s decentralised management leads to lower corporate overheads.
Exhibit 20: CIE’s much lower employee costs and overheads give it a margin advantage over peers
as % of sales CIE Automotive Mahindra Forgings Europe Bharat Forge Europe
CY11 CY12 CY13 FY12 FY13 FY14 FY12 FY13 FY14
Raw material costs 59.6% 56.4% 55.3% 42.0% 43.2% 39.1% 49.3% 44.3% 37.3%
Employee expenses 18.3% 20.1% 20.9% 27.5% 33.4% 31.5% 20.3% 23.2% 17.5%
Transportation 0.9% 1.1% 1.2% 1.3% 1.1% 1.4% 2.0% 3.3% 2.7%
Repairs 1.1% 1.1% 1.2% 3.8% 5.1% 5.6% 3.1% 4.2% 3.2%
Utilities/Power & Fuel 2.7% 2.8% 2.8% 6.3% 6.8% 7.2% 7.3% 6.6% 4.2%
Others 5.0% 5.4% 5.5% 10.7% 11.9% 12.6% 14.8% 15.2% 30.1%
EBITDA 12.6% 13.1% 13.1% 8.3% -1.4% 2.6% 3.1% 3.2% 5.1%
Source: Company, Ambit Capital research
b) Track record of sustaining profitability even during economic downturns CIE’s focus on costs has helped it sustain margins even during periods of slowdown such as the 2008/2009 economic crisis when many auto component companies saw deterioration in profitability. The company established and adopted the following measures: (a) cost cutting measures which lowered the breakeven threshold; (b) reducing working capital requirements and scaling back capex which reinforced the company’s financial structure; (c) focusing on R&D and new product development efforts. Furthermore, CIE’s geographical diversification and prioritisation of higher potential markets enabled it to mitigate the fallout from the crisis in its legacy markets.
Exhibit 21: CIE – Strong track record of profitability even during slowdown
Source: Company presentation
10.5%
11.5%
12.5%
13.5%
14.5%
15.5%
200
400
600
800
1,000
1,200
1,400
1,600
1,800
2003
2004
2005
2006
2007
2008
2009
2010
2011
2012
2013
Sales (Euro mn) EBITDA margin - RHS
Mahindra CIE Automotive
November 10, 2014 Ambit Capital Pvt. Ltd. Page 15
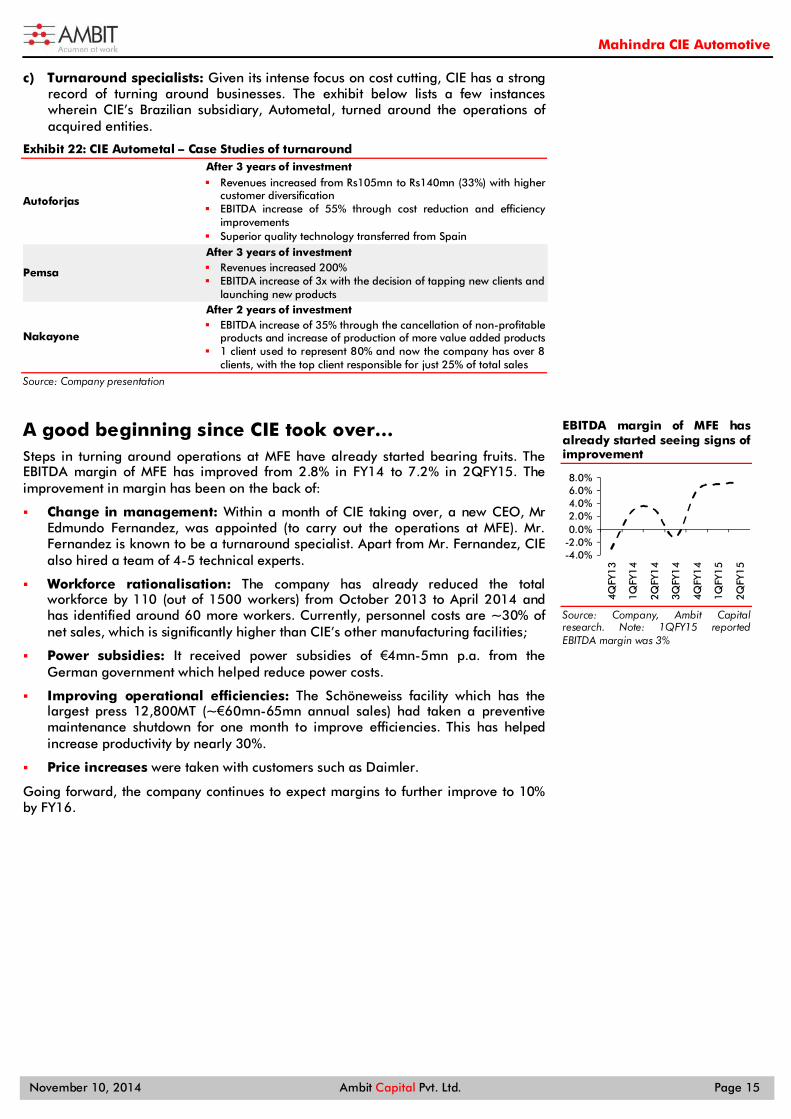
c) Turnaround specialists: Given its intense focus on cost cutting, CIE has a strong record of turning around businesses. The exhibit below lists a few instances wherein CIE’s Brazilian subsidiary, Autometal, turned around the operations of acquired entities.
Exhibit 22: CIE Autometal – Case Studies of turnaround
Autoforjas
After 3 years of investment Revenues increased from Rs105mn to Rs140mn (33%) with higher
customer diversification EBITDA increase of 55% through cost reduction and efficiency
improvements Superior quality technology transferred from Spain
Pemsa
After 3 years of investment Revenues increased 200% EBITDA increase of 3x with the decision of tapping new clients and
launching new products
Nakayone
After 2 years of investment EBITDA increase of 35% through the cancellation of non-profitable
products and increase of production of more value added products 1 client used to represent 80% and now the company has over 8
clients, with the top client responsible for just 25% of total sales Source: Company presentation
A good beginning since CIE took over… Steps in turning around operations at MFE have already started bearing fruits. The EBITDA margin of MFE has improved from 2.8% in FY14 to 7.2% in 2QFY15. The improvement in margin has been on the back of:
Change in management: Within a month of CIE taking over, a new CEO, Mr Edmundo Fernandez, was appointed (to carry out the operations at MFE). Mr. Fernandez is known to be a turnaround specialist. Apart from Mr. Fernandez, CIE also hired a team of 4-5 technical experts.
Workforce rationalisation: The company has already reduced the total workforce by 110 (out of 1500 workers) from October 2013 to April 2014 and has identified around 60 more workers. Currently, personnel costs are ~30% of net sales, which is significantly higher than CIE’s other manufacturing facilities;
Power subsidies: It received power subsidies of €4mn-5mn p.a. from the German government which helped reduce power costs.
Improving operational efficiencies: The Schöneweiss facility which has the largest press 12,800MT (~€60mn-65mn annual sales) had taken a preventive maintenance shutdown for one month to improve efficiencies. This has helped increase productivity by nearly 30%.
Price increases were taken with customers such as Daimler.
Going forward, the company continues to expect margins to further improve to 10% by FY16.
EBITDA margin of MFE has already started seeing signs of improvement
Source: Company, Ambit Capital research. Note: 1QFY15 reported EBITDA margin was 3%
-4.0%-2.0%0.0%2.0%4.0%6.0%8.0%
4QFY
13
1QFY
14
2QFY
14
3QFY
14
4QFY
14
1QFY
15
2QFY
15

Mahindra CIE Automotive
November 10, 2014 Ambit Capital Pvt. Ltd. Page 16
Opportunities beyond European business turnaround Indian forging operations (7% of MCIE revenues) MCIE’s Indian forging business primarily supplies parts to Utility Vehicles (54% of revenues) and passenger cars (26% of revenues), with M&M, Tata Motors and Maruti Suzuki as the largest customers. The company makes an EBITDA margin of 14-16% (15.1% in 1HFY15). As per our discussion with the management, there is scope for further EBITDA margin improvement of 1-2%. The closest competitor, Bharat Forge, earns an EBITDA margin of 25% (FY14) but this is driven by its superior product mix (CV forgings, non-auto) and high export share.
Exhibit 23: Comparison of India forgings business with peers
Rs mn unless specified Mahindra Forgings India Bharat Forge
FY11 FY12 FY13 FY14 FY11 FY12 FY13 FY14
Revenue 3,573 4,325 4,404 3,865 29,470 36,860 31,512 33,993
YoY growth 19% 21% 2% -12% 59% 25% -15% 8%
EBITDA 308 416 666 524 7,155 9,153 7,156 8,637
EBITDA margin 8.6% 9.6% 15.1% 13.6% 24.3% 24.8% 22.7% 25.4%
PAT (32) 83 409 180 3,108 4,325 2,950 3,876
EPS (0.4) 0.9 4.4 1.9 13.3 18.6 12.7 16.6
YoY growth -30% -350% 390% -56% 134% 39% -32% 31%
Networth 8,026 8,594 9,019 9,315 19,954 21,431 23,111 26,933
Net debt 1,364 621 (88) 145 9,986 10,557 12,093 9,721
Net debt:equity (x) 0.17 0.07 (0.01) 0.02 0.50 0.49 0.52 0.36
Source: Company, Ambit Capital research
Other Indian operations
Stampings (13% of MCIE revenues)
MCIE’s stamping business (erstwhile represented by Mahindra Ugine Steel Company) supplies skin components, underbody components, critical assemblies, chassis components and car body sheet metal parts (Body in White) primarily to utility vehicles (63% of revenues) and LCVs (14% of revenues). M&M and Tata Motors are the largest customers. The business makes an EBITDA margin of around 8-10% which is marginally lower than its closest competitor, JBM Auto, which makes an EBITDA margin of 11-12%.
Exhibit 24: Comparison of India stamping business with peers
Rs mn unless specified
Mahindra Ugine Steel Co JBM Auto
FY11 FY12 FY13 FY14 FY11 FY12 FY13 FY14
Revenue 5,538 7,033 7,664 7,230 7,318 9,673 11,710 13,639
YoY growth -49% 27% 9% -6% 76% 32% 21% 16%
EBITDA 433 683 691 510 784 1,116 1,323 1,546
EBITDA margin 7.8% 9.7% 9.0% 7.1% 10.7% 11.5% 11.3% 11.3%
PAT 191 51 151 (410) 248 320 377 570
EPS 5.9 1.6 4.7 (12.6) 16.6 21.3 25.1 38.0
YoY growth 310% -73% 197% -369% 163% 29% 18% 51%
Networth 1,652 2,021 1,681 3,577 1,197 1,447 1,737 2,473
Net debt 3,406 3,051 2,262 (379) 3,088 3,397 3,691 3,051
Net debt:equity (x) 2.06 1.51 1.35 (0.11) 2.58 2.35 2.12 1.23
Source: Company, Ambit Capital research

Mahindra CIE Automotive
November 10, 2014 Ambit Capital Pvt. Ltd. Page 17
Castings/magnetics (9% of MCIE revenues)
This segment represents castings and magnetics businesses (previously represented by Mahindra Hinoday Industries).
The casting business (77% revenue share of this division) is involved in ductile iron casting. It supplies across various automobile categories: utility vehicles (26% of revenues), MHCV (18% of revenues) and cars (12% of revenues). It also has a sizeable share of exports (29% of revenues).
The magnetics business (23% revenue share of this division) is involved in the supply of magnetic products across various automotive motor applications like starter, power window, and engine throttle control and even non-auto applications like transformers, induction cook tops, inductors, EMC components, and mobile chargers. It supplies mainly to 2Ws (27% of revenues) and also exports (35% of revenue). It also has a sizeable share of non-auto revenue exposure at 25% of revenues.
Exhibit 25: Mahindra Hinoday’s comparison with its closest competitor Nelcast
Rs mn unless specified
Mahindra Hinoday Nelcast
FY11 FY12 FY13 FY14 FY11 FY12 FY13 FY14
Revenue 3,752 4,973 4,788 5,170 5,074 6,531 5,076 5,152
YoY growth 27% 33% -4% 8% 59% 29% -22% 1%
EBITDA 202 297 257 518 308 812 330 486
EBITDA margin 5.4% 6.0% 5.4% 10.0% 6.1% 12.4% 6.5% 9.4%
PAT (74) (108) (185) 151 (219) 463 139 225
EPS (1.7) (2.3) (4.0) 3.2 (12.6) 5.3 1.6 2.6
Networth 1,471 1,573 1,391 1,542 2,147 2,427 2,516 2,670
Net debt 1,465 1,441 1,311 1,113 393 232 412 370
Net debt:equity (x) 1.00 0.92 0.94 0.72 0.18 0.10 0.16 0.14
Source: Company, Ambit Capital research
Recovery in the PV segment will benefit MCIE Whilst the demand scenario in the PV industry has remained somewhat muted over the past 2 years, we believe that improvement in consumer sentiment would drive higher industry growth in FY15. We now expect the PV industry to record volume CAGR of 12% over FY14-17E.
Over the longer term, we remain bullish on the PV industry’s prospects. Whilst India matches China in terms of 2W sales, it is far behind China in terms of PV sales. China’s PV volumes have grown exponentially over the past decade; at 18mn units in 2013, China’s PV market is approximately 7x the size of the Indian domestic PV market vs 4x in 2002. This comparison signifies the strong potential for the PV industry in India.
We believe MCIE would be able to reap the benefits of a recovery in PV sales with: (a) new product introductions from CIE’s global PV portfolio into the Indian market; and (b) the CIE alliance which can be leveraged for building relationships with global OEMs (particularly European and North American players like Volkswagen, BMW, Renault, Ford and General Motors) which currently have only 12% market share in the Indian PV industry.
Mahindra CIE Automotive
November 10, 2014 Ambit Capital Pvt. Ltd. Page 18
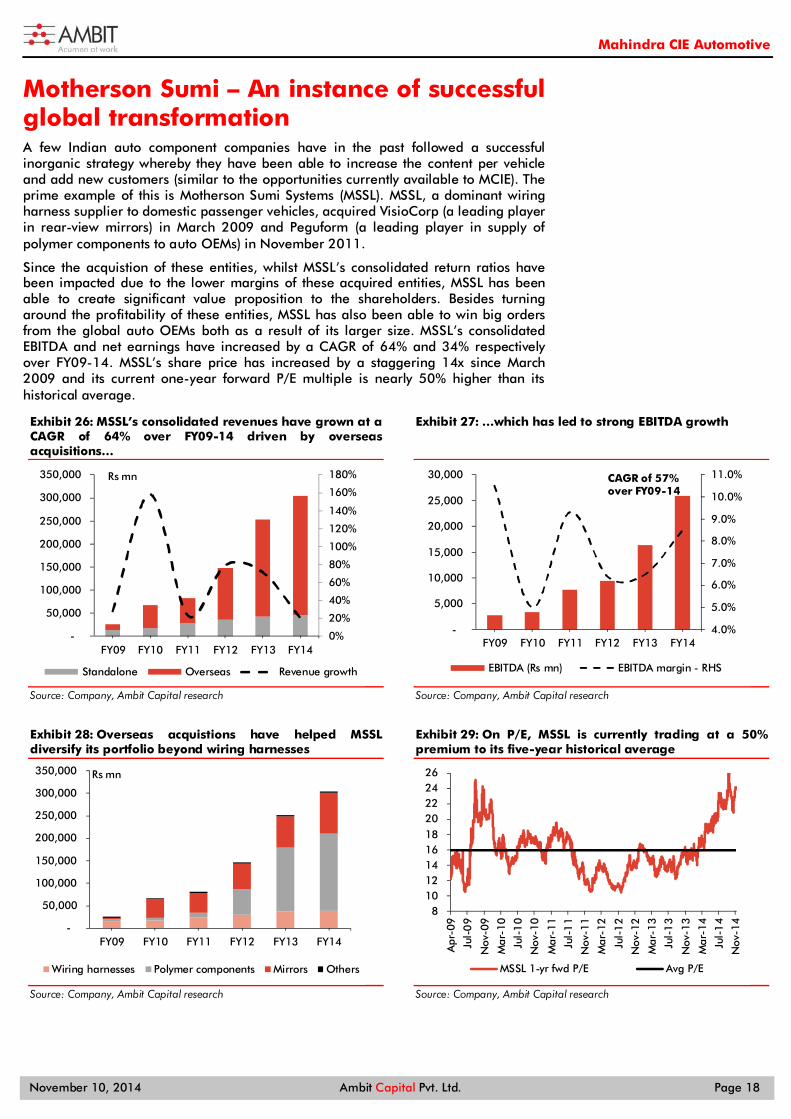
Motherson Sumi – An instance of successful global transformation A few Indian auto component companies have in the past followed a successful inorganic strategy whereby they have been able to increase the content per vehicle and add new customers (similar to the opportunities currently available to MCIE). The prime example of this is Motherson Sumi Systems (MSSL). MSSL, a dominant wiring harness supplier to domestic passenger vehicles, acquired VisioCorp (a leading player in rear-view mirrors) in March 2009 and Peguform (a leading player in supply of polymer components to auto OEMs) in November 2011.
Since the acquistion of these entities, whilst MSSL’s consolidated return ratios have been impacted due to the lower margins of these acquired entities, MSSL has been able to create significant value proposition to the shareholders. Besides turning around the profitability of these entities, MSSL has also been able to win big orders from the global auto OEMs both as a result of its larger size. MSSL’s consolidated EBITDA and net earnings have increased by a CAGR of 64% and 34% respectively over FY09-14. MSSL’s share price has increased by a staggering 14x since March 2009 and its current one-year forward P/E multiple is nearly 50% higher than its historical average.
Exhibit 26: MSSL’s consolidated revenues have grown at a CAGR of 64% over FY09-14 driven by overseas acquisitions…
Source: Company, Ambit Capital research
Exhibit 27: …which has led to strong EBITDA growth
Source: Company, Ambit Capital research
Exhibit 28: Overseas acquistions have helped MSSL diversify its portfolio beyond wiring harnesses
Source: Company, Ambit Capital research
Exhibit 29: On P/E, MSSL is currently trading at a 50% premium to its five-year historical average
Source: Company, Ambit Capital research
0%
20%
40%
60%
80%
100%
120%
140%
160%
180%
-
50,000
100,000
150,000
200,000
250,000
300,000
350,000
FY09 FY10 FY11 FY12 FY13 FY14
Standalone Overseas Revenue growth
Rs mn
4.0%
5.0%
6.0%
7.0%
8.0%
9.0%
10.0%
11.0%
-
5,000
10,000
15,000
20,000
25,000
30,000
FY09 FY10 FY11 FY12 FY13 FY14
EBITDA (Rs mn) EBITDA margin - RHS
CAGR of 57% over FY09-14
-
50,000
100,000
150,000
200,000
250,000
300,000
350,000
FY09 FY10 FY11 FY12 FY13 FY14
Wiring harnesses Polymer components Mirrors Others
Rs mn
8 10 12 14 16 18 20 22 24 26
Apr
-09
Jul-
09
Nov
-09
Mar
-10
Jul-
10
Nov
-10
Mar
-11
Jul-
11
Nov
-11
Mar
-12
Jul-
12
Nov
-12
Mar
-13
Jul-
13
Nov
-13
Mar
-14
Jul-
14
Nov
-14
MSSL 1-yr fwd P/E Avg P/E

Mahindra CIE Automotive
November 10, 2014 Ambit Capital Pvt. Ltd. Page 19
Analysing consensus estimates Our analysis of the consensus assumptions (as shown in the below exhibit) suggest the following key points:
Expectation of EBITDA margin improvement in MFE from 2.8% in FY14 to 10% in FY17;
Modest revenue growth across the European entities, given management’s indication of focusing on margin over growth;
Revenue CAGR of 10% over FY14-17 for India Forgings and 12% for other Indian businesses;
EBITDA margin improvement for India (Forgings and other business) from average of 9.9% in FY14 to 14.5% in FY17 on the back of operating leverage benefits; and
Average capex estimates of Rs2bn p.a. over FY15-17
The exhibit below captures key consensus assumptions over FY15-17.
Exhibit 30: Consensus key assumptions
Key Assumptions table FY13 FY14 FY15E FY16E FY17E
Mahindra Forging Europe Revenue growth 7% 7% 6% 4%
EBITDA margin -0.3% 2.8% 7.5% 9.2% 10.0%
Mahindra Forging India Revenue growth -12% 7% 12% 15%
EBITDA margin 15.1% 13.5% 15.5% 16.1% 17.6%
CIE Forging Revenue growth 0% 7% 5% 4%
EBITDA margin 13.3% 13.3% 13.9% 14.5% 15.0%
Other business Revenue growth 0% 8% 14% 15%
EBITDA margin 8.5% 8.1% 11.1% 12.8% 13.5%
CFO (pre-tax)/EBITDA 91% 106% 89% 89% 88%
Capex (Rs mn) 2,147 4,412 1,500 2,200 2,100
Source: Company, Bloomberg, Ambit Capital research
Based on the above set of assumptions, consensus expects MCIE’s consolidated revenues to record 7% CAGR over FY14-17. Mainly on the back of a 720bps improvement in margin of MFE, consensus expects consolidated EBITDA margin to expand from 7.2% in FY14 to 13.4% in FY17. As a result, consensus expects strong EBITDA CAGR of 27% over FY14-17. Furthermore, given operating leverage emanating from depreciation and the benefit of financial leverage, consensus expects consolidated PBT to record a robust 118% CAGR over FY14-17E.
On the balance sheet front, based on improving profitability and modest capex requirements, consensus expects the company to generate cumulative FCF of Rs12bn from FY15 to FY17, which should help bring down the net debt levels from Rs16bn as at end-FY14 to Rs8.4bn by end-FY17. As a result, consensus expects net-debt-equity/EBITDA to come down from 4.7x as at end-FY13 to well within CIE’s target by end-FY16 (1.5x).
On the back of expanding margin and improving asset utilisation (net fixed asset turnover to improve from 2.0x in FY14 to 2.7x in FY17), consensus expects RoCE (pre-tax) of the company to expand from 5.2% in FY14 to 15.9% in FY17.

Mahindra CIE Automotive
November 10, 2014 Ambit Capital Pvt. Ltd. Page 20
Exhibit 31: MCIE proforma – consolidated (based on consensus assumptions mentioned in Exhibit 30) Rs mn unless specified FY13 FY14 FY15E FY16E FY17E
Income Statement Revenue 50,623 54,387 59,318 63,778 69,460
YoY growth 7% 9% 8% 9%
EBITDA 3,329 3,935 6,249 7,757 9,322
EBITDA margin 6.6% 7.2% 10.5% 12.2% 13.4%
Depreciation 2,731 2,901 3,056 3,137 3,235
Interest 1,322 1,405 938 786 780
Other income 96 217 284 340 300
PBT (628) (153) 2,539 4,174 5,607
Tax 438 949 657 940 1,260
Tax rate -70% -619% 26% 23% 22%
PAT (1,067) (1,103) 1,882 3,234 4,347
EPS (Rs) (3.3) (3.4) 5.8 10.0 13.4
Balance sheet Net debt 17,517 15,519 13,630 11,880 8,450
Net debt:EBITDA (x) 5.3 3.9 2.2 1.5 0.9
Net fixed assets 27,640 27,814 27,652 26,800 25,701
Net working capital 3,359 4,045 4,540 4,849 5,080
Cashflow statement CFO before tax as % of EBITDA 65% 128% 89% 89% 89%
CFO post tax 1,790 4,702 4,519 6,086 7,457
Free cash flow (CFO less Capex) (358) 3,597 3,012 3,851 5,371
Ratios Net fixed assets turnover 1.8 2.0 2.1 2.4 2.7
Net working capital days 24 26 28 28 28
RoCE (pre-tax) 1.9% 3.4% 7.8% 11.9% 15.9%
Source: Company, Bloomberg, Ambit Capital research

Mahindra CIE Automotive
November 10, 2014 Ambit Capital Pvt. Ltd. Page 21
Key upside risks to consensus estimates
A higher than and faster than expected turnaround in MFE profitability. Consensus expects MFE margins to expand from 2.8% in FY14 to 10.0% in FY17E. MFE has already achieved a margin of 7.2% in 2QFY15.
A faster-than-expected revival in India: Currently consensus estimates are factoring in a revenue CAGR of 10% for the Indian operations over FY13-17E (we are currently estimating 12% volume CAGR for the domestic PV industry for FY14-17).
A faster-than-expected demand scenario in Europe: Currently consensus estimates are factoring in a revenue CAGR of 6% for the European operations over FY13-17E.
The management has not shared much information on cross-selling of products between CIE and M&M entities nor do these appear to be factored into consensus estimates.
Use of MCIE’s Indian plants as an exporting hub for CIE operations across the globe.
Key downside risks to consensus estimates A sharp slowdown in which constitutes around 60% of MCIE revenues.
CIE plans to bring all its forging businesses (across Brazil, Mexico and China) under Mahindra CIE post FY17 (once it is able to turn around the European operations). The valuation and other terms at which these entities of CIE would be merged could be detrimental to the interest of minority shareholders. However, the presence of a strong second-largest shareholder, i.e. M&M (20% stake), could act as potential deterrent.
Labour issues particularly arising out of the business integration/trimming down of work force.
Commodity price trends (particularly steel and aluminium, the basic raw material for the company’s business).

Mahindra CIE Automotive
November 10, 2014 Ambit Capital Pvt. Ltd. Page 22
Relative valuation Based on consensus estimates, MCIE trades at 8.0x FY17 EV/EBITDA which is at a discount of 37% to its peers. Similarly, on FY17 P/E multiple, it trades at 14.7x FY17 net earnings which is at a discount of 32% to its peers. For Mahindra CIE, consensus expects FY17 EBITDA to grow at 19% YoY with net earnings YoY growth at 37%. In this context of much stronger growth but cheaper multiples vs peers, FY17 valuation multiples for Mahindra CIE (EV/EBITDA of 8.0x and P/E of 14.7x) appear attractive.
Exhibit 32: Comparative valuation
Mcap EV/EBITDA (x) P/E (x) CAGR (FY14-17) Price perf (%)
US$ mn FY14 FY15 FY16 FY17 FY14 FY15 FY16 FY17 Sales EBITDA EPS 1m 3m 6m 1 yr
Mahindra CIE (consolidated)* 1,081 20.7 12.8 10.0 8.0 NA 33.0 19.8 14.7 9 33 NA 2 31 83 354
Motherson Sumi 6,150 16.4 12.1 9.1 7.4 49.2 30.6 21.2 16.4 17 30 44 16 17 61 133
Bosch 7,768 36.9 27.8 22.0 18.1 53.9 41.5 32.6 28.9 17 27 23 3 11 42 74
Bharat Forge (consolidated) 3,168 20.0 15.6 12.7 10.8 39.0 30.9 23.1 18.3 16 23 29 10 14 93 184
WABCO 1,152 40.3 31.1 20.3 14.5 60.2 49.7 31.2 22.4 28 41 39 (3) 12 60 120
Average (ex-MCIE) 28.4 21.6 16.0 12.7 50.6 38.2 27.0 21.5 20 30 34 Global companies
CIE Automotive 1,769 8.7 7.2 6.0 5.4 19.7 18.2 12.4 10.6 17 17 23 17 5 19 39
WABCO Holdings Inc 6,005 14.3 12.2 11.1 10.0 9.7 18.6 16.1 13.7 7 13 (11) 18 2 (3) 18
Average 11.5 9.7 8.5 7.7 14.7 18.4 14.2 12.1 12 15 6
Source: Bloomberg, Ambit Capital research. Note: * MCIE market cap and other financials are after factoring in the merger; Bosch, CIE Automotive, WABCO Holdings and Eaton Corp are Dec-ending companies, hence CY13=FY14.

Mahindra CIE Automotive
November 10, 2014 Ambit Capital Pvt. Ltd. Page 23
Balance Sheet (consolidated) – (please see note below) Year to March (Rs mn) FY10 FY11 FY12 FY13 FY14
Networth 7,943 7,912 8,716 15,208 16,195
Loans 6,536 6,970 6,062 18,495 17,936
Sources of funds 13,940 14,332 14,208 33,704 41,599
Net block 11,872 11,416 11,911 25,860 27,234
Capital work-in-progress 483 616 600 1,180 580
Investments 23 23 23 1,590 7,590
Net current assets 1,562 2,278 1,673 5,074 6,195
Application of funds 13,940 14,332 14,208 33,704 41,599
Source: Company, Ambit Capital research. Note: Financials for Mahindra Forgings (MFL) from FY10 to FY12 and proforma for Mahindra CIE (including MFL and other entities to be merged) for FY13 and FY14
Income statement (consolidated) – (please see note below)
Year to March (Rs mn) FY10 FY11 FY12 FY13 FY14
Revenue 13,274 19,245 24,403 50,623 54,387
EBITDA (88) 1,798 2,083 3,329 3,935
Depreciation 1,371 1,200 1,129 2,731 2,901
Interest expense 615 535 431 1,322 1,405
Other income 77 63 40 96 217
PBT (1,996) 127 563 (628) (153)
Provision for taxation (504) 9 36 438 949
Adj. PAT (1,492) 118 527 (1,067) (1,103)
EPS diluted (Rs) (17.0) 1.3 5.7 (3.3) (3.4)
Source: Company, Ambit Capital research. Note: Financials for Mahindra Forgings (MFL) from FY10 to FY12 and proforma for Mahindra CIE (including MFL and other entities to be merged) for FY13 and FY14
Cash flow statement (consolidated) – (please see note below)
Year to March (̀ mn) FY10 FY11 FY12 FY13 FY14
PBT (1,996) 127 547 (628) (153)
WC changes 740 (1,072) 502 (310) 1,121
CFO 437 518 2,464 1,790 4,702
Net capex 256 (849) (1,584) (2,147) (4,412)
CFI (5) (567) (1,572) (1,241) (10,412)
Proceeds from borrowings (2,204) 434 (920) (958) (559)
Issue of equity 2,318 (1) 442 - -
CFF (494) (55) (909) (1,211) 5,644
FCF 693 (331) 880 (358) 290
Source: Company, Ambit Capital research. Note: Financials for Mahindra Forgings (MFL) from FY10 to FY12 and proforma for Mahindra CIE (including MFL and other entities to be merged) for FY13 and FY14
Ratio analysis / Valuation parameters (consolidated) – (please see note below)
Year to March FY10 FY11 FY12 FY13 FY14
Revenue growth -41% 45% 27% 107% 7%
EBITDA margin -0.7% 9.3% 8.5% 6.6% 7.2%
Net margin -11.2% 0.6% 2.2% -2.1% -2.0%
RoCE -11% 4% 7% 2% 3%
RoE -19% 1% 6% -7% -7%
Net debt / Equity (x) 0.8 0.9 0.7 1.2 1.0
P/E (x) NM 152.1 35.7 NM NM
P/B(x) 2.3 2.3 2.2 4.4 4.1
EV/EBITDA(x) NM 13.8 11.9 25.2 20.8
Source: Company, Ambit Capital research. Note: Financials for Mahindra Forgings (MFL) from FY10 to FY12 and proforma for Mahindra CIE (including MFL and other entities to be merged) for FY13 and FY14

Mahindra CIE Automotive
November 10, 2014 Ambit Capital Pvt. Ltd. Page 24
Institutional Equities Team Saurabh Mukherjea, CFA CEO, Institutional Equities (022) 30433174 [email protected]
Research
Analysts Industry Sectors Desk-Phone E-mail
Nitin Bhasin - Head of Research E&C / Infra / Cement / Industrials (022) 30433241 [email protected]
Aadesh Mehta, CFA Banking / Financial Services (022) 30433239 [email protected]
Achint Bhagat Cement / Infrastructure (022) 30433178 [email protected]
Aditya Bagul Consumer (022) 30433264 [email protected]
Aditya Khemka Healthcare (022) 30433272 [email protected]
Ashvin Shetty, CFA Automobile (022) 30433285 [email protected]
Bhargav Buddhadev Power Utilities / Capital Goods (022) 30433252 [email protected]
Dayanand Mittal, CFA Oil & Gas / Metals & Mining (022) 30433202 [email protected]
Deepesh Agarwal Power Utilities / Capital Goods (022) 30433275 [email protected] Gaurav Mehta, CFA Strategy / Derivatives Research (022) 30433255 [email protected]
Karan Khanna Strategy (022) 30433251 [email protected]
Krishnan ASV Real Estate (022) 30433205 [email protected]
Pankaj Agarwal, CFA Banking / Financial Services (022) 30433206 [email protected]
Paresh Dave, CFA Healthcare (022) 30433212 [email protected]
Parita Ashar Metals & Mining / Oil & Gas (022) 30433223 [email protected]
Rakshit Ranjan, CFA Consumer / Retail (022) 30433201 [email protected]
Ravi Singh Banking / Financial Services (022) 30433181 [email protected]
Ritesh Gupta, CFA Midcaps – Chemical / Retail (022) 30433242 [email protected]
Ritesh Vaidya Consumer (022) 30433246 [email protected] Ritika Mankar Mukherjee, CFA Economy / Strategy (022) 30433175 [email protected]
Ritu Modi Automobile (022) 30433292 [email protected]
Sagar Rastogi Technology (022) 30433291 [email protected]
Sumit Shekhar Economy / Strategy (022) 30433229 [email protected]
Sandeep Gupta Media / Midcaps (022) 30433211 [email protected]
Tanuj Mukhija, CFA E&C / Infra / Industrials (022) 30433203 [email protected]
Utsav Mehta Technology (022) 30433209 [email protected]
Sales
Name Regions Desk-Phone E-mail
Sarojini Ramachandran - Head of Sales UK +44 (0) 20 7614 8374 [email protected]
Deepak Sawhney India / Asia (022) 30433295 [email protected]
Dharmen Shah India / Asia (022) 30433289 [email protected]
Dipti Mehta India / USA (022) 30433053 [email protected]
Hitakshi Mehra India (022) 30433204 [email protected]
Nityam Shah, CFA USA / Europe (022) 30433259 [email protected]
Parees Purohit, CFA UK / USA (022) 30433169 [email protected]
Praveena Pattabiraman India / Asia (022) 30433268 [email protected]
Production
Sajid Merchant Production (022) 30433247 [email protected]
Sharoz G Hussain Production (022) 30433183 [email protected]
Joel Pereira Editor (022) 30433284 [email protected]
Nikhil Pillai Database (022) 30433265 [email protected]
E&C = Engineering & Construction

Mahindra CIE Automotive
November 10, 2014 Ambit Capital Pvt. Ltd. Page 25
Explanation of Investment Rating Investment Rating Expected return
(over 12-month period from date of initial rating)
Buy >5%
Sell <5%
Disclaimer
This report or any portion hereof may not be reprinted, sold or redistributed without the written consent of Ambit Capital. AMBIT Capital Research is disseminated and available primarily electronically, and, in some cases, in printed form.
Additional information on recommended securities is available on request.
Disclaimer 1. AMBIT Capital Private Limited (“AMBIT Capital”) and its affiliates are a full service, integrated investment banking, investment advisory and brokerage group. AMBIT Capital is a Stock Broker, Portfolio
Manager and Depository Participant registered with Securities and Exchange Board of India Limited (SEBI) and is regulated by SEBI 2. The recommendations, opinions and views contained in this Research Report reflect the views of the research analyst named on the Research Report and are based upon publicly available information
and rates of taxation at the time of publication, which are subject to change from time to time without any prior notice. 3. AMBIT Capital makes best endeavours to ensure that the research analyst(s) use current, reliable, comprehensive information and obtain such information from sources which the analyst(s) believes to
be reliable. However, such information has not been independently verified by AMBIT Capital and/or the analyst(s) and no representation or warranty, express or implied, is made as to the accuracy or completeness of any information obtained from third parties. The information or opinions are provided as at the date of this Research Report and are subject to change without notice.
4. If you are dissatisfied with the contents of this complimentary Research Report or with the terms of this Disclaimer, your sole and exclusive remedy is to stop using this Research Report and AMBIT Capital shall not be responsible and/ or liable in any manner.
5. If this Research Report is received by any client of AMBIT Capital or its affiliate, the relationship of AMBIT Capital/its affiliate with such client will continue to be governed by the terms and conditions in place between AMBIT Capital/ such affiliate and the client.
6. This Research Report is issued for information only and should not be construed as an investment advice to any recipient to acquire, subscribe, purchase, sell, dispose of, retain any securities. Recipients should consider this Research Report as only a single factor in making any investment decisions. This Research Report is not an offer to sell or the solicitation of an offer to purchase or subscribe for any investment or as an official endorsement of any investment.
7. If 'Buy', 'Sell', or 'Hold' recommendation is made in this Research Report such recommendation or view or opinion expressed on investments in this Research Report is not intended to constitute investment advice and should not be intended or treated as a substitute for necessary review or validation or any professional advice. The views expressed in this Research Report are those of the research analyst which are subject to change and do not represent to be an authority on the subject. AMBIT Capital may or may not subscribe to any and/ or all the views expressed herein.
8. AMBIT Capital makes no guarantee, representation or warranty, express or implied; and accepts no responsibility or liability as to the accuracy or completeness or currentess of the information in this Research Report. AMBIT Capital or its affiliates do not accept any liability whatsoever for any direct or consequential loss howsoever arising, directly or indirectly, from any use of this Research Report.
9. Past performance is not necessarily a guide to evaluate future performance. 10. AMBIT Capital and/or its affiliates (as principal or on behalf of its/their clients) and their respective officers directors and employees may hold positions in any securities mentioned in this Research
Report (or in any related investment) and may from time to time add to or dispose of any such securities (or investment). Such positions in securities may be contrary to or inconsistent with this Research Report.
11. This Research Report should be read and relied upon at the sole discretion and risk of the recipient. 12. The value of any investment made at your discretion based on this Research Report or income therefrom may be affected by changes in economic, financial and/ or political factors and may go down as
well as up and you may not get back the full or the expected amount invested. Some securities and/ or investments involve substantial risk and are not suitable for all investors. 13. This Research Report is being supplied to you solely for your information and may not be reproduced, redistributed or passed on, directly or indirectly, to any other person or published, copied in whole
or in part, for any purpose. Neither this Research Report nor any copy of it may be taken or transmitted or distributed, directly or indirectly within India or into any other country including United States (to US Persons), Canada or Japan or to any resident thereof. The distribution of this Research Report in other jurisdictions may be strictly restricted and/ or prohibited by law or contract, and persons into whose possession this Research Report comes should inform themselves about such restriction and/ or prohibition, and observe any such restrictions and/ or prohibition.
14. Neither AMBIT Capital nor its affiliates or their respective directors, employees, agents or representatives, shall be responsible or liable in any manner, directly or indirectly, for views or opinions expressed in this Report or the contents or any errors or discrepancies herein or for any decisions or actions taken in reliance on the Report or inability to use or access our service or this Research Report or for any loss or damages whether direct or indirect, incidental, special or consequential including without limitation loss of revenue or profits that may arise from or in connection with the use of or reliance on this Research Report or inability to use or access our service or this Research Report.
Conflict of Interests 15. In the normal course of AMBIT Capital’s business circumstances may arise that could result in the interests of AMBIT Capital conflicting with the interests of clients or one client’s interests conflicting with
the interest of another client. AMBIT Capital makes best efforts to ensure that conflicts are identified and managed and that clients’ interests are protected. AMBIT Capital has policies and procedures in place to control the flow and use of non-public, price sensitive information and employees’ personal account trading. Where appropriate and reasonably achievable, AMBIT Capital segregates the activities of staff working in areas where conflicts of interest may arise. However, clients/potential clients of AMBIT Capital should be aware of these possible conflicts of interests and should make informed decisions in relation to AMBIT Capital’s services.
16. AMBIT Capital and/or its affiliates may from time to time have investment banking, investment advisory and other business relationships with companies covered in this Research Report and may receive compensation for the same. Research analysts provide important inputs into AMBIT Capital’s investment banking and other business selection processes.
17. AMBIT Capital and/or its affiliates may seek investment banking or other businesses from the companies covered in this Research Report and research analysts involved in preparing this Research Report may participate in the solicitation of such business.
18. In addition to the foregoing, the companies covered in this Research Report may be clients of AMBIT Capital where AMBIT Capital may be required, inter alia, to prepare and publish research reports covering such companies and AMBIT Capital may receive compensation from such companies in relation to such services. However, the views reflected in this Research Report are objective views, independent of AMBIT Capital’s relationship with such company.
19. In addition, AMBIT Capital may also act as a market maker or risk arbitrator or liquidity provider or may have assumed an underwriting commitment in the securities of companies covered in this Research Report (or in related investments) and may also be represented in the supervisory board or on any other committee of those companies.
Additional Disclaimer for U.S. Persons 20. The research report is solely a product of AMBIT Capital 21. AMBIT Capital is the employer of the research analyst(s) who has prepared the research report 22. Any subsequent transactions in securities discussed in the research reports should be effected through J.P.P. Euro-Securities, Inc. (“JPP”). 23. JPP does not accept or receive any compensation of any kind for the dissemination of the AMBIT Capital research reports. 24. The research analyst(s) preparing the research report is resident outside the United States and is/are not associated persons of any U.S. regulated broker-dealer and that therefore the analyst(s) is/are
not subject to supervision by a U.S. broker-dealer, and is/are not required to satisfy the regulatory licensing requirements of FINRA or required to otherwise comply with U.S. rules or regulations regarding, among other things, communications with a subject company, public appearances and trading securities held by a research analyst account.
Additional Disclaimer for Canadian Persons 25. AMBIT Capital is not registered in the Province of Ontario and /or Province of Québec to trade in securities nor is it registered in the Province of Ontario and /or Province of Québec to provide advice
with respect to securities. 26. AMBIT Capital's head office or principal place of business is located in India. 27. All or substantially all of AMBIT Capital's assets may be situated outside of Canada. 28. It may be difficult for enforcing legal rights against AMBIT Capital because of the above. 29. Name and address of AMBIT Capital's agent for service of process in the Province of Ontario is: Torys LLP, 79 Wellington St. W., 30th Floor, Box 270, TD South Tower, Toronto, Ontario M5K 1N2
Canada. 30. Name and address of AMBIT Capital's agent for service of process in the Province of Montréal is Torys Law Firm LLP, 1 Place Ville Marie, Suite 1919 Montréal, Québec H3B 2C3 Canada.
© Copyright 2014 AMBIT Capital Private Limited. All rights reserved.
Ambit Capital Pvt. Ltd. Ambit House, 3rd Floor 449, Senapati Bapat Marg, Lower Parel, Mumbai 400 013, India. Phone: +91-22-3043 3000 Fax: +91-22-3043 3100 CIN: U74140MH1997PTC107598 www.ambitcapital.com

Mahindra CIE Automotive
November 10, 2014 Ambit Capital Pvt. Ltd. Page 26
Explanation of Investment Rating Investment Rating Expected return
(over 12-month period from date of initial rating)
Buy >5%
Sell <5%
Disclaimer
This report or any portion hereof may not be reprinted, sold or redistributed without the written consent of Ambit Capital. AMBIT Capital Research is disseminated and available primarily electronically, and, in some cases, in printed form.
Additional information on recommended securities is available on request.
Disclaimer 1. AMBIT Capital Private Limited (“AMBIT Capital”) and its affiliates are a full service, integrated investment banking, investment advisory and brokerage group. AMBIT Capital is a Stock Broker, Portfolio
Manager and Depository Participant registered with Securities and Exchange Board of India Limited (SEBI) and is regulated by SEBI 2. The recommendations, opinions and views contained in this Research Report reflect the views of the research analyst named on the Research Report and are based upon publicly available information
and rates of taxation at the time of publication, which are subject to change from time to time without any prior notice. 3. AMBIT Capital makes best endeavours to ensure that the research analyst(s) use current, reliable, comprehensive information and obtain such information from sources which the analyst(s) believes to
be reliable. However, such information has not been independently verified by AMBIT Capital and/or the analyst(s) and no representation or warranty, express or implied, is made as to the accuracy or completeness of any information obtained from third parties. The information or opinions are provided as at the date of this Research Report and are subject to change without notice.
4. If you are dissatisfied with the contents of this complimentary Research Report or with the terms of this Disclaimer, your sole and exclusive remedy is to stop using this Research Report and AMBIT Capital shall not be responsible and/ or liable in any manner.
5. If this Research Report is received by any client of AMBIT Capital or its affiliate, the relationship of AMBIT Capital/its affiliate with such client will continue to be governed by the terms and conditions in place between AMBIT Capital/ such affiliate and the client.
6. This Research Report is issued for information only and should not be construed as an investment advice to any recipient to acquire, subscribe, purchase, sell, dispose of, retain any securities. Recipients should consider this Research Report as only a single factor in making any investment decisions. This Research Report is not an offer to sell or the solicitation of an offer to purchase or subscribe for any investment or as an official endorsement of any investment.
7. If 'Buy', 'Sell', or 'Hold' recommendation is made in this Research Report such recommendation or view or opinion expressed on investments in this Research Report is not intended to constitute investment advice and should not be intended or treated as a substitute for necessary review or validation or any professional advice. The views expressed in this Research Report are those of the research analyst which are subject to change and do not represent to be an authority on the subject. AMBIT Capital may or may not subscribe to any and/ or all the views expressed herein.
8. AMBIT Capital makes no guarantee, representation or warranty, express or implied; and accepts no responsibility or liability as to the accuracy or completeness or currentess of the information in this Research Report. AMBIT Capital or its affiliates do not accept any liability whatsoever for any direct or consequential loss howsoever arising, directly or indirectly, from any use of this Research Report.
9. Past performance is not necessarily a guide to evaluate future performance. 10. AMBIT Capital and/or its affiliates (as principal or on behalf of its/their clients) and their respective officers directors and employees may hold positions in any securities mentioned in this Research
Report (or in any related investment) and may from time to time add to or dispose of any such securities (or investment). Such positions in securities may be contrary to or inconsistent with this Research Report.
11. This Research Report should be read and relied upon at the sole discretion and risk of the recipient. 12. The value of any investment made at your discretion based on this Research Report or income therefrom may be affected by changes in economic, financial and/ or political factors and may go down as
well as up and you may not get back the full or the expected amount invested. Some securities and/ or investments involve substantial risk and are not suitable for all investors. 13. This Research Report is being supplied to you solely for your information and may not be reproduced, redistributed or passed on, directly or indirectly, to any other person or published, copied in whole
or in part, for any purpose. Neither this Research Report nor any copy of it may be taken or transmitted or distributed, directly or indirectly within India or into any other country including United States (to US Persons), Canada or Japan or to any resident thereof. The distribution of this Research Report in other jurisdictions may be strictly restricted and/ or prohibited by law or contract, and persons into whose possession this Research Report comes should inform themselves about such restriction and/ or prohibition, and observe any such restrictions and/ or prohibition.
14. Neither AMBIT Capital nor its affiliates or their respective directors, employees, agents or representatives, shall be responsible or liable in any manner, directly or indirectly, for views or opinions expressed in this Report or the contents or any errors or discrepancies herein or for any decisions or actions taken in reliance on the Report or inability to use or access our service or this Research Report or for any loss or damages whether direct or indirect, incidental, special or consequential including without limitation loss of revenue or profits that may arise from or in connection with the use of or reliance on this Research Report or inability to use or access our service or this Research Report.
Conflict of Interests 15. In the normal course of AMBIT Capital’s business circumstances may arise that could result in the interests of AMBIT Capital conflicting with the interests of clients or one client’s interests conflicting with
the interest of another client. AMBIT Capital makes best efforts to ensure that conflicts are identified and managed and that clients’ interests are protected. AMBIT Capital has policies and procedures in place to control the flow and use of non-public, price sensitive information and employees’ personal account trading. Where appropriate and reasonably achievable, AMBIT Capital segregates the activities of staff working in areas where conflicts of interest may arise. However, clients/potential clients of AMBIT Capital should be aware of these possible conflicts of interests and should make informed decisions in relation to AMBIT Capital’s services.
16. AMBIT Capital and/or its affiliates may from time to time have investment banking, investment advisory and other business relationships with companies covered in this Research Report and may receive compensation for the same. Research analysts provide important inputs into AMBIT Capital’s investment banking and other business selection processes.
17. AMBIT Capital and/or its affiliates may seek investment banking or other businesses from the companies covered in this Research Report and research analysts involved in preparing this Research Report may participate in the solicitation of such business.
18. In addition to the foregoing, the companies covered in this Research Report may be clients of AMBIT Capital where AMBIT Capital may be required, inter alia, to prepare and publish research reports covering such companies and AMBIT Capital may receive compensation from such companies in relation to such services. However, the views reflected in this Research Report are objective views, independent of AMBIT Capital’s relationship with such company.
19. In addition, AMBIT Capital may also act as a market maker or risk arbitrator or liquidity provider or may have assumed an underwriting commitment in the securities of companies covered in this Research Report (or in related investments) and may also be represented in the supervisory board or on any other committee of those companies.
Additional Disclaimer for U.S. Persons 20. The research report is solely a product of AMBIT Capital 21. AMBIT Capital is the employer of the research analyst(s) who has prepared the research report 22. Any subsequent transactions in securities discussed in the research reports should be effected through J.P.P. Euro-Securities, Inc. (“JPP”). 23. JPP does not accept or receive any compensation of any kind for the dissemination of the AMBIT Capital research reports. 24. The research analyst(s) preparing the research report is resident outside the United States and is/are not associated persons of any U.S. regulated broker-dealer and that therefore the analyst(s) is/are
not subject to supervision by a U.S. broker-dealer, and is/are not required to satisfy the regulatory licensing requirements of FINRA or required to otherwise comply with U.S. rules or regulations regarding, among other things, communications with a subject company, public appearances and trading securities held by a research analyst account.
Additional Disclaimer for Canadian Persons 25. AMBIT Capital is not registered in the Province of Ontario and /or Province of Québec to trade in securities nor is it registered in the Province of Ontario and /or Province of Québec to provide advice
with respect to securities. 26. AMBIT Capital's head office or principal place of business is located in India. 27. All or substantially all of AMBIT Capital's assets may be situated outside of Canada. 28. It may be difficult for enforcing legal rights against AMBIT Capital because of the above. 29. Name and address of AMBIT Capital's agent for service of process in the Province of Ontario is: Torys LLP, 79 Wellington St. W., 30th Floor, Box 270, TD South Tower, Toronto, Ontario M5K 1N2
Canada. 30. Name and address of AMBIT Capital's agent for service of process in the Province of Montréal is Torys Law Firm LLP, 1 Place Ville Marie, Suite 1919 Montréal, Québec H3B 2C3 Canada.
© Copyright 2014 AMBIT Capital Private Limited. All rights reserved.
Ambit Capital Pvt. Ltd. Ambit House, 3rd Floor 449, Senapati Bapat Marg, Lower Parel, Mumbai 400 013, India. Phone: +91-22-3043 3000 Fax: +91-22-3043 3100 CIN: U74140MH1997PTC107598 www.ambitcapital.com