Embed Size (px)
Citation preview
University of Massachusetts Amherst University of Massachusetts Amherst
ScholarWorks@UMass Amherst ScholarWorks@UMass Amherst
Doctoral Dissertations 1896 - February 2014
1-1-1988
Visionary leadership, management, and high performing work Visionary leadership, management, and high performing work
units : an analysis of workers' perceptions. units : an analysis of workers' perceptions.
Madelyn Jessica Stoner-Zemel University of Massachusetts Amherst
Follow this and additional works at: https://scholarworks.umass.edu/dissertations_1
Recommended Citation Recommended Citation Stoner-Zemel, Madelyn Jessica, "Visionary leadership, management, and high performing work units : an analysis of workers' perceptions." (1988). Doctoral Dissertations 1896 - February 2014. 942. https://doi.org/10.7275/emwv-zh44 https://scholarworks.umass.edu/dissertations_1/942
This Open Access Dissertation is brought to you for free and open access by ScholarWorks@UMass Amherst. It has been accepted for inclusion in Doctoral Dissertations 1896 - February 2014 by an authorized administrator of ScholarWorks@UMass Amherst. For more information, please contact [email protected].

VISIONARY LEADERSHIP, MANAGEMENT,
AND HIGH PERFORMING WORK UNITS
:
AN ANALYSIS OF WORKERS' PERCEPTIONS
A Dissertation Presented
By
MADELYN JESSICA STONER-ZEMEL
Submitted to the Graduate School of the
University of Massachusetts in partial fulfillmentof the requirements for the degree of
DOCTOR OF EDUCATION
May 1988
Education
(C) Copyright by Madelyn Jessica Stoner-Zemel 1988
All Rights Reserved
VISIONARY LEADERSHIP, MANAGEMENT
AND HIGH PERFORMING WORK UNITS
:
AN ANALYSIS OF WORKERS' PERCEPTIONS
A Dissertation Presented
By
MADELYN JESSICA STONER-ZEMEL
Approved as to style and content by
:
Donald K. CarewChairperson of Committee
Georgd^. Urch, Acting Dean
School of Education
To my father,Morris Meyer Stoner,whose love and wisdomstill guide meand who I miss dearly
ACKNOWLEDGEMENTS
I wish to express my deep appreciation to the members of my dis-
sertation committee who provided invaluable assistance throughout the
course of this study. I thank Don Carew, chairperson of the Disserta-
tion Committee, for his support and guidance during the various stages
of this dissertation and during my years of graduate training. Don has
been both mentor and friend throughout the course of my doctoral
studies and has always been available when needed. I have great
respect for his conceptualization of the field of Organizational
Development and his attitudes about human nature, all of which have
strongly influenced my own views. I wish to express my gratitude to
Sher Hruska for her participation on my dissertation committee and for
her assistance, guidance, and suggestions during my graduate years.
Sher was instrumental in the development of the focus of this study.
Her astute observations and critical thinking skills helped me focus and
shape the topic of this study. Her steadfast support helped me through
personal as well as professional difficulties. I thank Bob Marx for
his participation, feedback, and support during this study. I espe-
cially want to thank him for suggesting one of the visionary leadership
instrximents used in this study.
There are two adjunct members of this committee whom I wish to
thank. First, I thank Drea Zigarmi. As a mentor, he provided the
necessary stimuli at critical moments to help me formulate my thoughts,
ideas , and questions and to interpret the results . Furthermore ,he
found the organization that participated in this study, provided access
V
to the participants in this study, and acted as the liaison. The other
adjunct member I wish to thank is Marshall Sashkin. During numerous
conversations and through written correspondence, he provided invalu-
able insights and feedback which shaped the nature of this study. I
also wish to thank him for allowing me to use the LBQ, As outside
members, both Drea and Marshall gave a tremendous amount of time from
busy schedules to support my endeavors without expectation of anything
in return, and for this I am very appreciative.
I am also grateful to Corliss Goode , Diane Barton, and everyone
else at Blanchard Training and Development for their assistance in
distributing and collecting the questionnaires and to BTD for allowing
me to use the LBA in the study.
Thanks is due to Barry Posner for allowing me to use the LPI in
this study, for sending materials to aid the interpretation, and for
sending articles and reports related to the topic of this study.
I wish to express thanks to Joan Brandon for her help in formulat-
ing my views about the visioning process, for her support, and for
paving the way. Thanks are also due to friends and colleagues Susan
Colantuono, Horace Reed, Eunice Parisi-Carew , Fred Finch, Betsy
Loughran, Jackie Bearce, and Bina Addes, who gave of their time, who
offered invaluable feedback and suggestions in the development of the
PAVE, and who helped me clarify the nature and direction of this study.
Finally, I want to express my deepest love and gratitude to my
family for their caring and encouragement. I thank my mother, Joan J.
Stoner; my brothers and sisters-in-law. Bob and Ruth Stoner, Leslie
vi
Wright and Bradley Stoner; and my father, Morris M. Stoner, whose
untimely death during the course of this study inspired me to work
harder because I knew how proud he would have been. I also thank my
step-son, Joshua, for his interest and for the many times he watched
me as I worked and admired how many pages I had written. And I thank
my husband Larry who not only consistently provided emotional support
but who demonstrated his interest by actually reading this disserta-
tion, even though the field of OD is new to him.
vii
ABSTRACT
VISIONARY LEADERSHIP, MT^AGEMENT,
AND HIGH PERFORMING WORK UNITS:
AN ANALYSIS OF WORKERS' PERCEPTIONS
MAY 1988
MADELYN JESSICA STONER-ZEMEL , B.S., INDIANA UNIVERSITY
M.S., SYRACUSE UNIVERSITY
Ed.D., UNIVERSITY OF MASSACHUSETTS
Directed by: Professor Donald K. Carew
This study represents one of the first attempts to quantify the
relationships among traditional management , visionary leadership , and
high (peak) performing work units. The study examined leadership from
two theoretical constructs: traditional management, which describes
relationship-oriented and task-oriented behaviors, and visionary
leadership, which describes behaviors associated with the articulation
of a vision in which members of the organization enroll. Using workers'
perceptions, the study compared traditional managerial skills and
visionary leadership with indicators typical of peak performing organi-
zations. The study also examined the interaction of managerial and
visionary leadership in relation to perceptions of peak performance of
the work unit.
Data were obtained from 395 employees of a large private-sector
business who rated their immediate superiors using three leadership
instruments: The Leader Behavior Analysis , the Leader Behavior Ques-
tionnaire , and the Leadership Practices Inventory . They also rated
viii
their work unit using the PAVE: Excellent Organizational Practices
Index. The PAVE was subjected to psychometric analysis which indicates
that it can be considered an accurate measure describing characteris-
tics typical of peak performing organizations. The scales of the PAVE
include: Productivity, Team Effectiveness, Alignment, Empowerment,
Commitment, and Inspiration.
The results show that both traditional managerial behavior and
visionary leadership correlate highly with perceptions of the work
unit's peak performance. However, when examining the interaction of
traditional management and visionary leadership, effective visionary
leadership correlated with a high level of perceived peak performance
no matter whether traditional managerial skills were effective or
ineffective. In other words, traditional managerial skills were most
important when visionary leadership was weak.
When examining the position within the organizational hierarchy,
behaviors of senior level managers correlated more highly with percep-
tions of the work unit's performance level than did behaviors of middle
level or first line managers.
This study demonstrates that visionary leadership is an important
concept that should be incorporated into leadership theory and training
programs. Because this is a first investigation, further investigation
is warranted.
ix
TABLE OF CONTENTS
ACKNOWLEDGEMENTS ^
ABSTRACT ^^^^
LIST OF TABLES ^ .••••••••••••••• AX i J.
LIST OF FIGURES
Chapter
I. INTRODUCTION 1
Statement of the Problem 4Purpose of Study 5
Hypotheses 7Significance of Study 8Limitations 9
Definition of Terms 10Terms Associated with Vision 11Terms Associated with Leadership 14Terms Associated with Organizations 17
Overview 19
II. REVIEW OF LITERATURE 20
Historical Perspective of Leadership Models 20Stage 1 Models 20
Stage 2 Models 21
Stage 3 Models 26
Visionary Leadership 31
Characteristics of Visionary Leadership 32
Visionary Leadership Compared to TraditionalManagement ; 41
Vision in Groups and Organizations 48
Value of a Clear Vision for Groups 48
Vision in Peak Performing Organizations 50
Principles of Excellent Organizations 56
Summary 59
X
III. METHODOLOGY
Description of the Samples 61Variables 52Instrumentation 52
Leader Behavior Analysis . . 62Leader Behavior Questionnaire 66
Section I: LBQ-Managerial 67Section II: LBQ-Visionary 68
Leadership Practices Inventory 69Research Design 71Data Analysis and Statistics 73
Hypothesis I 73Hypothesis II 73Hypothesis III 74
Summary 76
IV. DEVELOPMENT AND VALIDATION OF THE PAVE:EXCELLENT ORGANIZATIONAL PRACTICES INDEX 78
Instrument Development
.....78
Results of Statistical Analyses 81
Factor Analysis and Development of the Scales 82
Description and Questions for Each PAVE Scale 85
Tests of Reliability 88
Correlations for Scales and Questions 89
Means and Standard Deviations 92
Summary 92
V. RESULTS 94
Description of Subjects 95
Workers' Perceptions of the Relationship BetweenTraditional Managerial Skills and Peak Performance
Level of the Work Unit 98
Leader Behavior Analysis 98
Leader Behavior Questionnaire-Managerial 102
Workers' Perceptions of the Relationship Between
Visionary Leadership and Peak Performance of
the Work Unit 10^
Leader Behavior Questionnaire-Visionary 109
Leadership Practices Inventory 115
Workers' Perceptions of the Relationship Between Possible
Combinations of Managerial and Visionary Leadership
with Peak Performance of the Work Unit 121
The Leadership Practices Inventory and
the Leader Behavior Analysis 124
Homogeneity of Variance Assumption 126
Analysis of Variance
xi
The Leader Behavior Questionnaire-Visionary andLeader Behavior Analysis 129Homogeneity of Variance Assumption 131Analysis of Variance 132
Leader Behavior Questionnaire-Visionary andLeader Behavior Questionnaire-Managerial 133Homogeneity of Variance Assumption 134Analysis of Variance 135
Summary of Results ..... 136
VI. DISCUSSION AND CONCLUSIONS 141
Summary and Findings of Study 141Major Findings 143
Impact of Visionary Leadership 143Impact of Traditional Leadership 143Interaction of Visionary Leadership and
Traditional Leadership 144Leadership and Organizational Peak Performance 145
Position in Organizational Hierarchy 146Correlations of Scales 148
Combinations of Traditional and Visionary Leadership . . 150
The PAVE as a Measure of PerceivedOrganizational Performance 153
Limitations 154
Implications 157
Visionary Leadership as a New Perspective 158
A New Model of Leadership Theory 160
Summary 171
Directions for Future Research 172
APPENDICES
A. Drafts, Correspondence, and Forms Related to
Construction of the PAVE: Excellent OrganizationalPractices Index 176
B. PAVE Excellent Organizational Practices Index 183
C. Leader Behavior Analysis 186
D. Leader Behavior Questionnaire 191
E. Leadership Practices Inventory 194
F. Recruitment Letter and Demographic Data Form 200
REFERENCES 203
xii
LIST OF TABLES
1. Assumptions about Human Nature and Management's Task 22
2. Ohio State University Categories of Leader Behavior 23
3. Organizational Emotions and Modes of Leadership 28
• 4. Continuum of Management Styles 29
5. Contrasting Berlew's Views of Leaders and Managers 33
6. Contrasting Ackerman's Views of Leaders and Managers 42
7. Contrasting Ranter's Views of Leaders and Managers 45
8. Contrasting Smircich's Views of Leaders and Managers 45
9. Specific Topics of the PAVE 80
10. Eigenvalues and Variance for Factor Analysis of PAVE 82
11 . Factor Loadings of Over . 30 for PAVE ." 84
12. Reliability Coefficients for PAVE Scales 89
13. Correlation Coefficients and Item-Total Correlationsfor PAVE Scales 90
14. Intercorrelation Matrix Among PAVE Scales 92
15. Mean Score and Standard Deviation for Scales of the PAVE ... 93
15. Demographic Data on Subjects (Subordinates) 95
17. Demographic Data on Managers . 97
18. Pearson Correlations for the LBA with the PAVE and Scales . . 99
19 . Pearson Correlations for Senior Level Managers for the
LBA with the PAVE and Scales 100
20 . Pearson Correlations for Middle Level Managers for the
LBA with the PAVE and Scales 101
21. Pearson Correlations for First Line Managers for the
LBA with the PAVE and Scales 102
22. Pearson Correlations for the LBQ-M with the PAVE and Scales . 103
xiii
23. Pearson Correlations for the LBQ-M Scales with the PAVE ... 104
24. Pearson Correlations for Scales of the LBQ-M withScales of the PAVE and Scales
3^q5
25- Pearson Correlations for Senior Level Managers forthe LBQ-M with the PAVE and Scales 106
26. Pearson Correlations for Middle Level Managers forthe LBQ-M with the PAVE and Scales 107
27. Pearson Correlations for First Line Managers for theLBQ-M with the PAVE and Scales 108
28. Pearson Correlations for the LBQ-V with the PAVE and Scales . 110
29. Pearson Correlations for the LBQ-V Scales with the PAVE . . . Ill
30. Pearson Correlations for Scales of the LBQ-V with Scalesof the PAVE 112
31. Pearson Correlations for Senior Level Managers for theLBQ-V with the PAVE and Scales 113
32. Pearson Correlations for Middle Level Managers for theLBQ-V with the PAVE and Scales 114
33. Pearson Correlations for First Line Managers for theLBQ-V with the PAVE and Scales 115
34. Pearson Correlations for the LPI with the PAVE and Scales . . 115
35. Pearson Correlations for the LPI Scales with the PAVE .... 117
36. Pearson Correlations for Scales of the LPI with Scalesof the PAVE 117
37. Pearson Correlations for Senior Level Managers for the
LPI with the PAVE and Scales 118
38. Pearson Correlations for Middle Level Managers for the
LPI with the PAVE and Scales 119
39. Pearson Correlations for First Line Managers for the
LPI with the PAVE and Scales 120
40. PAVE Score Ranges for Low, Mid, and High Scores 123
xiv
41. Means and Standard Deviation Summary for PAVEby the LBA and LPI
^^25
42. Test for Homogeneity of Variance; LBA and LPI 127
43. Analysis of Variance Table for LBA and LPI 127
44. Means and Standard Deviation Summary for PAVEby the LBA and LBQ-V
^^30
45. Test for Homogeneity of Variance; LBA and LBQ-V 131
46. Analysis of Variance Table for LBQ-V and LBA 132
4 7. Means and Standard Deviation Summary for PAVEby the LBQ-M and LBQ-V I33
48. Test for Homogeneity of Variance; LBQ-M and LBQ-V 134
49. Analysis of Variance Table for LBQ-M and LBQ-V 135
50. Morphogenic and Homeostatic Leadership BehaviorsNeeded to Promote Identity Development 164
51. Characteristics of the Visionary Leader in Relationto Leadership Theory 168
XV
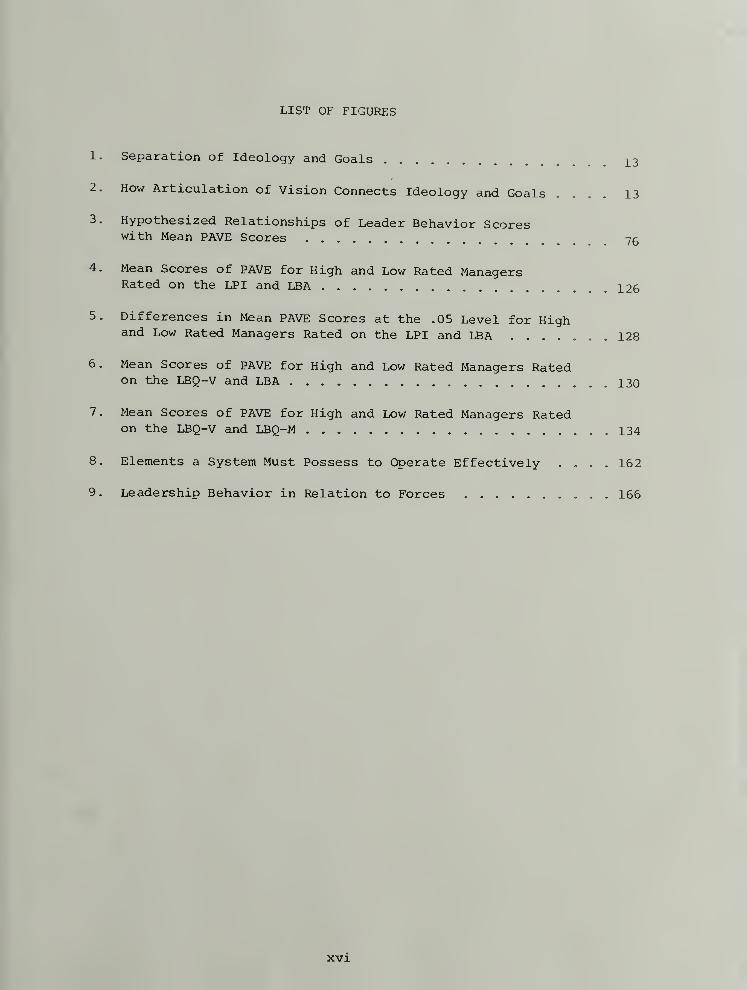
LIST OF FIGURES
1. Separation of Ideology and Goals 13
2. How Articulation of Vision Connects Ideology and Goals .... 13
3. Hypothesized Relationships of Leader Behavior Scoreswith Mean PAVE Scores 75
4. Mean Scores of PAVE for High and Low Rated ManagersRated on the LPI and LBA 126
5. Differences in Mean PAVE Scores at the .05 Level for Highand Low Rated Managers Rated on the LPI and LBA ....... 128
6. Mean Scores of PAVE for High and Low Rated Managers Ratedon the LBQ-V and LBA 130
7. Mean Scores of PAVE for High and Low Rated Managers Ratedon the LBQ-V and LBQ-M 134
8. Elements a System Must Possess to Operate Effectively .... 162
9. Leadership Behavior in Relation to Forces 166
xvi
CHAPTER I
INTRODUCTION
In an effort to develop ways to enhance performance and to
increase productivity in organizations, theorists and practitioners
have studied the nature of leadership and its relationship to the
organization since the beginning of this century. Ways to influence
organizational functioning have been studied from a variety of per-
spectives. Schein (1969) and Shaw (1981) proposed that leadership
should focus on components of group process (e.g. , goal-setting,
problem-solving, and communication) . Fiedler (1967) and Bass (1984)
examined the role of leadership. Lippitt (1958) and Kanter (1983) have
examined the management of organizational change.
Early attempts to study and influence organizational performance
focused on the practice of "scientific management," where people were
viewed in terms of physical input and output almost as if they were
machines. Theorists (e.g., Taylor, 1911) proposed intervention tech-
niques based on one-dimensional models that focused on task-efficiency.
Techniques for leaders to improve employee performance centered on
skill development without regard for mental attitude (personal beliefs
and feelings) or social relationships.
A change in perspective on leadership was heralded by studies con-
ducted during the 1940s and 1950s at Ohio State University (Stogdill
and Coons, 1957). This research suggested a strong positive correla-
tion between an individual's performance level and the arena of the
individual's attitudes, feelings, and social relationships. Further
2
research based on studies at the University of Michigan demonstrated
that leadership which attends to both skills and the arena of atti-
tudes, feelings, and relationships results in improved performance in
organizations (Likert, 1961) . Results of these studies led to new two-
dimensional models of leadership which address the variables of task
behavior (skill development) and relationship behavior (the arena of
attitudes, feelings and social relationships).
During the 1980s, theorists and practitioners have begun to
examine not just how to increase performance and productivity but how
to aspire to the highest achievable levels, often referred to as "peak
performance." The importance of maximizing human resources has been
recognized during this time of dwindling economic resources because the
potential of human resources appears to be unlimited. Much of the
recent literature has focused on describing the characteristics of peak
performing individuals and organizations and describing the leadership
behaviors that inspire the highest levels of human performance and
productivity in others.
Charles Garfield in the current popular book. Peak Performance
(1984) , describes characteristics of peak performing athletes and how
individuals can achieve the highest level of performance in their
chosen field. Thomas Peters and Robert Waterman, Jr. in their best-
selling book, In Search of Excellence (1982) , describe characteristics
of peak performing organizations. Both of these books are recent
national "best sellers" and reflect the current nationwide interest in
3
how to influence and promote peak performance both for individuals and
for organizations.
A close examination of the characteristics of "peak performance"
has led to the development of a third dimension for leadership models:
the clarity of one's vision of the future (Berlew, 1974) . The power of
a clear vision for peak performing athletes is described by Garfield
(1984),for leaders by Bennis and Nanus (1985) and for organizations by
Kiefer and Stroh (1984) . These authors all agree that a clear vision
of the future one intends to create (sense of purpose or mission) is
essential. The process of creating a vision enables people to clarify
and realize what they really want, independent of what currently seems
possible. It encourages them to develop their visions of an ideal
reality and then builds a bridge between the current and ideal states
(Kiefer and Stroh, 1984) . In fact, these authors assert that it is
this third dimension, vision, which leads to peak performance .
As the value of a clear vision for the future has become better
dociimented, practitioners have begun a search for techniques to facili-
tate its development. For example, Garfield (1984) describes the
mental training techniques, including development of a vision, current-
ly used to train Olympic athletes. He then suggests how these tech-
niques can be used to improve performance for individuals in all
aspects of their lives, particularly in leadership training. However,
the focus on vision in leadership and the influence of an accepted
vision for an organization is relatively new for the field, and not
much presently exists in terms of organized attempts to integrate the
4
concept of vision with traditional concepts of leadership theory or
with practice (intervention and training techniques)
.
Statement of the Problem
The concept of visionary leadership is relatively new in the field
of organizational development. As mentioned above, most efforts to
study this concept have focused on describing characteristics of
visionary leaders and characteristics of peak performing organizations
with the assumption that there is a relationship between these two
areas. However, the researcher could find no research to support this
relationship. Part of the problem is that until recently, no quantita-
tive instruments existed to identify visionary leaders. Also, those
people who have focused the most on visionary leadership have not been
interested in traditional experimental research designs and quantita-
tive analyses, preferring to use qualitative research and case study
methods. One of the arguments they use is that it is not possible to
measure visionary leadership. Another problem with research in this
area is that no instrument previously existed that measured peak per-
formance in organizations as described in the literature because this
is also a new concept.
If the importance of visionary leadership and peak performance in
organizations is to be validated, then the relationship between them
must be examined empirically and established. Not only is it necessary
to validate these concepts, but it is also important to find a way to
integrate them with current organizational and leadership theory.
5
Otherwise, these concepts may be delegated to the realm of "fads" only
to be replaced by other developments or a reactionary wave back to the
old schools of thought. The concept of visionary leadership offers the
potential to change the field of organizational development as drama-
tically as the addition of the 1950s two-dimensional model did with the
original concept of scientific management.
Purpose of Study
If visionary leadership does consist of certain attributes and be-
haviors that lead to inspired or peak performance, then it would follow
that workers would be able to identify these attributes and behaviors
in their leaders. Furthermore, it would follow that when workers in
organizations report their leaders as possessing the attributes and
behaviors of visionary leaders , the workers would also report that the
level of organizational performance would be inspired or peak. The
value of eliciting workers' perceptions of leadership is described by
Kouzes and Posner (19 86) who assert "successful leadership depends far
more upon the follower's perception of the leader than upon the
leader's aibilities" (p. 55) .
The purpose of this study was to examine the relationship between
workers ' perceptions of leadership and their perception of the level of
peak performance of the organization. This study investigated to what
extent perceived leader behavior and perceived peak performance of the
leader's work unit vary together. Also, this study examined the rela-
tionship between concepts of effective leadership based on the
6
traditional, two-dimensional managerial models and on the newer per-
spective of "visionary" leadership as they relate to the peak perfor-
mance level of the work unit from the viewpoint of workers in organi-
zations. Both of these types of models and the corresponding leader-
ship characteristics are described in detail later in the review of
the literature.
Specifically, this study asked the following questions: (a) Is
there a significant relationship between effective leadership behaviors
based on concepts of traditional, two-dimensional managerial theory with
peak performance of the organization? (b) Is there a relationship
between effective leadership behaviors based on concepts of visionary
leadership theory with peak performance of the organization? (c) What
is the relationship between the following four combinations of leader-
ship behaviors with peak performance level of the organization:
effective traditional and effective visionary; ineffective traditional
and effective visionary; effective traditional and ineffective vision-
ary; and ineffective traditional and ineffective visionary?
A secondary intent of the study was to develop an instrument based
on the current literature that measures perceived peak performance
level of the organization. The study sought to answer the following
questions about this instrument: (d) Can the instrument be considered
valid, accurate and reliable? (e) Are the scales related to the total
instrument and are they interrelated to each other, thus constituting
one measure?
7
Hypotheses
The following hypotheses are provided as an introductory descrip-
tion of the focus of this study. The hypotheses and the instruments
(scales) will be discussed in more detail in Chapter III which
describes the research method. Hypothesis I addresses Question A
above. Hypothesis II addresses Question B above. Hypothesis III
addresses Question C above.
Hypothesis I : There will be a positive correlation betweenworkers' ratings of their perceptions of their leader's behavioron a scale based on the traditional managerial perspective withratings on a scale assessing the workers' perceptions of the peakperformance level of the work unit.
Hypothesis II : There will be a positive correlation betweenworkers' ratings of their perceptions of their leader's behavioron a scale based on the visionary leadership perspective withratings on a scale assessing the workers' perceptions of the peakperformance level of the work unit.
Hypothesis III : When workers rate their leaders as high on bothtraditional managerial and on visionary leadership scales, theworkers ' reported perceptions of the peak performance level ofthe work unit will be significantly higher than when the workersrate their leaders as high on only the traditional managerialscale or only the visionary leadership scale.
Subhypothesis Illa : When workers rate their leaders as highon both traditional managerial and on visionary leadershipscales, the workers' reported perceptions of the peak perfor-mance level of the work unit will be high.
Subhypothesis Illb : When workers rate their leaders as high
on a visionary leadership scale and low on a traditional
managerial scale, the workers' reported perceptions of the
peak performance level of the work unit will be in the aver-
age range.
8
Subhypothesis IIIc : When workers rate their leaders as highon a traditional managerial scale and low on a visionaryleadership scale, the workers' reported perceptions of thepeak performance level of the work unit will be in theaverage range.
Subhypothesis Illd : When workers rate their leaders as lowon both traditional managerial and on visionary leadershipscales, the workers' reported perceptions of the peak perfor-mance level of the work unit will be low.
Significance of Study
The primary significance of this study is to bring about a greater
awareness of leadership behavior and how it relates to high levels of
organizational performance. On the broadest scope, this study is sig-
nificant because it furthers our understanding of the nature of
successful leadership.
Most current studies of visionary leadership have been qualitative
(e.g., Bennis, 19 84). This study tested quantitatively workers' per-
ceptions of "visionary" leadership. For this reason, the study is
significant as a step toward validating the visionary perspective of
leadership. The concept of visionary leadership is important and is
worth studying in order to learn how to facilitate its development in
people. However, unless research supports its importance, it is likely
to become just another fad that was in fashion for a brief period.
Furthermore, this study provides information that examines the
relationship between managerial leadership constructs based on the Ohio
State studies (Stogdill and Coons, 1957) and the recent constructs
hypothesized by the transformational or visionary leadership perspec-
tive (e.g., Bennis and Nanus, 1985; Kiefer and Stroh, 1894; Sashkin,
9
1986; et al.) and hopefully will help theorists develop a unified
leadership theory that integrates both constructs.
Limitations
The following limitations of this study were recognizable from the
beginning. First, this study elicited only perceptions of the subordi-
nates and included no method of objective observation. Accuracy of
these results can be accepted only to the extent that one accepts the
perceptions of others as an indicator of reality or to the extent that
one values phenomenology. It is recognized that this viewpoint is
debatable. Also, some researchers (e.g., Smircich, 1983) assert that
this perspective is not measurable from a quantitative perspective and
that attempts to assess leadership through traditional methods will
prove fruitless. This viewpoint is also debatable.
Second, because the concepts presented by the visionary leadership
model are new, the instriJinents that have been developed to measure it
are also new. Although validity studies are currently being conducted,
not enough time has progressed to ensure thorough predictive validity
studies. To insure consistency in results, two separate visionary
leadership instruments were chosen. Because no instruments could be
found to measure peak performance level for the organization, one
needed to be developed for use in this research study. Although this
instrument was subjected to statistical analysis and presented as an
accurate measure of this concept, it is still new and needs to be fur^-
ther utilized to further develop its applicability.
10
A third limitation is that the subordinates were chosen by the
managers. It is possible that some managers might have chosen those
subordinates who were likely to give positive feedback and therefore
causing the sample to be skewed toward the positive end. However, this
was not considered a serious limitation because the consulting firm re-
ported that often the managers had no more than four or five immediate
sxibordinates , which is the number of subordinates that each manager
asked to complete the questionnaires. Furthermore, because managers
were participating in this training program in order to increase
leadership skills, it was considered likely that they would seek honest
feedback in order to get accurate information that would facilitate
their growth. Also, all ratings were made anonymously and the manager's
feedback was shared with only that manager so that he or she did not
need to be concerned about being held accountable by their superiors.
Fourth, the subjects of this study were limited to one organiza-
tion which limits the extent to which results can be generalized to
other settings.
Definition of Terms
In order to provide an understanding of the meaning of the terms
used in this study, the following definitions are offered. First terms
associated with clarifying the difference between "vision" and "goals"
are presented. Next terms associated with leadership are presented.
Finally terms associated with organizations are presented.
11
Terms Associated with Vision
is "the inner crystallization of the result that you want
to create, so that the result is conceptually specific and tangible in
your imagination—so tangible and so specific, in fact, that you would
recognize the manifestation of the result if it occurred" (Fritz, 1984,
p. 66)
.
A "vision" is a clearly articulated results-oriented picture of a
possible future one intends to create. A "vision" is a picture of the
whole, which illustrates the meaning, the purpose, the values behind
the work, and why one does it. One's vision focuses on the end results
and values, not on the specific means. It includes a strong emotional
component because values evolve from one's basic needs as well as
intellectual views
.
A vision is created from one's own desires and values. It is not
"seeing clearly what exists" nor is it "forseeing what will happen."
It originates from one ' s inner sense of purpose and is generated by
one's creative energies.
A workable vision has these additional characteristics: (a) it is
proactive, not reactive (moving toward what one wants rather than away
from what one wants to avoid); (b) it appeals to lofty values, beliefs
and ideals; and (c) it generates strong emotions of commitment, satis-
faction, motivation for inspired performance, and belief that the
vision can be created.
Visioning is the process of creating and maintaining one's vision.
12
Goals are the activities one determines (long-range and short-
range) which will lead to creation of the vision. Goals are the
markers that herald one's progress toward creation of the vision.
Goals are the signposts along the way to let one know he/she is moving
in the right direction. Goals have time-lines. They answer "what" and
"how much" rather than "why." The processes or means for realizing the
vision are explicit in the goal statement.
Goal-setting is the process of creating and articulating clear,
achievable goals. Factors used to determine goals are not purpose,
values, and personal ideals (which are the basis for visioning) .
Rather, sources used to determine goals are related to present-time
events and activities (e.g., the individual's self-confidence and
ability, standards based on previous performance level, participation,
external constraints, and/or organizational goals set by upper manage-
ment (Latham and Locke, 1979)
.
One's ideology (beliefs, values, and ideals) is always part of any
goal-setting process. However, people tend not to be clear that ideals
are part of the goals during the goal-setting process. Typically goals
tend to be expressions of unstated beliefs . Therefore , the underlying
assumptions are not always clear from viewing the goals alone. This
separation of ideology and goals is illustrated below.
13
Figure 1, Separation of Ideology and Goals
Visioning is a mediating process between ideology (philosophy,
beliefs, values, ideals) and goal-setting. Visioning is the formation
at a conscious level and consequent articulation of one's ideology in
relation to outcome. The figure below illustrates the sequence of the
three processes: development of ideology, formulation of vision, and
goal-setting.
Visioning Goat-Setting
Figure 2. How Articulation of Vision Connects Ideology and Goals
The visioning process elucidates one's ideology and needs. The
underlying assumptions and needs are clear in the articulation of a
vision (e.g., Martin Luther King's "dream") . Some consequences of
clarifying one's vision are:
14
Visioning provides the foundation on which to base goals thatclearly evolve from one's values.
Clarifying and maintaining one's vision allows one's activi-ties to be congruent with his/her values.
Visioning facilitates creation of goals that are proactiverather than reactive.
When the underlying beliefs are expressed, one may end upwith goals one never even considered before.
In conclusion, the visioning process is one that opens the crea-
tive forces and allows one to view possible vistas. The goal-setting
process sets the limits. It clarifies the agreements and the means of
expression and achievement.
Goal Alignment is the end result of the alignment of purpose and
vision with goals. At an organizational level, goal alignment implies
that members share a common purpose, are all moving (in the same direc-
tion) toward a common vision, and that individual goals are congruent
with the organizational goals. When goal alignment exists, members of
the organization are able to articulate organizational and personal
goals. Furthermore, there is congruence between goals (organizational
and personal) and members' personal value systems.
Terms Associated with Leadership
Managing implies moving things around, in control, and control-
ling. The American Heritage Dictionary defines "manage" as "to direct,
control, or administer; make submissive to one's authority, discipline,
or persuasion." This definition implies the focus is on present-time
activities
.
15
Leading,on the other hand, implies moving forward. The defini-
tion provided by The American Heritage Dictionary is "to show the way
by going in advance." The concept of leading also implies that others
are involved (e.g., "to assume leadership of; to be at the head of").
And it suggests that they are following of their own accord (not that
they are pushed, controlled or manipulated) . This definition implies
a focus on the future.
A Visionary Leader is a leader who articulates a vision that
appeals to the common values and needs of the members of the organiza-
tion and that captures the hopes, needs, beliefs, values, and goals of
the followers. The vision has the following effects on followers:
(a) it catalyzes alignment in the group around the vision; (b) it
empowers people; and (c) it generates strong emotions of commitment,
satisfaction, and inspired performance of the group.
A Visionary Leader influences others from the power of the vision.
The Visionary Leader articulates the common vision which emanates from
the personal visions of all the members of the organization.
A Charismatic Leader influences others by the power of his/her
personality which is what attracts people to him/her. A Charismatic
Leader may describe a vision, but at least one of the essential charac-
teristics of a "vision" described earlier are missing. The Charismatic
Leader inspires loyalty to him/herself, not to the vision or to the
organization.
Followers of a Charismatic Leader experience a deep emotional
attachment characterized by "devotion, awe, reference, and blind faith"
16
(Wilner, 1968, p. 6). The personalized form of identification induced
by the charismatic leader creates invisible controls by the leader over
the followers which are quite subtle in that they mask the form of
domination and yet are very powerful and effective (Smircich, 1983,
p. 238) .
A Visionary Leader may appear as "charismatic." A true vision
generates a strong feeling tone that might be attributed to the force
of the personality of the leader. And indeed, the visionary leader
might also have a charismatic personality. However, the power gener-
ated rests in the clear, achievable, exciting vision which inspires
and appeals to the values of those within the organization.
A Traditional Leader exhibits leadership behavior based on the
perspective presented by the traditional leadership models which
address the dimensions of task-oriented behaviors and relationship-
oriented behaviors. These leaders tend to use more "managing" behavior
than "leading" behaviors. Rather than proactively moving toward a
vision, they focus on present-time events and attempt to manipulate
and control events and people . A synonym used is Managerial Leader .
This current study investigated traditional managerial behaviors
from the viewpoint assumed by the construct provided in this defini-
tion, although it is recognized that other traditional viewpoints
(e.g., trait leadership) exist.
17
Terms Aaaociated with Organizations
An Organization, according to Ttu: Amu r Lean Heritage Dictionary
(1976),
is "a number of persons or groups having specific responsibili-
ties and united for some purpose of work." For the purpose of this
paper, an "organization" is further defined as "a collection [or group]
of individuals acting in concert" that create a sense of "social order,
a shared culture, a history and a future, a value system" (Pondy and
Mitroff, 1979, p. 9). More specifically, an "organization" is a group
of individuals who share a conunon definition of reality, who uso a
conunon language to construct shared definitions of the group's situa-
tion, and who function with elaborate shared systems of meaning
(Boulding, 1968) . Because the term "organization" can refer to either
a collection of people or a collection of groups, the terms "organiza-
tion" and "group " will be considered interchangeable when referring to
a collection of people.
A Work Unit is the particular group for which one manager is
responsible. In small or simple organizations, a work unit migiit con-
stitute the entire organization. In larger or complex organizations,
the work unit refers to a collection of people who constitute an entity
(or group) within the larger organization.
Excellent , according to The American Heritage Dictionary (1976)
,
means "being of the highest or finest quality." Other synonyms for
excellent, when used to describe organizations in this paper, will be:
inspired , superior , successful , innovative , highly effective , excep-
tional and peak performing . The criteria for identification of
18
"excellent" organizations are high productivity, high member satisfac-
tion, and the ability to adapt to change in the environment. Peters
and Waterman in In Search of Excellence (1982, pp. 8-19) offer a more
detailed description of eight attributes that characterize excellent
organizations. These attributes will be discussed in detail in
Chapter II.
Performance describes competence, productivity, achievement, out-
put, and effectiveness within organizations.
Peak Performance ; The highest possible level of achievement for
an individual or an organization. One of the focuses for this current
study was "characteristics that are typical of peak performing organi-
zations." The study elicited workers' perceptions of these character-
istics, not objective indicators.
Feeling Tone : The degree to which strong positive feelings such
as excitement, commitment, inspiration, confidence, motivation, and
satisfaction are expressed by members about the organization.
Empowerment : A state where members ot the organization are
invested with collective and personal power that enables them to freely
act on their own accord and where they feel in control of their own
destinies.
Structure : The formal and informal rules, policies, roles, hier-
archies, communication avenues, and reward and accountability systems
that govern expectations and relationships within an organization.
19
Overview
The remainder of this study is organized in the following way.
Chapter II provides a review of relevant literature. It provides an
historical perspective of the development of leadership models and the
important related studies. Next the most recent concepts of leader-
ship, called "visionary leadership" in this study, are described,
including the few related studies that could be found. Finally, the
literature describing peak performing organizations is reviewed.
Chapter III describes the design of the research, the hypotheses
tested, the questionnaires and instrumentation, and the method of
analysis. Chapter IV provides information on the development and
validation of the PAVE: Excellent Organizational Practices Index , an
instrument developed for use in this study which measures workers'
perceptions of peak performance of their work unit. An analysis of
the results of the study is presented in Chapter V. Chapter VI offers
a discussion of the results, including conclusions, implications, and
directions for future research.
CHAPTER II
REVIEW OF LITERATURE
Some of the more recent perspectives of leadership consider the
vision of the effective leader to be at least as, if not more, impor-
tant than the managerial skills of the leader. This chapter will
review the relevant literature and research on vision and its relation-
ship to excellence in leadership. The first section of this chapter
will review the historical development of leadership models and will
describe three categories of leadership models. The second section
will examine the literature which describes visionary leadership and
will compare visionary leadership to traditional leadership. The third
section will focus on vision in relation to peak performing organiza-
tions .
Historical Perspective of Leadership Models
David Berlew (1974) describes the historical development of three
categories of leadership models. Stage 1 models are called "custodial"
models. Stage 2 models are called "managerial" models. Stage 3 models
are called "charismatic" models. This section will describe the events,
theories, and relevant studies that led to the development of each
stage.
Stage 1 Models
The "Custodial" or "Stage 1" models focused on task efficiency.
These models arose from the work of Frederick Taylor (1911) . Taylor's
21
"scientific management" approach proposed that the best way to increase
productivity was to improve the techniques or methods used by workers.
Through time and motion studies, work tasks were analyzed in order to
reorganize jobs with efficiency in mind. The individual was expected
to adapt to whatever job expectations were defined as a result of these
studies. As a result of emphasis on this viewpoint, leadership models
focused on the needs of the organization and not the needs of the
individual. Regard for employee attitudes, feelings, and relationships
was considered secondary.
Douglas McGregor (1966) described the underlying beliefs and
attitudes held by managers about subordinates which he calls "assump-
tions about human nature and management's task." He described a set of
assumptions belonging to a "Theory X" which apply to the Stage 1 models.
He also postulated a "Theory Y," another set of assumptions, that arose
from the human relations movement that gave rise to Stage 2 models.
Theory X and Theory Y assumptions are summarized in Table 1.
Stage 2 Models
During the 1920s and 1930s, the work of Elton Mayo (19 27) and his
associates heralded the beginning of the "human relations" movement
that replaced the "scientific management" movement. The importance of
interpersonal relationships within the work unit was recognized as a
major factor in increasing productivity. Management began to focus on
facilitating cooperative goal attainment among workers. Respect for
human dignity was recognized, underlined by McGregor's Theory Y assump-
tions described above. A two-dimensional view of the role of management
22
TABLE 1
Assumptions about Human Nature and Management's TaskFrom "The Human Side of Enterprise" by Douglas McGregor
(1966, pp. 5-6 and 15)
Theory X Theory Y
1. Management is responsible fororganizing the elements ofproductive enterprise—money,materials, equipment, people
—
in the interest of economicends
.
2. With respect to people, thisis a process of directingtheir efforts, motivating them,controlling their actions,modifying their behavior to fitthe needs of the organization.
3. Without this active interven-tion by management, peoplewould be passive—even resis-tant—to organizational needs.They must be persuaded, rewarded,punished, controlled—theiractivities must be directed.
Management is responsible fororganizing the elements ofproductive enterprise—money,materials, equipment,people—in the interest ofeconomic ends
.
People are not by nature pas-sive or resistant to organi-zational needs . They havebecome so as a result ofexperience in organizations.
The motivation, the potentialfor development, the capacityfor assuming responsibility,the readiness to direct be-havior toward organizationalgoals are all present inpeople. Management does notput them there. It is a re-sponsibility of management tomake it possible for peopleto recognize and developthese human characteristicsfor themselves
.
The average man is by natureindolent—he works as littleas possible. He lacks ambi-tion, dislikes responsibility,prefers to be led. He is in-herently self-centered, indif-ferent to organizational needs.
He is by nature resistant tochange. He is gullible, notvery bright , the ready dupe of
the charlatan and the demagogue
,
The essential task of manage-ment is to arrange organiza-tional conditions and methodsof operation so that peoplecan achieve their own goalsbest by directing their ownefforts toward organizationalobjectives
.
23
was developed: to combine task efficiency with respect for individual
feelings, attitudes, and relationships. According to Berlew (1974),
the Stage 2 or "Managerial" models arose from the influence of the
human relations movement.
These models were further developed as a result of leadership
studies conducted at Ohio State University (Stogdill and Coons, 1957).
These studies originally identified two dimensions of leader behavior.
One dimension, referred to as "initiating structure," reflects the
amount of concern the manager demonstrates related to task accomplish-
ment (e.g., concern for production). The second dimension, referred to
as "consideration," reflects the manager's concern for developing rela-
tionships with and among subordinates- Four categories were developed
to describe the various combinations of these dimensions. These cate-
gories are displayed in Table 2.
TABLE 2
Ohio State University Categories of Leader Behavior
High Structure; High Consideration
High Structure; Low Consideration
Low Structure; High Consideration
Low Structure; Low Consideration
24
Studies conducted at the University of Michigan (Bowers and
Seashore, 1966) further described the two dimensions which they called
"employee orientation" and "production orientation." Building on these
studies, Likert (1961) conducted extensive research investigating the
management practices of high producing managers. He described two
types of manager styles, "employee-centered" and "job-centered," which
lent further credence to the importance of developing positive rela-
tionships with and among employees.
Results of these research studies inspired development of the "mana-
gerial grid" popularized by Blake and Mouton (1964) . They described
four leadership styles based on the amount of importance the leader
assigns to each dimension: concern for employees and concern for pro-
duction. The grid implies that the most desirable leader behavior
consists of high concern for employees and high concern for production.
Studies grounded in these theories have attempted to determine
which dimensions or combinations of dimensions give rise to the most
effective leadership style. The work of Kalin and Katz (1953) preceded
the work of Bowers and Seashore (1966) . Kahn and Katz found three
aspects of leader behavior that related to productivity. The first
aspect was the leader's assumption of the leadership role: an effec-
tive leader assumes a role as separate from subordinates and not as
"one of the group." Second, was the closeness of supervision: an
effective leader supervises less closely than ineffective leaders.
Third was the degree of employment-orientation: effective leaders
25
consider their subordinates as individual human beings and are more
employee-oriented than ineffective leaders.
One point generally agreed upon is the importance of flexibility in
leadership style (Kast, 1969). Tannenbaum and Schmidt (1958) suggest
that a manager should be flexible enough to cope with different kinds
of situations. This viewpoint gave rise to the development of more
complex models such as the contingency models. The contingency models
suggest that the best leadership style is contingent upon certain con-
ditions or elements within the organization.
One of the best known contingency models was developed by Fred
Fiedler (1967, 1974) , He describes the two dimensions of relationship-
orientation and task-orientation discussed above and he adds a third
aspect, position power. Position power includes the leader's official
authority (based on level in the organizational hierarchy), ability to
give rewards and punishments, and the support the leader receives from
the organizational structure and others higher in the hierarchy. He
proposes that these three situational factors determine the appropri-
ate leader behavior. Leader behavior is characterized as either
directive or permissive
.
Another popular contingency model originally developed by Hersey
and Blanchard (1969) and further refined by Blanchard (1985) proposed
that appropriate leader behavior should be contingent upon the level of
competence and commitment (developmental level) of subordinates. Four
leadership styles are defined by the possible combinations of the two
dimensions of leadership, relationship-orientation and task-orientation.
tl
26
Style 1 is low relationship, high task, style 2 is high relationship,
high task. Style 3 is high relationship, low task. Style 4 is low
relationship, low task. Appropriate leadership style is matched to
the developmental level of subordinates.
Another complex model grounded in Stage 2 is House's (1971) "path-
goal" theory which emphasizes the goal of leadership is to clarify the
task (structure-orientation) so that the subordinate understands the
task requirements and feels capable of achieving it (relationship-
orientation) .
Berlew (1974) credits these Stage 2 (two-dimensional) models as
having brought about most of the advances in organizational theory and
management practice that are operating at present by "defining and con-
trolling the elements of supervision and the organizational environment
that result in high productivity with high satisfaction" (p. 23) .
Berlew states that although "these advances have been substantial and
have led, in most cases, to healthier, more effective organizations"
(1974, p. 23) , there exists another stage that moves beyond "satisfac-
tion" toward "excitement."
Stage 3 Models
In his article "Leadership and Organizational Excitement" (1974)
,
Berlew describes an emerging type of model, which labels "Charismatic,"
or "Stage 3." He contends that the managerial models did not antici-
pate a time when "people would not be fulfilled even when they were
treated with respect, were productive, and derived achievement
27
satisfaction from their jobs" (1974, p. 22) . stage 3 models contain
three basic leader attributes which he claims provide meaning to work
and generate organizational excitement. These are: vision, structure,
and empowerment. Vision is described as the development of a common
vision for the organization related to values shared by the organiza-
tion's members. Structure is described as the discovery or creation of
value-related opportunities and activities within the framework of the
mission and goals of the organization. Empowerment is described as
making organization members feel stronger and more in control of their
own destinies, both individually and collectively.
The three stages are described in Table 3 as they relate to the
type of worker attitude they create, the worker needs they address, and
the historical improvements each brought.
The three stages of management models described by Berlew (1974)
above are quite similar to and correspond to the "continuum of manage-
ment styles" described by Ackerman (1984) in Table 4. Ackerman de-
scribes what she calls three "states" as opposed to what Berlew calls
"stages." However, both authors imply that these states or stages are
developmental in nature and that the third state is the most appropri-
ate for modern times. Ackerman offers specific personality and
behavioral descriptions of managers who operate in each of the three
states
.
28
TABLE 3
Organizational Emotions and Modes of Leadership.Berlew (1974, p. 22)
Stage 1 Stage 2 Stage 3
EmotionalTone :
LeadershipMode
:
Focal Needsor Values:
Anger orResentment Neutrality- Satisfaction Excitement
Focal Changesor Improvements
CUSTODIAL
FoodShelterSecurityFair TreatmentHuman Dignity
WorkingConditionsCompensationFringe BenefitsEqual OpjjortunityDecentSupervision
GrievanceProcedures
MANAGERIAL
MembershipAchievementRecognition
Job EnrichmentJob EnlargementJob RotationParticipativeManagementEffectiveSupervision
Management ByObjectives
CHARISMATIC
Meaningful WorkSelf-relianceCommunityExcellenceServiceSocialResponsibility
Common VisionValue-RelatedOpportunitiesand activities
Supervision whichstrengthenssubordinates
29
CO
(D ^H in>i CM+J fHW 1m+J (NC -H(U
e •
Cr> 04(0
G -
(d ^S 00
0 —e c
3 Sc fi
-H 0)+J ^c u0 <u
+J
c<u
60)
CPnJ
C(0
s0)p(0
p
o
fa
C(U
e
CPfO
cms0)+J
4J
CO
•HrHoto
PCOJ
gdJ
CPnj
C
SQ)+J
OJ
PCO
>H
rO
0)
3o
M-l
co
>1 >H
CP oU M-l
QJ
C 0)
<U ^O3
0)
5
-P (U
-H 4J
3 W
0) UI
Mi-{ 0)
O X!3 -P
cu
QJ
^4
o-p
tn
a)
3-PO3
-P
0) >i1-1 di
+J OJ
H C
O 0)
u05 3(U CO
U C3 -HpU O3 -P
4-1 tn
cn (u
•H :
Q) U V^ +J -H
£ e"
P 0) >i•H -P OJ
3 tn x;>i -p
tn tn
M +J
M 0) Id
o x; ^3 -P -P
e(Uptn
>itn
(U
-P
PCO
CH(0
CPId
tn
u
-p
O tn
C -H
tn 4J•H (d
CP 3C
CPG•HOTJ tn
-HC -(d -P >i
c uiTi (d (d
G -P tn
•H toCOO)C Oh UH g tU
3 -H G
Go•H+J
>i -P+J 0)
•H Q<6
fd
+J oG<U (U
6 >•H
QJ -Ptn o
^ 2\ -pG cn
•H 0)
3 T3
pG(U
•HUOI
EOJ
-Ptn
>itn
Id
POP
G(d
tn
0) tn
OJ Id
tn
<D- CPC 03
3 cn
e oo oM -p
tn
TJ (d
(Up tn
(d t3> ^4
-H-Po
-ao
1 4Jg G0 tn cu
u •H •H^ to
c 0 tn
0 1 T) tniH cn G T! tn
£1 Id 0 rd C ShH Q) •rH 3 0 QJtn u P QJ uCO u U tn c0 G c QJ QJ
•H 3 x: u 3X! mh -p rH
G P •H '0 MhCD •H 3 c Cx: 3 -p"
(d H3 c TJ
G QJ 0) tn rHc 0
BC P (d
•H -H rH >H u c
^ +J 3 u QJ QJ Sh•H 14H (d O Oi QJ
G 4J 0) a, C tn PH (U tn <\} 0 QJ X3 Ot 3 T5 O )H QJ
QJ
T)•H3CP
Co•H
CP (d
^ gQJ fi
c oQ) MH
Cl^J -Ho
Q) O
3orHMH
QJ Ux: o-P -H
>CO td
-p x:QJ QJrH Xt
I
to
tn
mh -h3
QJ CPx: \-P :
rHX oo uO -PrH C
^ 83 =
cQ)
x:3
GO
QJ
(d4J
O >iP -P
•Hto rH^ -HQJ X!x; -H+J tn
o co
tn CuQJ tn
CP QJ
(d ^-1
rH tn tn
(d QJ Id
g --H
C 3 GO M O4H -H
' -Pcji tn (d
C QJ g
0tn u3 -H
tn
rH Co
O tn
V4 ~ QJ
+J tn Vh
G g Id
O QJ x:o -P tn
tn
OJ
P(d
CPQJrHQJ
TJQJ
- 4-1
>i td
^4 -Hfd utn Oitn oQJ Sh
u CuQJ CUC (d
UI1
MH HMH 00 X51 x:>1 -p(d
3on
x: •H4-> tn CP -P•H Q) G Id >.
T3 3 CP H +J
OJ (d iH •HP g rH 0 rHG QJ -H o 4H •rH
tu •H G XI•H & - -H •HV4 3 to c tn
0 U 13 0 MH G1 U U o 0 0IM 0 (d u 0^rH 0) 3 QJ CP tn
0) u d) > c QJ
tn Qa U o -H Sh
QJ
CPId
eu
-p
XQJ
2TlQJ
3C•H4-1
GOU
w1 1
cuiH •H3 +Jrn
M nj
t,M0}
U)
oO
0
O+J -p
T3(U
PC 00)H 0)
0 (TJ
TS0}Mc:
0)
c •H0) V4
e 0
cn (1)
ITJ
C eo
s0) 0-Pm-M aCO m
-d cn
•H prH0CO w O
Q) cq
S>4
ocn
M(U Q)
-Pc 0
c0
ou
cn
ta
1^ rH(TJ iHXITJ(U
<D tn
<P rt3
(U
CJ
0) c(U
cn 6
co•H4J-H
>i(0 ^
-p cn
05
o uQJ
0) Ccn
o cCU 0)
>^
cn -HPo cn
0) nQ< QJ
cn +J
Q) rH
c0•H
0) •P<u
TP
to nJp )H
•P<u
0 0)o a>(fl
J.
V
C QJ
0) QJ totn > OJ
nJ -H uQJ
rHCQJ tn
0 J= pp
CO
tn
B u tn
•H (0 QJ
(TJ U
tn
3Oc
o
QJ tn
O T!
(Cj (TJ
C3XI(TJ
C
Ptn
•HXQJ
eo
4H
G tn
QJ Q)
(TJC•H
tn
tn QJ
Q) u>QJ 3•ri orH tn
Q) QJ
XI )H
o uP o
o c
I
OJ -H
(TJ +J
tn
tn -HQJ 73CJ
U3Otn
QJ
u
T!C(TJ
I
(TJ
G(TJ
•Ptn
CO
QJ
^ -Pd -H3 CQJ -H
UH
tn
C >i•H (0
QJ TJ-P QJ
3 tM
XI -H
tn
Oe
QJ
P Mho
QJ
"O QJ
a, tn
tn QJ
QJ rH
nJ
P 3tn rH•H (TJ
s >
3
c u0
0 C tn Mh H0 0 QJ QJ (TJp QJ d P U p •o
> 0 QJ u x: rlQJ U U •H rH 3 cn OO QJ (TJ •P 0 •H H•H tn XI H tn 4H 3> TI 0 QJ tnU x: QJ (TJ tj u pQJ o QJ U tn QJtn •rH itH QJ P c UH M
o.x: U •H 0 i (0
3 0 c >i•H P (TJ X! tn >1 cnrH cn QJ 4J tn Q)P Tl > •Htn rH tn QJ o QJ QJ OQJ 3 T) tn 14H •rl •H ^ (tJ e -p> tn QJ 0 U rH (TJ 3 QJ tn•-H OJ QJ rH QJ 3 QJ CJ QJ x: •HCP M C o 43 X) tn Sh p a
c(TJ
Pcn
uQJ
TDC3
O-P
PC(TJ
-p
o
tn •
•H gQJ
p x;H +J
co u
3QJ O
Q)
x:4JOJ QJ
U T3(TJ -H 14H
O -Htn >QJ (TJ >^ rH(TJ QJ ^;P X3 Utn -H
o6 -P
tn
QJ
x:po
Cr^
CHSh
QJ
3O
QJ
CO
tn
3UOip
0pin
UQJ
X-Po
tn
tn 4->
3P3O
>i
Sh
(TJ
ip o
T3OJ
O cc •H(TJ
rH tn c(TJ 3 0XJ 0 •H
c pc QJ (TJH tj> P(TJ 0 c
Sh QJ
XI TS •HC SH
-p (TJ 04hQJ nrH >i c
tn (TJ
uc QJ
(TJ C 0>i •H
+J tn >(TJ
U-H 0 QJ
4-1 XI
(TJ
rH erH(TJ rHo (TJ
•rt c-P 0>1 •HrH P(TJ •Hc T)(TJ
ra
PC•H(tJ T(u QJ 0XI P H
1 C >-p QJ (0ip H x:QJ Sh QJrH 0 XI
tn
Q)
CO
tn
QJ
c O•HH aiH Q<0u rH
(TJ
c -P Sh
0 C 0o •H
>G (TJ
0 u x:tn •H QJ
tn M -P X!3 QJ (TJ
O x: >H
0 p Sh cMH 0 Q) (TJ
31
In summary. Stage 3 leadership models set an emotional tone of
"excitement" within an organization. Organizational values stress
excellence, empowering all members, and social responsibility. The
leader is seen as "visionary" in that she or he provides a clear,
achievable, exciting vision which inspires and appeals to the values of
those within the organization. Ackerman (1984) provides a more de-
tailed description of attributes and behaviors of Stage 3 leaders, to
which she refers as "flow state management." According to Ackerman,
"Being in the flow state means working in harmony with others and
looking after the good of the whole, not just the favored parts, of the
system" (1984, p. 125). Flow state leaders view the organization from
a total systems perspective. These leaders do not seek to control the
system or environment, rather they are flexible and let the energy
flow guide behavior. They feel empowered to create what is needed,
believe in abundance of resources and rewards, and view challenges as
"opportunities" and not "obstacles." Furthermore, they focus on
strengthening or "empowering" others as well. Finally, because they
trust the flow of events to work out in favor of their vision, they are
willing to take the potential risks and make whatever personal sacri-
fice may be required.
Visionary Leadership
This section will examine the role of vision and its relationship
to characteristics of excellent leaders. The following adjectives will
be used interchangeably to describe this type of leadership style
32
unless specified otherwise: Stage 3 , visionary, transformational .
charismatic , and flow state .
Characteristics of Visionary Leadership
In describing the characteristics of visionary leaders, David
Berlew (1974) purports that the first requirement for Stage 3 leader-
ship is the existence of a common or shared vision for the future of
the organization. He states that "all inspirational speeches or writ-
ings have the common element of some vision or dream of a better
existence which will inspire or excite those who share the author's
values" (1974, p. 24) . He claims "a vision, no matter how well articu-
lated, will not excite or provide meaning for individuals whose values
are different from those implied by the vision" (1974, p. 24), Berlew
states that no matter how well articulated, a vision that is not con-
gruent with the values and beliefs (or individual visions) of the
subordinates will not be accepted. Therefore, the vision must arise
from the values of the group being led. It is not just created by the
leader and then "sold" to the subordinates. Berlew states, "one prob-
lem for heads of complex organizations is that . . . they must repre-
sent and articulate the hopes and goals of many different groups.
. . . Only the exceptional leader can instinctively identify and
articulate the common vision relevant to such diverse groups" (1974,
p. 24) .
Another quality of the exceptional leader is the ability to act
consistently in accordance with the vision. "The effectiveness of the
common vision depends upon the leader's ability to 'walk the talk':
I
33
to behave in ways both small and large that are consistent with the
values and goals he is articulating" (Berlew, 1974, p. 24). m other
words, the leader must live openly by the values of his vision.
His/her words and actions must be congruent. Table 5 contrasts
Berlew's (1974) conceptions of Stage 3 and Stage 2.
TABLE 5
Contrasting Berlew's Views of Leaders and Managers
(Stage 3) Leader (Stage 2) Manager
Creates emotional tone of excite-ment in the organization
Provides supervision whichstrengthens, empowers subordinates
Creates value-related opportuni-ties activities
Responds to subordinates ' needsat level: self-esteem, self-actualization, respdnsibility(Mas low)
Articulates a common vision forthe organization that is congruentwith the values and beliefs (orindividual visions) relevent to alldiverse groups within the organiza-tion
Acts consistently with the vision;"walks the talk"; behaves in allways both large and small that areconsistent with the values andgoals she articulates; lives openlyby the values of her vision
Creates emotional tone of satis-faction in the organization
Effective supervision (task andrelationship dimentions)
Involves subordinates indecision-making and in partici-pative management
Responds to subordinates ' needsat level of: social - socialmembership
, recognition , andesteem at level of socialrecognition (Maslow)
34
James McGregor Burns (1978) was one of the earliest theorists to
examine the characteristics and the resulting influence of political
visionary leaders who transform followers and organizations. He terms
this type of leader as a "transformational leader." Others such as
Bass (1985) have expanded on his work. Bass (1981) describes the
transformational leader as seeking to "satisfy higher needs, in terms
of Maslow's (1954) need hierarchy, to engage the full person on the
follower . . . [which] converts followers into leaders" (p. 20) .
The following description of Gandhi as an example of a visionary
leader is provided by Ackerman (1984)
:
Gandhi was deeply guided by his inner purpose, his belief inequality, justice, peace and patience. Having no resourcesor form with which to manage his cause, he became a master atmanaging energy. He used himself and other public figures asmodels and sources, created a wide-spread energy field onbehalf of his vision, opened new channels for action in theBritish government and the Indian and Muslim states andtrusted that the flow of events for and against his visionwould work out in his favor, (p. 126)
Warren Bennis and Burt Nanus in Leaders: The Strategies for Tak-
ing Charge (1985) analyze attributes of leader effectiveness and offer
strategies for how leaders can empower organizations. In a recent
study, Bennis (1984) interviewed 90 "top" leaders in private and public
sectors. Bennis and Nanus describe the results where they found these
leaders were all concerned primarily with the organizations ' basic pur-
pose and were "vision-oriented" (1985, p. 21) . They identified four
areas of competency ("strategies") that all of these leaders embodied.
Strategy I is attention through vision . The leader clearly arti-
culates a compelling results-oriented vision for the future that grows
35
out of the needs of the entire organization. Bennis and Nanus claim,
"Leaders are the most results-oriented individuals in the world, and
results get attention. Their visions are compelling and pull people
toward them" (1985, p. 28)
.
Strategy li is meaning through communication . The leader influ-
ences and organizes meaning and interprets events for the members of
the organization in a way that fosters creation of the vision. "An
essential factor in leadership is the capacity to influence and
organize meaning for the members of the organization" (Bennis and
Nanus , 1985, p. 39)
.
Strategy III is trust through positioning . Trust is created and
subordinates accept the vision when the leader is "reliable and tire-
lessly persistent" (Bennis and Nanus, 1985, p. 45) . The leader acts
consistently with the vision which creates trust in the leadership.
The leader communicates through actions his/her commitment to the
vision. "Leaders acquire and wear their visions like clothes" (Bennis
and Nanus, 1985, p. 46). This concept is similar to Berlew's (1974)
description of the importance of the leader's willingness to "walk the
talk."
Strategy IV is deployment of the self through positive self-regard
and through the "Wallenda Factor." It is important to have self-
confidence and to maintain one's focus on the vision, not the
obstacles. These leaders, like Karl Wallenda, the tightrope aerial-
ist, "simply don't think about failure, don't even use the word"
36
(Bennis and Nanus, 1985, p. 69) . Mistakes are not considered failures
because they lead to new learnings.
Bennis and Nanus state that "all organizations depend on the exis-
tence of shared meanings and interpretations of reality, which facili-
tate coordinated action. The actions and symbols of leadership frame
and mobilize meaning" (1985, p. 39). The social architect (the effec-
tive leader) must face the "challenge of aligning the elements of the
social architecture so that ... it becomes a creative synthesis
uniquely suited to realizing the guiding vision of the leader" (1985,
p. 139) . The ability to articvdate and define reality and the vision
for the future is especially important in the change process, in trans-
forming organizations, where the social architecture must be revamped
(19 85, p. 139) . Bennis and Nanus state that "for a successful trans-
formation to be achieved, three things have to happen . . . [the leader
must] 1) create a new and compelling vision capable of bringing the
work force to a new place, 2) develop commitment for the new vision,
and 3) institutionalize the new vision" (1985, pp. 140-141).
Mary Parker Follett (1941) supports this concept in her statement:
. . . the most successful leader of all is one who seesanother picture not yet actualized. He sees the thingswhich belong in his present picture but which are not yetthere. . . . Above all, he should make his co-workers seethat it is not his purpose which is to be achieved, but a
common purpose, bom of the desires and the activities ofthe group, (pp. 143-144)
According to Bennis and Nanus (1985) , commitment is created,
achieving the "alignment" within the organization around a common
37
vision, by helping co-workers realize that one's vision is in fact a
common vision. They state:
A vision cannot be established in an organization by edict,or by the exercise of power or coercion. It is more of anact of persuasion, of creating an enthusiastic and dedicatedcommitment to a vision because it is right for the times,right for the organization, and right for the people who areworking in it. (p. 107)
Bennis and Nanus (1985) agree with Berlew (19 74) that "if the
organization is to be successful, the image must grow out of the needs
of the entire organization and must be 'claimed' or 'owned' by all the
important actors" (Bennis and Nanus, 1985, p. 109). Bennis and Nanus
also agree with Berlew that the vision must begin at the top of the
organization and is the responsibility of the CEO (chief executive
officer) who "articulates the vision and gives it legitimacy" (Bennis
and Nanus, 1985, pp. 109 and 141)
.
Bennis and Nanus (1985) and Berlew (1974) also agree that "another
way the leader communicates a new vision is by consistently acting on
it and personifying it" (Bennis and Nanus, 1985, p. 108).
Marshall Sashkin (1986) discusses thinking processes used by
visionary leaders. He describes visionary leaders as being able to
think in terms of long time spans (10 to 20 years or more) in order to
conceptualize long-range visions. He terms this characteristic
"cognitive ability" which is derived from the work of Elliott Jacques'
(1964) theory of "time span of discretion." Sashkin (1986) further
describes four processes or thinking skills that visionary leaders use
in creation of a vision. The first skill is called "expressing the
vision" and involves performing actions to make it real such as meeting
38
with involved people or writing a policy. The second step involves
"explaining" the vision or describing the actions required. The third
skill is "extending" the vision, the ability to apply the necessary
actions to a variety of situations. The fourth skill is called
"expanding" the vision and involves applying it not just in a variety
of similar ways but in a wide range of circumstances.
Sashkin (1988) identifies three critical elements of visionary
leadership. The first element involves personality prerequisites con-
cerning the leader's need for power and the four cognitive skills
described above. The second element involves the leader's understand-
ing of "key content dimensions" that are essential for an effective
vision and which are based on certain functions that define the
organization's culture. Sashkin describes three underlying themes
that constitute an effective vision: dealing with change effectively,
developing high-standard and important goals, and providing ways that
people can work together and feel ownership for the vision. The third
element involves the leader's ability to articulate the vision through
certain behavioral skills which are used to implement programs and
policies that reflect the leader's organizational philosophy.
Other recent authors have also attempted to look more closely at
the characteristics of visionary leadership. Kiefer and Stroh (1984,
p. 182) state these leaders are able to:
1. Create and commianicate a personal and organizationalvision to which they are wholeheartedly committed,
2. Catalyze alignment around a common vision.3. Revitalize and recommit to the vision in the face of
obstacles
.
39
4. Understand an organization as a complex system whosestructure may enable or thwart realization of thevision. Develop (or change) structures as needed tosupport the vision.
5. Empower themselves and empower others.6. Develop intuition as a complement to rational thinking.
Kouzes and Posner (1987) report the results of a study where over
500 executives were asked to describe their "personal best" leadership
experiences. From analysis of responses, they determined consistent
leadership practices that involved five strategies. The first is
"challenging the process" or looking for new innovative ways to do
things. The second is "inspiring a shared vision." The third is
"enabling others to act" or empowering others. The fourth is "modeling
the way," which is similar to Berlew's (1974) concept of "walk the
talk." The fifth is "encouraging the heart," which involves celebra-
tion and recognition of successes along the way.
Kouzes and Posner (1987) describe ten behavioral commitments that
visionary leaders exhibit (p. 14) . These commitments are listed below
with the strategy to which they relate.
Challenging the Process1. Search for Opportunities2 . Experiment and Take Risks
Inspiring a Shared Vision3. Envision the Future4 . Enlist Others
Enabling Others to Act5. Foster Collaboration6 . Strengthen Others
Modeling the Way7. Set the Example8. Plan Small Wins
40
Encouraging the Heart9. Recognize Individual Contribution
10. Celebrate Accomplishments
Wilner (1968) describes the charismatic leader as a strong per-
sonality that attracts others. The attraction is characterized by a
deep emotional attachment by followers of devotion, awe, reverence, and
blind faith. In Chapter I, under "definition of terms," a distinction
was made between definition of the visionary leader and the charismatic
leader. Bass (1985), however, describes charisma as one of the effects
of a visionary leader. He does offer, however, an excellent descrip-
tion of the role and pitfalls of charisma for the visionary leader that
can prevent the leader from being a true visionary. He states:
Success as a leader flows from one's charisma. But equallyso, the charismatic must continue to demonstrate effective-ness as a leader, that is, that the actions which can beattributed to him are continuing to benefit the community offollowers. The effectiveness must be real or apparent.Often, the charismatic survives with more attention given theapparent than the real. Image of success and effectivenessis pursued, (p. 40)
Katz and Kahn (1966) suggest that the Stage 3 leader is more like-
ly to appear in political and religious arenas than in business or
industry. Results of studies conducted by Bass (1985) suggest that
subordinates can identify Stage 3 leaders they have known and that the
presence of these leaders is not as uncommon as others might presume.
Certainly this type of leadership is gaining increased interest and
recognition at present.
41
Visionary Leadership Compared to Traditional Management
Bennis and Nanus (1985) state that "most organizations are man-
aged, but not led.. . . Management typically consists of a set of con-
tractual exchanges, 'you do this job for that reward.' ... The
result, at best, is compliance; at worst, you get spiteful obedience"
(p. 218) . This type of management is based on the attitudes and
beliefs presented in McGregor's Theory X (1966) discussed earlier. In
contrast, they assert the end result of visionary leadership is empower-
ment. The ability to empower others in the organization is one of the
three basic attributes of visionary leadership described by Berlew
(1974) and operates from the attitudes inherent in McGregor's Theory Y
(1966) . Bennis and Nanus state that the advantages of empowering the
workers in an organization are "not just higher profits and wages
but [the creation of] an organizational culture that helps employees
generate a sense of meaning in their work and a desire to challenge
themselves to experience success" (1985, p. 218)
.
Table 6 cohtrasts Ackerman's (1984) conceptions of visionary
leaders and traditional managers
.
Kanter (1983) compared the transformational leader, which she
calls "change master," with the traditional manager. These views are
presented in Table 7.
Smircich (1984, p. 45) contrasts her views of transformational
leadership with traditional management. They are presented in Table 8.
James MacGregor Burns (1978) described the stage 2 leader as a
"transactional leader" who manipulates followers by negotiating rewards
42
TABLE 6
Contrasting Ackerman's Views of Leaders and Managers
(Flow State) Leader (Solid State) Manager
Projected-Image
Clearly focused; attentive withoutconcern; clarity and foresight;alive, active and healthy
Pulled in many directions ; con-cerned; seeks information forunderstanding; works regardlessof mental state
Balances using factual data(reasoning) with followinghunches (intuition)
Dialectical thinking; allowspolarities to emerge, shift asnecessary; embraces both sidesas legitimate (Sees the bigpicture that surrounds polarities
Thinking Process
Analytic (left-brain) oriented
Sees polarities; believes in andfights for right answers;resists shifts
Influenced By
Trends patterns and energy flow
His/her sense of the largerpurpose of the organization
External forces in the organiza-tion (goals, deadlines, policies)
What others think; motivated toplease; to do well as judged byothers
Attitudes
Winning and losing isn't impor-tant; doing what is necessary is
Believes in abundance of resourcesand rewards (the "one big chance"mentality is an illusion)
Mistakes provide the most valuablesource of learning and are welcomeif they occur; it is important tounderstand them. Learning is
essential. People must explore,take risks, and make mistakes inorder to learn.
WinA^in
Resources and rewards are finiteand must be distributed in logi-cal , standardized ways
Mistakes are inevitable , and tobe avoided; move on quickly if
they occur
(Continued Next Page)
43
TABLE 6
(continued)
(Flow State) Leader (solid State) Manager
Attitudes(continued)
Patience with and trust in people'sintentions to work for the good ofthe common goals without sacrific-ing their personal identity.
Maintains values that are sharedby members of the organization.
Value of "service to the largerpurpose .
"
Values learning, exploration, andcreativity
.
Non-attachment to self, action,and power. Letting go of one'sego.
Views challenges as opportunitiesand not obstacles.
Structure/System Orientation
Sees change on ongoing, workingwith variables as they arise,changing structure in the systemto accommodate when necessary
Holistic, total systems perspec-tive, looking after the good ofthe whole and not just thefavored parts system
Manages traditional structures(task-oriented and people-oriented) within the organizationto insure that they work withinthe system
Manages components of the organi-zation and doesn't see or empha-size the relationships, dynamics,and process that exist at the
total systems level.
(Continued Next Page)
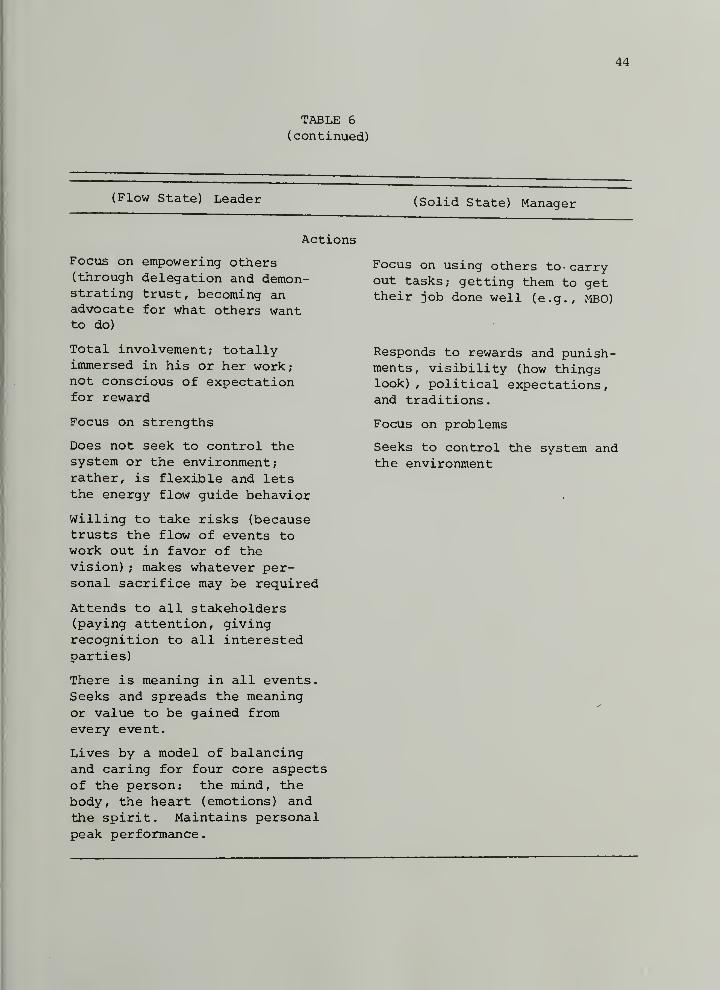
44
TABLE 6
(continued)
(Flow State) Leader (Solid State) Manager
Actions
Focus on empowering others(through delegation and demon-strating trust , becoming anadvocate for what others wantto do)
Total involvement; totallyimmersed in his or her work;not conscious of expectationfor reward
Focus on strengths
Does not seek to control thesystem or the environment;rather, is flexible and letsthe energy flow guide behavior
Willing to take risks (becausetrusts the flow of events towork out in favor of thevision) ; makes whatever per-sonal sacrifice may be required
Attends to all stakeholders(paying attention, givingrecognition to all interestedparties)
There is meaning in all events.Seeks and spreads the meaningor value to be gained fromevery event.
Lives by a model of balancingand caring for four core aspectsof the person: the mind, thebody, the heart (emotions) andthe spirit. Maintains personalpeak performance
.
Focus on using others to- carryout tasks; getting them to gettheir job done well (e.g., MBO)
Responds to rewards and punish-ments, visibility (how thingslook), political expectations,and traditions
.
Focus on problems
Seeks to control the system andthe environment
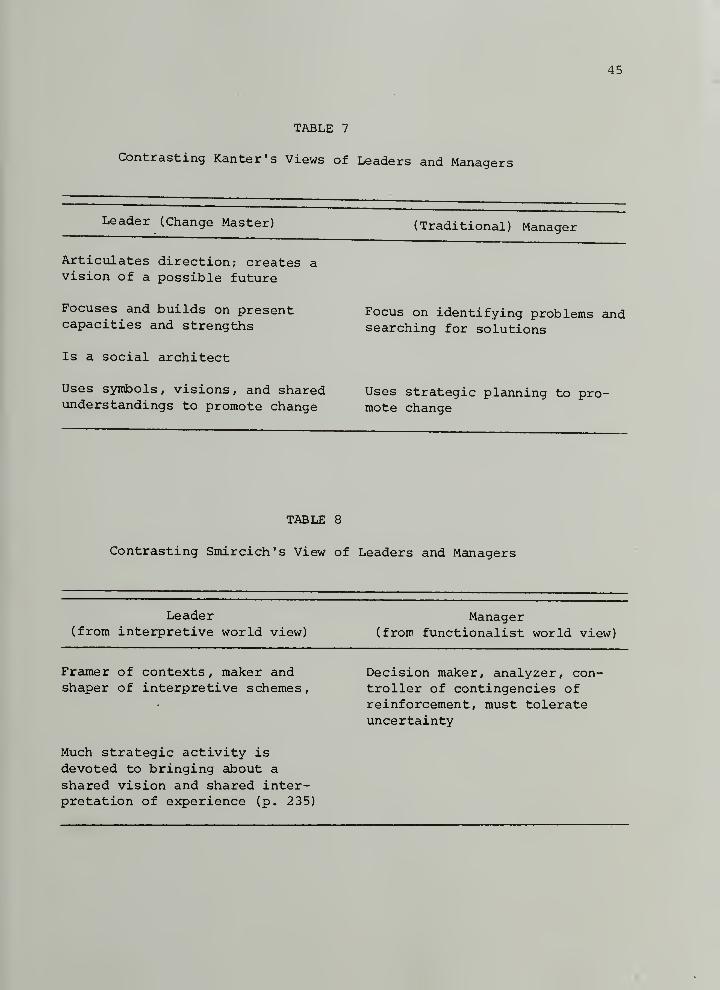
45
TABLE 7
Contrasting Ranter's Views of Leaders and Managers
Leader (Change Master) f Trad i 1" H on a 1 ^ Manarrav
Articulates direction; creates avision of a possible future
Focuses and builds on present Focus on identifying problems andcapacities and strengths searching for solutions
Is a social architect
uses symDOis , visions, ana shared Uses strategic planning to pro-understandings to promote change mote change
TABLE 8
Contrasting Smircich's View of Leaders and Managers
Leader Manager(from interpretive world view) (from functionalist world view)
Framer of contexts , maker and Decision maker, analyzer, con-shaper of interpretive schemes, troller of contingencies of
reinforcement, must tolerateuncertainty
Much strategic activity is
devoted to bringing about a
shared vision and shared inter-pretation of experience (p. 235)
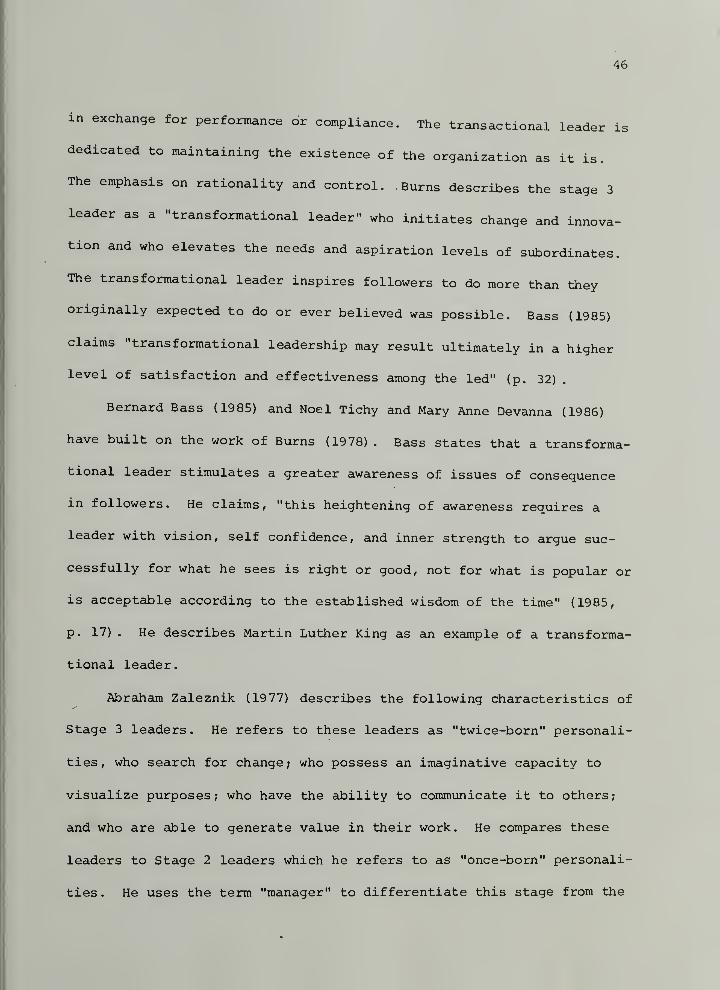
46
in exchange for performance or compliance. The transactional leader is
dedicated to maintaining the existence of the organization as it is.
The emphasis on rationality and control. Burns describes the stage 3
leader as a "transformational leader" who initiates change and innova-
tion and who elevates the needs and aspiration levels of subordinates.
The transformational leader inspires followers to do more than they
originally expected to do or ever believed was possible. Bass (1985)
claims "transformational leadership may result ultimately in a higher
level of satisfaction and effectiveness among the led" (p. 32) .
Bernard Bass (1985) and Noel Tichy and Mary Anne Devanna (1986)
have built on the work of Burns (1978) . Bass states that a transforma-
tional leader stimulates a greater awareness of issues of consequence
in followers. He claims, "this heightening of awareness requires a
leader with vision, self confidence, and inner strength to argue suc-
cessfully for what he sees is right or good, not for what is popular or
is acceptable according to the established wisdom of the time" (1985,
p. 17) . He describes Martin Luther King as an example of a transforma-
tional leader.
Abraham Zaleznik (19 77) describes the following characteristics of
Stage 3 leaders. He refers to these leaders as "twice-born" personali-
ties, who search for change; who possess an imaginative capacity to
visualize purposes; who have the ability to communicate it to others;
and who are able to generate value in their work. He compares these
leaders to Stage 2 leaders which he refers to as "once-born" personali-
ties. He uses the term "manager" to differentiate this stage from the
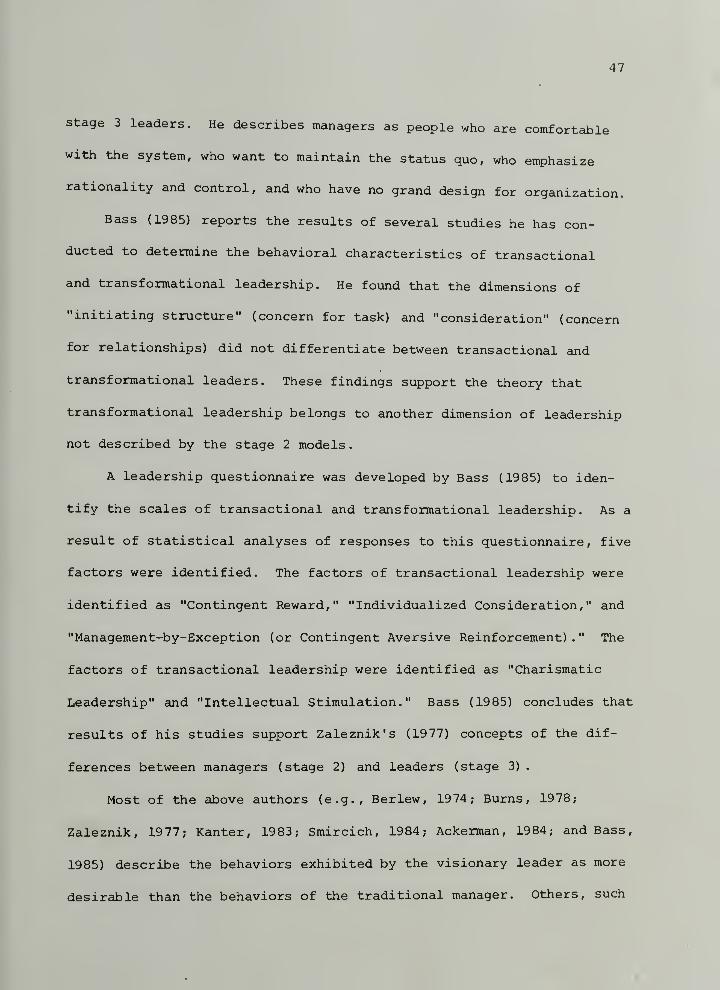
47
stage 3 leaders. He describes managers as people who are comfortable
with the system, who want to maintain the status quo, who emphasize
rationality and control, and who have no grand design for organization.
Bass (1985) reports the results of several studies he has con-
ducted to determine the behavioral characteristics of transactional
and transformational leadership. He found that the dimensions of
"initiating structure" (concern for task) and "consideration" (concern
for relationships) did not differentiate between transactional and
transformational leaders. These findings support the theory that
transformational leadership belongs to another dimension of leadership
not described by the stage 2 models.
A leadership questionnaire was developed by Bass (1985) to iden-
tify the scales of transactional and transformational leadership. As a
result of statistical analyses of responses to this questionnaire, five
factors were identified. The factors of transactional leadership were
identified as "Contingent Reward," "Individualized Consideration," and
"Management-by-Exception (or Contingent Aversive Reinforcement)." The
factors of transactional leadership were identified as "Charismatic
Leadership" and "Intellectual Stimulation." Bass (1985) concludes that
results of his studies support Zaleznik's (1977) concepts of the dif-
ferences between managers (stage 2) and leaders (stage 3)
.
Most of the above authors (e.g., Berlew, 1974; Burns, 1978;
Zaleznik, 1977; Kanter, 1983; Smircich, 1984; Ackerman, 1984; and Bass,
1985) describe the behaviors exhibited by the visionary leader as more
desirable than the behaviors of the traditional manager. Others, such
48
as Sashkin (1985) and Kouzes and Posner (1987) , describe both types of
leader behaviors as being desirable depending on the circumstances.
Kouzes and Posner (1987) state:
When we think of leaders, we recall times of turbulence, con-flict, innovation, and change, when we think of managers, werecall times of stability, harmony, maintenance, and con-stancy. We need leaders and we need managers. Both areessential to making the system work. (p. 32)
Vision in Groups and Organizations
The preceding sections of this chapter addressed vision in rela-
tion to individuals in a position of leadership. This section will
focus on vision in relation to groups and organizations. This section
will first review the literature which addresses the importance of a
vision for group and then will describe the characteristics of
"visionary" or peak performing organizations.
Value of a Clear Vision for Groups
The process of creating, articulating, and agreeing upon a vision
for a group elucidates the purpose of the group (Kiefer and Stroh,
1984) . When the purpose of the group is clear, members move more
easily in the same direction with less conflict and are able to agree
upon goals and objectives more easily.
Allen and Kraft (1984) assert an advantage of articulating a
clear, agreed-upon vision and the resulting goals for groups is that
this process directly influences the group's norms. Norms are the
implicit and explicit expectations held by group members about accept-
able group behavior (Schein, 1969, p. 59). Allen and Kraft (1984)
49
describe norms as "the building blocks of our cultures-those expected,
accepted, and supported ways of behaving that determine so much of what
we do" (p. 93) . They assert that norms exert a strong influence on
people's daily lives.
The small groups of which we are members—our work groups,families, the classroom, the office staff, the board, the'faculty, and so on—have a tremendous influence upon us.Each one of our primary groups (the people we actually asso-ciate with each day) is a small culture, full of norms thatprofoundly affect our lives. Though every one of us hascertain areas in which we confront or flaunt the norm, forthe most part our lives are determined by the norms of ourgroups, especially our primary groups, (p. 49)
Allen and Kraft (1984) assert that influencing norms is essential
in any change process, a concept which is supported by Kanter (1983)
.
Allen and Kraft (1984) maintain that a focus on a clear, articulated
vision for a group facilitates the development of helpful norms for a
group. They state, "In successful cultures, goals and purposes are
constantly kept in view as the change process gets underway in
installing and sustaining positive norms" (p. 47)
.
Kiefer and Senge (1984) state that the existence of a unifying
vision exerts a powerful influence on the norms of the group. They
state, "What matters is not so much what the vision is, but what it
does. By taking a stand for something that truly matters to people,
the organization creates an environment where commitment is the norm
rather than the exception and people have an ever present standard
against which to judge their own actions (p. 71) . As an example of the
power and commitment generated from a clear, results-oriented vision,
Kiefer and Senge (1984) describe the Apollo Moon Project.
50
By committing themselves to "placing a man on the moon by theend of the 1960s," the leaders of the project took a stand.The clarity and conviction they generated touched people atall levels of the enterprise. One can imagine how much lessspectacular the results might have been if they had adoptedan alternative mission statement, such as "to be leaders inspace exploration." Unfortunately, such "motherhood" mis-sion statements are the norm for most organizations, (p. 71)
Kiefer and Stroh (1984) also speak to the power of having a clear
vision for a group. They state, "A vision has the capacity to motivate
people far more effectively than a precisely defined solution" (p.
174) . They maintain, "The vision embodies people's highest values and
aspirations (for self-actualization, excellence, service and commun-
ity) . It inspires people- to rise above their fears and preoccupations
with current reality" (p. 174)
.
Bennis and Nanus (1985) state, "Vision animates, inspirits, trans-
forms purpose into action" (.p. 30) . They offer a description by Jerry
Neely of how a clear vision influenced daily functioning in Smith
International, a major manufacturer of oil drilling and rigging equip-
ment: "The employees were willing to take a chance because they felt
part of something magic and they wanted to work that extra hour or make
that extra call, or stay that extra Saturday" (p. 216)
.
Vision in Peak Performing Organizations
Kiefer and Senge (1984) and Kiefer and Stroh (1984) describe
visionary or high performing organizations as ones where all members
are aligned around a powerful, unifying vision. Kiefer and Stroh (1984)
assert that these organizations are capable of inspired performance and
have attained the highest levels in both organizational performance and
51
a con-in human satisfaction (p. 171) . The organization operates with
viction that it can shape its own destiny (Kiefer and Senge, 1984, p.
70) . This viewpoint is grounded in the interpretive paradigm described
by Smircich (1983) and Weick (1979) which asserts it is possible to
affect one's sense of reality through the meaning one assigns to
events. Stroh (1984), Kiefer and Senge (1984), Kiefer (1983) et al.
assert that it is possible to create whatever one wants and that
people and organizations need not be bound by current circumstances or
limited by outside forces. For example, perhaps an organization might
define a new product line developed by a competing organization as an
obstacle or a limiting factor. The peak performing organization would
maintain its focus on its purpose or vision, not the obstacle, and
might define the obstacle as a "challenge" or "test" or "step" in move-
ment toward the vision. In other words, the peak performing organiza-
tion would use the "obstacle" to its own advantage instead of fighting
it or giving up, while another organization might limit itself in the
face of the "obstacle."
Kiefer and Senge (1984) state that the unifying principle of these
high performing organizations is that "individuals aligned around an
appropriate vision can have an extraordinary influence in the world"
(p. 70) . This principle forms the basis for a coherent organizational
philosophy with five primary elements:
(1) a deep sense of vision or purposefulness,
(2) alignment around that vision,
( 3) empowering people
,
52
(4) structural integrity,
(5) the balance of reason and intuition
These five elements are discussed in more detail below, specific-
ally in relation to vision in groups and organizations.
Vision. Kiefer and Senge (1984) describe "a deep sense of pur-
posefulness and a vision of the future, while values (such as excel-
lence, service, or creativity) can be abstract, vision must be a clear
picture of the future that people are striving to create" (p. 70) .
According to Stroh (1984), "The power of . . . [the] vision stems
directly from its use as a vehicle for elucidating an underlying, and
often intangible, organization purpose. Outstanding organizations are
deeply purposeful. A workable, captivating vision serves as both a
vehicle for people to discover an underlying purpose and as a source
of power around which they can align" (p. 10) . Kiefer and Stroh (1984)
assert that "Because the full depth and meaning of a purpose cannot be
wholly conveyed by the words of charters and mission statements, [peak
performing] organizations use the vision of a desired future to repre-
sent and communicate their purpose" (p, 174)
.
Kiefer and Stroh (19 84) emphasize that peak performing organiza-
tions maintain a focus on the result-oriented vision and not the
process for achieving the results.
Alignment . Alignment is a condition which exists in which indi-
viduals in a group operate freely and fully as part of a larger, inte-
grated whole because they see that the purpose of the organization is
an extension of their individual purposes (Kiefer and Stroh, 1984, p.
53
175).
Peak performing organizations show a high degree of alignment
among meirtoers around the vision or purpose, m fact, it is the vision
that catalyzes alignment (Kiefer and Senge, 1984, p. 71). "Trying to
create alignment by focusing on it directly doesn't work, it is the
natural by-product of focusing on a lofty, noble purpose. Alignment is
not the same as people agreeing on where they're going. Alignment
deals with the more inspirational aspect of an organization, while
agreement tends to deal only with the mechanics of goals and objec-
tives" (Kiefer, 1983) . "People who are aligned identify with the
organization and consciously assume responsibility for its success.
They naturally support each other out of a recognition that, 'We are a
part of the same whole'" (Kiefer and Stroh, 1984, p. 175) . Bennis and
Nanus (1985) offer a description by Werner Erhard, the founder of EST,
of alignment functioning within an organization:
. . . they work in harmony with other people, not as a func-^tion of a bunch of agreements or contracts, but out of asense of harmony. . . . it's something akin to what you seeon a sailboat crew working together when one of the linesbreaks. Very few, if any, orders are given and nobody getsin the other guy's way—there's something about sailors inwhich there is an alignment, a kind of coming from the wholeand nobody needs to give orders, (p. 216)
Another description of alignment in operation is provided by John
Naisbitt in Megatrends (1982) who describes the effect of the vision
for the Apollo Moon Project.
The extraordinary successful strategic vision for NASA was to"put a man on the moon by the end of the decade." That stra-tegic vision gave magnetic direction to the entire organiza-tion. Nobody had to be told or reminded where the organiza-tion was going.
54
com-
Stroh (1984) implies it is easier for an aligned organization to
engage in participative management. He states, "By clarifying and
mitting collectively, these groups also discover the power of shared
leadership" (p. 10)
.
Empowering People. Peak performing organizations are character-
ized by an "emphasis on both personal performance and an environment
that empowers the individual" (Kiefer and Stroh, 1984, p. 171). mthese organizations, "managing people" is easier as the goals of the
individual are consistent with the goals of the organization. There-
fore, it is easier to allow individuals to have more control and power
(Kiefer and Senge, 1984). In fact, "Where the best interests of the
individual and the organization are highly aligned, empowering the indi-
vidual becomes a key to empowering the organization" (Kiefer and Senge,
1984, p. 71) . Alignment by the individuals in the organization around
the vision is what allows the organization to empower people (Kiefer
and Senge, 1984)
.
Kiefer and Stroh (1984) assert members of peak performing organi-
zations believe that they can create their lives to be the way they
want them (p. 176) . They maintain that with this belief, not only does
the organization benefit through high performance but also the individ-
uals benefit because this belief encourages them to exert influence
over their lives, to establish new opportunities, and not to feel like
powerless victims of uncontrollable forces (p. 177)
.
Kanter (1983) agrees with this viewpoint stating, one "requirement
for empowering people to reach for a future different from the past is
55
a conviction that everyone in the organization is at least facing in
the same direction" (p. 33)
.
Structural Integrity. Not only must the vision of all members be
in alignment with the vision of the organization, but also, the organi-
zational design or structure (e.g., roles, hierarchy, policies, commu-
nication avenues, rewards and incentives, and accountabilities) must be
consistent with and in alignment with the vision (Kiefer and Senge,
1984, p. 71) . Peak performing organizations exhibit "effective struc-
tures that take the systemic aspects of organizations into account"
(Kiefer and Stroh, 1984, p. 172).
Balance of Intuition and Reason . Kiefer and Senge (1984) state
that maintaining a unique balance of reason and intuition cuts across
all the above dimensions of the peak performing organization (p. 72) .
They assert this balance is essential to creating and maintaining
structural integrity and to empowering people. They further state that
"a compelling and inspiring vision, by its very nature, transcends
rationality," and that alignment is characterized by the "intuitive
interconnectedness of people that allows each to act spontaneously in
the best interests of the whole" (p. 72) . "Highly aligned groups per-
form complex tasks in ways that cannot be planned rationally" (p. 72) .
An example of the unique interplay of all five characteristics is pro-
vided by basketball star Bill Russell who describes his experience
with the intuitive component of a team playing as one, with a complete
sense of interconnectedness and alignment that seemed magical (Kiefer
and Senge, 1984, p. 72)
.
56
Principles of Excellent Organizations
Thomas Peters and Robert Waterman, Jr. in In Search of Excellence;
Lessons from America's Best-Run Companies (1982) report the results of
a study conducted of 75 highly regarded companies for the purpose of
learning more about what makes an organization excellent. They
describe eight attributes they found that characterize the distinction
of excellent, innovative companies. These attributes are listed and
described briefly below. Also noted, when appropriate, are ways these
attributes relate to the characteristics of peak performing organiza-
tions described by Kiefer and Senge (19 84) et al . above.
1- A bias for action . Peters and Waterman (1983) state, "Even
though these companies may be analytic in their approach to decision-
making, they are not paralyzed by that fact" (p. 13) . That these com-
panies do not rely solely on rational analysis supports the concept of
"balance of intuition and reason" in peak performing organizations.
Peters and Waterman (1983) suggest that this balance frees the company
to take action. Another way of describing the same concept is to say
the "bias for action" avoids the potential to stifle innovation by
overreliance on analytic planning described by Kanter (1983)
.
2. Close to the customer . Excellent companies listen to and
learn from the people they serve. This concept is grounded in the
viewpoint expressed by Kanter (1983) and Smircich (1983) of the neces-
sity of working with the environment rather than attempting to control
it.
57
^' ^^tonomy and entrepreneurship. Peters and Waterman (1983)
maintain, "The innovative companies foster many leaders and many inno-
vators throughout the organization" (p. 14) . This attitude relates
directly to the concept of empowering people described above. There
exists an attitude that not only allows mistakes but encourages mis-
takes as a sign of practical risk-taking and are an unavoidable part
of the creative process (Peters and Waterman, 1983, p. 14; Kiefer and
Stroh, 1984, p. 177; Fritz, 1984, p. 179).
^' Productivity through people . Respect for the individual is a
primary value and is acted-upon. For example, "They do not foster
we/they labor attitudes" (p. 14) . Kiefer and Senge (1984) also
describe how peak performing organizations foster "me and you" instead
of "me or you" attitudes. They state, "Competition is transformed by
the pursuit of a common vision, agreed-upon ground rules . . , and
strong ethics of honesty and integrity" (p. 78) .
5. Hands-on, value driven . Peters and Waterman (1983) state,
"Every company we studied is clear on what it stands for [e.g.,
purposej " (p. 280). They further state that "excellent companies are
driven by coherent value systems" (p. 287) and that these value systems
are mastered by the effective leader who inspires with "soaring, lofty
visions" (p. 287) . These concepts echo the concepts described above
of purpose and vision and alignment within the organization around a
common vision.
6. Stick to the knitting . Excellent companies may diversify
somewhat but tend to stay with what they know best how to do. Peters
58
and waterman (1983) state "Both the qualitative guiding value ... and
the hands-on approach are at war with diversification strategies"
(p. 293) .
Si"^Ple form, lean staff. The organizational hierarchy is not
complex and is not top-heavy. Peters and Waterman (1983) describe an
organizational structure of simplicity and flexibility in excellent
companies. In describing the negative consequences of a complex struc-
ture, they state, "The organization gets paralyzed because the struc-
ture not only does not make priorities clear, it automatically dilutes
priorities" (p. 307) . The importance of structure and the importance
of creating a structure that supports the functioning of the organiza-
tion is discussed in the section above which addresses the concept of
creating structural integrity.
8- Simultaneous loose-tight properties . According to Peters and
Waterman (1983) , "The excellent companies are both centralized and
decentralized" (p. 15) . This concept is similar to the description of
peak performing organizations provided by Kiefer and Senge (1984) where
the emphasis is on decentralization and distributed deeision-making
while not abandoning hierarchy. They state the goal is to change the
value system that has traditionally been linked to hierarchy to one
where people further down the hierarchy "do not consider themselves
lesser beings than those above them" (p. 74)
.
In a newer work, A Passion for Excellence (1985) , Peters and
Austin have condensed these eight attributes into three which focus on
59
a bias toward entrepreneurial action, keeping close to the customer,
and the importance of people.
This section has presented the characteristics of visionary or
peak performing organizations, organizations with a clear vision of a
future which all members are invested in creating. The characteris-
tics of these organizations are described by Kiefer and Senge (1984)
,
Kiefer and Stroh (1984) , and Peters and Waterman (1984) . The common
characteristics include valuing and using intuition, empowering mem-
bers, pursuit of a common vision consistent with the values of the
organization, and creation of an organizational structure that supports
the creation of the vision.
Summary
This chapter has provided a review of the relevant research and
literature of vision in leadership and organizations. An historical
perspective of the development of categories of leadership models was
provided. It was shown how the traditional models arise from what
Berlew (1974) calls Stage 2 models and that the newer perspective of
visionary leadership belongs in Berlew 's (1974) category of Stage 3
models. Leader behavior was described from the perspective of the
traditional models and the visionary leadership models. Finally a
description of the characteristics of peak performing organizations
was provided.
60
This literature review demonstrates the basis of the concepts of
visionary leadership, traditional management, and peak performance for
organizations which are the subjects of investigation in this study.
CHAPTER III
METHODOLOGY
This chapter describes the research method for the study which
examined the relationship between workers' perceptions of leadership
and how they perceive the peak performance level of the work unit.
This chapter includes a description of the subjects and sample size,
the independent and dependent variables, the instrumentation, the
research design, and the data analysis and statistics used.
Description of the Samples
The population of this study consisted of 340 workers in a large
business that both finances, leases, and sells mainframe computers and
telecommunications equipment. Participants in the study rated their
immediate superior's behavior and they rated their perception of the
peak performance level of the work unit. A major consulting firm dis-
tributed the questionnaires in conjunction with a leadership training
program they were providing for managers within the company. Before
the training program began, the firm requested each of the 129 managers
to give a packet containing the questionnaires to 4 or 5 of the subor-
dinates who report directly to him or her. The questionnaires were
then completed by the subordinates of the manager.
62
Variables
The independent Variable was "effective leadership behavior as
perceived by subordinates." This variable was measured by instruments
derived from both the traditional constructs arising from the Ohio
State university studies (Stogdill and Coons, 1957) and University of
Michigan studies (Bowers and Seashore, 1966; Taylor and Bowers, 1972)
and from the newer constructs of "visionary leadership" arising from
research studies by Bennis (1984) and Kouzes and Posner (1984).
The Dependent Variable was subordinates' perceptions of the peak
performance level of the work unit. This variable was measured by an
instrument developed for use in this study, the PAVE: Excellent
Organizational Practices Index. The PAVE will be described in detail
in Chapter IV.
Instrumentation
Four instruments were given to each subordinate who was instructed
to answer questions in relation to their primary work unit and/or their
immediate superior. Three instruments were used to assess the indepen-
dent variable (leadership behavior) and one was used to assess the
dependent variable (workers' perceptions of the peak performance level
of the work unit)
.
Leader Behavior Analysis
The Leader Behavior Analysis (LBA) was developed by Ken Blanchard,
Ron Hambleton, Drea Zigarmi, and Doug Forsyth (1981). This instrument
63
assesses leader behavior. The LBA is based on the results of the
leadership studies at Ohio State University (Stogdill and Coons, 1957)
and the University of Michigan (Bowers and Seashore, 1966; Taylor and
Bowers, 1972) which describe successful management in terms of two
primary categories of behavior: behavior that is directed toward
"structuring" the work situation (e.g., giving directions, setting
clear sequences of activity) and behavior that is centered on the mana-
ger's concern and "consideration" for the subordinates. These two
behavior categories are also often referred to as "initiation of
structure" and "consideration." A specific model of how these behav-
iors relate to managerial effectiveness was developed by Paul Hersey
and Ken Blanchard (1969) . This model, called Situational Leadership,
was further refined by Kenneth Blanchard and Associates (Carew et al.,
1984; Blanchard, 1985) .
The Situational Leadership model refers to the two behavior cate-
gories as "directive" and "supportive." Examples of directive behav-
iors include:
Setting goals
Clarifying goals
Setting time lines
Defining methods of evaluation
Planning work in advance for others
Showing or telling a subordinate how to do a task
Defining roles
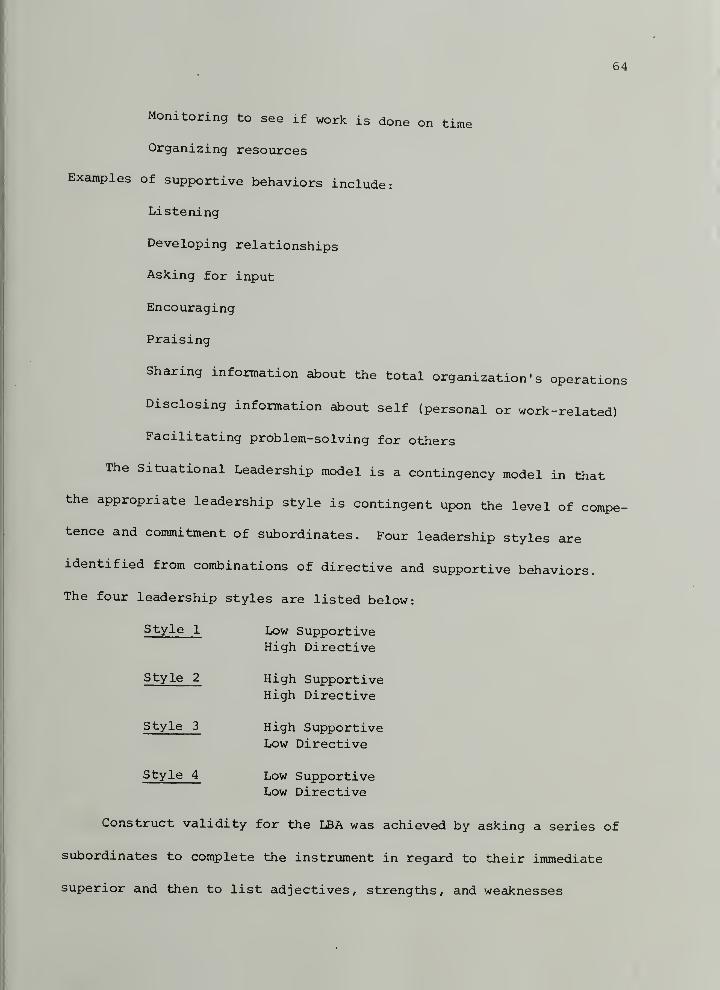
64
Monitoring to see if work is done on time
Organizing resources
Examples of supportive behaviors include:.
Listening
Developing relationships
Asking for input
Encouraging
Praising
Sharing information about the total organization's operations
Disclosing information about self (personal or work-related)
Facilitating problem-solving for others
The Situational Leadership model is a contingency model in that
the appropriate leadership style is contingent upon the level of compe-
tence and commitment of subordinates. Four leadership styles are
identified from combinations of directive and supportive behaviors.
The four leadership styles are listed below:
Style 1 Low SupportiveHigh Directive
Style 2 High SupportiveHigh Directive
Style 3 High SupportiveLow Directive
Style 4 Low SupportiveLow Directive
Construct validity for the LBA was achieved by asking a series of
subordinates to complete the instrument in regard to their immediate
superior and then to list adjectives, strengths, and weaknesses
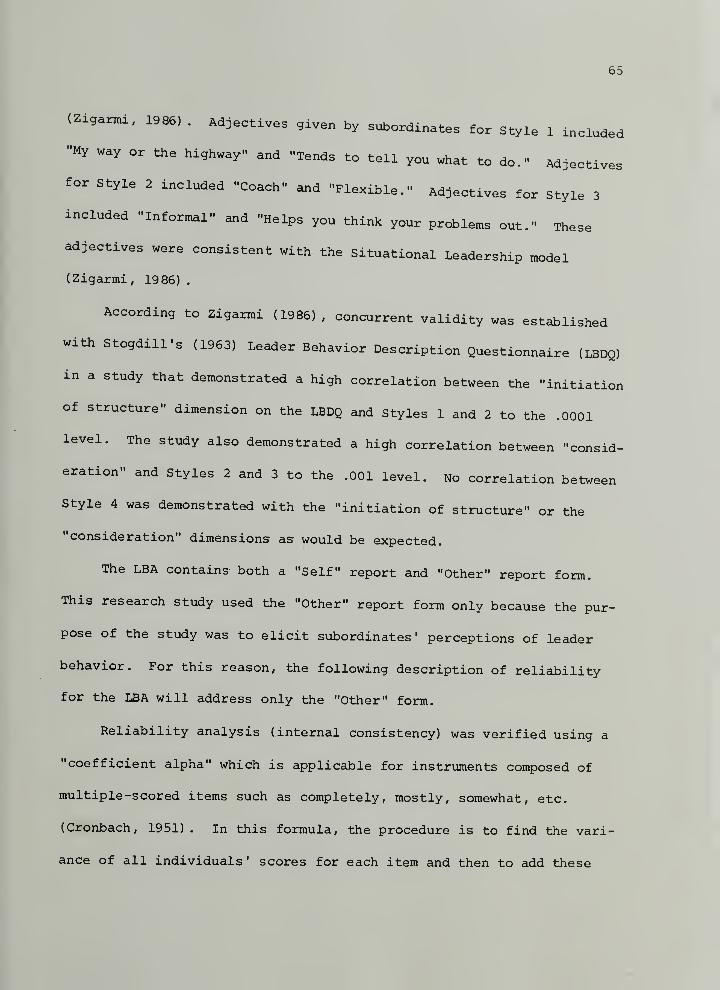
65
(Zigarmi, 1986).
Adjectives given by subordinates for Style 1 included
"My way or the highway" and "Tends to tell you what to do." Adjectives
for Style 2 included "Coach" and "Flexible." Adjectives for Style 3
included "informal" and "Helps you think your problems out." These
adjectives were consistent with the Situational Leadership model
(Zigarmi, 19 86)
.
According to Zigarmi (1986) , concurrent validity was established
with Stogdill's (1963) Leader Behavior Description Questionnaire (LBDQ)
in a study that demonstrated a high correlation between the "initiation
of structure" dimension on the LBDQ and Styles 1 and 2 to the .0001
level. The study also demonstrated a high correlation between "consid-
eration" and Styles 2 and 3 to the .001 level. No correlation between
Style 4 was demonstrated with the "initiation of structure" or the
"consideration" dimensions as would be expected.
The LBA contains both a "Self" report and "Other" report form.
This research study used the "Other" report form only because the pur-
pose of the study was to elicit subordinates' perceptions of leader
behavior. For this reason, the following description of reliability
for the LBA will address only the "Other" form.
Reliability analysis (internal consistency) was verified using a
"coefficient alpha" which is applicable for instruments composed of
multiple-scored items such as completely, mostly, somewhat, etc.
(Cronbach, 1951) . In this formula, the procedure is to find the vari-
ance of all individuals ' scores for each item and then to add these
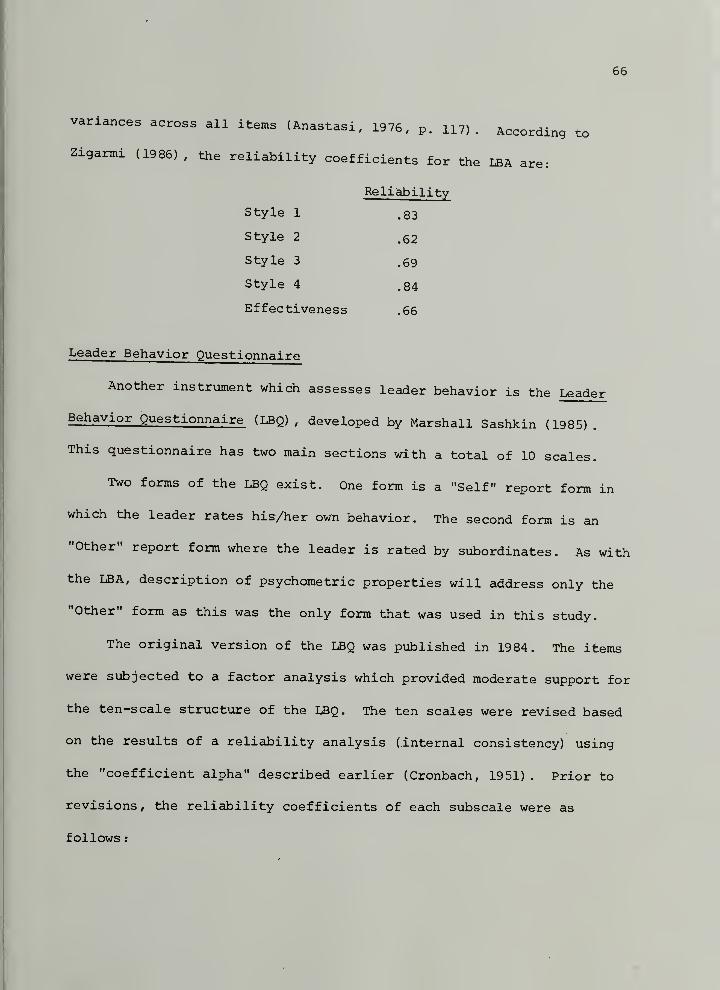
66
variances across all items (Anastasi, 1976, p. 117). According to
Zigarmi (1986), the reliability coefficients for the LBA are:
Reliability
Style 1 .83
Style 2 .62
Style 3 .69
Style 4 .84
Effectiveness .66
Leader Behavior Questionnaire
Another instrument which assesses leader behavior is the Leader
Behavior Questionnaire (LBQ) , developed by Marshall Sashkin (1985)
.
This questionnaire has two main sections with a total of 10 scales.
Two forms of the LBQ exist. One form is a "Self" report form in
which the leader rates his/her own behavior. The second form is an
"Other" report form where the leader is rated by subordinates. As with
the LBA, description of psychometric properties will address only the
"Other" form as this was the only form that was used in this study.
The original version of the LBQ was published in 1984. The items
were subjected to a factor analysis which provided moderate support for
the ten-scale structure of the LBQ. The ten scales were revised based
on the results of a reliability analysis (.internal consistency) using
the "coefficient alpha" described earlier (Cronbach, 1951) . Prior to
revisions, the reliability coefficients of each subscale were as
follows
:
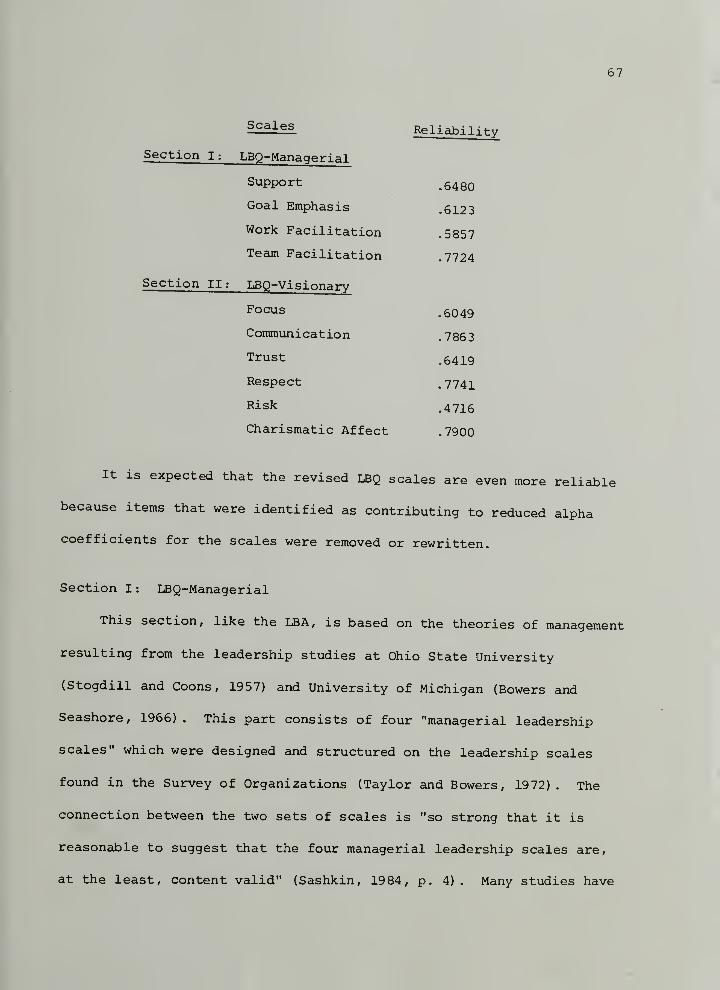
67
Scales Reliability
Section I; LBQ-Managerial
Support ,6480
Goal Emphasis .6123
Work Facilitation .5857
Team Facilitation .7724
Section II: LBQ-Visionary
Focus .6049
Communication .7853
Trust .6419
Respect .7741
Risk .4716
Charismatic Affect .7900
It is expected that the revised LBQ scales are even more reliable
because items that were identified as contributing to reduced alpha
coefficients for the scales were removed or rewritten.
Section I: LBQ-Managerial
This section, like the LBA, is based on the theories of management
resulting from the leadership studies at Ohio State University
(Stogdill and Coons, 1957) and University of Michigan (Bowers and
Seashore, 1966) . This part consists of four "managerial leadership
scales" which were designed and structured on the leadership scales
found in the Survey of Organizations (Taylor and Bowers, 1972). The
connection between the two sets of scales is "so strong that it is
reasonable to suggest that the four managerial leadership scales are,
at the least, content valid" (Sashkin, 1984, p. 4) . Many studies have
68
demonstrated the validity of the Survey of Organizations (Taylor and
Bowers, 1972) .
Supportive Management is a scale designed to measure the amount of
personal concern for and sensitivity to feelings of employees. Team
Management is a scale which measures how well the leader encourages
teamwork among employees. These two scales fall under the category of
"consideration" behavior on the part of managers. Goal Oriented Manaae-
ment is a scale which focuses on working with employees to develop
clear, high performance goals. Task-Centered Management is a scale
which focuses on the task-relevant duties of administration such as
attending to the work environment, coordination of tasks, and helping
employees to improve their skills. These last two scales fall under
the category of "initiation of structure" by managers.
Section II: LBQ-Visionary
The second section of the LBQ consists of six scales which are
based on the emerging theories of "visionary leadership." These scales
result directly from a study by Warren Bennis (1984) who identified
categories of behavior patterns and attitudes of extremely effective or
"visionary" leaders. Bennis originally described five behavior patterns
or "strategies," which he later collapsed into four (Bennis and Nanus,
1985) . The LBQ measures the original five categories and adds a sixth
scale, Follower-Centered Leadership , which measures the charismatic
effect the leader has on subordinates as a result of the behaviors
measured by the other five scales. The instrument has been reviewed by
Bennis for content validity (Sashkin, 1986)
.
69
Focused Leadership is a scale which measures how well the leader
directs his/her attention and the attention of others on key issues.
This scale corresponds with the leadership strategy of "attention
through vision" described by Bennis and Nanus C1985) . Communication
Leadership is a scale which focuses on the leader's ability to get the
meaning of a message across and corresponds with the strategy of "mean-
ing through communication" described by Bennis and Nanus (1985). Trust
Leadership is a scale which measures the leader's ability to demon-
strate trustworthiness and corresponds with the strategy of "trust
through positioning" described by Bennis and Nanus (1985) . Self-
Leadership is a scale which measures the amount of positive regard for
self and others the leader demonstrates and corresponds with the stra-
tegy of "positive self regard" described by Bennis and Nanus (1985).
Risk Leadership is a scale which measures how well the leader is will-
ing to take the necessary risks toward goal achievement. This scale
corresponds with the "Wallenda Factor" described by Bennis and Nanus
(1985). The "Wallenda Factor" and the other strategies described by
Bennis and Nanus (1985) are discussed in detail in Chapter II.
Leadership Practices Inventory
The Leadership Practices Inventory CLPI) , developed by James
Kouzes and Barry Posner (1988) , is the third instrument that was
used to assess leader behavior. This instrument was developed as
the result of a four year research project which is described in
their book , The Leadership Challenge; How to Get Extraordinary Things
Done in Organizations (1987) . The research began with analysis of
70
in-depth interviews with over 500 successful leaders from a wide range
of private and public organizations. Next they surveyed over 3,500
employees to determine what they look for in their leaders. As a
result of these interviews and surveys, a leadership model and the
first version of the LPI were developed. This leadership model is
similar to many of the emerging "visionary leadership" models in that
creation and communication of a desirable and possible vision of the
future is a major component.
The LPI consists of five scales. Challenging the Process is a
scale that measures ability to search for opportunities and to encour-
age innovation and experimentation. Inspiring a Shared Vision is a
scale that measures one's ability to envision the future and to enroll
°^hers. Enabling Others to Act is a scale that measures ability to
strengthen others and to foster collaboration. Modeling the Way
measures the leader's ability to act as an example and to establish
clear milestones of progress. Encouraging the Heart is a scale that
measures the leader's willingness to celebrate accomplishments and to
recognize contributions
.
The LPI has been administered to nearly 2,500 people (including
respondents in Australia, Great Britain, Germany, and Holland) . A
factor analysis confirms the five scales.
Reliability analysis (internal consistency) was obtained using a
"coefficient alpha," the same method used for the LBA and the LBQ
described earlier (Cronbach, 1951) . The reliability coefficients of
each scale are as follows
:
71
Reliability
Challenging the Process .75
Inspiring a Shared Vision .84
Enabling Others to Act .80
Modeling the Way 78
Encouraging the Heart .33
According to Barry Posner (1986) the LPI has demonstrated predic-
tive validity as it has been able to successfully discriminate between
high and low performing managers as rated by senior management. Fur-
thermore, Posner (19 86) states, "While the sample of females is rela-
tively small, we have found only a slight tendency for one scale
(Encouraging the Heart) to show a significant difference between female
and male respondents. This issue is being investigated in a disserta-
tion underway at Western Michigan University."
Research Design
Managers in the large business, who participated in the leadership
development program described earlier, were given eight packets two
weeks before the seminar began. Each packet contained the instruments
described above, including an additional page of demographic informa-
tion questions and request for permission to use the results in the
research study. The managers were requested to give a packet to four
or five immediate subordinates, two peers, and their immediate super-
ior. These respondents were requested to complete the questionnaires
in relation to their immediate superior and/or their perceptions of
72
the work unit. Respondents were also asked the following demographic
data:
Length of time he/she has been employed in the work unit
Length of time current supervisor has been supervisinghim/her ^
Age
Sex
Ethnic background/race
Educational background
Before granting permission to conduct the study, the business re-
quired a guarantee that no more than a reasonable amount of time would
be needed to complete the questionnaires. All respondents were given
the LBA and PAVE to complete. In a random assignment, half were given
the LPI and the other half the LBQ. Therefore each respondent com-
pleted only three questionnaires, thus minimizing the amount of time
needed to complete the questionnaires.
Respondents who completed the questionnaires were given a self-
addressed, stamped envelope in which to' mail them directly to the
consulting firm that provided the training program. The researcher
prepared a general profile review for each manager which was used as
part of the training program. Respondents were informed before they
completed the questionnaires that this review would not include names
or identifying information of respondents and that the managers would
not see copies of the completed instruments. In fact, the researcher
did not know the names of the respondents. These measures were taken
to help to insure anonymity of respondents. In further compliance with
73
the rights of human subjects, respondents were asked to grant permis-
sion to use the information in the research study.
Data Analysis and Statistics
For Hypotheses I and II, a Pearson Product Moment Coefficient of
correlation was performed. These hypotheses seek to determine to what
extent workers' perceptions of leader behavior as assessed by ratings
on one scale vary with workers' perceptions of the peak performance
level of the work unit as assessed by ratings on one scale. Specific-
ally, the first two hypotheses were assessed as follows.
Hypothesis I
There will be a positive correlation between workers' ratings of
their perceptions of their leader's behavior on a scale based on the
traditional managerial perspective with the workers' reported percep-
tions of the peak performance level of the work unit.
This hypothesis was tested as follows
:
1. The LBA was used for classification of traditional managerialbehavior. The PAVE was used to determine workers' percep-tions of the peak performance level of the work unit.
2. The LBQ-Managerial was used for classification of traditionalmanagerial behavior. The PAVE was used to determine workers'perceptions of the peak performance level of the work unit.
Hypothesis II
There will be a positive correlation between workers ' ratings of
their perceptions of their leader's behavior on a scale based on the
74
visionary leadership perspective with the workers' reported perceptionsof the peak performance level of the work unit.
This hypothesis was tested as follows:
1. The LPI was used for classification of visionary leadershipbehavior. The PAVE was used to determine workSs ' percep-tions of the peak performance level of the work unit.
^'T.t^'^^K''^^t°u^''^
""^^ ^^^^ classification of visionaryleadership behavior. The PAVE was used to determine workers'perceptions of the peak performance level of the work unit.
Hypothesis III
For Hypothesis III, a one-way analysis of variance was performed,
with subordinates' perceptions of leader behavior as the independent
variable and subordinates' perceptions of the peak performance level of
the work unit as the dependent variable. This analysis investigated
mean differences between the perceptions of subordinates whose leaders
fell into each of the four leadership categories described below.
Category I High Rated Traditional ManagerHigh Rated Visionary Leader
Category II Low Rated Traditional ManagerHigh Rated Visionary Leader
Category III High Rated Traditional ManagerLow Rated Visionary Leader
Category IV Low Rated Traditional ManagerLow Rated Visionary Leader
Hypothesis III states: When workers rate their leaders as high on
both traditional managerial and on visionary leadership scales, the
workers' reported perceptions of the peak performance level of the work
unit will be significantly higher than when the workers rate their
75
leaders as high on only the traditional managerial scale or only the
visionary leadership scale.
Subhypothesis Ilia: When workers rate their leaders as highon both traditional managerial and on visionary leadershipscales (category I), the workers' reported perceptionrof thepeak performance level of the work unit will be high.
Subhypothesis Illb: When workers rate their leaders as highon a visionary leadership scale and low on a traditionalmanagerial scale (Category li) , the workers' reported per-ceptions of the peak performance level of the work unit willbe in the average range.
Subhypothesis IIIc: When workers rate their leaders as highon a traditional managerial scale and low on a visionaryleadership scale (Category III), the workers' reported per-ceptions of the peak performance level of the work unit willbe in the average range.
Subhypothesis Illd: When workers rate their leaders as lowon both traditional managerial and on visionary leadershipscales (Category IV) , the workers' reported perceptions ofthe peak performance level of the work unit will be low.
This hypothesis was tested as follows:
1. The LPI was for classification of visionary leadership behav-ior. The LBA was used for classification of traditionalmanagerial behavior. The PAVE was used to assess workers'perceptions of peak performance of the work unit.
2. The LBQ-Visionary was used for classification of visionaryleadership behavior. The LBA was used for classification oftraditional managerial behavior. The PAVE was used to assessworkers' perceptions of peak performance of the work unit.
3. The LBQ-Visionary was used for classification of visionaryleadership behavior. The LBQ-Managerial Scale was used forclassification of traditional managerial behavior. The PAVEwas used to assess workers ' perceptions of peak performanceof the work unit.
Managers were grouped as follows: high leadership behavior scores
were considered those that fell into the upper third of the scores of
all leaders who were rated by subordinates of an instrument. Low
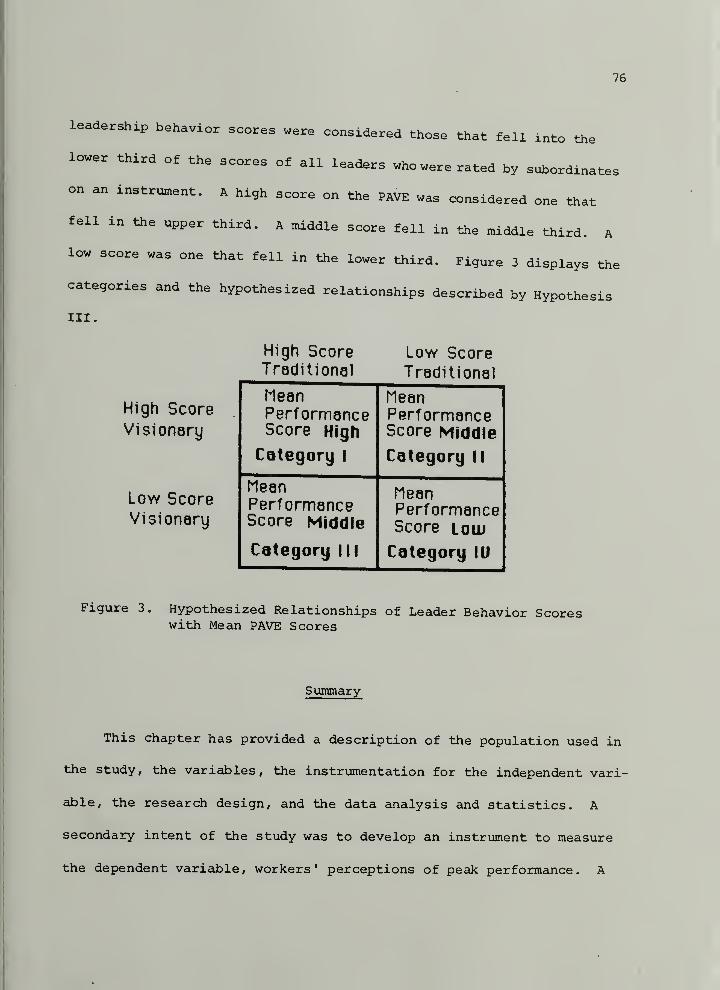
76
leadership behavior scores were considered those that fell into the
lower third of the scores of all leaders who were rated by subordinates
on an instrument. A high score on the PAVE was considered one that
fell in the upper third. A middle score fell in the middle third. A
low score was one that fell in the lower third. Figure 3 displays the
categories and the hypothesized relationships described by Hypothesis
III.
High Score Low ScoreTraditional Traditional
High Score
Visionary
Low Score
Visionary
MeanPerformanceScore High
Category 1
MeanPerformanceScore Middle
Category II
MeanPerformanceScore Middle
Category III
MeanPerformanceScore Loin
Category lU
Figure 3. Hypothesized Relationships of Leader Behavior Scoreswith Mean PAVE Scores
Summary
This chapter has provided a description of the population used in
the study, the variables, the instrumentation for the independent vari-
able, the research design, and the data analysis and statistics. A
secondary intent of the study was to develop an instrument to measure
the dependent variable, workers' perceptions of peak performance. A
77
description of the development of this instrument and the statistical
analyses is provided in Chapter IV.
CHAPTER IV
DEVELOPMENT AND VALIDATION OF THE
PAVE:
EXCELLENT ORGANIZATIONAL PRACTICES INDEX
PAVE: Excellent Organizational Practices Tnd.v was used to
measure the dependent variable, perceptions of characteristics typical
of peak performing organizations, in this research study. This instru-
ment was developed for use in this study because no single instrument
could be found that specifically measures this aspect of organizational
functioning. For this reason, development of the instrument became a
secondary intent of the study and is reported separately in this chap-
ter. What follows is a description of the development of the PAVE
including the results of the statistical analyses and psychometric
properties. The analyses included tests of reliability, factor analy-
sis, and interscale correlations.
Instrument Development
First, a thorough review of the current literature was conducted
to determine what authors say workers are feeling and experiencing in
excellent organizations. See Chapter II. In summary, authors (e.g.,
Kiefer and Senge, 1984; Stroh, 1984; Peters and Waterman, 1984; Berlew,
1974) described the presence of a passionate feeling tone including
commitment, satisfaction, motivation, and empowerment. They also de-
scribed a state of goal alignment (an alignment of members of the organi-
zation around a common vision). Finally, these authors assert that mem-
bers of the organization perceive it to be a peak performing organization.
79
Next an extensive search was conducted to find an instrument to
measure these characteristics. Instruments were found that measure
some Of these characteristics. For example, the Job Descriptive Index
(Smith, Kendall, and Hulin, 1969) and the Minnesota Satisfaction Ques-
tionnaire (Weiss et al., 1967) measure job satisfaction. The Organi-
zational Commitment Questionnaire measures commitment (Mowday, steers
and porter, 1979) . The Organizational Effectiveness Questionnaire
measures perceived effectiveness (Mott, 1972) . other questionnaires
measure more generalized aspects of organizational climate such as the
Survey of Organizations (Likert, 1980); Profile of Organizational
Practices (Zigarmi, 1982); study of Schooling Questionnaire (IDEA,
Inc., 1978); and Organizational Beliefs Questionnaire (Sashkin, 1984).
There was no single questionnaire found which measured all of the above
characteristics. All of the items in all of the questionnaires were
analyzed for relevance and a list of questions was developed.
The relevant questions from the above questionnaires were grouped
into the three general areas suggested by the literature: (1) strong
positive tone, (2) clarity and alignment of purpose and goals, and
(3) perceived effectiveness (performance)
.
These general areas were broken down more specifically and three
to seven questions were developed for each area. In order to achieve
some degree of concurrent validity, when appropriate questions existed
from the list of relevant questions, these questions were used as the
base to develop the questions for the PAVE. Table 9 details the spe-
cific areas.
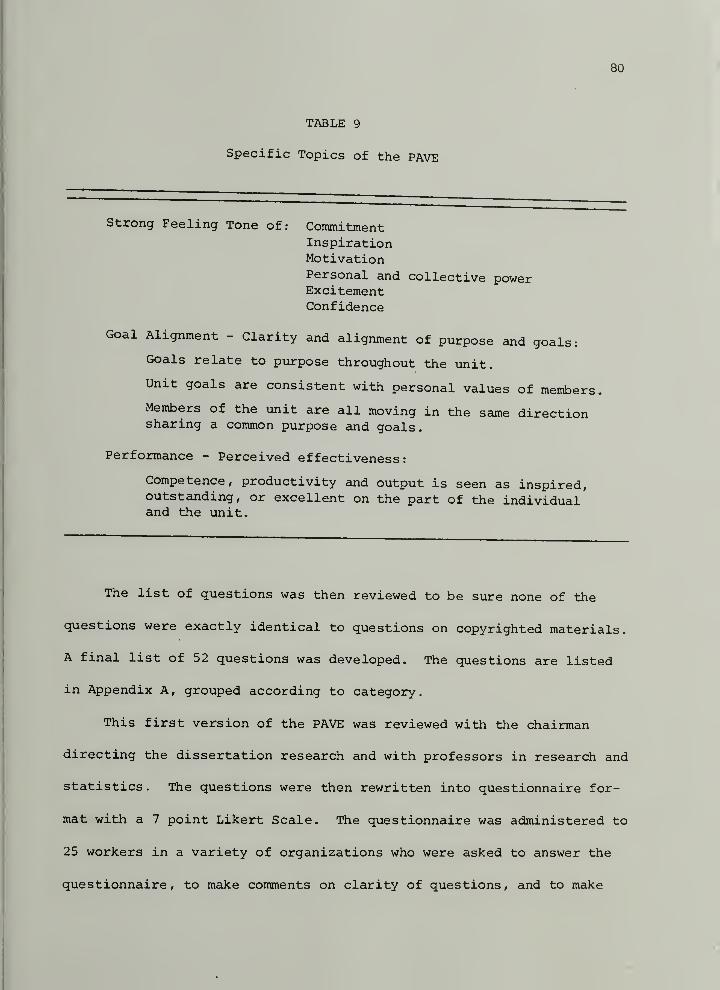
80
TABLE 9
Specific Topics of the PAVE
Strong Feeling Tone of: Coiranitment
InspirationMotivationPersonal and collective powerExcitementConfidence
Goal Alignment - Clarity and alignment of purpose and goals:
Goals relate to purpose throughout the unit.
Unit goals are consistent with personal values of member;
Members of the unit are all moving in the same directionsharing a common purpose and goals.
Performance - Perceived effectiveness:
Competence, productivity and output is seen as inspired,outstanding, or excellent on the part of the individualand the unit.
The list of questions was then reviewed to be sure none of the
questions were exactly identical to questions on copyrighted materials.
A final list of 52 questions was developed. The questions are listed
in Appendix A, grouped according to category.
This first version of the PAVE was reviewed with the chairman
directing the dissertation research and with professors in research and
statistics. The questions were then rewritten into questionnaire for-
mat with a 7 point Likert Scale. The questionnaire was administered to
25 workers in a variety of organizations who were asked to answer the
questionnaire, to make comments on clarity of questions, and to make
81
any other comments or suggestions. The results of this pilot were
analyzed and a modified version consisting of 37 questions was pro-
duced
.
The second version of the PAVE was sent to four nationally-known
and respected Human Resource Development (HRD) specialists who had
expertise in the content of this questionnaire and expertise in ques-
tionnaire development. These people were asked to review the question-
naire and to make suggestions. The cover letter that was sent to the
HRD specialists can be found in Appendix A. Based on the feedback from
these people, two questions were slightly modified and three questions
were added to form a third version 40 question version of the PAVE.
To further obtain construct validity, five people were asked to
rearrange the questions into the original categories listed in Table 9.
The form used is included in Appendix A.
Results of Statistical Analyses
The third, 40-item, version of the PAVE was administered within
the large private-sector company that provided the setting for the
research study. A total of 473 people completed the PAVE. Respondents
were obtained by requesting each of the 129 managers in the company to
have five subordinates, two associates, and one superior complete the
PAVE anonymously. The questionnaires were mailed directly to the
researcher by the respondents to further insure anonymity. The PAVE
was completed, all 40 items were answered, by 473 of the 508 respon-
dents who returned questionnaires. Of those who completed the
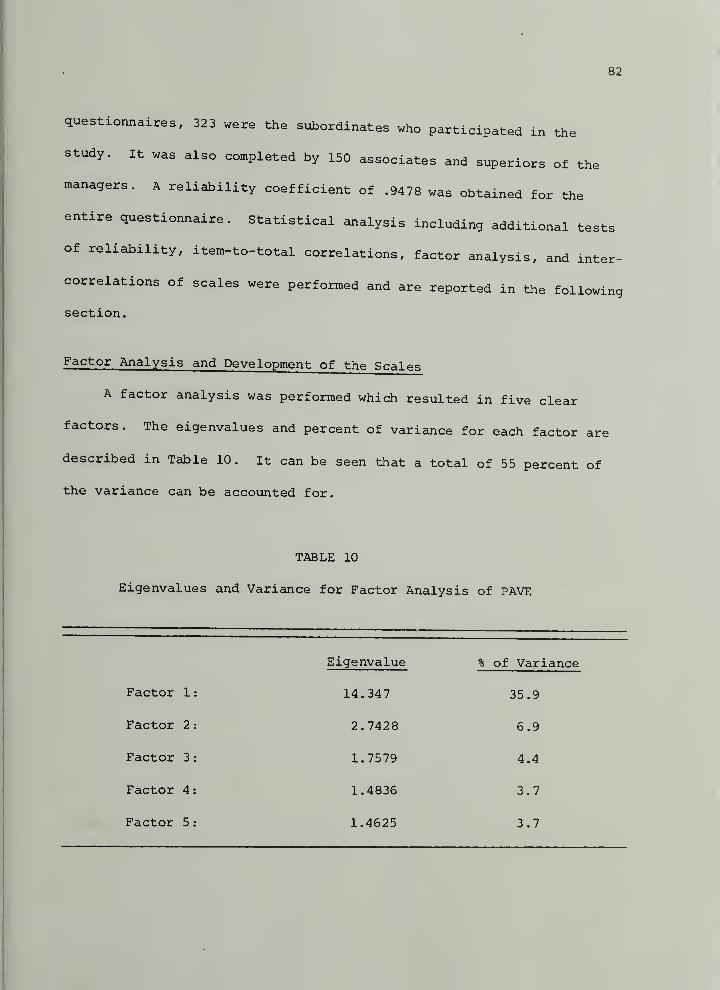
82
questionnaires, 323 were the subordinates who participated in the
study. It was also completed by 150 associates and superiors of the
managers. A reliability coefficient of .9478 was obtained for the
entire questionnaire. Statistical analysis including additional tests
of reliability, item-to-total correlations, factor analysis, and inter-
correlations of scales were performed and are reported in the following
section.
Factor Analysis and Development of the Scales
A factor analysis was performed which resulted in five clear
factors. The eigenvalues and percent of variance for each factor are
described in Table 10. It can be seen that a total of 55 percent of
the variance can be accounted for.
TABLE 10
Eigenvalues and Variance for Factor Analysis of PAVE
Eigenvalue % of Variance
Factor 1: 14.347 35.9
Factor 2: 2.7428 6.9
Factor 3: 1.7579 4.4
Factor 4: 1.4836 3.7
Factor 5: 1.4625 3.7
83
Table 11 provides the factor loadings of over .30. The six ques-
tions for Factors 2-5 that loaded most highly after rotation were
chosen to comprise each scale. When an item loaded over .30 in more
than one factor, the decision to which factor to assign it was deter-
mined by whether it was one of the six highest loading items for that
factor. Because Factor 1 loaded with almost twice as many questions as
the other factors, twelve questions were chosen. These twelve ques-
tions seemed to group together in content into two subscales; there-
fore, statistical data was collected and analyses were run for Factor 1
both as a 12 question scale and as two 6 question subscales. Four
items did not load on any of these five factors and were dropped from
the PAVE.
The questions in each factor were analyzed to see if and how they
related to the categories characteristic of peak performing organiza-
tions from which the questions, were originally developed. The factors
corresponded with the following categories
:
FACTOR 1: PERFORMANCE
FACTOR 2 : FEELING TONE
FACTOR 3: ALIGNMENT
FACTOR 4: FEELING TONE (Motivation)
FACTOR 5: FEELING TONE (Empowerment)
84
TABLE 11
Factor Loadings of Over .30 for PAVE
Item^ Factor 1 Factor 2 Factor 3 Factor 4
10 .70*
14 .75*
18 .35*
21 .67*
28 .73*
29 .43*
2 .44*
8 .50*
16 .45*
20 .42* 3435 .59* 343 7 . 46 *
12 .56*
17 .65*19 .31 62*38 .50*39 .31 47*.
40 .75*
3
23
25
Factor 5
.42
.31
1 .36 56*
.76*4 .71*5 .43 43*7 .35 49*9
. 59 *
22 .43 43*.54*
.44*31 .61*33 .53*
36 . 31_ . 72 *
11 .48*15 .46 46*24 .41 48*27 .38 30 39*30 .31*34 .33 ,51*
*Items chosen
85
The factors were named as follows:
FACTOR 1: PERFORMANCE
FACTOR 2: INSPIRATION
FACTOR 3: ALIGNMENT
FACTOR 4: COMMITMENT
FACTOR 5: EMPOWERMENT
Factor 1 subscales were named as follows:
PERFORMANCE-PRODUCTIVITY
PERFORMANCE-TEAM EFFECTIVENESS
Description and Questions for Each PAVE Scale
Factor 1 is divided into two subscales. The first is called the
Performance-Productivity Subscale . This is one of two subscales that
measures perceived effectiveness of the work unit. In peak performing
organizations, productivity or output is seen as outstanding, inspired,
or excellent on the part of the individuals and for the unit as a
whole. These questions group around task accomplishments. Questions
on this subscale included:
14. High standards of performance are maintained here.
10. The overall effectiveness of this unit is excellent.
18. My superior is excellent in meeting the requirementsof the organization.
21. Compared to other units I have known, the effectivenessof this unit is excellent.
28. This unit produces top quality/superior work.
29 . The practices my superior uses are the right ones forgetting the unit's job done.
86
The second subscale in Factor 1 is called the Performance-Team
Effectiveness Subscale. This subscale also measures perceived effec-
tiveness of the work unit but from the point of view of team processes
instead of output. Questions in this subscale include:
^'herr
^ ^^^li^g °f cohesiveness/sense of community
8. There is a high degree of confidence and trust amongmembers of this unit.
37. People in this unit coordinate their efforts whennecessary.
16. My values and the values of the unit are very similar.
20. People's goals in this unit are compatible.
35. People in this unit take pride and satisfaction intheir work.
Factor 2 is called the Inspiration Scale . This scale measured the
presence of a strong feeling-tone on the part of members of the organi-
zation. In peak performing organizations, members report a strong
feeling-tone including sense of accomplishment, inspired performance,
pride in the work, personal growth, optimism, and excitement. Ques-
tions on this scale include
:
12. Working here inspires the very best of me in the way of
job performance.
17. I have strong feelings of accomplishment related to ourwork
.
19. I am proud to be a member of this unit,
38. I am continually learning and seeking new ideas as theyrelate to the work of this unit.
40 . I am excited about the work we are doing here
.
39. I feel we can overcome almost any obstacle here.
87
Factor 3 is called the Alignment Scale. This scale measures the
concept Of goal alignment, the amount of clarity and alignment of pur-
pose and goals, m peak performing organizations, goals are perceived
as relating to the purpose of the organization throughout the organiza-
tion. Also, unit and organizational goals are seen as consistent with
the personal values of the members. Furthermore, members of the
organization see themselves as all moving in the same direction, shar-
ing a common purpose and goals.
1. There is a common mission/sense of purpose for thisunit.
3. I can clearly describe the major purpose of this unit.
4. I am clear about the goals and priorities for this unit.
5. People throughout the unit are committed to a commonmission or purpose.
7. Goals and priorities are related to the mission of thisunit.
9. I am clear about how my job responsibilities relate tothe mission of this unit.
Factor 4 is called the Commitment Scale . This is another feeling-
tone scale. In peak performing organizations members report strong
feelings of commitment to the goals of the organization and to the work
that needs to be done in order to meet the goals.
22. The goals of this unit are important to me.
23. When my work requires working independently, I do itwell
.
25. I am willing to put in a great deal of extra effortbeyond what is normally expected in a job.
31. I am committed to helping the unit meet its goals.
88
33. I am committed to completing work even when it isfrustrating.
36. I am determined to meet whatever challenges arise here.
Factor 5 is called the Empowerment Scale. This scale measures how
much members feel a sense of personal and collective power, how much
they feel in control of their own destinies and how much they feel in
charge of determining what they need to do to get the work done, mpeak performing organizations members report that they feel able to
act freely on their own accord and to do what they believe is correct.
11. In order to meet job-related expectations, I have to dothings that seem wrong to me.
15. People in this unit give up when the work becomesfrustrating.
24. I feel powerless here.
27. Morale is rather low here.
30. I have the freedom I need to use my own judgment.
34. I am confused about what people expect me to do on my
job
.
Tests of Reliability
The questionnaires of the 473 respondents who answered all ques-
tions were analyzed. The coefficient alpha statistic was performed for
the entire PAVE and for each scale and subscale to test internal con-
sistency. The reliability coefficient for the entire 36-question PAVE
was .9458. Reliability coefficients are presented in Table 12.
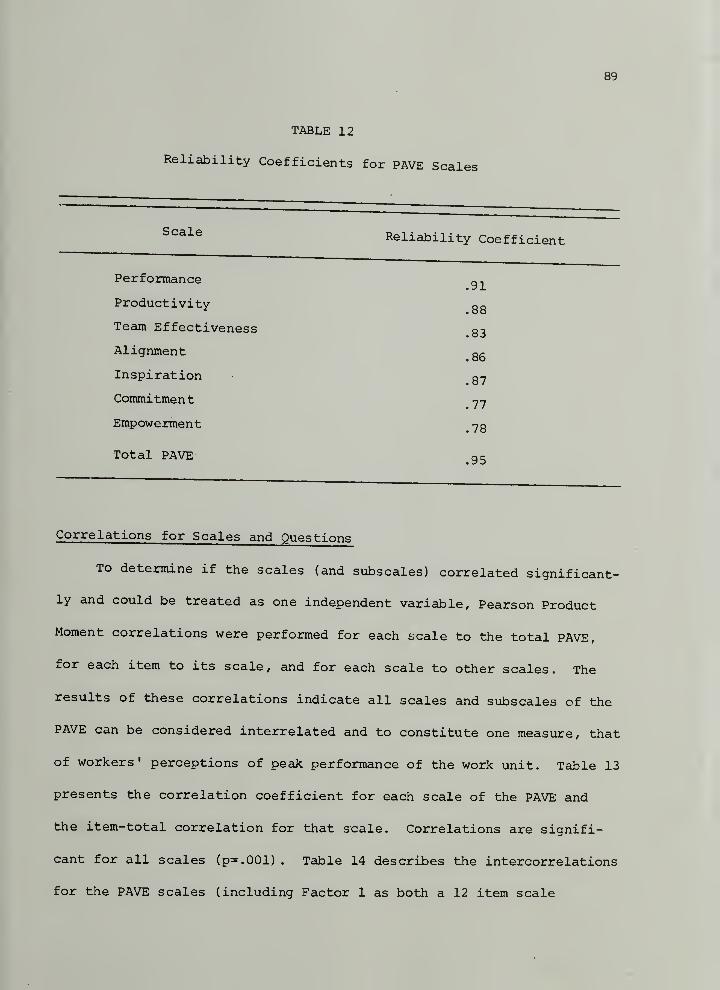
89
TABLE 12
Reliability Coefficients for PAVE Seal
Scale
Performance
Productivity
Team Effectiveness
Alignment
Inspiration
Commitment
Empowerment
Total PAVE
Reliability Coefficient
.91
.88
.83
.86
.87
.77
.78
.95
Correlations for Scales and Questions
To determine if the scales (and subscales) correlated significant-
ly and could be treated as one independent variable, Pearson Product
Moment correlations were performed for each scale to the total PAVE,
for each item to its scale, and for each scale to other scales. The
results of these correlations indicate all scales and subscales of the
PAVE can be considered interrelated and to constitute one measure, that
of workers' perceptions of peak performance of the work unit. Table 13
presents the correlation coefficient for each scale of the PAVE and
the item-total correlation for that scale. Correlations are signifi-
cant for all scales (p=.001) . Table 14 describes the intercorrelations
for the PAVE scales (including Factor 1 as both a 12 item scale
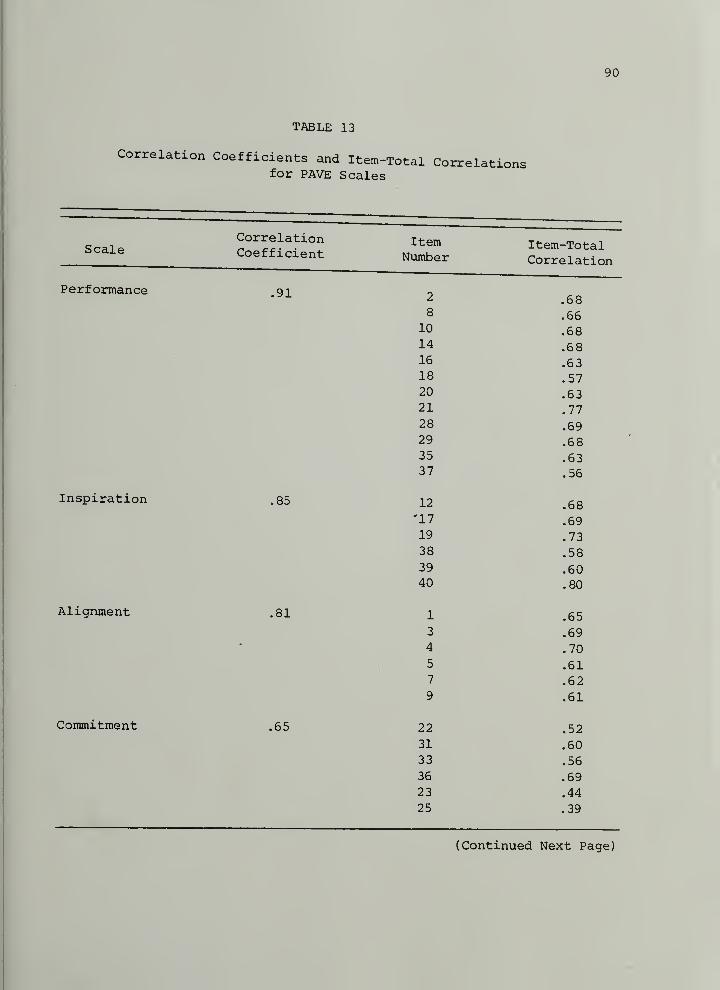
90
TABLE 13
correlation Coefficients and Item-Total Correlationsfor PAVE Scales
ScaleCorrelationCoefficient
ItemNumber
Item-TotalCorrelation
Performance 91 2 .68QO .66
.681 A
.68xo .6318
. 5720 .63
. 77
.69
.68
.6337
. JO
Inspiration .85 12 .68
. 6919 "7 "3
. / J
38 R Q
. bU40
. CSU
Alignment 81 J. .55
3 .69
4 .70
5 .617 .62
9 .61
Commitment .65 22 .52
31 .60
33 .56
36 .69
23 .44
25 .39
(Continued Next Page)
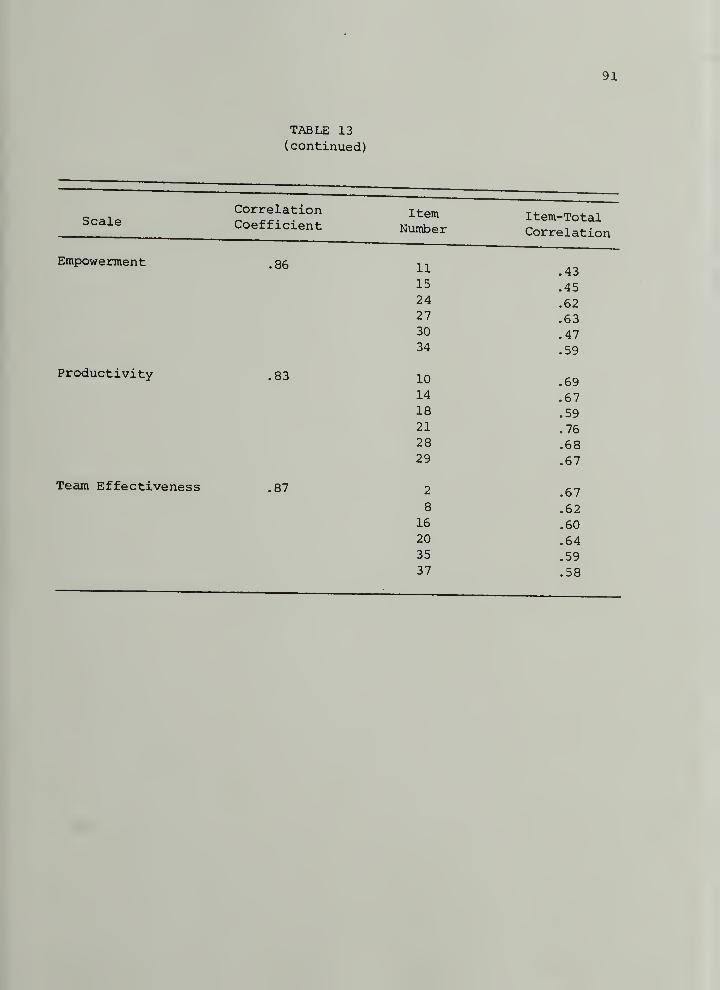
91
TABLE 13
(continued)
ScaleCorrelationCoefficient
ItemNumber
Item-TotalCorrelation
Empowerment .86
Productivity .83
Team Effectiveness .87
11
15
2427
30
34
10
14
1821
2829
2
8
16
20
35
37
.43
.45
.62
.63
.47
.59
.69
.67
.59
.76
.68
.67
.67
.62
.60
.64
.59
.58
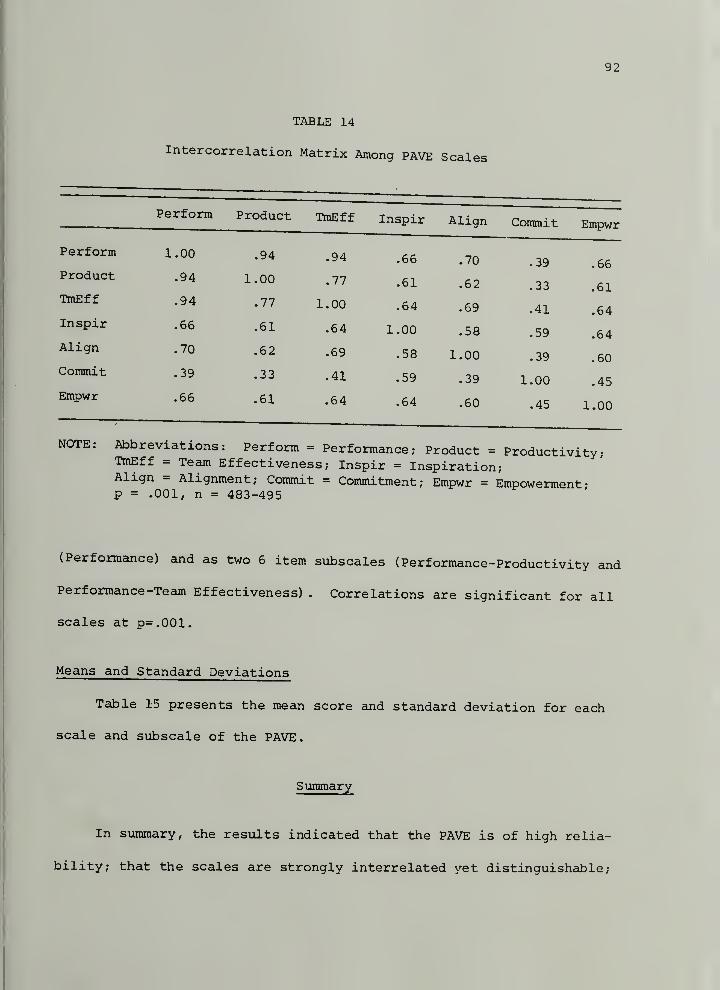
92
TABLE 14
Intercorrelation Matrix Among PAVE Seal
Perform Product TmEff Inspir Align Commit Empwr
Perform 1.00 .94 .94 .66 .70 .39 .66Product .94 1.00 .77 .61 .62 .33 .61TmEff .94 .77 1.00 .64 .69 .41 .64Inspir .66 .61 .64 1.00 .58 .59 .64Align .70 .62 .69 .58 1.00 .39 .60Commit .39 .33 .41 .59 .39 1.00 .45Empwr .66 .61 .64 .64 .60 .45 1.00
Abbreviations: Perform = Performance; Product = Productivity;TmEff = Team Effectiveness; Inspir = Inspiration;Align = Alignment; Commit = Commitment; Empwr = Empowerment-p = .001, n = 483-495
(Performance) and as two 6 item subscales (Performance-Productivity and
Performance -Team Effectiveness) . Correlations are significant for all
scales at p=.001.
Means and Standard Deviations
Table 15 presents the mean score and standard deviation for each
scale and subscale of the PAVE.
Summary
In summary, the results indicated that the PAVE is of high relia-
bility; that the scales are strongly interrelated yet distinguishable;
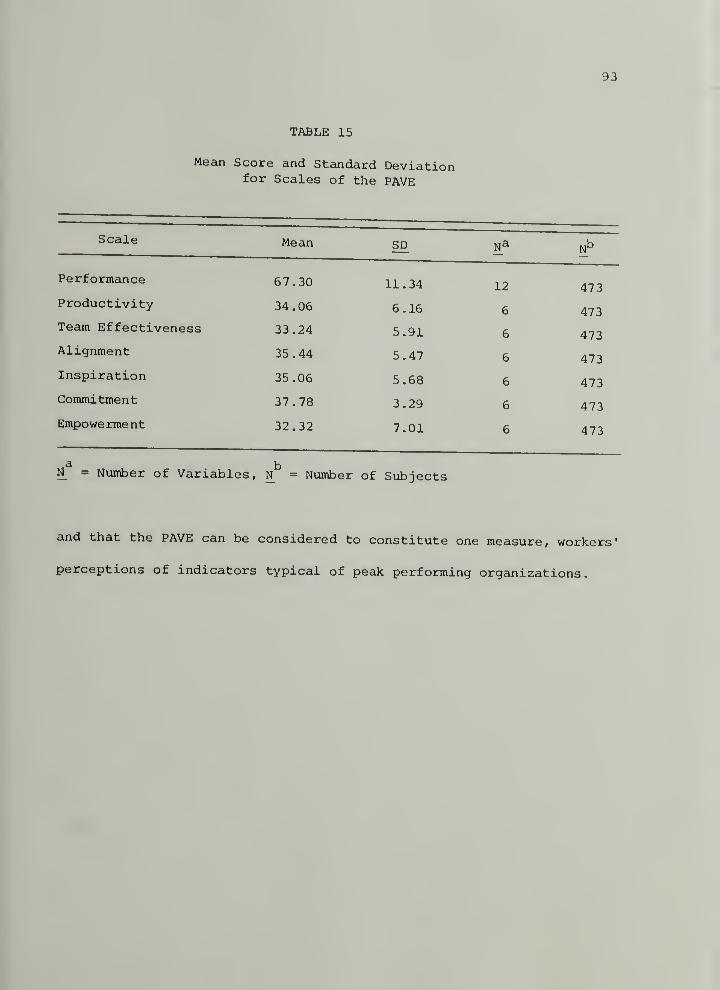
93
TABLE 15
Mean Score and Standard Deviationfor Scales of the PAVE
Scale Mean SD N^
Performance 67.30 11.34 12 473Productivity 34 .06 6.16 6 473Tecim Effectiveness 33.24 5.91 6 473Alignment 35.44 5.47 6 473
Inspiration 35.06 5.68 6 473
Commitment 37.78 3.29 6 473
Empowerment 32.32 7.01 6 473
aN = Number of Variables,
bN = Number of Subjects
and that the PAVE can be considered to constitute one measure, workers'
perceptions of indicators typical of peak performing organizations.
CHAPTER V
RESULTS
This chapter discusses the results of the study. The major intent
of the study was to explore the relationship between leadership behav-
iors and specific organizational variables typical of peak performing
organizations according to the perceptions of subordinates within the
organization.
The first section presents the demographic information describing
the organization and the subjects of the study: the subordinates and
the managers they rated.
The second section reports results that explore the relationship
between traditional managerial skills, as measured by the LBA and the
LBQ-Managerial, and peak performance level of the manager's work unit,
as measured by the PAVE, from the subordinates' perspective. Data was
analyzed using a Pearson Product Moment correlation. Results are
reported first for all managers within the organization. Then results
are reported for managers according to their level within the organiza-
tion: senior level, middle level, and first line.
The third section provides results that explore the relationship
between visionary leadership behaviors, as measured by the LBQ-
Visionary and the LPI , and peak performance level of the manager's work
unit, as measured by the PAVE, from the subordinates' perspective.
Data was analyzed using a Pearson Product Moment correlation. Results
are reported first for all managers within the organization. Then
95
results are reported for managers according to their level within the
organization: senior level, middle level, and first line.
The fourth section provides results that explore the relationship
between the possible combinations of high-rated and low-rated, manager-
ial and visionary leadership with the workers' perceptions of the peak
performance level of the manager's work unit. This section provides a
look at the data used as input to the data analysis, the test of
assumptions required for the analysis of variance when using a multiple
comparison test, and the results of the analyses of variance and the
multiple comparison tests.
Description of Subjects
The organization that provided the setting for this research study
is a large private-sector business that is a leading independent lessor
and remarketer of IBM computer equipment in the world. This business
leases mainframe computers, computer equipment and telecommunication
equipment, finances new equipment, and remarkets a customer's existing
system. The headquarters are located in the midwest.
Table 16 illustrates the demographic data for the subjects. A
total of 340 subordinates rated their immediate superior (manager) and
their work unit, using a questionnaire containing the LBA, LPI or LBQ,
and the PAVE. They completed a section giving their demographic infor-
mation on the questionnaire. Of those who responded to these questions,
the majority were Caucasian (93.5%) , female (57.6%) , with ages 26
through 35 (44.7%), having attended some college (43.2%). The number
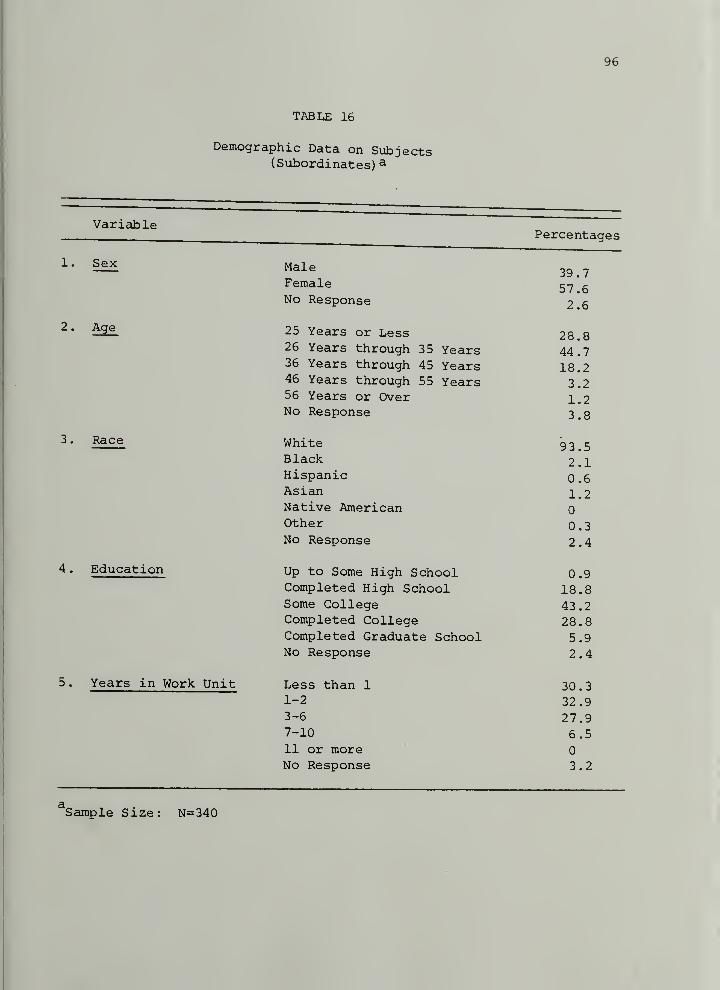
96
TABLE 16
Demographic Data on Subjects(Subordinates) ^
VariablePercentages
X . Sex Male 39.7Female 57.6No Response 2.6
2.
.
Age 25 Years or Less 28.8itidiTs cnrougn Jb Years 44 .7
36 Years through 45 Years 18.246 Years through 55 Years 3.256 Years or Over 1.2No Response 3.8
3 . Race White 93.5Black
2. . 1Hispanic 0.6Asian 1.2Native American 0Other 0.3No Response 2.4
4. Education Up to Some High School 0.9Completed High School 18.8Some College 43.2Completed College 28.8Completed Graduate School 5.9No Response 2.4
5. Years in Work Unit Less than 1 30.31-2 32.93-6 27.97-10 6.511 or more 0
No Response 3.2
Sample Size: N=340
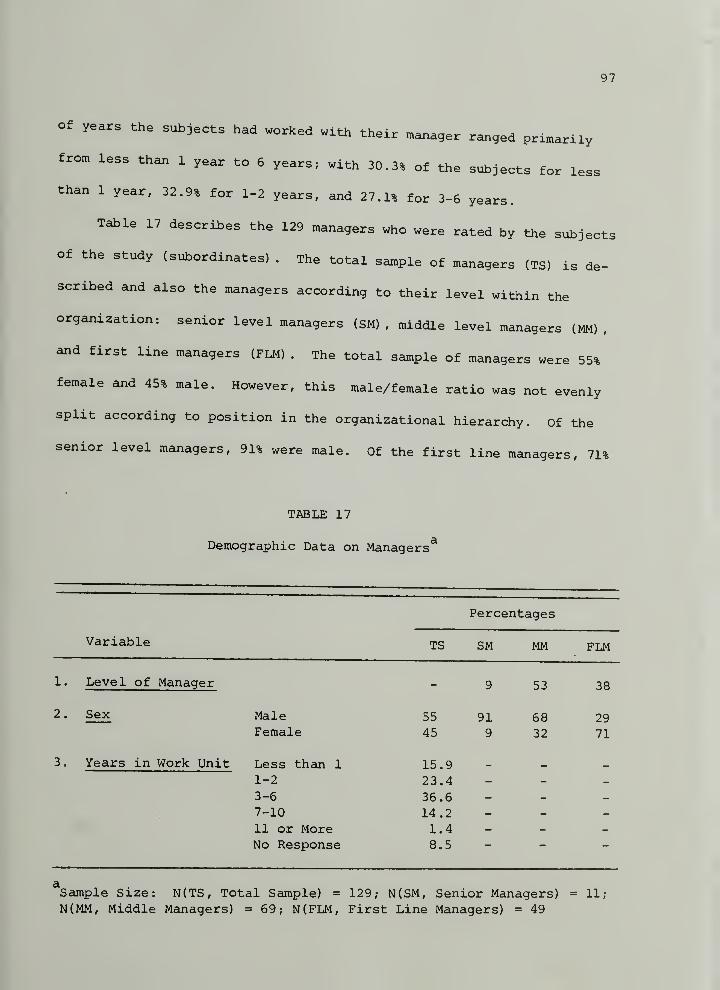
97
Of years the subjects had worked with their manager ranged prixnarily
from less than 1 year to 6 years; with 30.3% of the subjects for less
than 1 year, 32.9% for 1-2 years, and 27.1% for 3-6 years.
Table 17 describes the 129 managers who were rated by the subjects
of the study (subordinates). The total sample of managers (TS) is de-
scribed and also the managers according to their level within the
organization: senior level managers (SM) , middle level managers (MM),
and first line managers (FLM) . The total sample of managers were 55%
female and 45% male. However, this male/female ratio was not evenly
split according to position in the organizational hierarchy. Of the
senior level managers, 91% were male. Of the first line managers, 71%
TABLE 17
aDemographic Data on Managers
Variable TS
Percentages
SM MM FLM
1. Level of Manager 9 53 38
2 . Sex Male 55 91 68 29Female 45 9 32 71
3. Years in Work Unit Less than 1 15.91-2 23.43-6 36.67-10 14.211 or More 1.4No Response 8.5
aSample Size: N(TS, Total Sample) = 129; N(SM, Senior Managers) = 11;
N(MM, Middle Managers) = 69; N(FLM, First Line Managers) = 49
98
were female. The majority of managers (53%) were middle managers. The
number of years the managers had been responsible for the work unit
ranged primarily from less than 1 year to 6 years; with 15.9% of the
managers for less than 1 year, 23.4% for 1-2 years, and 36.6% for 3-6
years.
Workers ' Perceptions of the Relationship Between Tradi^inn.^Managerial Skills and Peak Performance Level of the Work Unit
The first hypothesis was stated as follows: There will be a posi-
tive correlation between workers' ratings of their perceptions of their
leader's behavior on a scale based on the traditional managerial behav-
ior perspective with ratings on a scale assessing workers' perceptions
of the peak performance level of work unit.
This hypothesis was examined using two separate instruments to
assess workers' perceptions of their leader's traditional managerial
skills, the Leader Behavior Analysis (LBA) and the Leader Behavior
Questionnaire-Managerial (LBQ-M) . The "Other" report form was used for
both instruments; this form assesses others' perceptions as opposed to
self perceptions. Res\iLts will be reported first for the LBA and then
for the LBQ-M. These instruments were each correlated with the PAVE:
Excellent Organizational Practices Index which was used to measure
workers' perceptions of the performance level of the work unit.
Leader Behavior Analysis
Table 18 describes the results of the Pearson Product Moment
correlations for the LBA Effectiveness Score with the PAVE total score
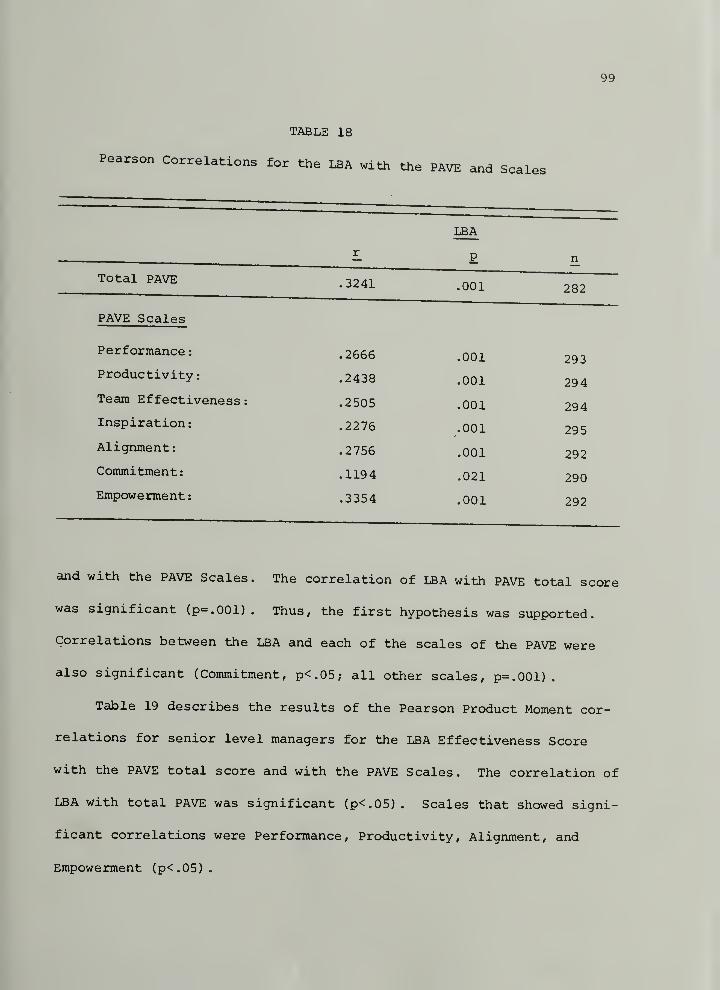
99
TABLE 18
Pearson Correlations for the LBa with the pave and Scales
Total PAVE
PAVE Scales
Performance
;
LBA
J. E
.3241 .001 282
•2666 .001 293Productivity: .2438 .001 294
Team Effectiveness: .2505 .001 294
Inspiration: .2276 .001 295
Alignment: .2756 .001 292
Commitment: .1194 021 290
Empowerment: .3354 ,ooi 292
and with the PAVE Scales. The correlation of LBA with PAVE total score
was significant (p=.001) . Thus, the first hypothesis was supported.
Correlations between the LBA and each of the scales of the PAVE were
also significant (Commitment, p<.05; all other scales, p=.001) .
Table 19 describes the results of the Pearson Product Moment cor-
relations for senior level managers for the LBA Effectiveness Score
with the PAVE total score and with the PAVE Scales. The correlation of
LBA with total PAVE was significant (p<.05) . Scales that showed signi-
ficant correlations were Performance, Productivity, Alignment, and
Empowerment (p<.05).
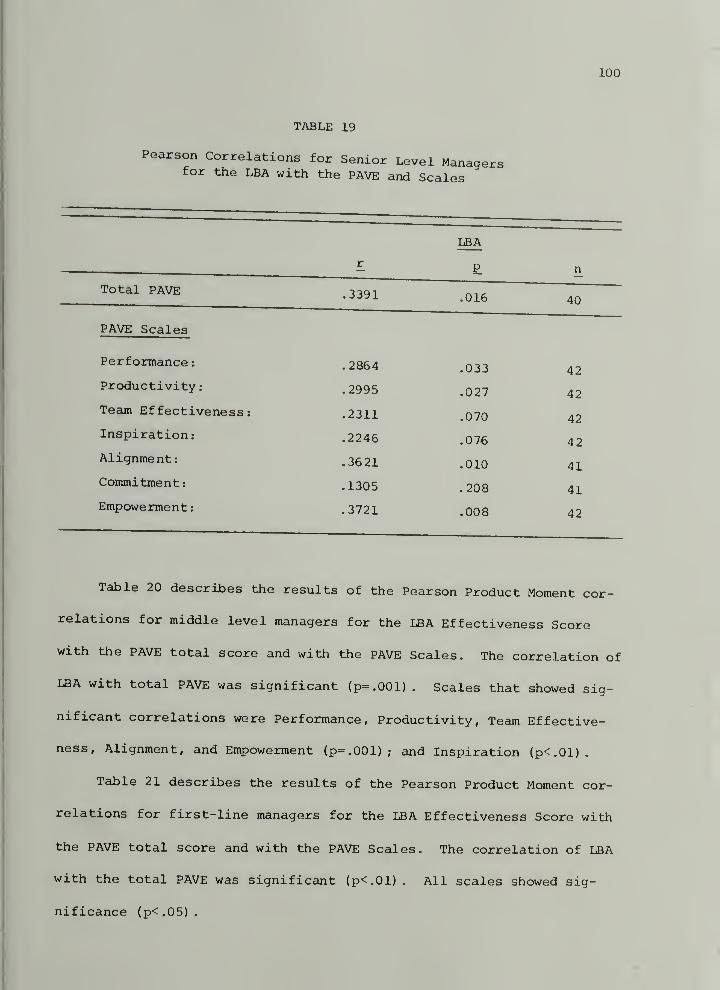
100
TABLE 19
Pearson Correlations for Senior Level Managersfor the LBA with the PAVE and Scales
LEA
£ E n
P^^^ -339140
PAVE Scales
Performance: .2864 .033 42
Productivity: .2995 .027 42
Team Effectiveness: .2311 .070 42
Inspiration: .2246 .076 4 2
Alignment: .3621 .010 41
Commitment: .I305 .208 41
Empowerment: .3721 .qob 42
Table 20 describes the results of the Pearson Product Moment cor-
relations for middle level managers for the LBA Effectiveness Score
with the PAVE total score and with the PAVE Scales. The correlation of
LBA with total PAVE was significant (p=.001) . Scales that showed sig-
nificant correlations were Performance, Productivity, Team Effective-
ness, Alignment, and Empowerment (p=.001); and Inspiration (p<.01).
Table 21 describes the results of the Pearson Product Moment cor-
relations for first-line managers for the LBA Effectiveness Score with
the PAVE total score and with the PAVE Scales. The correlation of LBA
with the total PAVE was significant (p<.01) . All scales showed sig-
nificance (p<.05).
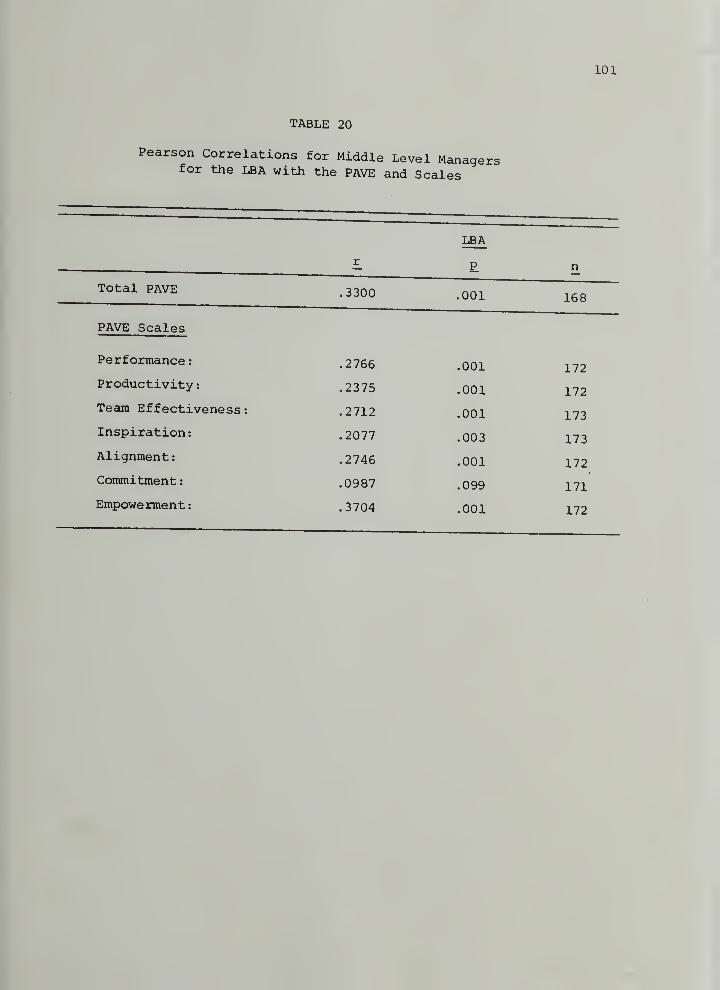
101
TABLE 20
Pearson Correlations for Middle Level Managefor the LBA with the PAVE and Scales
LBA
n
.3300 .001 168
PAVE Scales
Performance: .2766 .001 172
Productivity
:
.2375 .001 172
Team Effectiveness: .2712 .001 173
Inspiration: .2077 .003 173
Alignment
:
.2746 .001 172
Commitment
:
.0987 .099 171
Empowerment: .3704 .001 172
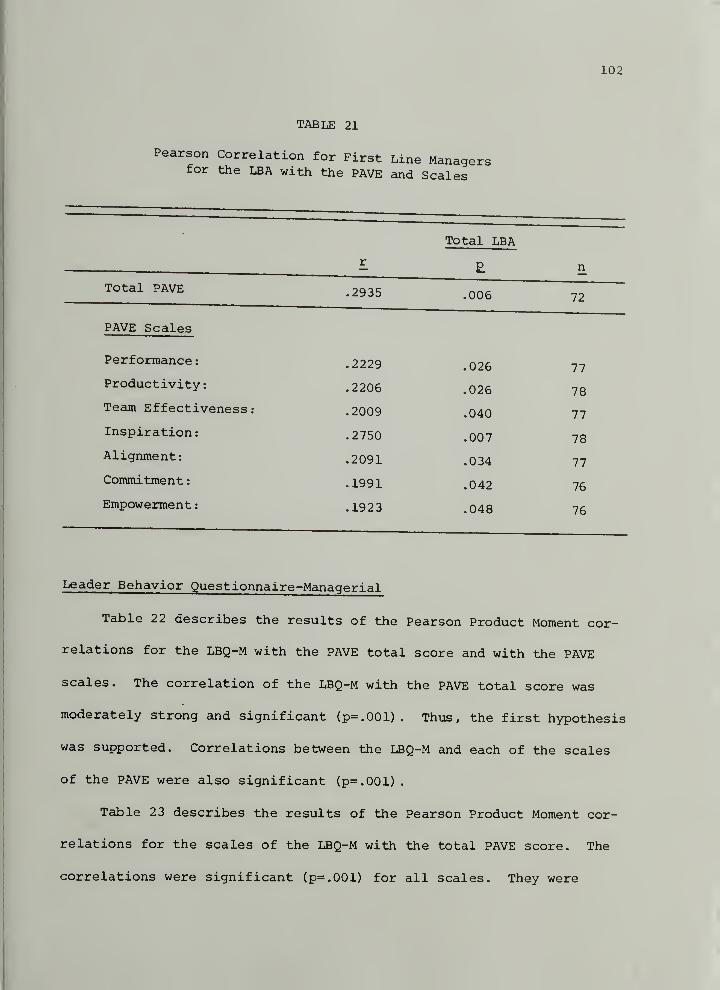
102
TABLE 21
Pearson Correlation for First Line Managersfor the LBA with the PAVE and Scales
r
iotai LBA
p n
.2935 .006 72
PAVE Scales
Performance
:
.2229 .026 77
Productivity: .2206 .026 78
Team Effectiveness: .2009 .040 77
Inspiration: .2750 .007 78
Alignment: .2091 .034 77
Commitment
:
.1991 .042 76
Empowerment
:
.1923 .048 76
Leader Behavior Questionnaire-Managerial
Table 22 describes the results of the Pearson Product Moment cor-
relations for the LBQ-M with the PAVE total score and with the PAVE
scales. The correlation of the LBQ-M with the PAVE total score was
moderately strong and significant (p=.001) . Thus, the first hypothesis
was supported. Correlations between the LBQ-M and each of the scales
of the PAVE were also significant (p=.001)
.
Table 23 describes the results of the Pearson Product Moment cor-
relations for the scales of the LBQ-M with the total PAVE score. The
correlations were significant (p=.001) for all scales. They were
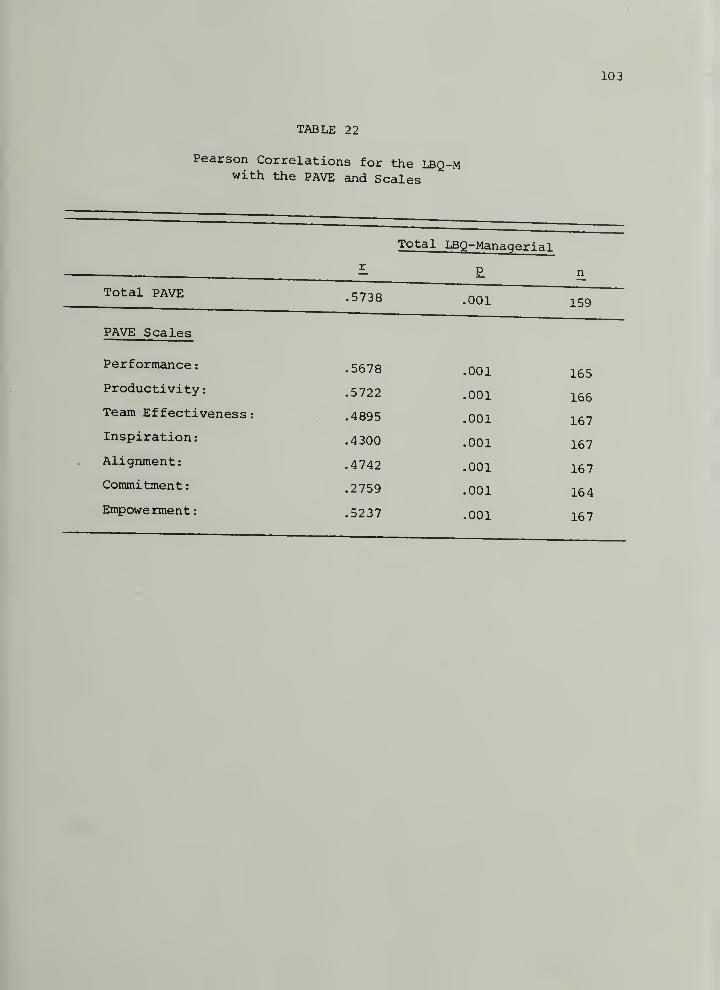
103
TABLE 22
Pearson Correlations for the LBQ-mwith the PAVE and Scales
Total LBQ-Manaqerial
Total PAVE
PAVE Scales
Performance
:
Productivity
:
Team Effectiveness:
Inspiration:
Alignment:
Commitment
:
Empowerment:
,5738
.5678
.5722
.4895
.4300
.4742
.2759
.5237
.001
.001
.001
.001
.001
.001
.001
.001
159
165
166
167
167
167
164
167
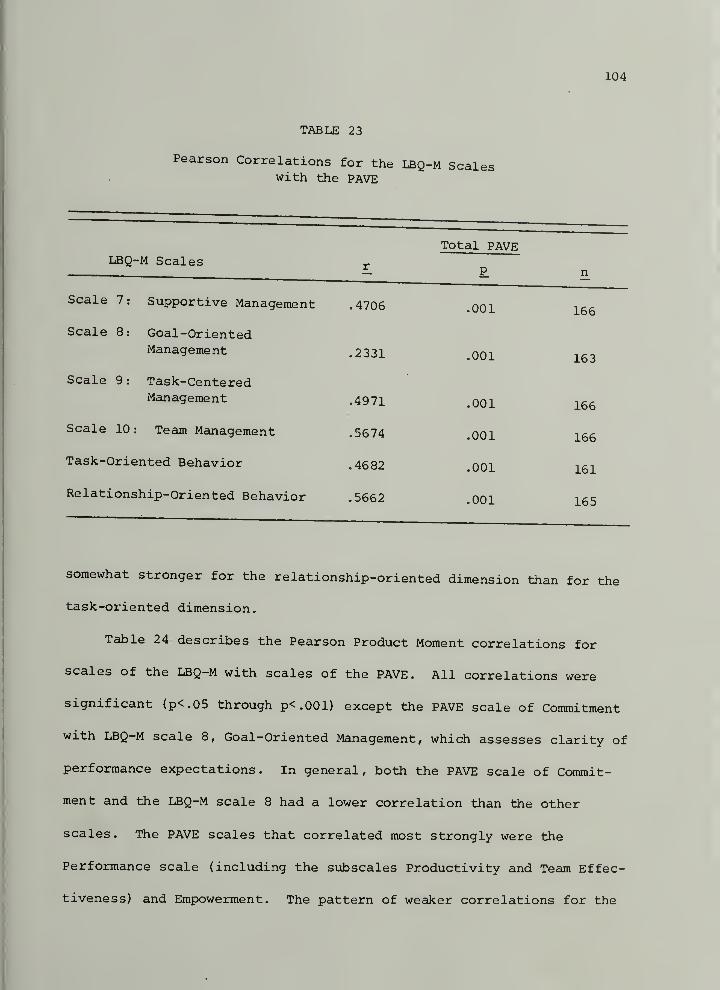
104
TABLE 23
arson Correlations for the LBQ-m Sealwith the PAVE
Total PAVELBQ-M Scales y.
^ £ n
Scale 7: Supportive Management .4706 .001 166
Scale 8: Goal-OrientedManagement .2331 .001 163
Scale 9: Task-CenteredManagement .4971 .001
Scale 10 : Team Management .5674 .001 166
Task-Oriented Behavior .4682 .001 161
Relationship-Oriented Behavior .5662 .001 165
somewhat stronger for the relationship-oriented dimension than for the
task-oriented dimension.
Table 24 describes the Pearson Product Moment correlations for
scales of the LBQ-M with scales of the PAVE All correlations were
significant (p<.05 through p<.001) except the PAVE scale of Commitment
with LBQ-M scale 8, Goal-Oriented Management, which assesses clarity of
performance expectations . In general , both the PAVE scale of Commit-
ment and the LBQ-M scale 8 had a lower correlation than the other
scales. The PAVE scales that correlated most strongly were the
Performance scale (including the subscales Productivity and Team Effec-
tiveness) and Empowerment. The pattern of weaker correlations for the
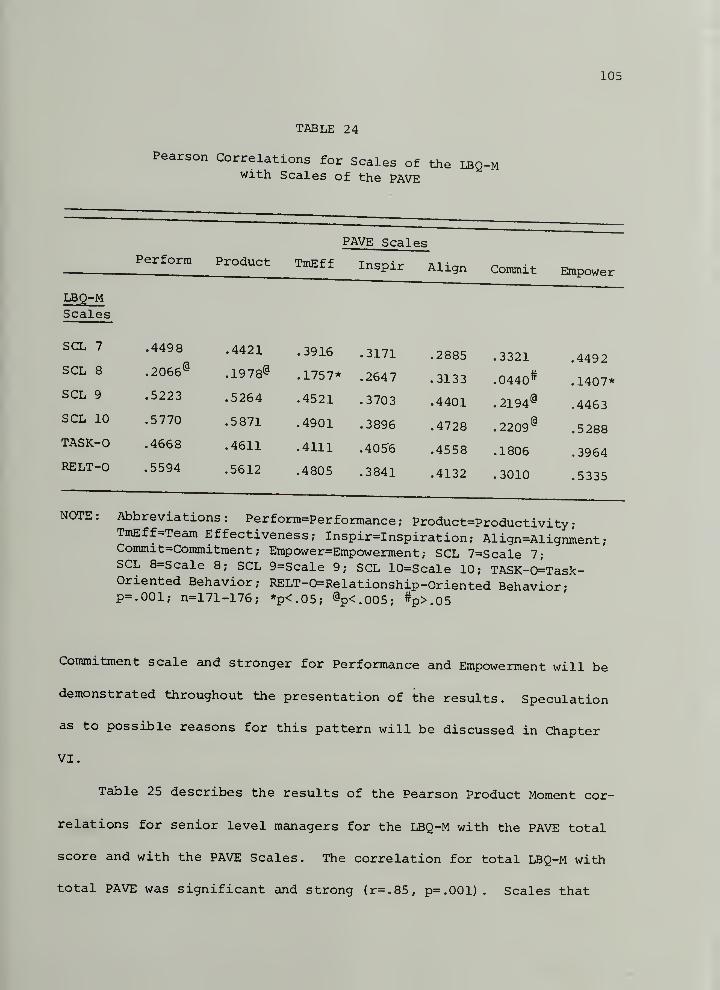
105
TABLE 24
Pearson Correlations for Scales of the lbq-mwith Scales of the PAVE
PAVE Scales
Perform Product TmEf f Inspir Align Commit Empower
LBQ-MScales
sen:. 7 .4498 .4421 .3916 .3171 .2885 .3321 .4492SCL 8 .2066'^ .1978® .1757* .2647 .3133 .0440** .1407*SCL 9 .5223 .5264 .4521 .3703 .4401 .2194® .4463SCL 10 .5770 .5871 .4901 .3896 .4728 .2209® .5288TASK-0 .4668 .4611 .4111 .4056 .4558 .1806 .3964RELT-0 .5594 .5612 .4805 .3841 .4132 .3010 .5335
NOTE: Abbreviations: Perform=Performance; Product=Productivity
;
TmEff=Team Effectiveness; Inspir=Inspiration; Align=Alignment
;
Commit-Commitment; Empower=Empowerment ; SCL 7=Scale 7;SCL 8=Scale 8; SCL 9=Scale 9; SCL 10=Scale 10; TASK-0=Task-Oriented Behavior; RELT-0=Relationship-Oriented Behavior;p=.001; n=171-176; *p<.05; ®p<.005; #p>.05
Commitment scale and stronger for Performance and Empowerment will be
demonstrated throughout the presentation of the results. Speculation
as to possible reasons for this pattern will be discussed in Chapter
VI.
Table 25 describes the results of the Pearson Product Moment cor-
relations for senior level managers for the LBQ-M with the PAVE total
score and with the PAVE Scales. The correlation for total LBQ-M with
total PAVE was significant and strong (r=.85, p=.001). Scales that
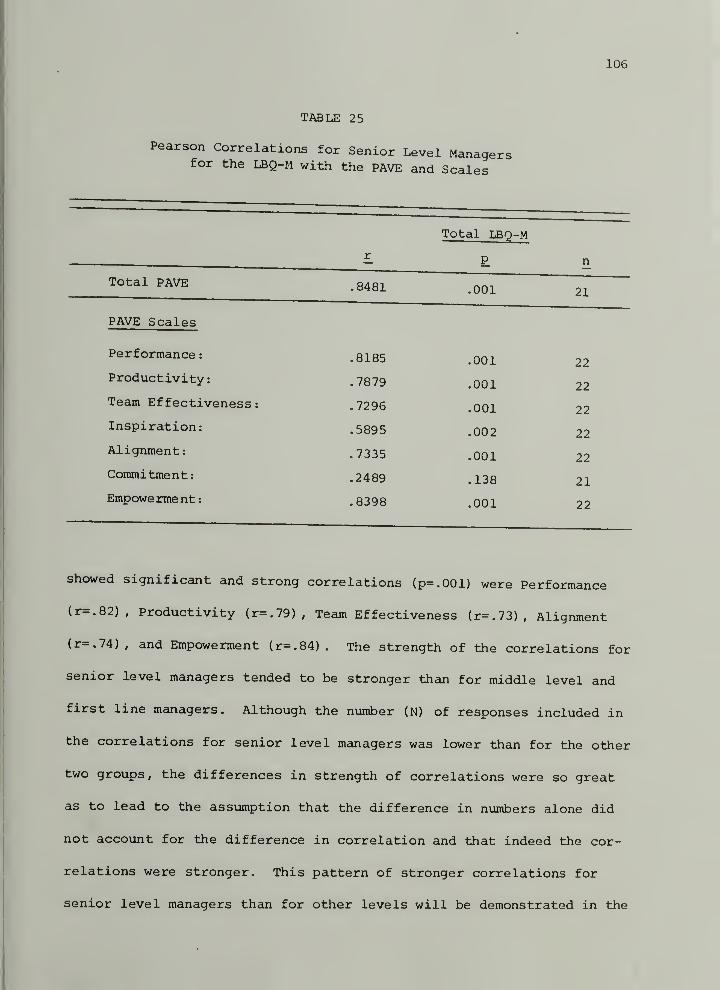
106
TABLE 25
on Correlations for Senior Level Managersfor the LBQ-M with the PAVE and Scales
r
Total LBQ-M
P n
Total PAVE .8481 on 1 21
PAVE Scales
Performance
:
.8185 .001 22
Productivity: .7879 .001 22
Team Effectiveness
:
.7296 .001 22
Inspiration: .5895 .002 22
Alignment: .7335 .001 22
Commitment: .2489 .138 21
Empowerment: .8398 .001 22
showed significant and strong correlations (p=.001) were Performance
(r=.82), Productivity (r=.79), Team Effectiveness (r=.73), Alignment
(r=.74), and Empowerment (r=.84) . The strength of the correlations for
senior level managers tended to be stronger than for middle level and
first line managers. Although the number (N) of responses included in
the correlations for senior level managers was lower than for the other
two groups, the differences in strength of correlations were so great
as to lead to the assumption that the difference in numbers alone did
not account for the difference in correlation and that indeed the cor-
relations were stronger. This pattern of stronger correlations for
senior level managers than for other levels will be demonstrated in the
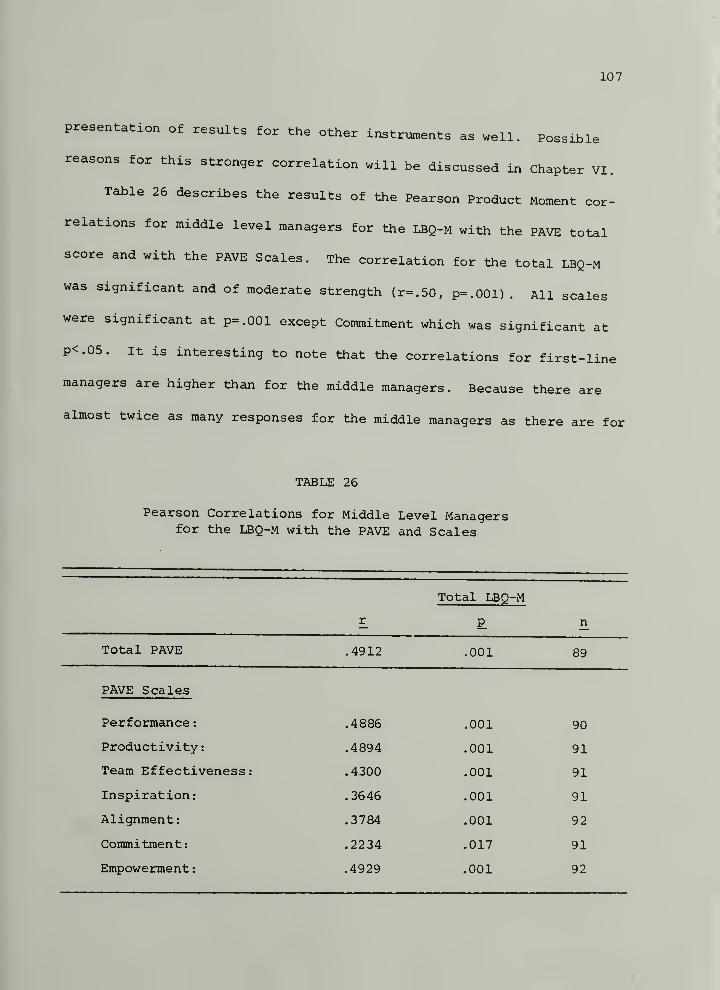
107
presentation of results for the other instruments as well. Possible
reasons for this stronger correlation will be discussed in Chapter VI.
Table 26 describes the results of the Pearson Product Moment cor-
relations for middle level managers for the LBQ-M with the PAVE total
score and with the PAVE Scales. The correlation for the total LBQ-M
was significant and of moderate strength (r=.50, p=.001) . All scales
were significant at p=.001 except Commitment which was significant at
P<.05. It is interesting to note that the correlations for first-line
managers are higher than for the middle managers. Because there are
almost twice as many responses for the middle managers as there are for
TABLE 26
Pearson Correlations for Middle Level Managersfor the LBQ-M with the PAVE and Scales
r
Total LBQ-M
P n
Total PAVE .4912 .001 89
PAVE Scales
Performance
:
.4886 .001 90
Productivity
:
.4894 .001 91
Team Effectiveness: .4300 .001 91
Inspiration: .3646 .001 91
Alignment: .3784 .001 92
Commitment: .2234 .017 91
Empowerment
:
.4929 .001 92
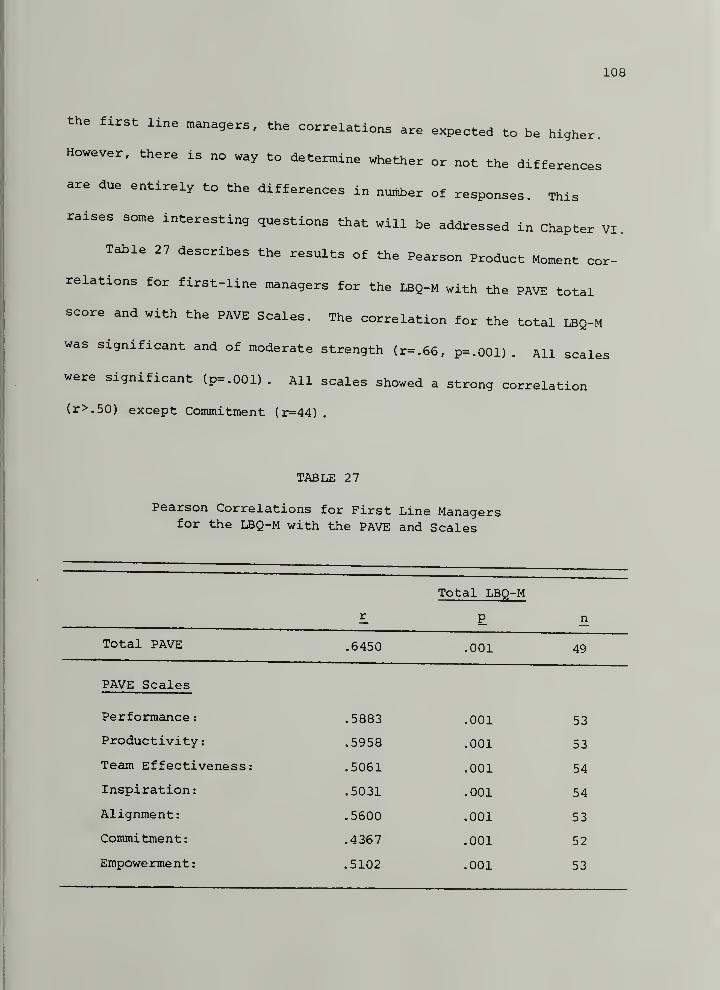
108
the first line managers, the correlations are expected to be higher.
However, there is no way to determine whether or not the differences •
are due entirely to the differences in number of responses. This
raises some interesting questions that will be addressed in Chapter VI.
Table 27 describes the results of the Pearson Product Moment cor-
relations for first-line managers for the LBQ-M with the PAVE total
score and with the PAVE Scales. The correlation for the total lbq-m
was significant and of moderate strength (r=.66, p=.001) . All scales
were significant (p=.001) . All scales showed a strong correlation
(r>.50) except Commitment (r=44)
.
TABLE 27
Pearson Correlations for First Line Managersfor the LBQ-M with the PAVE and Scales
Total LBQ-M
£. EHTotal PAVE .6450 .001 49
PAVE Scales
Performance: .5883 .001 53
Productivity: .5958 .001 53
Team Effectiveness: .5061 .001 54
Inspiration: .5031 .001 54
Alignment: .5600 .001 53
Commitment: .4367 .001 52
Empowerment: .5102 .001 53
109
36 a
workers' Perceptions of fhe Pelationshin R.tween VisionaryLeadership and Peak Performance of the Wor-v
The second hypothesis was stated as follows: There will b(
positive correlation between workers' ratings of their perceptions of
their leader's behavior on a scale based on the visionary leadership
perspective with ratings on a scale assessing workers' perceptions of
the peak performance level of the work unit.
This hypothesis was examined using two separate instruments to
assess workers' perceptions of their leader's visionary leadership
behavior, the Leader Behavior Questionnaire-Visionary (LBQ-V) and the
Leadership Practices Inventory (LPI) . The "Other" report form was used
for both instruments; this form assesses others' perceptions as
opposed to self perceptions. Results will be reported first for the
LBQ-V and then for the LPI. These instruments were each correlated with
PAVE; Excellent Organizational Practices Index which was used to
measure workers' perceptions of the performance level of the work unit.
Leader Behavior Questionnaire-Visionary
Table 28 describes the results of the Pearson Product Moment cor-
relations for the LBQ-V with the PAVE total score and with the PAVE
Scales. The correlation of the LBQ-V total score with the PAVE total
score was significant (p=.001) . Thus, the second hypothesis was sup-
ported. Correlations between the LBQ-V and each of the scales of the
PAVE were also significant (p=.001) . The strength of the correlations
were in the moderate range for the total PAVE with the total LBQ-V.
The strength of the correlations was also in the moderate range for
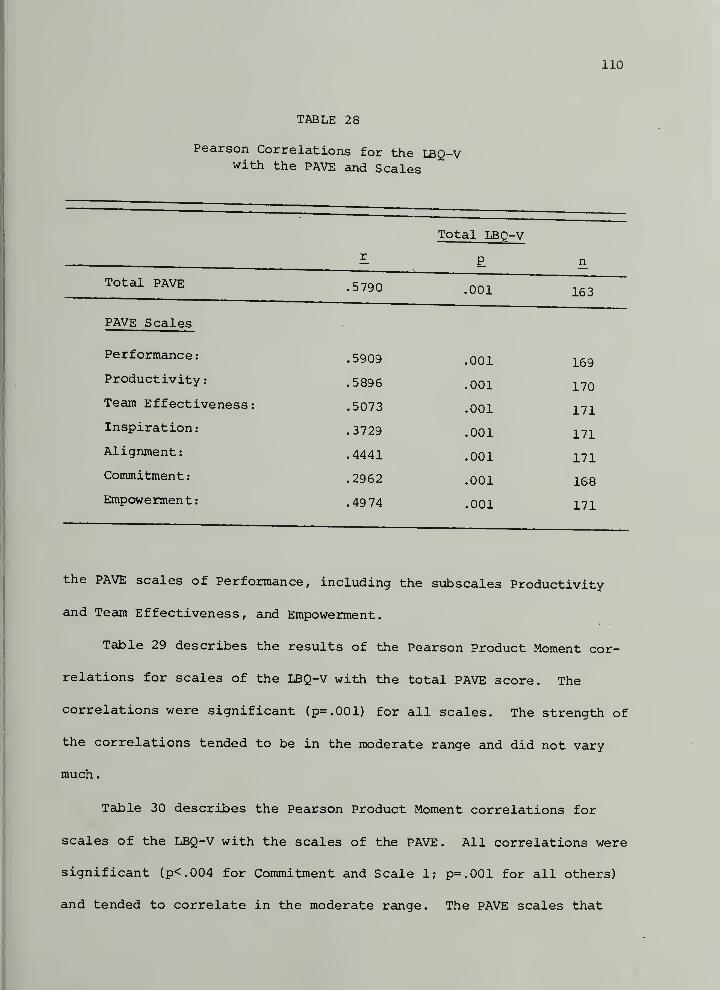
110
TABLE 28
Pearson Correlations for the LBQ-vwith the PAVE and Scales
r
Total LBQ-v
P n
Total PAVE .5790 163
PAVE Scales
Performance
:
.5909 .001 169
Productivity
:
.5896 .001 170
Team Effectiveness: .5073 .001 171
Inspiration: .3729 .001 171
Alignment
:
.4441 .001 171
Commitment
:
.2962 .001 168
Empowerment: .4974 .001 171
the PAVE scales of Performance, including the subscales Productivity
and Team Effectiveness, and Empowerment.
Table 29 describes the results of the Pearson Product Moment cor-
relations for scales of the LBQ-V with the total PAVE score. The
correlations were significant (p=.001) for all scales. The strength of
the correlations tended to be in the moderate range and did not vary
much
.
Table 30 describes the Pearson Product Moment correlations for
scales of the LBQ-V with the scales of the PAVE. All correlations were
significant (p<.004 for Commitment and Scale 1; p=.001 for all others)
and tended to correlate in the moderate range. The PAVE scales that
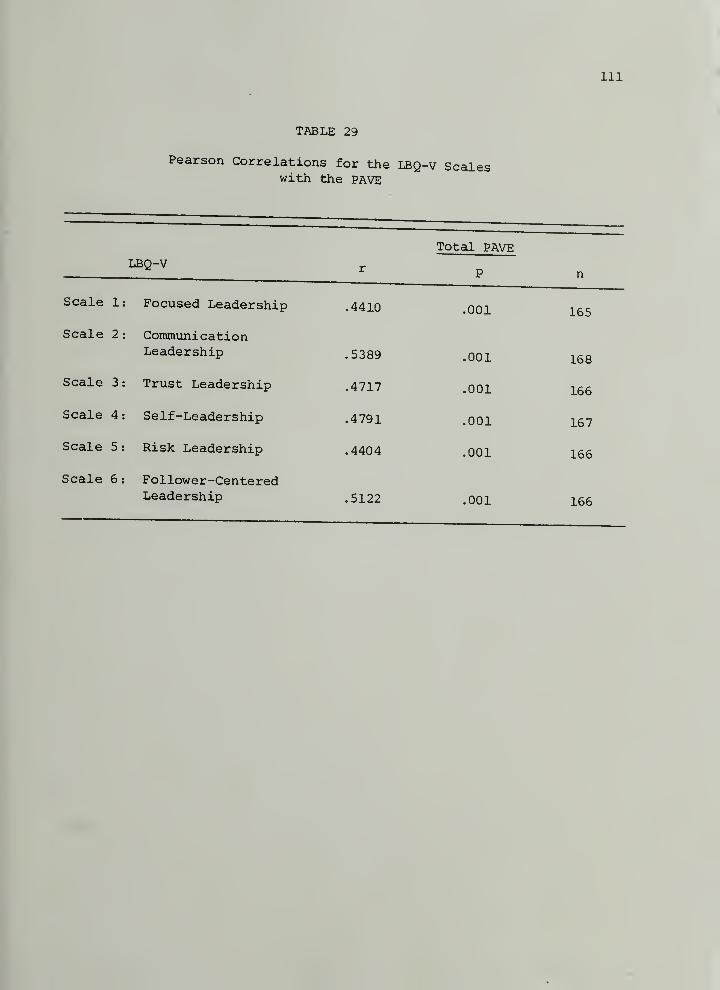
Ill
TABLE 29
Pearson Correlations for the LBQ-v Scaleswith the PAVE
Total PAVE
Focused Leadership
Trust Leadership
Self-Leadership
Risk Leadership
Follower-CenteredLeadership
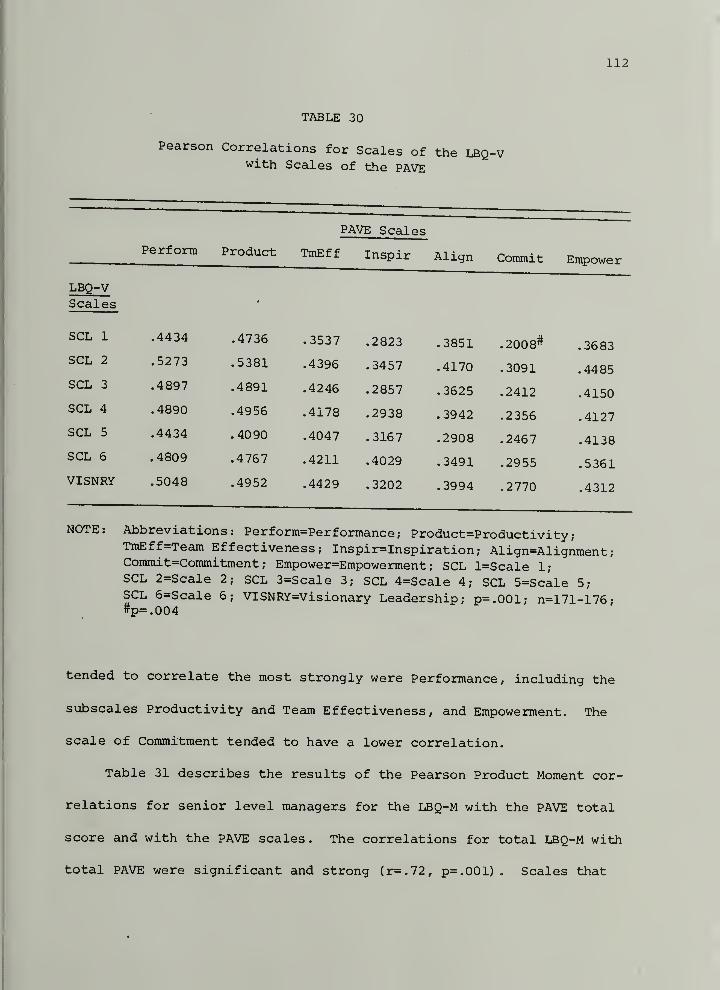
112
TABLE 30
Pearson Correlations for Scales of the LBQ-'with Scales of the PAVE
PAVE Scales
Perforin Product TmEf f Inspir Align Commit Empower
LBQ-VScales
SCL 1 .4434 .4736 .3537 .2823 .3851 .2008^ .3683SCL 2 .5273 .5381 .4396 .3457 .4170 .3091 .4485SCL 3 .4897 .4891 .4246 .2857 .3625 .2412 .4150SCL 4 .4890 .4956 .4178 .2938 .3942 .2356 .4127SCL 5 .4434 .4090 .4047 .3167 .2908 .2467 .4138
SCL 6 .4809 .4767 .4211 .4029 .3491 .2955 .5361
VISNRY .5048 .4952 .4429 .3202 .3994 .2770 .4312
NOTE: Abbreviations: Perform=Performance ; Product=Productivity
;
TmEff=Team Effectiveness; Inspir=Inspiration; Align=Alignment ,•
Commit=Commitment; Empower=Empowerment ; SCL l=Scale 1;
SCL 2=Scale 2; SCL 3=Scale 3; SCL 4=Scale 4; SCL 5=Scale 5
;
SCL 6=Scale 6; VISNRY=Visionary Leadership; p=.001; n=171-176-#p=.004
tended to correlate the most strongly were Performance, including the
subscales Productivity and Team Effectiveness, and Empowerment. The
scale of Commitment tended to have a lower correlation.
Table 31 describes the results of the Pearson Product Moment cor-
relations for senior level managers for the LBQ-M with the PAVE total
score and with the PAVE scales . The correlations for total LBQ-M with
total PAVE were significant and strong (r=.72, p=.001) . Scales that
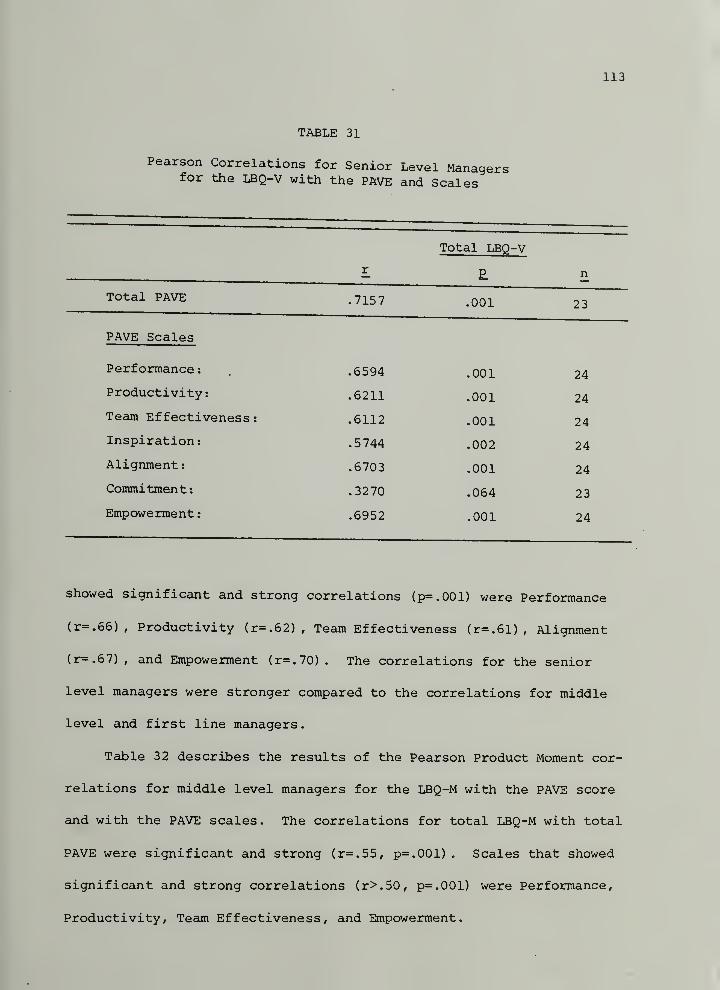
113
TABLE 31
Pearson Correlations for Senior Level Managefor the LBQ-V with the PAVE and Scales
Total LBQ-V
P
Total PAVE ,7157 ,001 23
PAVE Scales
Performance
:
Productivity:
Team Effectiveness
Inspiration:
Alignment
:
Commitment:
Empowerment
:
.6594
.6211
.6112
.5744
.6703
.3270
.6952
.001
.001
.001
.002
.001
.064
.001
24
24
24
24
24
23
24
showed significant and strong correlations (p=.001) were Performance
(r=.66) , Productivity (r=.62), Team Effectiveness (r=.61) , Alignment
(r=.67) , and Empowerment (r=.70) . The correlations for the senior
level managers were stronger compared to the correlations for middle
level and first line managers
.
Table 32 describes the results of the Pearson Product Moment cor-
relations for middle level managers for the LBQ-M with the PAVE score
and with the PAVE scales. The correlations for total LBQ-M with total
PAVE were significant and strong (r=.55, p=.001) . Scales that showed
significant and strong correlations (r>.50, p=.001) were Performance,
Productivity, Team Effectiveness, and Empowerment.
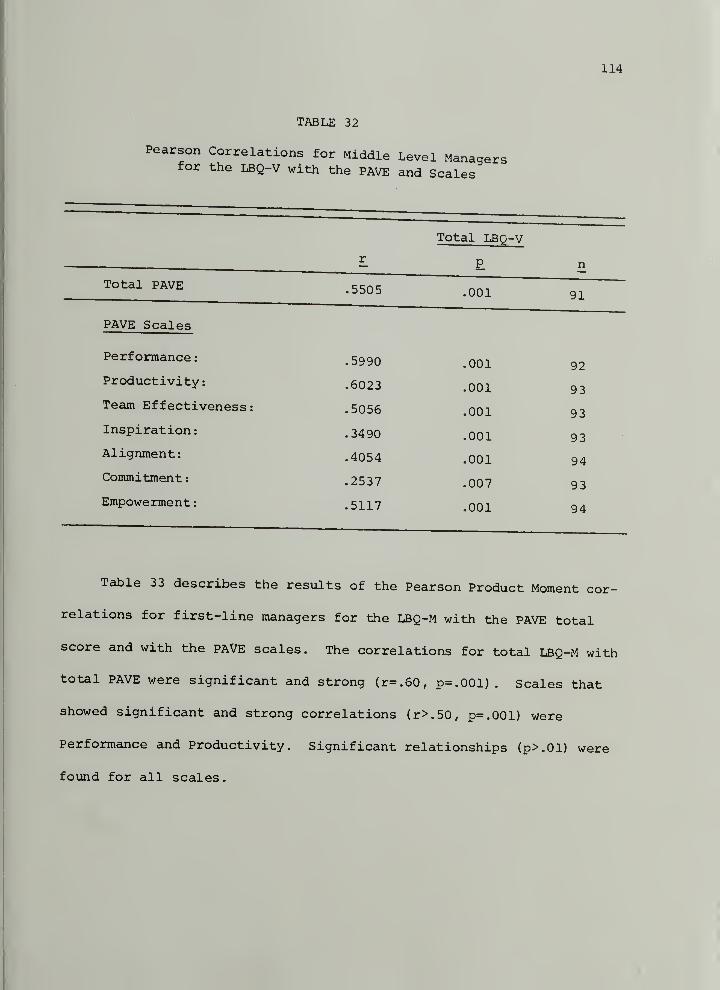
114
TABLE 32
Correlations for Middle Level Managethe LBQ-V with the PAVE and Scales
r
Total LBQ-V
nIT n
Total PAVE.001 91
Performance
:
.5990 .001 92Productivity: .6023 .001 93Team Effectiveness: .5056 .001 93
Inspiration: .3490 .001 93Alignment: .4054 .001 94
Commitment
:
.2537 -007 93
Empowerment: .5117 .001 94
Table 33 describes the results of the Pearson Product Moment cor-
relations for first-line managers for the LBQ-M with the PAVE total
score and with the PAVE scales. The correlations for total LBQ-M with
total PAVE were significant and strong (r=.60, p=.001) . Scales that
showed significant and strong correlations (r>.50, p=.001) were
Performance and Productivity. Significant relationships (p>.01) were
found for all scales.
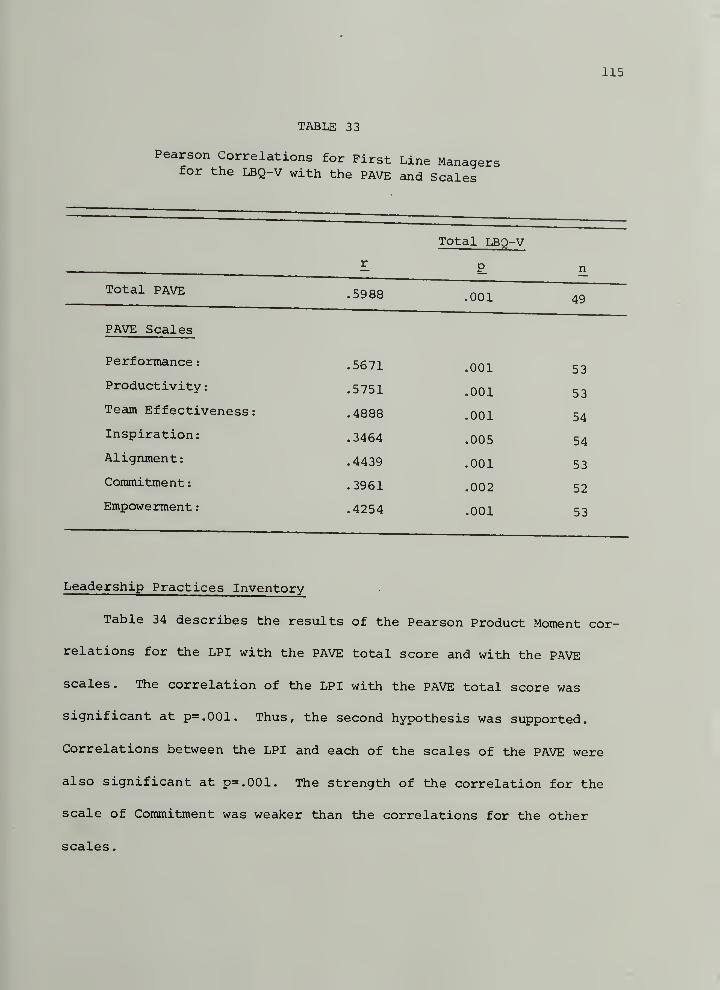
115
TABLE 33
Pearson Correlations for First Line Managersfor the LBQ-V with the PAVE and Scales
iOtai LBQ—
V
p n
lOCdX PAVE .5988 .001 49
FAVE Scales
Performance r .5671 .001 53
Productivity
:
.5751 .001 53
Team Effectiveness: .4888 .001 54
Inspiration: .3464 .005 54
Alignment: .4439 .001 53
Commitment
:
.3961 .002 52
Empowerment
:
.4254 .001 53
Leadership Practices Inventory
Table 34 describes the results of the Pearson Product Moment cor-
relations for the LPI with the PAVE total score and with the PAVE
scales. The correlation of the LPI with the PAVE total score was
significant at p=.001. Thus, the second hypothesis was supported.
Correlations between the LPI and each of the scales of the PAVE were
also significant at p=.001. The strength of the correlation for the
scale of Commitment was weaker than the correlations for the other
scales
.
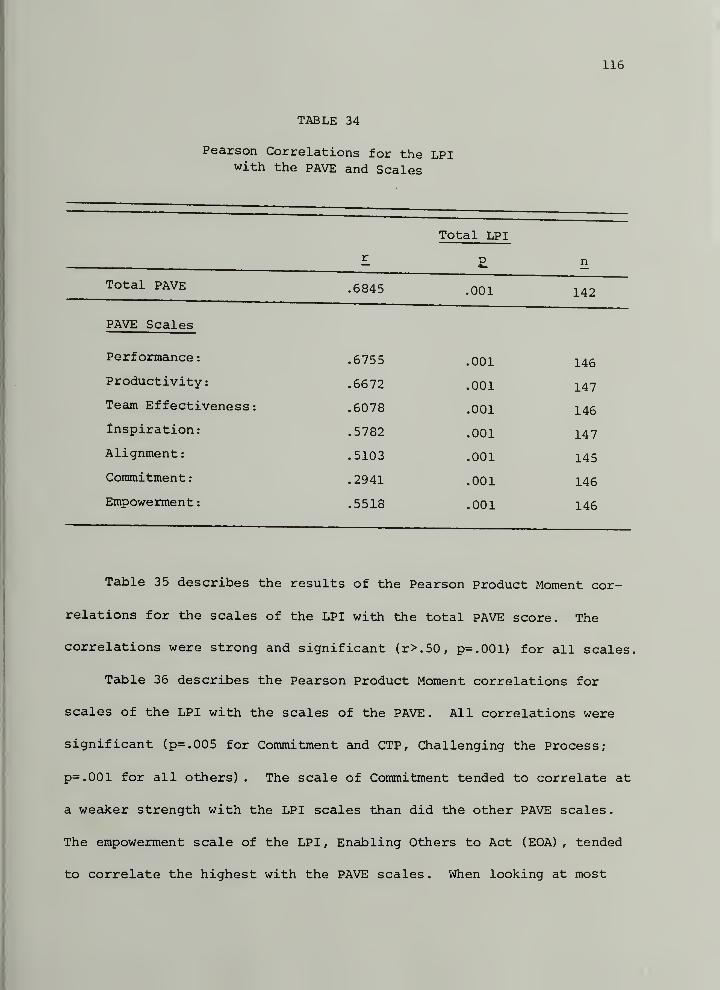
116
TABLE 34
Pearson Correlations for the LPIwith the PAVE and Scales
Total LPI
Total PAVE .6845 .001 142
PAVE Scales
Performance
:
Productivity
:
Team Effectiveness
Inspiration:
Alignment
:
Commitment
:
Empowerment
:
.6755
.6672
.6078
.5782
.5103
.2941
.5518
.001
.001
.001
.001
.001
.001
.001
146
147
146
147
145
146
146
Table 35 describes the results of the Pearson Product Moment cor-
relations for the scales of the LPI with the total PAVE score. The
correlations were strong and significant (r>.50, p=.001) for all scales.
Table 36 describes the Pearson Product Moment correlations for
scales of the LPI with the scales of the PAVE. All correlations were
significant (p=.005 for Commitment and CTP, Challenging the Process;
p=.001 for all others) . The scale of Commitment tended to correlate at
a weaker strength with the LPI scales than did the other PAVE scales.
The empowerment scale of the LPI, Enabling Others to Act (EOA) , tended
to correlate the highest with the PAVE scales . When looking at most
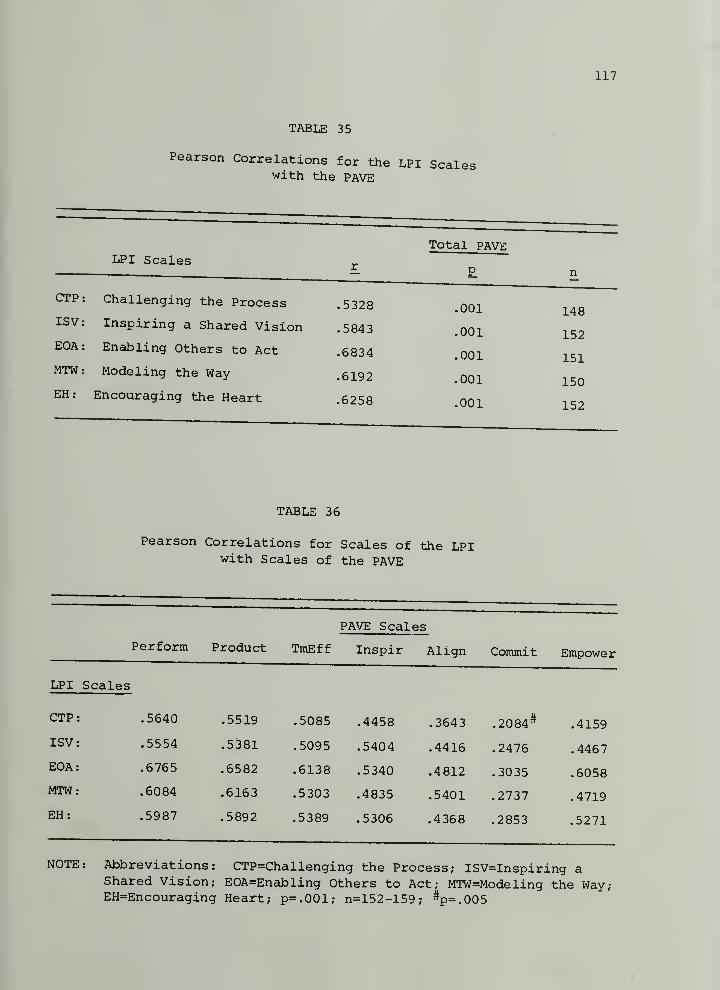
117
TABLE 35
Pearson Correlations for the LPI Scaleswith the PAVE
CTP;
ISV;
EOA;
MTW;
EH;
LPI Scales
Challenging the Process
Inspiring a Shared Vision
Enabling Others to Act
Modeling the Way
Encouraging the Heart
.5328
.5843
.6834
.6192
.6258
Total PAVE
P
.001
.001
.001
.001
.001
148
152
151
150
152
TABLE 36
Pearson Correlations for Scales of the LPIwith Scales of the PAVE
PAVE Scales
Perform Product TmEff Inspir Align Conunit Empowe
LPI Scales
CTP .5640 .5519 .5085 .4458 .3643 .2084* .4159
ISV: .5554 .5381 .5095 .5404 .4416 .2476 .4467
EOA: .6765 .6582 .6138 .5340 .4812 .3035 .6058
MTW: .6084 .6163 .5303 .4835 .5401 .2737 .4719
EH: .5987 .5892 .5389 .5306 .4368 .2853 .5271
NOTE: Abbreviations: CTP=Challenging the Process; ISV=Inspiring aShared Vision; EOA=Enabling Others to Act; MTW=Modeling the Way;EH=Encouraging Heart; p=.001; n=152-159; *p=.005
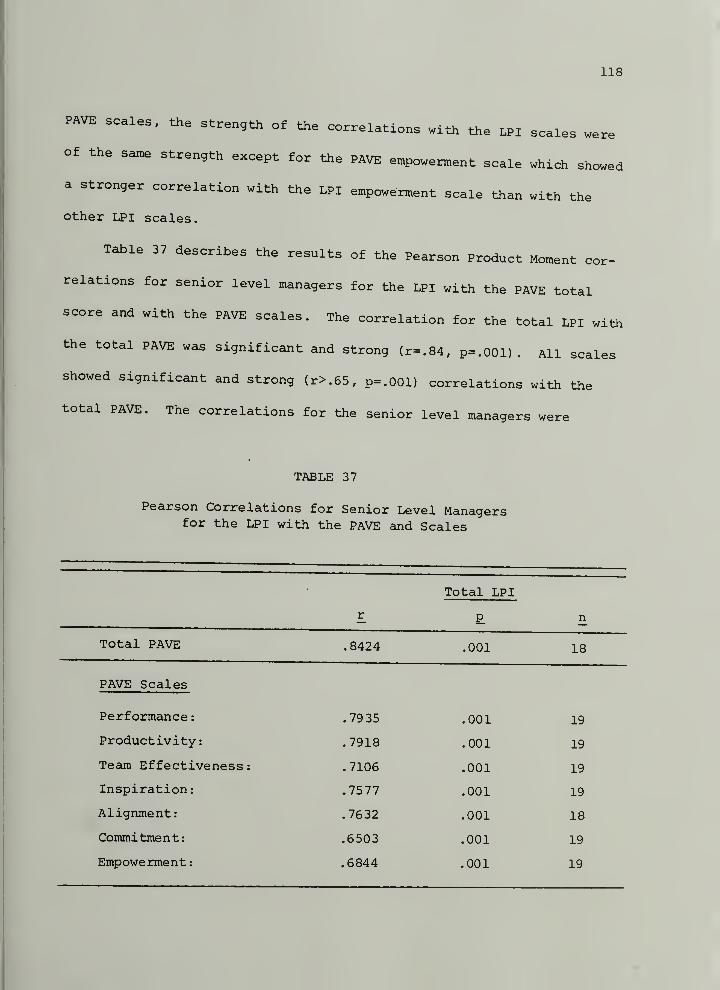
118
PAVE scales, the strength of the correlations with the LPI scales were
of the saine strength except fcr the PAVE empowerr»ent scale which showed
a stronger correlation with the LPI empowerment scale than with the
Other LPI scales.
Table 37 describes the results of the Pearson Product Moment cor-
relations for senior level managers for the LPI with the PAVE total
score and with the PAVE scales. The correlation for the total LPI with
the total PAVE was significant and strong (r=.84, p=.001) . All scales
showed significant and strong (r>.65, p=.001) correlations with the
total PAVE. The correlations for the senior level managers were
TABLE 37
Pearson Correlations for Senior Level Managersfor the LPI with the PAVE and Scales
Total LPI
Total PAVE .8424 ,001 18
PAVE Scales
Performance
:
Productivity:
Team Effectiveness:
Inspiration:
Alignment:
Commitment:
Empowerment
:
.7935
.7918
.7106
.7577
.7632
.6503
.6844
.001
.001
.001
.001
.001
.001
.001
19
19
19
19
18
19
19
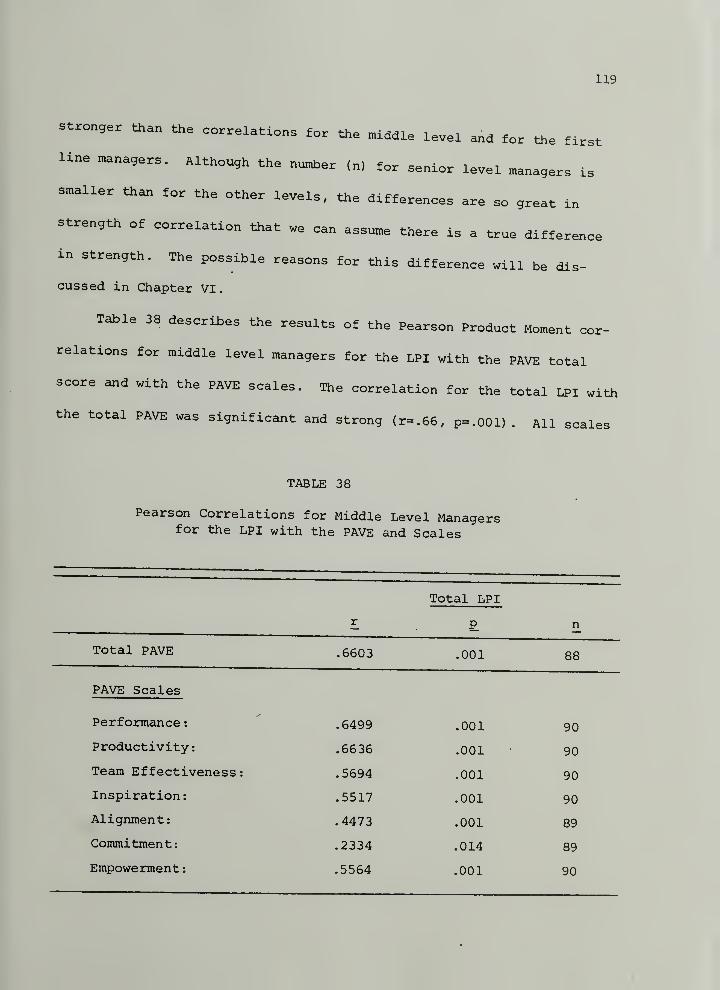
119
Stronger than the correlations for the .iddle level and for the firstline managers. Although the nu^er (n) for senior level managers is
smaller than for the other levels, the differences are so great in
strength of correlation that we can assume there is a true difference
in strength. The possible reasons for this difference will be dis-
cussed in Chapter VI.
Table 38 describes the results of the Pearson Product Moment cor-
relations for middle level managers for the LPI with the PAVE total
score and with the PAVE scales. The correlation for the total LPI with
the total PAVE was significant and strong (r=.66, p=.001) . All scales
TABLE 38
Pearson Correlations for Middle Level Managersfor the LPI with the PAVE and Scales
r
Total LPI
P n
Total PAVE .6603 .001 88
PAVE Scales
Performance
:
.6499 .001 90
Productivity: .6636 .001 90
Team Effectiveness: .5694 .001 90
Inspiration: .5517 .001 90
Alignment: .4473 .001 89
Commitment: .2334 .014 89
Empowerment
:
.5564 .001 90
120
were significant at p=.00l except Conunitment which was significant at
p<.05.
Table 39 describes the results of the Pearson Product Moment cor-
relations for first-line managers for the LPI with the PAVE total score
and with the PAVE scales. The correlation for the total LPI with the
total PAVE was significant and strong (r=.69, p=.00i) . All scales were
significant at p=.001, except Commitment which was significant at p<.05
and Empowerment which was significant at p<.01.
TABLE 39
Pearson Correlations for First Line Managersfor the LPI with the PAVE and Scales
r
Total LPI
P n
Total PAVE .6886 .001 34
PAVE Scales
Performance
:
.7178 .001 35
Productivity
:
.6287 .001 36
Team Effectiveness: .7094 .001 35
Inspiration: .5596 .001 36
Alignment: .5685 .001 36
Commitment: .3448 .020 36
Empowerment
:
.4849 .002 35
121
workers Perceptions of the Relationship R.i-w.o. Possiblecombinations of Managerial and Vi.ion..,, r...ZT.'^''^with Peak Performance of the WorTlT;^ ~
The third hypothesis was stated as follows: When workers rate
their leaders as high on both traditional managerial and on visionary
leadership scales, the workers' reported perceptions of the peak per-
formance level of that manager's work unit will be significantly higher
than when the workers rate their leaders as high on only the tradi-
tional managerial scale or only the visionary leadership scale.
Subhypothesis a: When workers rate their leaders as high on both
traditional managerial and on visionary leadership scales (Category I) ,
the workers ' reported perceptions of the peak performance level of
that manager's work unit will be high.
Subhypothesis b: When workers rate their leaders as high on a
visionary leadership scale and low on a traditional managerial scale
(Category II), the workers' reported perceptions of the peak perfor-
mance level of that manager's work unit will be in the average range.
Subhypothesis c ; When workers rate their leaders as high on a
traditional managerial scale and low on a visionary leadership scale
(Category III) , the workers' reported perceptions of the peak perfor-
mance level of that manager's work unit will be in the average range.
Sijbhypothesis d : When workers rate their leaders as low on both
traditional managerial and on visionary leadership scales (Category
IV), the workers' reported perceptions of the peak performance level of
that manager's work unit will be low.
122
Category r High Rated Traditional ManagerHigh Rated Visionary Leader
Category li low Rated Traditional ManagerHigh Rated Visionary Leader
Category III High Rated Traditional ManagerLow Rated Visionary Leader
Category IV Low Rated Traditional ManagerLow Rated Visionary Leader
This hypothesis was examined using two separate instruments to
assess workers' perceptions of their leader's traditional managerial
skills, the Leader Behavior Analysis (LBA) and the Leader Behavior
Questionnaire-Managerial (LBQ-M) . Two separate instruments were also
used to assess workers' perceptions of their leader's visionary leader-
ship behavior, the Leader Behavior Questionnaire-Visionary (LBQ-V)
and the Leadership Practices Inventory (LPI) . The "Other" report form
was used for all four instruments; this form assesses others' percep-
tions as opposed to self perceptions. The results of three sets of
combinations of instruments will be provided.
The procedure for analysis of results was as follows. First
managers were divided into the four groups (categories) described in
the hypothesis. High-rated managers were those who were rated in the
upper third of the total sample. Low-rated managers were those who
were rated in the lower third of the total sample. Second, the mean
PAVE score and standard deviation was obtained for each group. Third,
because the number and standard deviation for each group varied, they
were tested for homogeneity of variance. If the test was passed, a
one-way analysis of variance (ANOVA) was performed to determine level
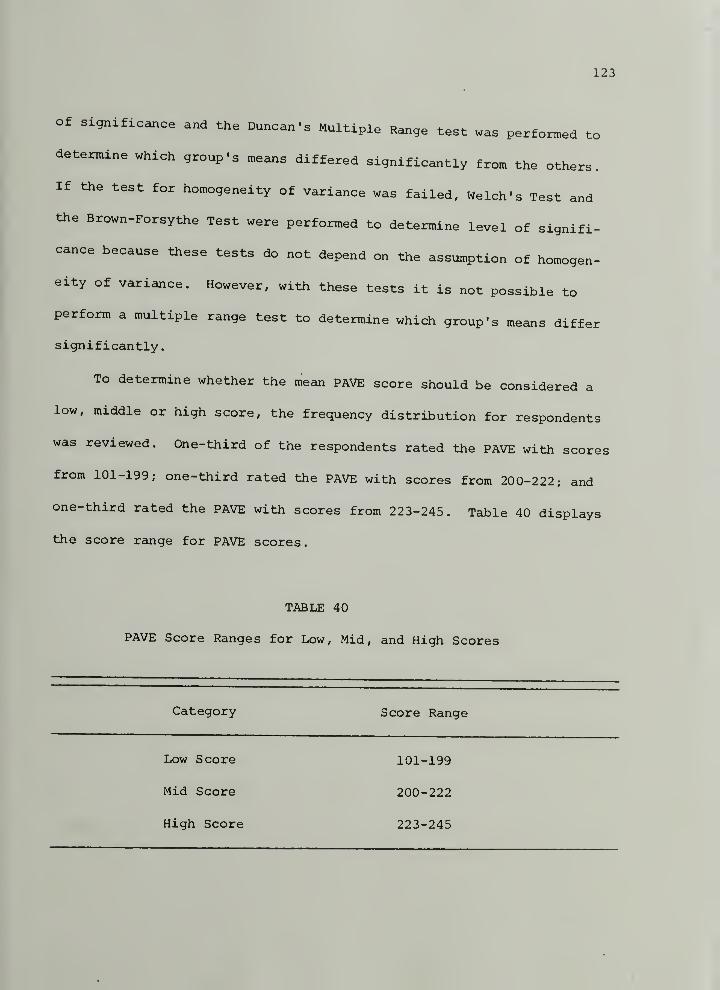
123
of significance and the Duncan's Multiple Range test was performed to
determine which group's means differed significantly from the others.
If the test for homogeneity of variance was failed, Welch's Test and
the Brown-Forsythe Test were performed to determine level of signifi-
cance because these tests do not depend on the assumption of homogen-
eity of variance. However, with these tests it is not possible to
perform a multiple range test to determine which group's means differ
significantly.
To determine whether the mean PAVE score should be considered a
low, middle or high score, the frequency distribution for respondents
was reviewed. One-third of the respondents rated the PAVE with scores
from 101-199; one-third rated the PAVE with scores from 200-222; and
one-third rated the PAVE with scores from 223-245. Table 40 displays
the score range for PAVE scores.
TABLE 40
PAVE Score Ranges for Low, Mid, and High Scores
Category Score Range
Low Score
Mid Score
High Score
101-199
200-222
223-245
124
First, results will be reported for the LPI (used for classifica-
tion of visionary leadership behavior) and the LBA (used for classifi-
cation of traditional managerial behavior) . The PAVE was used to
determine workers' perceptions of the peak performance level of the
work unit.
Second, results will be reported for the LBQ-v (used for classifi-
cation of visionary leadership behavior) and the IBA (used for classi-
fication of traditional managerial behavior) . The PAVE was used to
determine workers' perceptions of peak performance level of the work
unit.
Third, results will be reported for the LPQ-V (used for classifi-
cation of visionary leadership behavior) and the LBQ-M (used for
classification of traditional managerial behavior) . The PAVE was used
to determine workers' perceptions of the peak performance level of the
work unit.
The combination of LPI for classification of visionary leadership
behavior and LBQ-M for classification of traditional managerial behav-
ior was not used because none of the workers completed both of these
instruments
.
The Leadership Practices Inventoryand the Leader Behavior Analysis
For purposes of classification, managers who were rated in the top
third of the entire population were considered "high" and managers who
were rated in the bottom third of the entire population were considered
"low." The four categories described above were formed by the four
125
possible combinations of high-ratad and low-rated managers. Middle-rated managers were not included; therefore the total number of
managers in the sample dropped to 66. The mean pave score, standard
deviation, and number of each category are reported in Table 41 and are
displayed in Figure 4.
TABLE 41
Means and Standard Deviation Summary for PAVEby the LBA and LP
I
CategoryNo.
CategoryName
PAVE Scores
N Mean SD SE Minimum Maximum
High LBAHigh LPI
20 225.0 19.61 4.39 185 249
Low LBAHigh LPI
High LBALow LPI
10 233.2 14.66 4.64 205
16 202.8 24.93 6.23 171
251
246
Low LBALow LPI
20 180.6 29.00 6.48 108 224
In Figures 4, 5, 6, and 7 results are displayed to facilitate pre-
sentation of the data. Although it may look as if a two-way design was
used, these results are the results from the one-way ANOVA presented in
Tables 41, 44, and 47. Presentation in this manner helps to see how
the categories were formed.
126
I
(01.O)
o0)
3>L.CDCo
>
Traditional Leadership - LBA
^igh Low
Category 1 Category 2
Hinh Mean - 225S.D. = 19.61
N = 20
Mean = 233.2
S.D. = 14.66
N = 10
Category 3 Category 4
Low Mean = 202.8
S.D. = 24.93
N = 16
Mean = 180.6
S. D. = 29N = 20
Figure 4. Mean Scores of PAVE for High and Low RatedManagers Rated on the LPI and LBA
Homogeneity of Variance Assumption
In order to performa a multiple comparison test to determine which
means are significantly different, the assumption of homogeneity of
variance must be met. This assumption was tested at the .05 level of
significance. The Bartlett-Box test was employed and the results are
presented in Table 42.
The homogeneity of variance assumption has not been rejected and
it can be assumed that there is no significant difference in the vari-
ances for each category.
127
TABLE 42
Test for Homogeneity of Variance; lba and LPI
F P
Categories 1-4 1.993 .113
Analysis of Variance
The analysis of variance is reported as significant in Table 43
Therefore, the hypothesis that the four means are equal is rejected.
TABLE 43
Analysis of Variance Table for LBA and LPI
Source df SS MS F p
Between groups 3 27607 9202 16.52 .0000
Within groups 62 34543 557
Total 65 62150
To further identify the source of differences among means,
Duncan's Multiple Range Test was performed. The .05 level of signifi-
cance was used for the multiple comparison procedure. This procedure
indicated significant differences between all categories except cate-
gories 1 and 2. Figure 5 displays these differences. To illustrate
these differences a value of A, B, or C has been assigned to the mean
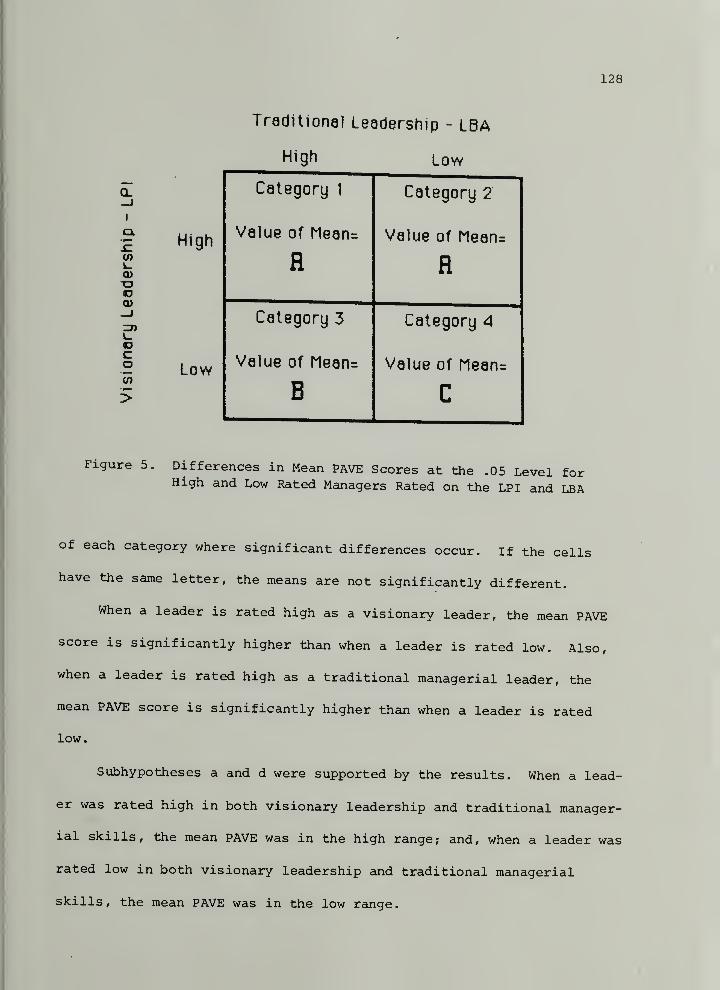
128
I
a,
!E
<DTD«D0)_J3)I-
co
>
High
Low
Traditional Leadership - LBA
High Low
Category 1
Value of riean=
R
Category 2
Value of Mean=
fl
Category 3
Value of riean=
B
Category 4
Value of Mean=
c
Figure 5. Differences in Mean PAVE Scores at the .05 Level forHigh and Low Rated Managers Rated on the LPI and LBA
of each category where significant differences occur. If the cells
have the same letter, the means are not significantly different.
When a leader is rated high as a visionary leader, the mean PAVE
score is significantly higher than when a leader is rated low. Also,
when a leader is rated high as a traditional managerial leader, the
mean PAVE score is significantly higher than when a leader is rated
low.
Subhypotheses a and d were supported by the results. When a lead-
er was rated high in both visionary leadership and traditional manager-
ial skills, the mean PAVE was in the high range; and, when a leader was
rated low in both visionary leadership and traditional managerial
skills, the mean PAVE was in the low range.
129
Subhypotheses b and c were not supported. Subhypotheses b and c
assumed an equal importance for visionary leadership skills and tradi-
tional leadership skills in relation to peak performing organizations.
The results demonstrate that visionary leadership is more strongly
related to peak performance.
When a manager was rated high in visionary leadership behaviors,
the mean PAVE score was in the high range, regardless of whether that
manager was rated high or low in traditional managerial behaviors.
When a manager was rated low in visionary leadership behaviors,
the ratings on traditional managerial behavior did affect the mean PAVE
score. In this case, managers who were rated high in traditional mana-
gerial behaviors showed a mean PAVE score for their work unit in the
middle range; managers who were rated low in traditional managerial
behavior showed a mean PAVE score for their work unit in the low range.
The Leader Behavior Questionnaire-Visionaryand Leader Behavior Analysis
For purposes of classification, managers who were rated in the top
35 percent of the entire population were considered "high" and managers
who were rated in the bottom 35 percent of the entire population were
considered "low." The four categories described above were formed by
the four possible combinations of high-rated and low-rated managers.
The mean PAVE score, standard deviation, and number of each category
are reported in Table 44 and are displayed in Figure 6.
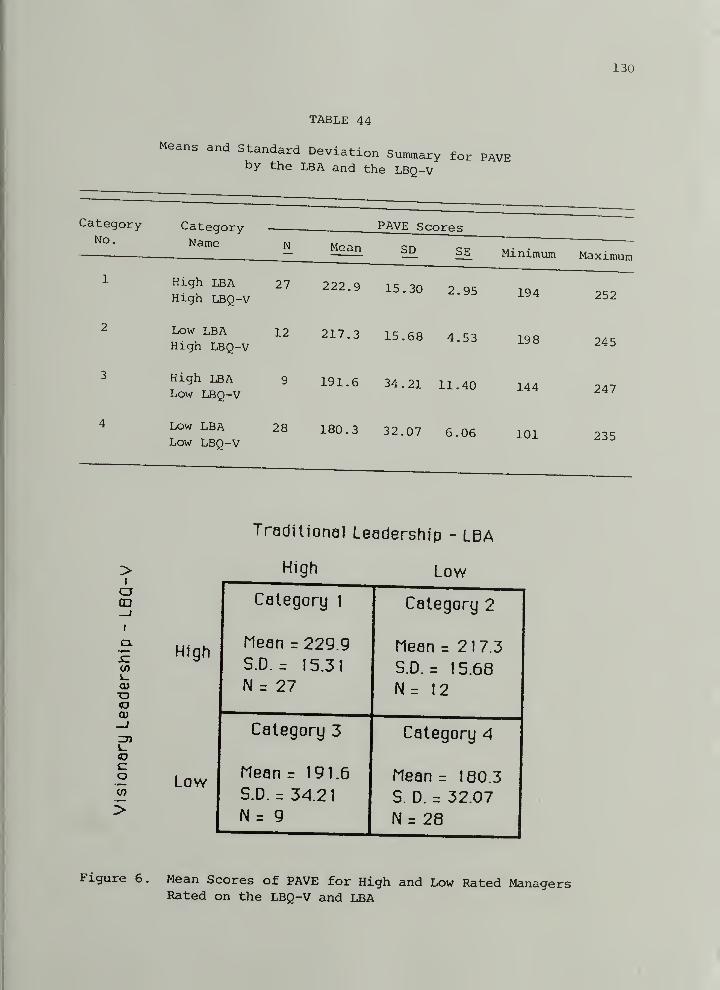
130
TABLE 44
Means and Standard Deviation Sununary for PAVEby the LBA and the LBQ-V
Category Category PAVE ScoresNo
. Name N Mean SD SE Minimum Maximum
High LBA 27 222.9 15.30 2 95 194High LBQ-V 252
Low LBA 12 217.3 15.68 4.53 198High LBQ-V " "^^^ 245
High LBA 9 191.6 34.21 11.40 144 247Low LBQ-V
Low LBALow LBQ-V
28 180.3 32.07 6.06 101 235
>Ia—I
I
cx
.ECO
"O<o
_i
i_
CoCO
>
High
Low
Treditiona] Leadership - LBA
High Low
Category 1
Mean r 229.9
S.D. = 15.31
N = 27
Category 2
Mean = 217.3
S.D. = 15.68
N= 12
Category 3
Mean r 191.6
S.D. = 34.21
N = 9
Category 4
Mean = 180.3
S. D. = 32.07
N = 28
Figure 6
.
Mean Scores of PAVE for High and Low Rated ManagersRated on the LBQ-V and LBA
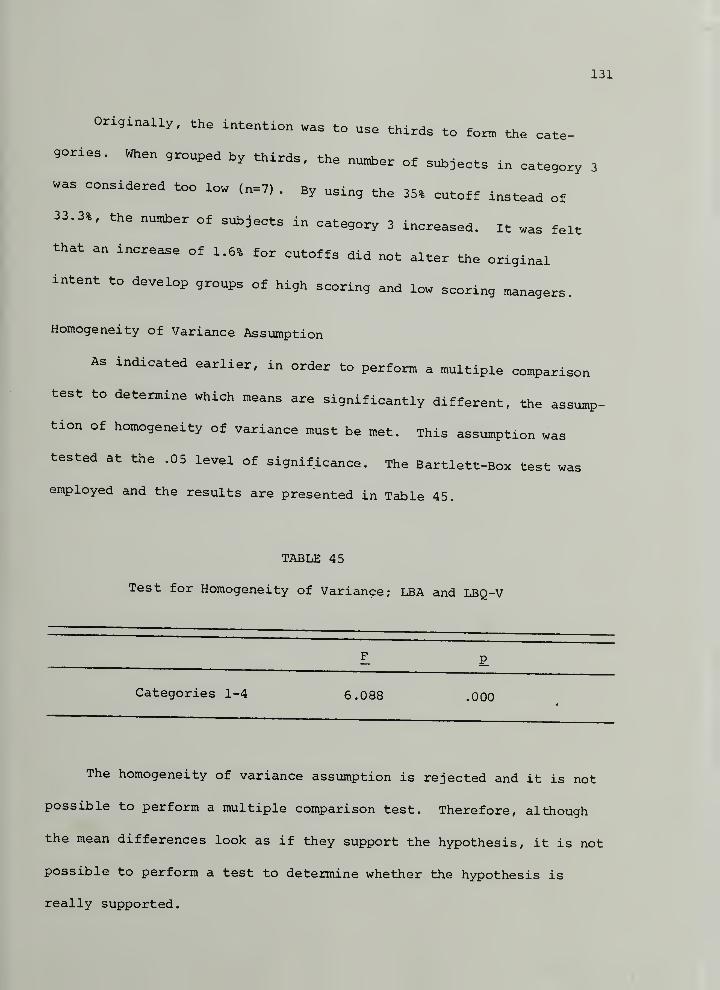
131
originally, the intention was to use thirds to form the cate-
gories. When grouped by thirds, the nun^er of subjects in category 3
was considered too low (n=7) . By using the 35% cutoff instead of
33.3%, the number of subjects in category 3 increased, it was felt
that an increase of 1.6% for cutoffs did not alter the original
intent to develop groups of high scoring and low scoring managers.
Homogeneity of Variance Assumption
AS indicated earlier, in order to perform a multiple comparison
test to determine which means are significantly different, the assump-
tion of homogeneity of variance must be met. This assumption was
tested at the .05 level of significance. The Bartlett-Box test was
employed and the results are presented in Table 45.
TABLE 45
Test for Homogeneity of Variance; LBA and LBQ-V
Categories 1-4 6.088 .000
The homogeneity of variance assumption is rejected and it is not
possible to perform a multiple comparison test. Therefore, although
the mean differences look as if they support the hypothesis, it is not
possible to perform a test to determine whether the hypothesis is
really supported.
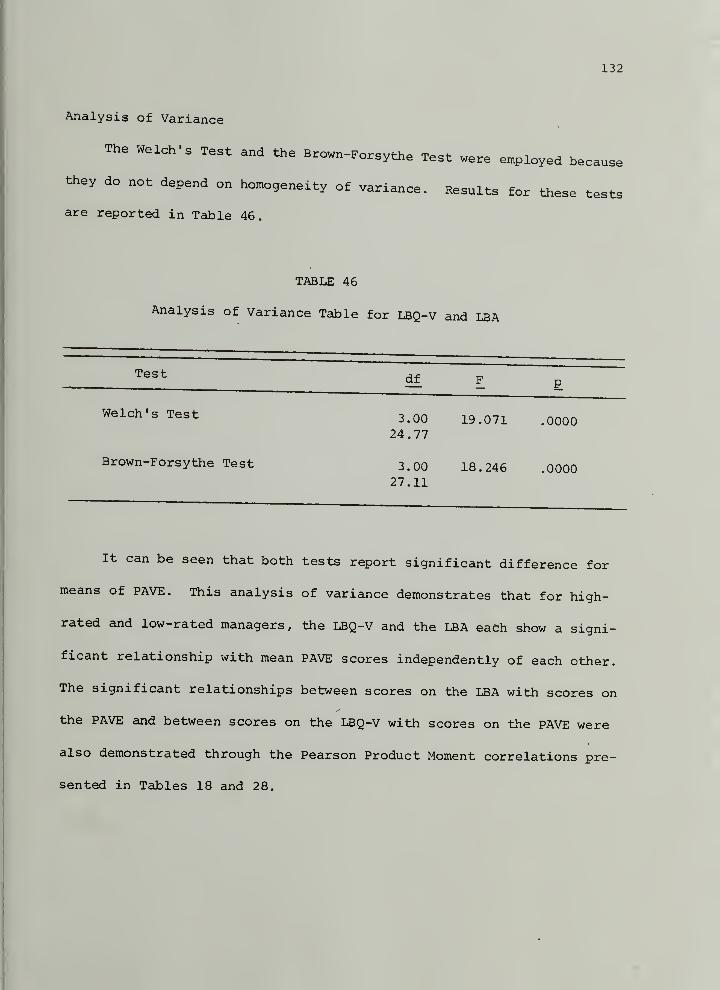
132
Analysis of Variance
The Welch's Test and the Brown-Forsythe Test were employed because
they do not depend on homogeneity of variance. Results for these tests
are reported in Table 46.
TABLE 46
Analysis of Variance Table for LBQ-v and LBA
Test df
Welch's Test
Brown-Forsythe Test
3.0024.77
3.0027.11
19.071
18.246
.0000
.0000
It can be seen that both tests report significant difference for
means of PAVE. This analysis of variance demonstrates that for high-
rated and low-rated managers, the LBQ-V and the LBA each show a signi-
ficant relationship with mean PAVE scores independently of each other.
The significant relationships between scores on the LBA with scores on
the PAVE and between scores on the LBQ-V with scores on the PAVE were
also demonstrated through the Pearson Product Moment correlations pre-
sented in Tables 18 and 28.
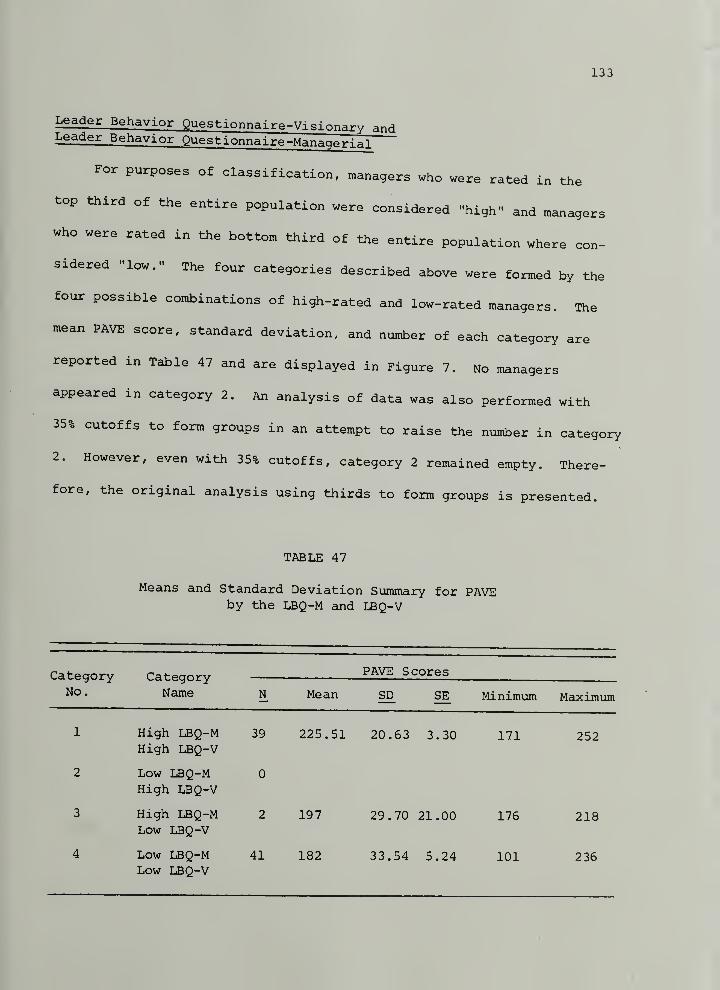
133
Leader Behavior Questionnaire-Visionary andLeader Behavior Questionnaire-Manageri^
For purposes of classification, managers who were rated in the
top third of the entire population were considered "high" and managers
who were rated in the bottom third of the entire population where con-
sidered "low." The four categories described above were formed by the
four possible combinations of high-rated and low-rated managers. The
mean PAVE score, standard deviation, and number of each category are
reported in Table 47 and are displayed in Figure 7. No managers
appeared in category 2. An analysis of data was also performed with
35% cutoffs to form groups in an attempt to raise the number in category
2. However, even with 35% cutoffs, category 2 remained empty. There-
fore, the original analysis using thirds to form groups is presented.
TABLE 47
Means and Standard Deviation Summary for PAVEby the LBQ-M and LBQ-V
Category Category PAVE Scores
Name N Mean SD SE Minimum Maximum
1 High LBQ-M 39 225.51 20.63 3.30 171 252High LBQ-V
2 Low LBQ-M 0
High LBQ-V
3 High LBQ-M 2 197 29.70 21.00 176 218Low LBQ-V
4 Low LBQ-M 41 182 33.54 5.24 101 236Low LBQ-V
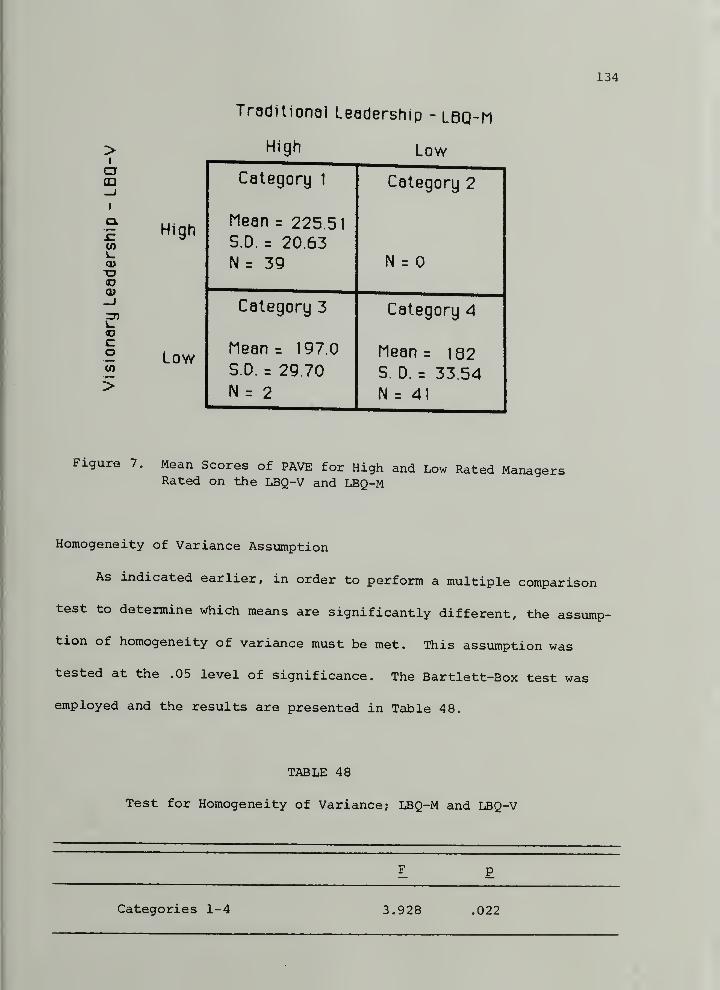
134
TraditionQl Leadership - LGQ-M
>I
or(D_j
I
a.
V)
a>"O4D<U-J=nV-4DCo
>
High Low
Category 1 Category 2
HighMean = 225.51
N = 39 N = 0
Category 3 Category 4
LowMean = 197.0
S.D. = 29.70Mean _ ]Q2S. D. = 33.54
N = 2 N = 41
Figure 7. Mean Scores of PAVE for High and Low Rated ManagersRated on the LBQ-V and LBQ-M
Homogeneity of Variance Assiamption
As indicated earlier, in order to perform a multiple comparison
test to determine which means are significantly different, the assump-
tion of homogeneity of variance must be met. This assumption was
tested at the .05 level of significance. The Bartlett-Box test was
employed and the results are presented in Table 48.
TABLE 48
Test for Homogeneity of Variance; LBQ-M and LBQ-V
F P
Categories 1-4 3.928 .022
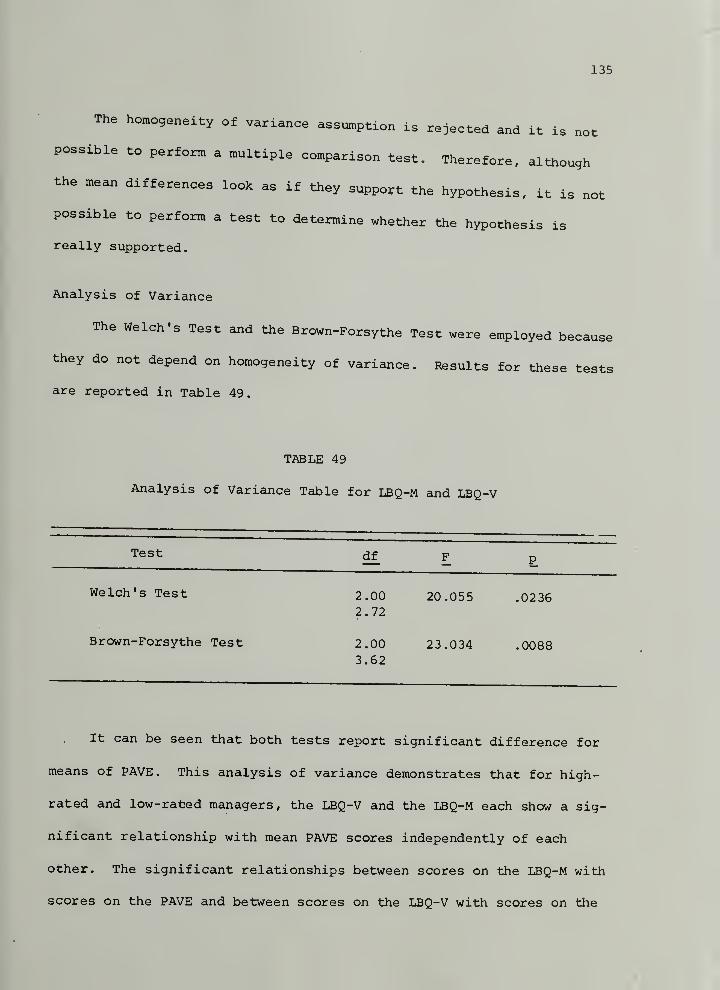
135
The homogeneity of variance assumption is rejected and it is not
possible to perform a multiple comparison test. Therefore, although
the mean differences look as if they support the hypothesis, it is not
possible to perform a test to determine whether the hypothesis is
really supported.
Analysis of Variance
The Welch's Test and the Brown-Forsythe Test were employed because
they do not depend on homogeneity of variance. Results for these tests
are reported in Table 49.
TABLE 49
Analysis of Variance Table for LBQ-M and LBQ-V
Test F p
Welch's Test 2.00 20.055 .02362.72
Brown-Forsythe Test 2.00 23.034 .00883.62
It can be seen that both tests report significant difference for
means of PAVE. This analysis of variance demonstrates that for high-
rated and low-rated managers, the LBQ-V and the LBQ-M each show a sig-
nificant relationship with mean PAVE scores independently of each
other. The significant relationships between scores on the LBQ-M with
scores on the PAVE and between scores on the LBQ-V with scores on the
136
PAVE were also demonstrated through the Pearson Product Moment corre-
lations presented in Tables 22 and 28.
Because category 2 is empty, it is not possible to use this data
to examine hypothesis 3.
It is interesting to note that the numbers in categories 1 and 4
are much higher than in categories 2 and 3. Categories 1 and 4
describe managers that are rated as high on both instruments or low on
both instruments. They contained a total of 80 managers. Categories 2
and 3 describe managers rated high on one instrument and low on the
other. They contained a total of two managers. This same skewed pat-
tern was also evident with the other combinations of instruments
reported earlier although not to this degree. For the LBA and LPI
,
categories 1 and 4 contained a total of 40 managers while categories 2
and 3 contained only a total of 26 managers. For the LBA and LBQ-v,
categories 1 and 4 contained a total of 56 managers while categories 2
and 3 contained only 21 managers.
Summary of Results
Hypotheses I and II were supported by the results of this study.
A significant relationship was observed between subordinates' ratings
of the effectiveness of their immediate superiors ' traditional manager-
ial skills and subordinates ' perceptions of the level of peak perfor-
mance of the work unit for which the manager is responsible. A signif-
icant relationship was also observed between subordinates ' ratings of
the effectiveness of their immediate superiors' visionary leadership and
137
subordinates, perceptions of the level of peak performance of the work
unit for which the manager is responsible.
The correlations for three of the leadership instruments (the
LBQ-M, the LBQ-V, and the LPI) with perceived peak performance were
somewhat stronger than for the LBA. Two explanations are offered.
First, there were twice as many respondents who completed the LBA than
the other leadership questionnaires. Statistically, as the number of
subjects increases, lower correlations become more meaningful. There-
fore, while the r-score for the LBA was lower when compared to the
r-score for the other instruments, the correlations are considered as
strong and as significant. Second, the LBA as an instrument is dif-
ferent from the other three instruments. The other three instruments
are linear in nature; the more one exhibits a certain behavior, the
higher he or she is rated and the score is a direct sum of the ratings
The general principle of linear instruments is that more equals better
The LBA is a situational instrument. Situations are described and the
appropriate behavior given the situation is rated. More is not neces-
sarily better because an additional variable, the diagnosis of the
situation, needs to be accounted for. The answers are weighted from
poor to excellent rather than using a sum of the ratings. Third, the
other instruments describe general behaviors while the LBA asks one to
predict what someone else will do in a given situation. Specifically,
the LBA measures one's ability to diagnose what's needed in a given
situation according to the theoretical model of traditional management.
One must consider to what extent it is possible to guess what someone
138
else will do in a particular given situation, it is much easier to
guess what behaviors someone else will generally tend to exhibit, which
is what the other three instruments measure. Therefore, it should be
noted that all four leadership instruments are considered to demon-
strate significant correlations with the PAVE.
An unanticipated result was that for three of the four leadership
instruments, the relationship between senior level managers' effective
leadership and perceptions of peak performance was markedly higher than
for middle level managers and first line managers. Speculation as to
possible reasons for this higher correlation will be provided in Chap-
ter VI
Another unanticipated result was that the Commitment Scale of the
PAVE consistently showed weak or no correlations with the leadership
instruments. The exceptions were for first line managers who were
rated with the LBQ-M and with the LBQ-v and for senior level managers
who were rated with the LPI . Speculation as to possible reasons for
this weaker correlation will be provided in Chapter VI. All other
scales consistently showed significant, strong positive correlations
with the leadership instruments. The scales that generally correlated
the strongest were the Performance Scale, including the two subscales
Productivity and Team Effectiveness, and the Empowerment Scale.
Support for Hypothesis III was mixed. Subhypotheses a and d were
supported by the results- When a leader was rated high in both vision-
ary leadership and traditional managerial skills, the mean PAVE was
139
in the high range, and, when a leader was rated low In both visionary
leadership and traditional managerial skills, the mean PAVE was in the
low range.
Subhypotheses b and c were generally not supported. Subhypotheses
b and c assumed an equal importance for visionary leadership skills and
traditional leadership skills in relation to peak performing organiza-
tions. Because the variance between categories was so uneven, it was
possible to analyze the data using only one of the three combinations
of traditional and visionary leadership instruments. There was a ten-
dency on all three combinations of traditional and visionary leader-
ship instruments for managers to be rated as high on both instruments
or low on both instruments rather than high on one and low on the
other. This pattern contributed to the large variance between cate-
gories .
The results of the one statistical analysis that could be per-
formed to test the subhypotheses demonstrated that visionary leadership
is more strongly related to perceived peak performance than traditional
leadership is.
When a manager was rated high in visionary leadership behaviors,
the mean PAVE score was in the high range, regardless of whether that
manager was rated high or low in traditional managerial behaviors.
When a manager was rated low in visionary leadership behaviors,
the ratings on traditional managerial behavior did affect the mean PAVE
score. In this case, managers who were rated high in traditional mana-
gerial behaviors showed a mean PAVE score for their work unit in the
140
middle range; managers who were rated low in traditional managerial
behavior showed a mean PAVE score for their work unit in the low range.
According to the results of this study, the effectiveness of the
managerial skills (relationship-oriented behavior and task-oriented
behavior) of the leader is important in relation to workers' percep-
tions of the peak performance level of the organization only when the
manager is weak in visionary leadership behaviors. Effective visionary
leadership relates to a high level of peak performance no matter what
the level of managerial skill. However, when one is not an effective
visionary leader, then effective managerial skills are important, mthis case, effective managerial skills relate to a moderate level of
peak performance. Ineffective managerial skills relate to a low level
of peak performance
.
CHAPTER VI
DISCUSSION AND CONCLUSIONS
This chapter presents the conclusions of the study, in the first
section the study is summarized. The discussion incorporates the find-
ings of this study and compares them to the studies and theories re-
ported in the literature. Second, the limitations of these findings
are discussed. Third, the potential implications of leadership theory
are explored. The final section suggests some directions for future
research.
Summary and Findings of the Study
The central purpose of this study was to investigate the relation-
ship between leadership behaviors (both traditional and visionary) and
perceptions of specific indicators typical of peak performing organiza-
tions. The concept of visionary leadership is relatively new in the
field of OD; also the concept of peak performing, or excellent, organi-
zations is relatively new in the field. Because these concepts are new
and exciting, many theorists and practitioners have written about these
concepts and they have been described in the literature. However, they
have not been adequately tested. Specifically this study examined the
relationship between workers' perceptions of their manager's tradi-
tional leadership behaviors and perceptions of peak performance of the
work unit. This study also examined the relationship between workers'
perceptions of their manager's visionary leadership behaviors and
142
perceptions of peak performance of the work unit. Finally, the rela-
tionship between combinations of perceptions of traditional leadership
behavior and visionary leadership behavior with perceptions of peak
performance of the work unit were examined. The study examined leader-
ship behaviors using the perceptions of subordinates because it was
believed that the subordinate's viewpoint would be more objective than
the manager's self perceptions.
A secondary intent of this study was to develop an instrument to
measure workers ' perceptions of the indicators typical of peak perform-
ing organizations based on the current literature. No adequate measure
previously existed. Data obtained from the responses to this question-
naire was subjected to statistical evaluation.
Participants in this study consisted of 340 employees in a large
private-sector company who rated their immediate superiors (managers)
on leadership behaviors. The 129 managers who were rated represented
all levels of management within the organization. The Leader Behavior
Analysis (LBA) and Leader Behavior Questionnaire-Managerial (LBQ-M)
were used to measure the traditional managerial skills of task-oriented
and relationship-oriented behaviors. The Leadership Practices Inventory
(LPI) and Leader Behavior Questionnaire-Visionary (LBQ-V) were used to
measure visionary leadership behaviors. All participants were asked to
complete the LBA; half were asked to complete the LPI and half the LBQ.
All participants also completed the PAVE: Excellent Organizational
Practices Index designed to assess workers' perceptions of their work
unit's level of peak performance.
143
Major Findings
There were three major findings in this study. First the findings
and their importance will be presented briefly. Next, the major find-
ings, unexpected findings and other interesting findings will be
presented and discussed in greater detail.
Impact of Visionary Leadership
The first major finding was: workers who rate their leaders as
strong in visionary leadership also report their perceptions of the
level of peak performance of the work unit as high. According to
workers' perceptions, visionary leadership and peak performance of the
work unit vary together. This finding is important because it is the
result of one of the first attempts to quantify and measure the rela-
tively new concept of visionary leadership. This finding strongly
supports the importance of the concept of visionary leadership and it
demonstrates a clear relationship between perceptions of visionary
leadership and peak performance of the work unit.
Impact of Traditional Leadership
The second major finding was: workers who rate their leaders as
strong in traditional managerial skills also report their perceptions
of the level of peak performance of the work unit as high. According
to workers' perceptions, traditional managerial skills and peak perfor-
mance of the work unit also vary together. This finding is important
because it makes a case that the traditional concepts of leadership
continue to play an important role in relation to performance of the
144
work unit, in other words, although the new concept of visionary
leadership is important, the traditional concepts of management are
also important.
Interaction of Visionary Leadershipand Traditional Leadership
The third major finding was: workers who rate their leaders as
strong in visionary leadership report their perceptions of the level of
peak performance of the work unit as high no matter whether the lead-
ers' traditional managerial skills are rated as high or low. Workers
who rate their leaders as weak in visionary leadership but high in
traditional managerial skills report their perceptions of peak perfor-
mance level of the work unit as moderate. Workers who rate their
leaders as weak in visionary leadership and weak in traditional mana-
gerial skills report their perceptions of the peak performance level
of the work unit as low. This is a very important finding because it
examines the relationship between visionary leadership and traditional
management. As noted above, this finding is the result of one of the
first studies to examine the concepts of visionary leadership and tra-
ditional management together. This finding indicates that it is pos-
sible to be both a visionary leader and a good manager. Currently
controversy exists in the literature regarding this matter (e.g.,
Zaleznik, 1977; Bennis, 1984; Bass, 1985). Another area of controversy
which this finding sheds light on is whether visionary leadership is
better than traditional management (e.g., Burns, 1978; Bennis and
Nanus, 1985) . This finding indicates that the importance of good
145
managerial skills is overshadowed when strong visionary leadership is
present. The importance of traditional management emerges when strong
visionary leadership is not present.
Leadership and Organizational Peak Performance
As noted above, the first two major findings strongly support the
importance of both visionary leadership and traditional management.
All correlations showed a significant positive relationship between the
effectiveness of the manager's leadership behaviors and the workers'
perceptions, of the work unit's peak performance level. In other words,
both effective traditional managerial skills correlated significantly
with peak performance and effective visionary leadership correlated
significantly with peak performance.
The results of this study shed some light on the controversy over
the effectiveness of each leadership model. Some proponents of
visionary leadership (e.g., Bass, 1985; Burns, 1978) claim the managers
who operate from the traditional leadership perspective are limited.
These authors claim the difference lies in the focus and intention
of the leader. Visionary leaders lead. They create and articulate a
vision and move towards it. Subordinates follow because the vision
resonates with their own sense of what they want or believe in. In
contrast, traditional managers focus on controlling and manipulating
factors (including people) in order to produce desired results. These
authors assert visionary leadership is future-oriented and empowering
while traditional leadership is present-oriented and limiting. Thus,
they claim that only visionary leadership produces peak performance of
146
the organization and that it is not possible for a leader to be both
visionary and traditional managerial.
Other theorists (e.g., Sashkin, 1985; Bennis, 1984) take a differ-
ent viewpoint. They claim that not only is it possible to be both
visionary and traditional, it is essential for a good leader to be
both. They claim that not only is it important to keep one's attention
on the future but also to attend to managing the presetit. The results
of this study support this viewpoint.
Position in Organizational Hierarchy
An important unexpected finding was that when managers were
grouped by their position within the organizational hierarchy, the
correlations for leadership with peak performance of the work unit
varied. The correlations were very strong for senior level managers
when using the LPI, LBQ-V, and LBQ-M. These correlations were stronger
compared to the moderate correlations for middle level and first line
managers. On one instrument, the LBQ-M, the middle managers showed
lower correlations than first line managers.
One must ask the question: why would correlations for senior
level managers be so much higher? It can be assumed that this is not a
statistical aberration because the results were consistent for three of
the four instruments. Why the LBA might not show the same results has
been discussed in Chapter V. The researcher postulates that the dif-
ference lies with the issue of organizational structure. Senior level
managers are in a better position to create structure: to define rules
and to set policies. They have more freedom and power within the
147
organization to act on their values and beliefs, not being as confined
by the rules and policies of others. For this reason, when a senior
level manager has the inclination to behave as a visionary leader;
she or he is empowered to act as one and to be perceived by others as
one,
The literature offers little to support or contradict this view-
point. Some authors have written about the difference between
"leaders" and "managers" (Zaleznik, 1977; Tichy and Devanna, 1986).
These authors describe "leaders" as people who can mobilize the
organization and increase the peak performance level significantly.
They describe "managers" as people who concentrate their efforts on
managing and controlling subordinates in order to maintain the status
quo. They describe managers as having less of a relationship with
high performance of the work unit. In other words, they suggest a
significant and strong correlation between some (but not all) leader-
ship behaviors and peak performance. However, these authors usually
discuss these differences in terms of personality and behavior and not
in terms of one's level within the organization or the organization's
influence on the manager. Most studies of the leaders who do impact
peak performance have been of senior level managers only (e.g., Bennis
and Nanus, 1985) . The question of whether hierarchical position within
the organization is related to the leadership behaviors which promote
peak performance has not been explored to any extent and little evidence
exists to support any conclusions.
148
The questions the results of this study raise are: does lower
organizational position constrict one's ability to exhibit these
behaviors? Are middle managers literally stuck in the middle? Does a
higher position enable leaders to exhibit these behaviors? The
results of this study offer one piece of evidence that suggests at
least there is a stronger and more direct relationship between effec-
tive leadership behaviors and perceptions of peak performance of the
work unit when the leader is positioned high in the organizational
structure. If it is true that the managers at the top of the organiza-
tional hierarchy can be more effective because they have more power,
then the concept of empowerment emerges even more strongly as a way to
enhance peak performance of the organization.
Correlations of Scales
Other interesting findings concern the correlations for scales of
the PAVE with the leadership instruments. Although all scales consis-
tently showed significant correlations, some correlations were stronger
than others. Performance (including its subscales Productivity and
Team Effectiveness) consistently produced stronger correlations than
the other scales. Empowerment also produced stronger correlations
most of the time. The next stronger correlating scale was Alignment.
In order to examine the reasons for these stronger correlations it
is necessary to review the focus of these scales. The Performance
scales question the level of perceived effectiveness of the work unit,
the process of achieving results. Empowerment and Alignment also ques-
tion aspects of how results are achieved. Inspiration and Commitment
149
question the feeling tone of the workers in regards to the goals and
the work of the unit, it might be postulated that the effect of
leadership accounts for more of the variance associated with the pro-
cess of achieving results than with the level of positive feelings
about the work. Although the correlations for all scales were signifi-
cant, less of the variance was accounted for with the feeling tone
scales. This was most apparent with the scale of Commitment which
tended to show weak correlations; a few times the correlations were
not significant. It might be postulated that there is a problem with
the scale itself; however 25% of the time, the scale did correlate at
the same strength as the other scales. This inconsistency in correla-
tions leads one to suspect that the scale is relatively sound and
weaker correlations exist because other factors in addition to leader-
ship affect the level of feeling tone. The feeling tone scales might
be more susceptible to the influence of other factors in addition to
leadership such as organizational norms and relationships among
employees. Also, when messages about the vision and the procedures for
achieving it are mixed or not connected, the feeling tone scales may
be more vulnerable (e.g., lead to skepticism) . Clearly the importance
of the concepts of producing results and empowering workers for leader-
ship have emerged strongly. Further investigation is warranted.
Other interesting findings concern the correlations for the scales
of the leadership instruments with the PAVE. Again the PAVE scale of
Commitment tended to correlate the least with the different scales.
However, the correlation on the LBQ-M was much stronger for the
150
relationship-oriented dimension than for the task-oriented dimension.
These correlations support the postulation discussed above of the vari-
able Of relationships generally affecting the feeling tone scales more
strongly.
All scales of the LPI showed moderately strong correlations with
the PAVE. However, when the correlations of scales of the LPI with
scales of the PAVE were reviewed, consistently stronger correlations
were displayed for the scale Enabling Others to Act with the PAVE
scales of Productivity (and its subscales) and Empowerment. It would
be expected that the empowerment scale of the LPI would correlate high-
ly with the empowerment scale of the PAVE. Again the importance of the
concepts of producing results and empowering workers has emerged
strongly.
Combinations of Traditional and Visionary Leadership
The third major finding of the study addresses the relationship
between combinations of visionary and traditional managers with percep-
tions of peak performance of the work unit. Only managers who were
rated high (upper third) or low (lower third) on each leadership ques-
tionnaire were included. Four managerial categories were developed:
(1) high visionary/high traditional, (2) high visionary/low tradi-
tional, (3) low visionary/high traditional, and (4) low visionary/low
traditional. The analysis was r\an using each possible combination of
leadership questionnaires: LBA/LPI, LBA/LBQ-V, and LBQ-M/LBQ-V. The
intent was to examine how each managerial category related to
151
perceptions of the peak performance level of the work unit as n,easured
by the PAVE.
Analysis indicated a significant relationship between leadership
behaviors and peak performance level when managers were rated with each
instrument separately. These results correspond with the results of
the correlations described earlier. Only one combination, the LBA/LPI,
could be analyzed statistically to determine whether the differences
among categories were significant. The results of this analysis showed
that category 1 (high visionary/high traditional) and category 2 (high
visionary/low traditional) had a mean PAVE in the high range and that
these categories were not significantly different from each other.
Category 3 (low visionary/high traditional) had a mean PAVE in the
middle range and was significantly different from the others. Category
4 (low visionary/low traditional) had a mean PAVE in the low range and
was significantly different from the others.
According to these results, effective visionary leadership relates
to perceived peak performance level of the work unit no matter whether
managerial skills are weak or strong. However, the effectiveness of
the managerial skills of a leader is important in relation to perceived
peak performance level of the work unit only when the manager is weak
in visionary leadership skills. When the manager is an effective
visionary leader, perceived peak performance level tends to be in the
high range. When one is not an effective visionary leader, then mana-
gerial skills are important and relate to a moderate level of perceived
152
peak performance while ineffective managerial skills relate to a low
level of perceived peak performance.
The other two combinations of instruments (LBA/LBQ-v and
LBQ-V/LBQ-M) showed trends that supported the above results. However,
statistical analysis could not be used to verify this trend because the
numbers in some categories were too low. This can be explained partly
because the numbers were reduced greatly when the middle-rated managers
were not included. Also, the numbers in categories 2 and 3 tended to
be lower. It might be that these combinations do not exist as often in
this organization. Generally when managers were rated as high vision-
ary, they were also rated as high traditional manager. Conversely,
when they were rated as low visionary, they were rated as low tradi-
tional manager. Possibly in other organizations such as the military,
it might be possible to find more managers in category 3 who adhere
strictly to rules, tradition, and ths status quo. For one combination,
LBQ-M and LBQ-V, the numbers were so skewed as to make one wonder if
something else might also be affecting this particular combination.
Results for both the LBQ-M and LBQ-V are obtained from questions on one
questionnaire, the LBQ. A central tendency might be operating for siab-
ordinates who rate their managers using this questionnaire to respond
consistently in a direction (high, middle, or low) when choosing
answers
.
Another possible explanation for the lower numbers in categories 2
and 3 , which describe managers rated as high on one instrument and low
on the other, is that these types of managers generally tend not to
153
exist as often as managers who are high on both or low on both. This
explanation supports the viewpoint that not only is it possible to be
both a visionary leader and a traditional manager but also effective
visionary leaders are usually effective in traditional managerial
skills.
In summary, the third major finding is important because it re-
sults from one of the first attempts to examine quantitatively the
relationship between visionary leadership and traditional management.
The finding is somewhat startling because it indicates that although
traditional managerial skills are important, they are most important
only when strong visionary leadership is not present.
The PAVE as a Measure of PerceivedOrganizational Performance
An instrument to measure the variables typical of peak performing
organizations was developed for use in this research study. The ques-
tionnaire made a series of statements about the level of productivity,
the process of obtaining results, and the level of positive feelings
about the work. Respondents were instructed to rate each statement
using a 7 point Likert-type scale ranging from strongly agree to
strongly disagree. Content validity was attempted before use in the
research. The questionnaire was administered to 508 employees of the
large, private sector organization that participated in this study.
Data were used from the 473 employees who answered every question.
These responses were subjected to statistical analysis.
154
A factor analysis indicated five distinguishable scales, one with
two subscales. Internal reliabilities were high for all scales and for
the total questionnaire. Correlations for all scales with the total
and with each other were significant and strong. The results of these
analyses indicate that the PAVE scales can be considered interrelated
and to constitute one measure. In summary, the PAVE appeared to
accurately measure workers' perceptions of organizational peak perfor-
mance .
Limitations
The correlations for all four leadership instruments with percep-
tions of peak performance are significant and considered strong. As
effective leadership increases, the work unit's peak performance level
increases. However, effective leadership does not account for all of
the variance and apparently other variables not measured also affect
perceptions of organizational peak performance.
One variable not measured or accounted for in this study is struc-
ture or systems-orientation described by Ackerman, Kiefer et al.
Ackerman (19 84) describes a visionary leader as maintaining a "holistic,
total systems perspective, looking after the good of the whole" while
traditional managers focus on components of the organization and do not
see or emphasize "the relationships, dynamics, and process that exist
at the total systems level" (p. 128) . Kiefer and Stroh (1984) assert
that visionary leaders "develop or change structures as needed to sup-
port the vision" (p. 182) . The concept of creating structure that
155
maintains the integrity of the vision is central to the concept of
visionary leadership. The importance of structure is not emphasized
by proponents of traditional managerial theory.
Another variable not measured or accounted for in this study is
the creation of meaning discussed by Smircich (1984) , Weick (1979)
,
et al. These authors claim an essential behavior of visionary leaders
is to create a meaning from events that supports the vision; that a
visionary leader interprets events, frames contexts, deals with mul-
tiple realities, and helps subordinates understand events, especially
apparent obstacles, in the context of the vision. Bennis and Nanus
(1985) state, "all organizations depend on the existence of shared
meanings and interpretations of reality which facilitate coordinated
action" (p. 39) . They further assert, "an essential factor in leader-
ship is the capacity to influence and organize meaning for members"
(p. 39) . The concept of interpreting events and creating meaning is
not discussed in traditional management theory.
Another variable that might influence PAVE scores in addition to
the influence of leadership is the pre-existing relationships among
employees and the norms governing those relationships. Only the influ-
ence of the designated leader was measured in this study. Influence of
informal peer leaders and other relationships among employees were not
taken into account.
Finally, the variable of stage of group and organizational devel-
opment was not considered as part of this study. A body of literature
exists which describes a sequence of stages or life cycles
156
organizations go through as they develop (e.g., Adizes, 1979; Kimberly,
1980). OD theorists (e.g., Lacoursiere, 1980; Carew et al . , 1984)
address the changing role of leadership given the stage of the group's
life cycle.
Another point that needs to be considered is that the two instru-
ments used to assess visionary leadership (the LPI and the LBQ-V) are
relatively new and are still in the process of being evaluated and
revised. They do not ask questions concerning some of the characteris-
tics of visionary leadership described in Chapter II. For example,
they do not question whether the leader balances use of intuition and
rational, analytic thought. They do not question to what extent the
leader helps subordinates understand the meaning of events in a way
that enables them to continue in their efforts to create the vision.
Other examples would be the visionary leader's unswerving belief in the
vision and the ability to maintain a total system's perspective. It
may prove in the future that these or other factors not listed are
important dimensions of visionary leadership behavior that can account
for more of the variance.
The PAVE is also new and presents some limitations. It has not
been tested against objective measures of peak performance; it has not
been tested beyond the organization used in this current study; and it
has not been tested to see how age of the respondent affects her or his
responses
.
The subjects of this study were primarily Caucasians below the
age of 45 . The managers rated were primarily male at the senior level
157
and female at the first line level. The employees from only one
organization were included in the study. The results of this study are
not presumed valid for people from other ethnic backgrounds. Further-
more, the findings are not presumed to make any statements concerning
differences in male and female leadership behaviors. And because only
one organization was included, the generalizability of the findings are
limited.
Because this study is one of the first of its nature, it is impor-
tant to view it as a preliminary study. The results need to be
retested in other settings using the same and different methodologies
in order to make conclusive statements. It is important to replicate
and verify these results because they have some important implications
for leadership theory and training.
Implications
This section first contrasts the current views of visionary
leadership and relates them to the results of the study. It then pro-
vides the context for viewing visionary leadership in terms of certain
organizational needs that must be met and forces that must be addressed
in order to achieve a high level of performance for the organization.
Finally a model is presented that integrates the concept of visionary
leadership into a unified leadership theory. The ideas presented in
this section are based on the results of the study. The thfeoretical
constructs presented were stimulated by the results of the study and
provide an expansion that goes beyond the scope of the study.
158
Visionary Leadership as a New Perspective
Recently theorists have begun to examine the type of leadership
that facilitates peak performance in organizations. This study is one
of the first to examine the subject quantitatively. Most authors who
have written in depth about individuals who have provided this kind of
leadership (e.g., Sorenson's Kennedy, 1966), have described a common
set of characteristics determined through observation and/or inter-
views with a number of these kinds of leaders (e.g., Bennis, 1984;
Kanter, 1983) or have written about the characteristics they believe
these leaders possess, derived from their own experience of the leaders
and their organizations (e.g., Ackerman, 1984; Kiefer and Stroh, 1984):
Different labels are ascribed to this new view of leadership such as
"charismatic," "visionary," and "transformational." Because this
sense of leadership is so new, current descriptions share much in
common but are not unified. There exists no agreed upon definition of
this type of leadership or framework for understanding it.
Many of these authors (e.g., Bennis, Zaleznik, Ackerman, Kanter,
and Bass) imply that there are two types of leaders. One type (often
called "manager" or "traditional") coordinates and controls activities
within the organization. This person tends to focus on present-time
events. The other type (often called "leader") sets the course for the
organization. This person is future-oriented. Certain sets of behav-
iors and personality traits are ascribed to each type. Most imply that
the manager seeks to control and maintain the status quo and the leader
159
seeks/responds to the need for change, it is these two sets of leader
behaviors that were examined in this study.
Some theorists see the differences as immutable; that certain
types of personalities naturally fall into each category; that basic-
ally there are two types of people in this world (e.g., Zaleznik,
1977) . These authors seem to feel that neither type is better than
the other and that organizations need both types (e.g., Bennis, 1984).
The current study did not examine personalities but results did support
the idea that both types of leadership are important and relate signi-
ficantly to workers' perceptions of peak performance for the organiza-
tion. The evidence, however, suggests that visionary leadership is the
more important in relation to perceived peak performance of the organi-
zation.
Other theorists believe that the differences are not immutable and
that leadership is a behavioral process that can be learned (e.g., Tichy
and Devanna, 1986) . These people tend to view changing from one type
of leader behavior to another type as part of a developmental process;
the basic assumption being that leaders operate at a higher developmen-
tal level than managers. Therefore, it is better to be a leader than a
manager. The results of this study also support this concept.
Finally, a third group of theorists view the difference as one of
a paradigm shift (e.g., Smircich, 1983; Kanter, 1983) that is related
to how one defines reality. These people believe that the shift is
related specifically to how one views the nature of "control" and
"change." They assert that the priority for leadership should be
160
placed on "managing meaning" associated with changing events rather
than a fruitless attempt to "control" the organization. This study
did not examine the role of the leader in creating meaning and there-
fore is unable to make inferences regarding this viewpoint. However,
the results of this study do suggest that this new perspective of
leadership, called visionary leadership in this study, is indeed a
powerful concept in relation to perceived peak performance in organiza-
tions and is an important concept to integrate into leadership theory.
A New Model of Leadership Theory
After examining the results of this study, including what vari-
ables were and were not included in the study, the researcher has
developed a model for integrating the concept of visionary leadership
into the larger framework of leadership theory. In order to present
this model, it is first necessary to examine the needs of the organiza-
tion in relationship to leadership.
The highest observable level of complex systems is the "social
organization" which consists of a collection of individuals acting in
concert, with a consciousness of itself, and with a shared system of
meaning. The organization must have a sense of self and a sense of
meaning (Boulding, 1968) . In other words, the system must have an
identity. Identity consists of the purpose, the set of values, basic
beliefs and needs, the vision of the future, the goals, and the reason
for existence. Identity is what differentiates this level from the
lower levels.
161
Therefore, it follows that one of the roles of leadership must be
to help establish and to maintain an identity for the organization that
promotes its existence. Through the use of language and by the use of
self to demonstrate example, the leader can create a shared vision,
can interpret events and ascribe meaning to support the vision.
However, identity alone is not enough. Family systems theory
proposes that a healthy individual, family system, or group is one
that maintains a balance of homeostasis (maintaining the current
structure, balance of social relationships, and status quo) and morpho-
genesis (flexibility, adaptability, and willingness to change) (Selvini-
Palazzoli et al. , 1978). These concepts (control-oriented vs. change-
oriented) repeatedly echo through the Organizational Development (OD)
leadership literature. Family systems theory maintains that too much
of one or the other generally leads to dysfunction, especially during
periods of developmental transition or periods of crisis.
As OD theory supposes that groups and organizations move through
different stages of development (Lacoursiere , 1980; Carew et al. , 1986;
Kimberly, 1980; Adizes, 1979) , then an organization will need to pos-
sess both homeostasis and morphogenesis in order to make the transi-
tions successfully. Also, given that the fast-paced world we live in
today is volatile and change-oriented , the organization best equipped
to survive will be the one that possesses both homeostasis and morpho-
genesis. It follows, then, that the highly successful leader will
also be one that exhibits both "change-oriented" (morphogenic) and
162
"stabilization-oriented" (homeostatic) behaviors as needed. Figure 8
depicts these elements that a system must possess in order to operate
effectively.
The results of this current study (e.g., high correlations of LBA-
Scale 1 and LPI-ISV Scale with PAVE) support the concept that the lead-
er who promotes peak performance must be able to articulate a vision
Homeostasis
Stabilizatlon-Orlenfaflnn
The creation and Integration
of reliable structures and patterns
(e.g. rules and norms) that maintain
the balances and status quo.
Morphogenesis
Change-Orientation
Seeking change, stimulation, and
growth in relation to both the system and
the environment. Flexibility.
Responding and adapting to change
in the system and in the environment.
Identity
Purpose; sense of self; values, beliefs,
needs; vision, goals; meaning ascribed
to self, others, and events.
Figure 8. Elements a System Must Possess to Operate Effectively
163
of a possible future which inspires members of the organization and
catalyzes change and alignment around the vision and which creates an
atmosphere where people can be their best and do not need to be con-
trolled by policies. (These are morphogenic characteristics.) How-
ever, it is not enough to just articulate a vision, the successful
leader must also be able to institutionalize the change so that pat-
terns, myths, and rituals are created that sustain the vision. The
results of this study (e.g., high correlations of empowerment scales)
suggest that another important role for leadership is to design struc-
tures such as those that empower members of the organization to move
toward the vision. The successful leader must create organizational
structures that support creation of the vision. (These are homeostatic
characteristics.) And the successful leader must be willing and able
to modify structures if/when they hinder creation of the vision. (These
are morphogenic characteristics.) In this way, both types of behaviors
are needed, depending on the situation, the developmental stage of the
organization, and other forces. Furthermore, as discussed in Chapter
II, the successful leader must understand that the concept of total
rational control is an illusion; however, there are times that it is
appropriate to analyze, negotiate, etc. The successful leader relies
on both intuition and rational thought (Ackerman, 1984) . Table 50
displays these morphogenic and homeostatic behaviors in relation to
identity development (vision)
.
As discussed above, the successful leader responds to the system's
needs for identity, morphogenesis, and homeostasis through two types of
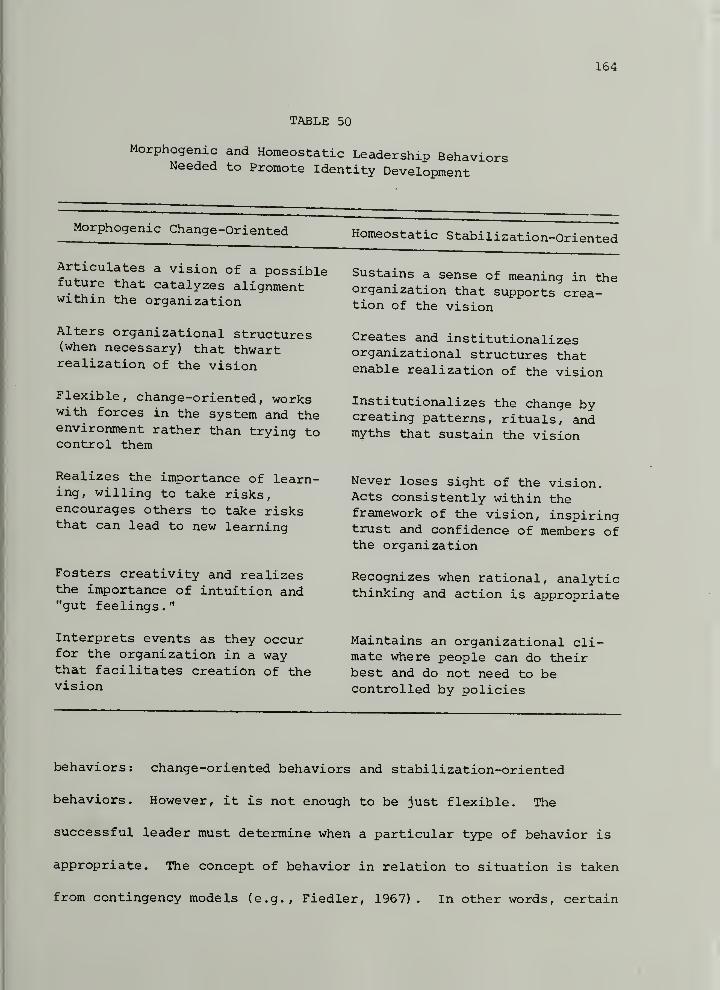
164
TABLE 50
Morphogenic and Homeostatic Leadership BehaviorsNeeded to Promote Identity Development
Morphogenic Change-Oriented
Articulates a vision of a possiblefuture that catalyzes alignmentwithin the organization
Alters organizational structures(when necessary) that thwartrealization of the vision
Flexible, change-oriented, workswith forces in the system and theenvironment rather than trying tocontrol them
Homeostatic Stabilization-Oriented
Sustains a sense of meaning in theorganization that supports crea-tion of the vision
Creates and institutionalizesorganizational structures thatenable realization of the vision
Institutionalizes the change bycreating patterns, rituals, andmyths that sustain the vision
Realizes the importance of learn-ing, willing to take risks,encourages others to take risksthat can lead to new learning
Fosters creativity and realizesthe importance of intuition and"gut feelings."
Interprets events as they occurfor the organization in a waythat facilitates creation of thevision
Never loses sight of the vision.Acts consistently within theframework of the vision, inspiringtrust and confidence of members ofthe organization
Recognizes when rational, analyticthinkijig and action is appropriate
Maintains an organizational cli-mate where people can do theirbest and do not need to becontrolled by policies
behaviors: change-oriented behaviors and stabilization-oriented
behaviors. However, it is not enough to be just flexible. The
successful leader must determine when a particular type of behavior is
appropriate. The concept of behavior in relation to situation is taken
from contingency models (e.g., Fiedler, 1967), In other words, certain
165
Situations or, on a larger scale, forces exist to which the leader mustbe able to respond appropriately.
Many types of external forces (from the environment) impact the
system. And, as there is a give-and-take exchange between the system
and the environment, forces from the system's vision (goal output)
impact the envirionment which in turn impacts the system. Some of
these external-oriented forces are predictable (e.g., marketing fore-
casts, advertising campaigns, human and technological growth and
development). Some of the external-oriented forces are unpredictable
(e.g., new competition, an innovation that suddenly makes a product or
method obsolete, a nuclear accident at Chernobyl)
.
There are also internal forces (within the system) that determine
appropriate leadership behavior. Some of these forces are predictable
(e.g., stages of group development, level of competence and commitment
of members). Some of the internal forces are unpredictable (e.g., a
member dies, a machine malfunctions) . The types of forces impacting
the leadership are:
1. External-oriented Predicted
2. External-oriented Unpredicted
3. Internal-oriented Predicted
4. Internal-oriented Unpredicted
What emerges is a model of leadership that integrates contingency
models with the new emphasis on managing meaning and identity. When
leadership is viewed in terms of the system's needs, four factors can
be identified that impact leadership behavior:
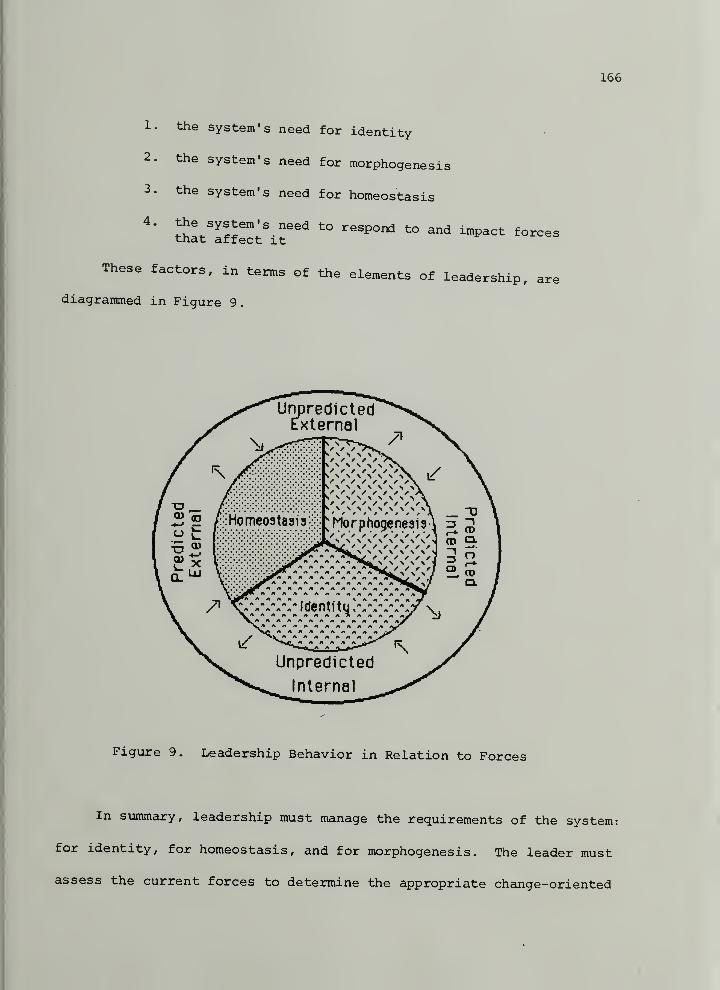
166
1. the system'
s
need
2. the system'
s
need
3. the system'
s
need
4. the system's needthat affect it
These factors, in terms of
diagrammed in Figure 9.
for identity
for morphogenesis
for homeostasis
to respond to and impact forces
the elements of leadership, are
Figure 9. Leadership Behavior in Relation to Forces
In summary, leadership must manage the requirements of the system:
for identity, for homeostasis, and for morphogenesis. The leader must
assess the current forces to determine the appropriate change-oriented
167
or stabilization-oriented behavior in relation to maintenance and pro-
motion of identity of the organization.
AS discussed earlier, many theorists and practitioners have writ-
ten recently about the relationship between leadership and peak
performance of the organization (e.g., Ackerman, 1984; Bass, 1985;
Bennis, 1985; Berlew, 1974; Burns, 1978; Kanter, 1983; Kiefer and
Stroh, 1984; Posner and Kouzes, 1986; Sashkin, 1986; Smircich, 1983;
Tichy and Devanna, 1986; Zaleznik, 1977).
The leadership model presented in this section offers a framework
for understanding these characteristics. Table 51 presents the charac-
teristics of visionary leaders derived from the literature and presents
the aspect of the leadership theory to which it relates: identity,
morphogenesis (change-oriented), homeostasis (stabilization-oriented)
,
or forces affecting the organization.
When leadership is viewed from this perspective some important
concepts emerge. The successful leader is able to understand that true
power comes from giving up control (empowering others) . The successful
leader understands that we each shape our own destinies; that we are
each the primary creative force in our lives. Although we work with
existing forces, our sense of reality is determined by the meaning that
we ascribe to events. The successful leader generates a sense of mean-
ing in the organization that supports the creation of the vision and
the underlying values. The successful leader understands that an
incredible amount of power is generated by a group of people who share

168
TABLE 51
Characteristics of the Visionary Leader in Relationto Leadership Theory
LeadershipCharacteristic
Element ofLeadershipTheory Description
Vision Identity
Morphogenesis
Homeostasis
SelfOrientation
Identity
Homeostasis
'^^^^tes a common, results-orientedvision that is congruent with theneeds and values of the members of theorganization to which he/she is whole-heartedly committed.
Articulates direction. Promotesgrowth and exploration.Underlying Belief (It is important totake risks. Mistakes are not failurebecause they lead to new learning.)
Never loses sight of the vision.Clearly focused on the vision, notthe obstacles.Underlying Belief (Challenges areopportunities not obstacles)Interprets events for self and othersto create and maintain a constantsense of reality that supports andenhances creation of the vision.
Demonstrates self-confidence; positiveregard for self and others.Underlying Belief (You are the primarycreative force in your life, that youcan create what you want.)
Takes care of him/herself. Maintainsphysical, emotional, and intellectualhealth
.
Demonstrates commitment to the vision.Acts consistently with values andvision at all times, in all ways greatand small. Total involvement; deeplyinvolved in work.Follows through on commitments; is
perceived as trustworthy and reliable.
(Continued Next Page)
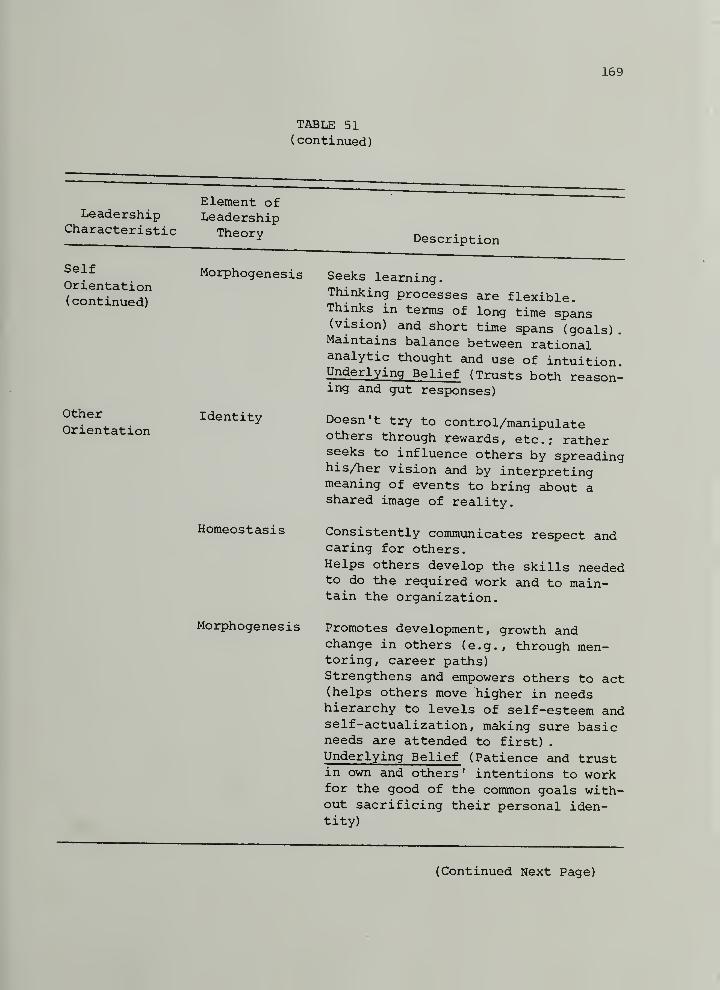
169
TABLE 51
(continued)
LeadershipCharacteristic
SelfOrientation( continued)
Element ofLeadership
Theory
Morphogenesis
OtherOrientation
Identity
Homeostasis
Morphogene s is
Description
Seeks learning.Thinking processes are flexible.Thinks in terms of long time spans(vision) and short time spans (goals).Maintains balance between rationalanalytic thought and use of intuition.Underlying Belief (Trusts both reason-ing and gut responses)
Doesn't try to control/manipulateothers through rewards , etc . ; ratherseeks to influence others by spreadinghis/her vision and by interpretingmeaning of events to bring about ashared image of reality.
Consistently communicates respect andcaring for others.Helps others develop the skills neededto do the required work and to main-tain the organization.
Promotes development, growth andchange in others (e.g., through men-toring, career paths)Strengthens and empowers others to act(helps others move higher in needshierarchy to levels of self-esteem andself-actualization, making sure basicneeds are attended to first)
.
Underlying Belief (Patience and trustin own and others ' intentions to workfor the good of the common goals with-out sacrificing their personal iden-tity)
(Continued Next Page)
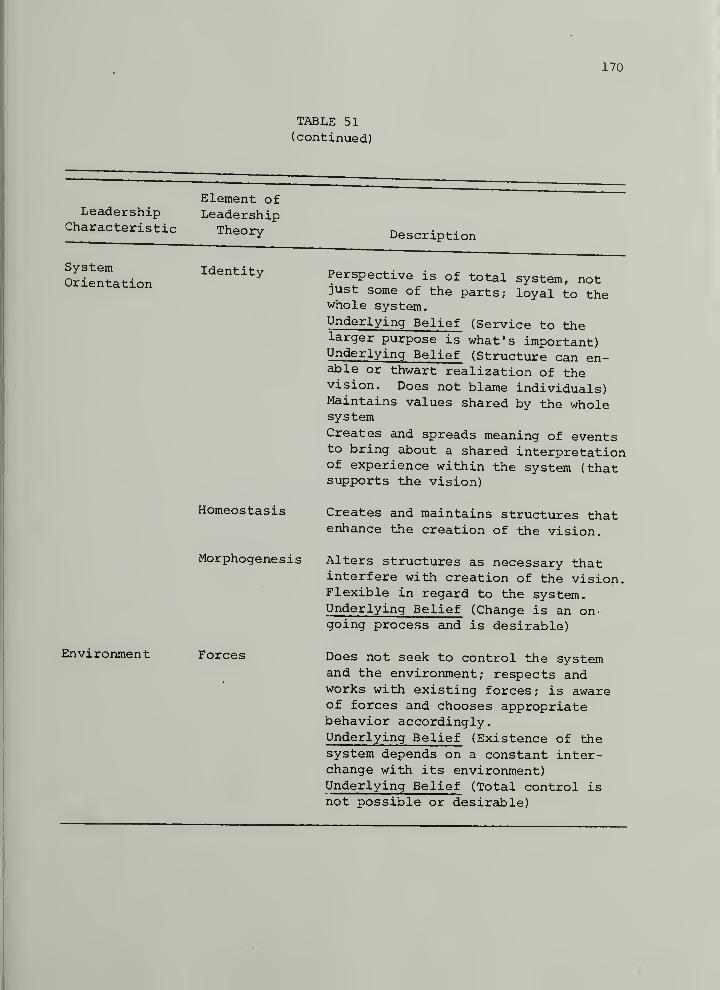
170
TABLE 51
(continued)
LeadershipCharacteristic
Element ofLeadershipTheory Description
SystemOrientation
Identity
Homeostasis
Morphogenesis
Environment Forces
Perspective is of total system, notjust some of the parts; loyal to thewhole system.Underlying Belief (Service to thelarger purpose is what's important)Underlying Belief (Structure can en-able or thwart realization of thevision. Does not blame individuals)Maintains values shared by the wholesystemCreates and spreads meaning of eventsto bring about a shared interpretationof experience within the system (thatsupports the vision)
Creates and maintains structures thatenhance the creation of the vision.
Alters structures as necessary thatinterfere with creation of the vision.Flexible in regard to the system.Underlying Belief (Change is an on-going process and is desirable)
Does not seek to control the systemand the environment; respects andworks with existing forces; is awareof forces and chooses appropriatebehavior accordingly.Underlying Belief (Existence of thesystem depends on a constant inter-change with its environment)Underlying Belief (Total control isnot possible or desirable)
171
a common belief, Vision, or definition of reality. Leadership is
vie«ed as the atte.pt to Kindle, develop, and shape the potential powerof the group.
Summary
The results of this study have major implications for how leader-
ship theory is conceptualized. First, visionary leadership emerges as
an important concept that needs to be included with the traditional
concepts of management theory. Second, the higher correlations for
senior level managers with perceived peak performance of the work unit
suggest that organizational structure is a variable that needs to be
addressed. Also, given the high correlations for the Empowerment Scale
with effective leadership, another concept that emerged from the study
as important is that of empowering the self and others to act (as
opposed to attempting to control others and maintain the status quo) .
This section has offered a model that defines the concept of
visionary leadership and provides a context for viewing it within the
traditional framework. The model presented proposes that successful
leadership is the result of the integration of three elements that con-
tinually impact each other. This can be summarized as: flexibility in
growth-oriented and stabilization-oriented behaviors depending on the
fQ^^^s (e.g., situation, developmental level) in relation to mainten-
ance and development of the identity of the organization.
172
Directions for Future l!pg»»,-^K
Because this study is one of the first of if= v „rirst of Its kind, replication issuggested to verify the resulho b.-^h ^•y tne results. Replication of this study in otherorganizations would also provide «re information on the generali.abll-ity of its findings. Because the results of this study have majorimplications for leadership theory, it is important to continue to
investigate the subject of visionary leadership and other methods for
investigating leadership from this perspective need to be developed. Acase study method, using actual people and events as examples, would
further illustrate the concepts.
Another way to conduct a similar study would be to use a different
managerial-theory based questionnaire such as the Leader Behavior
Description Questionnaire (Stogdill, 1962). Also, another instrument
to measure peak performance of the work unit could be used, it is
especially important to replicate the results of the ANOVA which
analyzed combinations of high-rated and low-rated visionary leadership
and traditional managerial leadership with peak performance level of
the work unit because only one of three combinations of questionnaires
could be subjected to analysis. It is important to determine whether
these results can be generalized to other organizational settings or if
they are indigenous to this organization.
By including some of the variables not examined in this study, it
might be possible to learn more about the nature of leadership, peak
performance, and the variables. One area that would benefit from
further investigation is the relationship between ,en.er and leadershipstyle. The demographics of the organization in this study were suchthat most senior level managers were male. Because the senior levelmanagers showed stronger correlations between leadership and peakperformance of the wor. unit than other hierarchical levels, the impor-tance Of position within the organization emerged as an important
variable. However, it is difficult to justify generalization of thesefindings for female senior level managers. Recently research by
developmental psychologists, such as Carol Gilligan (1982) and Mary
Belenky et al.
(1986) , suggest there are fundamental differences in
the ways that women and men think (perceive the world and relation-
ships). Also, authors discussed in the literature review (e.g.,
Ackerman, 1984) suggest that the visioning process belongs to the
domain of holistic thinking and that traditional managerial processes
arise from the domain of linear thinking. The differences in the way
females and males think need to be further investigated and then con-
sidered in light of visionary leadership.
The reasons for the stronger correlations for senior level mana-
gers between their leadership behavior and perceived peak performance
of the work unit also needs to be investigated more thoroughly in terms
of organizational structure. Most likely this higher correlation is
due to the hierarchical position and not gender of the manager because
middle level managers were also mostly male. Also, hierarchical posi-
tion is indicative of the level of power and influence one has in the
organization. These results raise some interesting questions that
174
would benefit fro. further investigation, is hierarchical positionwithin the organization related to peak performance of the work unit?
If so, what is it about the senior level position that causes the
higher correlation? Can a middle level manager be a visionary leader
or is this person literally stuck in the middle? Does a lower organi-
zational position constrict one's ability to exhibit visionary leader-
ship behaviors? is the first line manager more likely to affect
feeling tone aspects of peak performance than the results-oriented
aspects? These questions all relate to the need to study the relation-
ship between position within organizational hierarchy with effective
leadership and peak performance of the work unit.
Other leadership behaviors also need to be examined in relation to
peak performance level of the organization such as the extent to which
the leader effectively interprets events and creates meaning around
events to support the creation of tlie vision, the extent to which the
leader creates organizational policies that support the vision, and
the extent to which the leader uses both intuition and rational,
analytic thought.
Also, other variables, related to leadership but not necessarily
under the direct control of leadership, need to be examined in relation
to peak performance level of the organization. These would be organi-
zational structure, organizational norms governing relationships among
employees, and the stage of organizational development.
The PAVE: Excellent Organizational Practices Index would benefit
from further examination because it appears to be an important instrument
that measures a new concept, workers• perceptions of pea. performance
level Of the organization. It needs to be used more extensively and inother contexts. Data gathered could be u.ed to give .ore informationon the norms. Concurrent and predictive validity needs to be furtherdeveloped. Also, the PAVE needs to be correlated with objective
indicators of peak performance (e.g., economic indicators) . The scale
of commitment needs to be examined more closely when the new data is
analyzed for item-to-total reliability and alpha-if-item-deleted to
determine if any questions need to be revised.
Finally, specific ways to apply the theory need to be developed
and described in order to establish its practical value as a way to
foster growth in people's leadership abilities. In addition, training
programs and methods to foster visionary leadership need to be devel-
oped and analyzed for effectiveness, if, as the current literature
suggests, the nature of visionary leadership is demonstrated to belong
to a different domain of thinking, new ways to foster this way of
thinking will need to be explored.
The directions for future research are unlimited and intriguing.
The current study has been a first effort to investigate the concepts
of visionary leadership and peak performance of the organization. The
results of the study are important because they have strongly supported
the validity of these concepts and give rise to major implications for
the future of leadership theory and training. As the significance of
the initial efforts becomes recognized, more work will need to be done
to establish and understand these new perspectives.
APPENDIX A
DRAFTS, CORRESPONDENCE, AND FORMS RELATED TO CONSTRUCTION
OF THE PAVE: EXCELLENT ORGANIZATIONAL PRACTICES INDEX
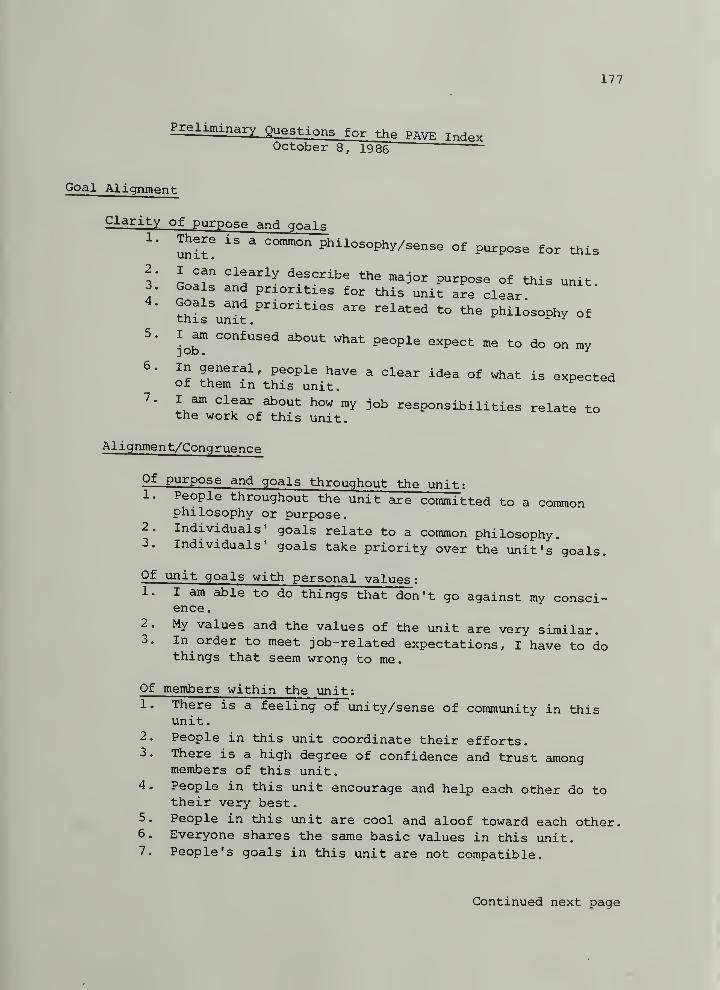
177
Preliminary Questions for the PAVE ind.vOctober 8, 1986
Goal Alignment
Clarity of purpose and goals1. There is a common philosophy/sense of purpose for this
3* LT. ''^T''^describe the major purpose of this unit.
3. Goals and priorities for this unit are clear.
this^nSto the philosophy of
5. I am confused about what people expect me to do on my
6.
in general,people have a clear idea of what is expectedof them in this unit.
7. I am clear about how my job responsibilities relate tothe work of this unit.
Alignment/Congruence
Of purpose and goals throughout the unit ;
1. People throughout the unit are committed to a commonphilosophy or purpose.
2. Individuals' goals relate to a common philosophy.3. Individuals' goals take priority over the unit's goals.
Of unit goals with personal values ;
1. I am able to do things that don't go against my consci-ence .
2. My values and the values of the unit are very similar.3. In order to meet job-related expectations, I have to do
things that seem wrong to me
.
Of members within the unit ;
1. There is a feeling of unity/sense of community in thisunit.
2. People in this unit coordinate their efforts.3. There is a high degree of confidence and trust among
members of this unit.4. People in this unit encourage and help each other do to
their very best.5. People in this unit are cool and aloof toward each other,5. Everyone shares the same basic values in this unit.7. People's goals in this unit are not compatible.
Continued next page
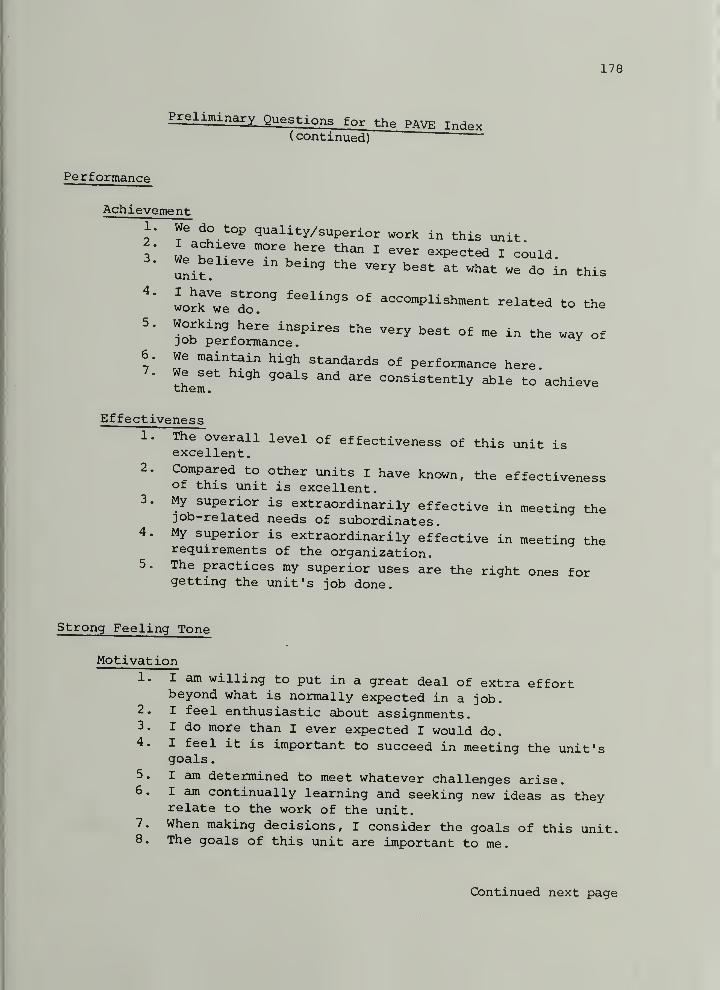
178
Preliminary Questions for the pavf. Tnri..^( continued)
~
Performance
Achievement
1. We do top quality/superior work in this unit,
4.
I achieve more here than I ever expected I could.we believe in being the verv bpcti- =i- ,,k=>+. •
. y '-"'=^ very oest at what we do in this
wo^rwe'do!"^°' accomplishment related to the
5. working here inspires the very best of me in the way ofDob performance. ^
6. We maintain high standards of performance here.7. We set high goals and are consistently able to achievetnem.
Effectiveness
1. The overall level of effectiveness of this unit isexcellent.
2. Compared to other units I have known, the effectivenessof this unit is excellent.
3. My superior is extraordinarily effective in meeting thejob-related needs of subordinates.
4. My superior is extraordinarily effective in meeting therequirements of the organization.
5. The practices my superior uses are the right ones forgetting the unit's job done.
Strong Feeling Tone
Motivation1. I am willing to put in a great deal of extra effort
beyond what is normally expected in a job.2. I feel enthusiastic about assignments.3. I do more than I ever expected I would do.4. I feel it is important to succeed in meeting the unit's
goals
.
5. I am determined to meet whatever challenges arise.6. I am continually learning and seeking new ideas as they
relate to the work of the unit.7. When making decisions, I consider the goals of this unit.8. The goals of this unit are important to me.
Continued next page
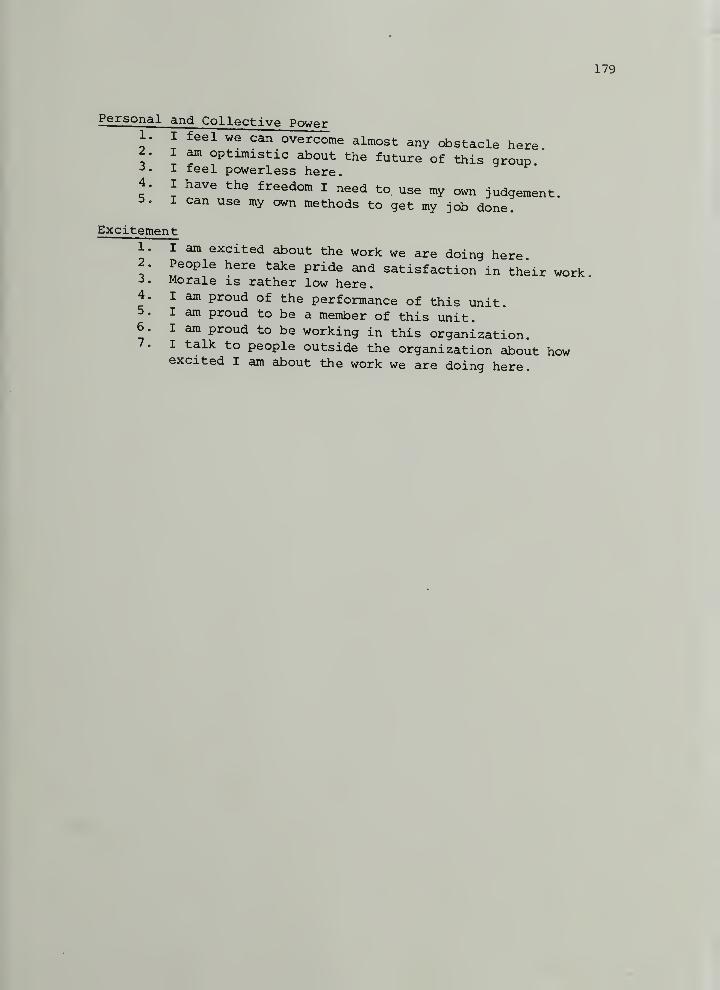
179
Personal and Collective Power1. I feel we can overcome almost any obstacle here2.. I am optimistic about the future of this group-5- I feel powerless here4. -
5.
I have the freedom I need to use my own judgement.I can use my own methods to get my job done.
Excitement
1. I am excited about the work we are doing here2. People here take pride and satisfaction in their work3. Morale is rather low here.4. I am proud of the performance of this unit.5. I am proud to be a member of this unit.6. I am proud to be working in this organization.7. I talk to people outside the organization about how
excited I am about the work we are doing here.
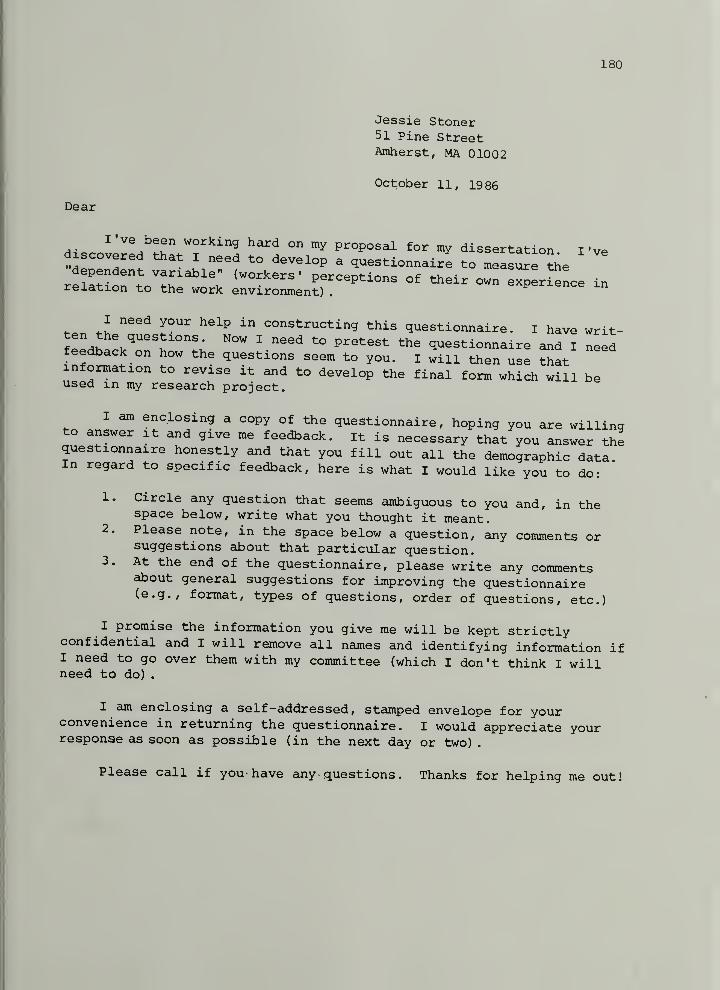
180
I 've
Jessie Stoner51 Pine StreetAniherst, MA 01002
October 11, 1986
Dear
I've been working hard on my proposal for my dissertationdiscovered that I need to develop a questionnaire to measure ?hedependent variable" (workers' perceptions of their own experience inrelation to the work environment) .experience in
^.n''^^'^ ^^^^ ^" constructing this questionnaire. I have writ-
fP^df ' ^^"^ ^° ^^"^^^^ questionnaire and I ne^dfeedback on how the questions seem to you. I will then use thatinformation to revise it and to develop the final form which will beused m my research project.
I am enclosing a copy of the questionnaire, hoping you are willingto answer it and give me feedback. It is necessary that you answer thequestionnaire honestly and that you fill out all the demographic dataIn regard to specific feedback, here is what I would like you to do:
1. Circle any question that seems ambiguous to you and, in thespace below, write what you thought it meant.
2. Please note, in the space below a question, any comments orsuggestions about that particular question.
3. At the end of the questionnaire, please write any commentsabout general suggestions for improving the questionnaire(e.g., format, types of questions, order of questions, etc.)
I promise the information you give me will be kept strictlyconfidential and I will remove all names and identifying information ifI need to go over them with my committee (which I don't think I willneed to do)
.
I am enclosing a self-addressed, stamped envelope for yourconvenience in returning the questionnaire. I would appreciate yourresponse as soon as possible (in the next day or two) .
Please call if you have any questions . Thanks for helping me out!
181
Letter Sent to HRD Speci ..1 i c^-ho
October 23, 1986
Dear
dependent llT^ll T^'"^ °" ' questionnaire to measure theaependent variable m my dissertation research project After manv
^nHf^fr^nofof - the field o? stati;ticf nd testing
avail2!e T ?^^^^^hmg through what questionnaires are currentlyavailable, I realized I was going to need to develop my own question-
I went through the literature and listed the things authors sayare happening in "inspired" organizations. I want to see if there L arelationship between workers' perception of whether these thingsoccurring and how they perceive the leadership, m developing thespecific questions, I reviewed the following questionnaires:
1. Minnesota Satisfaction Questionnaire (MSQ) - Weiss et al . , 19672. Job Descriptive Index (JDI) - Bowling Green State University, 19753. Organizational Commitment Questionnaire (OCQ) - Porter et al 19794. Survey of Organizations (SOO) - Likert, 19805. Profile of Organizational Practices - Zigarmi et al . , 19826. Organizational Beliefs Questionnaire - Sashkin, 19 847. Cultural Functions Questionnaire - Sashkin, 19868. Organizational Climate Survey Questionnaire - author unknown,
given to me by Eunice Parisi-Carew.9. Scales of Transactional and Transformational Leadership - Bass,
1985 ^
10. Leadership Practices Inventory - Posner et al . , 198611. Study of Schooling Questionnaires - Institute for Development of
Educational Activities, Inc., 197812. Organizational Effectiveness Questionnaire - Paul E. Mott, 1972
Next, in consultation with statisticians, I developed a list of 52questions. I sent the questionnaire to 25 people to pilot it. I askedthem to answer the questionnaire, to make comments about questions thatseemed ambiguous, and suggest ways to improve the questionnaire. Ireviewed the responses with the research consultants to analyze thefeedback and to make revisions. The current revised questionnaire nowhas 37 questions.
I have enclosed a copy of the questionnaire in its current form.I would appreciate any suggestions or comments you have for improvingit.
Sincerely
,
Jessie Stoner
182
Construct Validity Fn-rm
November 15, 1986
Dear
Jessie Stoner
Category IFeeling Tone - defined as: strong positive feelings including motiva-
tion, satisfaction, excitement, inspiration, confidence,teelings of personal and collective power.
Category IIPerformance - defined as: competence, productivity, achievement,
output and effectiveness.
Category IIIAlignment - defined as: the end result of the alignment of pur-
pose, values, and goals. At an organizational level,goal clarity implies that members share a commonpurpose and value base from which goals are derived.
Questions that don't seem to fit anywhere and/or any comments:
APPENDIX B
EXCELLENT ORGANIZATIONAL PRACTICES INDEX
184
PflVE: Excellent Organizational Practices Index
Directions:
Please answer all questions in relation to the work unit to whichyou belong and for which your manager is responsible. Foreach statement below, circle the number from the responsecategory that best describes your perceptions or sense of yourwork unit. It is important to answer ail questions; however, if youreally cannot decide, please circle the zero.
10.
11.
12.
13.
14.
15.
16.
There is a common mission/ sense of purpose for this unit.
There is a feeling of cohesiveness/ sense of community here.
I can clearly describe the major purpose of this unit.
I am clear about the goals and priorities for this unit.
People throughout the unit are conmitted to a common missionor purpose.
People in this unit are cool and aloof toward each other.
Goals and priorities are related to the mission of this unit.
There is a high degree of confidence and trust among membersof this unit.
I am clear about how my job responsibilities relate to themission of this unit.
The overall level of effectiveness of this unit is excellent.
In order to meet job-related expectations, I have to do thingsthat seem wrong to me.
Working here inspires that very best of ne in the way of jobperformance.
When conflict occurs, individuals' goals take priority overthe unit's goals.
High standards of performance are maintained here.
People in this unit give-up %rhen the work becomes frustrating.
My values and the values of the unit are very similar.
9) 4)
41 Vk> U00 00 4t 4)l« <a 41 41(0 to U U•H H 00 00a o < <
01 >^ >>4) .-( f-i
00 U u 00e 00 £ SI 41 c u0 Id 00 00 41 0 41til CO .H uu •H ^ 00 la eM o Oi < U5 3
z•3
Jt
5 6 0
2 3 4 5 6 0
2 3 4 5 6 0
2 3 4 5 6 0
2 3 4 5 6 0
2 •J A* cJ 0 U
2 •J*• J Q r\U
2 3 4 5 6 0
2 3 4 5 6 0
2 3 4 5 6 0
2 3 4 5 6 0
2 3 4 5 6 0
2 3 4 5 6 0
2 3 4 5 6 0
2 3 4 5 6 0
2 3 4 5 6 0
® Copyright 1986. M. J. Stonar
185
17.
18.
19.
20.
21.
22.
23.
24.
25.
26.
27.
28.
29.
30.
31.
32.
33.
34.
35.
36.
37.
38.
39.
40.
I have strong feeling, of accon^UsKaenc related co our wor.
7.,:Zi:llV;^^-^^^^ -^^^^^ requirements of the
I am proud to be a member of this unit.
People's goals in this unit are compatible.
Compared to other units I have irn«™of this unit is excelHnt. ™' «"«ctiveness
The goals of this unit are important to ae.
When my work requires working independently. I do it well.
I feel powerless here.
IhTt S'no^'? '° ^^'^ °' ««« beyondwnat is normally expected in a job.
I am proud of the performance of this unit.
Morale is rather low here.
This unit produces top quality/superior work.
^^^nf^i"" fy.'^P^i" «e the right ones forgetting the unit's job done.
I have the freedom I need to use my own judgement.
I am coianitted to helping the unit meet its goals.
I am optimistic about the future of this unit.
I am connitted to completing work even when it is frustrating.
I am confused about what people expect me to do on my job.
People in this unit take pride and satisfaction in their work.
I am determined to meet whatever challenges arise here.
People in this unit coordinate their efforts when necessary.
I am continually learning and seeking new ideas as they relateto the work of this unit.
I feel wc can overcome almost any obstacle here.
I am excited about the work we are doing hare.
S Su u
S ^ ^ 41
s ^ ^s ^ ^ I
5 op OO 4) o «
"i O CO «J < „ 5
1 2 3 4 5 6 0
1 2 3 4 5 6 0
1 2 3 4 5 6 0
1 2 3 4 5 6 0
1 2 3 4 5 6 0
1 2 3 4 5 6 0
1 2 3 4 5 6 0
1 2 3 4 5 6 0
1 2 3 4 5 6 0
1 2 3 4 5 6 0
1 2 3 4 5 6 0
1 2 3 4 5 6 0
1 2 3 4 5 6 0
1 2 3 4 5 6 0
1 2 3 4 5 6 0
1 2 3 4 5 6 0
1 2 3 4 5 6 0
1 2 3 4 5 6 0
1 2 3 4 5 6 0
1 2 3 4 5 6 0
1 2 3 4 5 6 0
1 2 3 4 5 6 0
1 2 3 4 5 6 0
1 2 3 4 5 6 0
APPENDIX C
LEADER BEHAVIOR ANALYSIS
187
LBALeader Behavior
AnalysisDeveloped by Kenneth H. Blanchard. Ronald K. Hambleton. Drea Zigarmi and Douglas Forsyth
OtherPerceptions of Leadership Style
Directions:
The purpose of the LBA-Other is to provide a leader with information about your perceptions ofhis/her leadership style. The instrument consists of twenty typical job situations that involve aeader and one or more staff members. Following each situation are four possible actions that aleader may take.
Assume
(name of leader)IS mvolved in each of the twenty situations. In each of the situations you must choose one of thefour leader decisions. CIRCLE the letter of the decision which you think would best describe thebehavior of this leader in the situation presented. Circle only one choice .
Blanchard Training
and Development, Inc.A Human Resource Development Company
I2S Sute Place. Escondtdo. CA 92025
(619) 489-5005
^ 1981 by Blanchard Training and Development, Inc.
188
LEADER BEHAVIOR ANALYSIS-OTHER
Tell the subordinate when the report was dueremind him of what ,s wanted in the report andCheck on the subordinate s progress daily
Give the subordinate more time to complete theassignment
Tell the subordinate what is expected, and tellhim to complete it as soon as possible butdiscuss with him why the report was lateTalk to the subordinate and encourage him tocomplete the report
a Tell him exactly what is expected and closelysupervise his work on this report
b Discuss with him why he has been late and supPO"^ h'S efforts to complete the task
LEADER WOULD ^ ^ ^ ^ """""" 1"'*'V «" work is unacceptable. THIS
Let the group work out their problems bythemselves
Make sure that deadlines are met and thequality of the work is good, but talk with thegroup and get its recommendations
Inform the group of exactly what is expectedwhen It IS needed, and supervise the group swork closely
Help group members determine what theyneed to do and encourage them to take thenecessary steps
5. Because of budget restrictions imposed on the departmentmember of the department, who is usually eager to help, to
department. While the leader feels the subordinate has theimportance of the Usk. THIS LEADER WOULDa. Take charge of the consolidation, but make
sure the subordinate's suggestions are heard.
b. Assign the project to her and let her determinehow to accomplish it.
II IS necessary to consolidate. The leader has asked a highly experiencedtake charge of the consolidation. This person has worked in all areas of theability to perform this assignment, the subordinate seems indifferent to the
c. Discuss the situation with her. Encourage herto accept the assignment in light of her skills
and experience.
d. Take charge of the consolidation and indicateto the subordinate precisely what to do. Super-vise her work closely.
Jwn'R«S'?o,klS."lr^own. Recently, work problems have developed that she feels she can t solve by herself. THIS LEADER WOULD . .
Analyze the problems and outline methods tosolve them
Continue to allow her to figure out an appropn-ate solution independently
Work with her in problem -solving, but deter-
mine and implement an appropriate solution
Discuss the problems with her and encourageher to implement any solutions
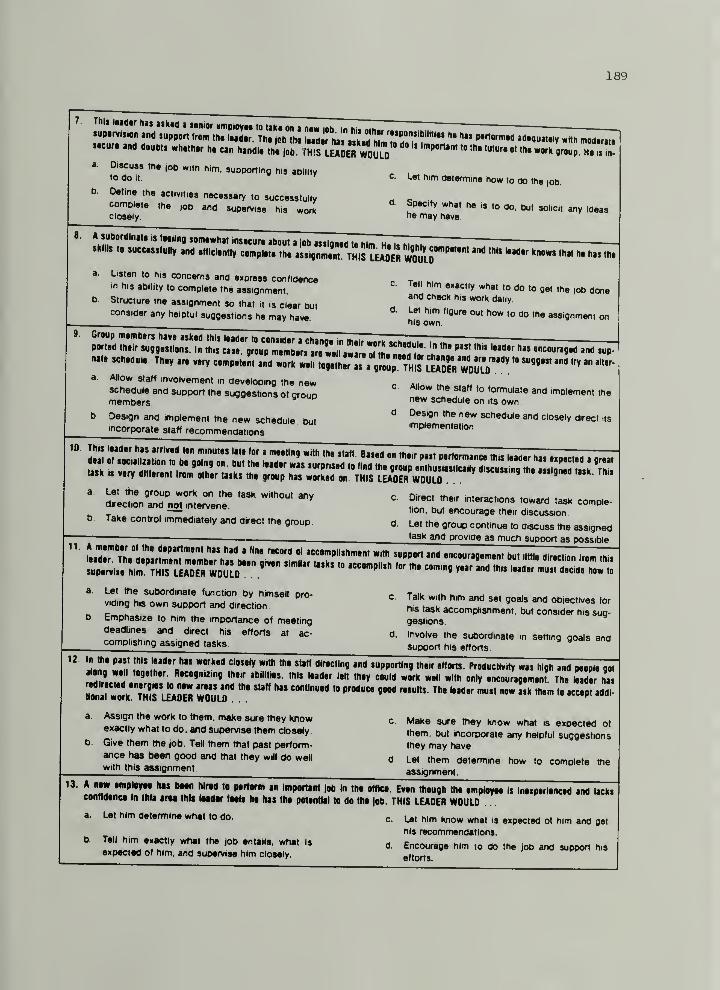
189
i.cur. ,„d doubt, wh.th.r h. «n handl. th. |od. THIS lSSe" iolLO' ' " " B"""
Discuss th« job with h.m, supporting his abilityto do It.
Define the activities necessary to successfullycomplete the )ob and supervise his workclosely
Let him determine how to do the job.
Specify what he is to do. but solicit any ideasf'e may have.
a. Listen to his concerns and express confidencem his ability to complete the assignment.
b. Structure the assignment so that if is clear butconsider any helpful suggestions he may have.
c. Tell him exactly what to do to get the )ob doneand Check his work daily.
d. Let him figure out how to do the assignment onhis own.
AJlow staff involvement m developing the newschedule and support the suggestions of groupmembers
Design and implement the new schedule, butincorporate staff recommendations
Allow the staff to formulate and implement thenew schedule on Its ownDesign the new schedule and closely direct its
implementation
Let the group work on the task without anydirection and not intervene
Take control immediately and direct the group.
Direct their interactions toward task comple-tion, but encourage their discussion
Let the group continue to discuss the assignedtask and provide as much support as possible
Let the subordinate function by himself pro-viding his own support and direction
Emphasize to him the importance of meetingdeadlines and direct his efforts at ac-complishing assigned tasks
Tatk with him and set goals and objectives forhis task accomplishment, but consider his sug-gestkins
.
Involve the subordinate in setting goals andsupport his efforts
11 ' !.n' 'J""*"""""""9 '''"'"•""'V *as high and paopl. got
Assign the work to them, make sure they k/rowexactly what to do. and supervise them closely.
Give them the |ob. Tell them that past perform-ance has been good and that they will do well
with this assignment
Make sure they know what Is expected of
them, but incorporate any helpful suggestionsthey may have
Let them determine how to complete the
assignment
13. A mm amployM hat Dmii hind to pirform an Important job In tho otfica. Even though tho omployoo It Inoiporloncad and laekiconfldonco In this aroa this iMdor toait ha haa tha potantial to do tho job. THIS LEADER WOULDa. Let him determine what to do.
b. Tell him exactly what the job entails, what Is
expected of him, and supervise him closely.
Let him know what Is expected of him and get
his recommendations.
Encourage him to do the job and support his
efforts.
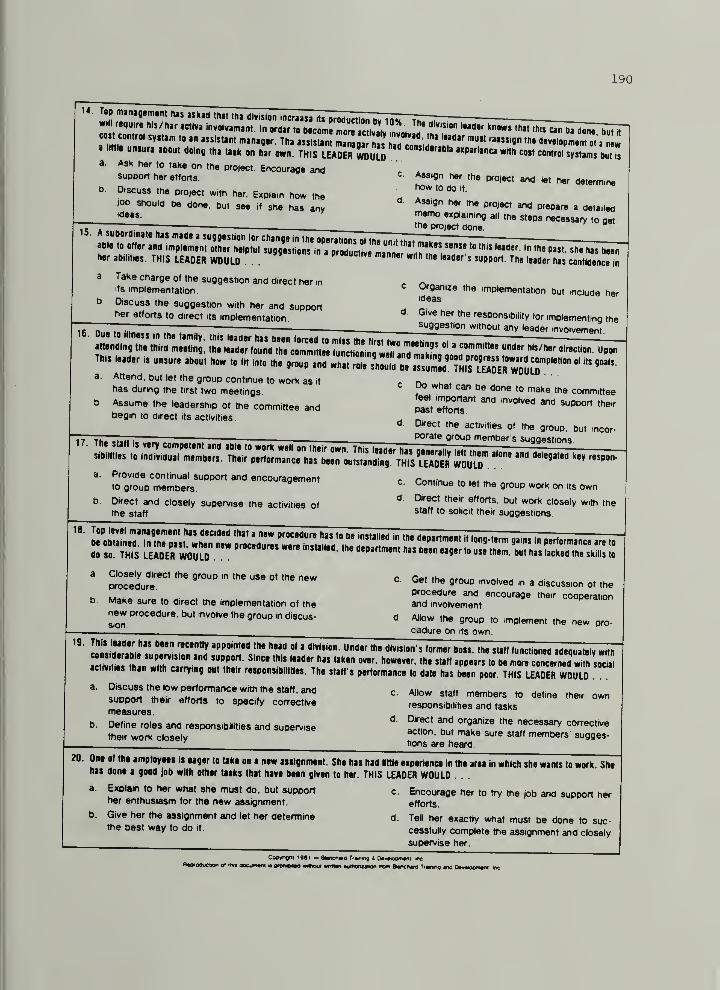
190
14
1 Itttl. u„,u« about doing th. titk on hor own. THIS LEADER imn n"P«"nco with cost control ,y,„m, but
*unouro about doing th. task on hor own. THIS LEADER WOULD
Ask her to take on the protect. Encourage andsupport her efforts.
Discuss the proiect with her. Explain how theloD Should be done, but see if she has any
Assign her the project and let her determinehow to do It.
Assign her the project and prepare a detailedrnemo explaining all the steps necessary to getthe project done.
her abihties. THIS LEADER WOULD . .
" « S"PPOrt. The leader has confidence In
Take charge of the suggestion and direct her inIts implementation
Discuss the suggestion with her and supporther efforts to direct its implementation
Organize the implementation but include herIdeas
Give her the responsibility for implementing thesuggestion without any leader involvement
a. Attend, but let the group continue to work as it
has during the first two meetingsb Assume the leadership of the committee and
begin to direct its activitiesd
Do what can be done to make the committeefeel important and involved and support theirpast efforts.
Direct the activities of the group, but incor-porate group member sTh« •.<•« a'^^t* iiiciMuer 5 suggestions
a. Provide continual support and encouragement r Continn« i^tto group members
continue to let the group work on its own
b Direct and closely supervise the activities ofthe staff
d. Direct their efforts, but work closely with thestaff to solicit their suggestions
Closely direct the group in the use of the newprocedure
Make sure to direct the implementation of thenew procedure, but involve the group in discus-sion
Get the group involved m a discussion of theprocedure and encourage their cooperationand involvement
Allow the group to implement the new pro-cadure on its own
L?sl«?Mr" ' <"**«'"'s 'o'mT boss. th. staff functioned adequately with
a t . , n ^h^^^^^^^^^^^^ "ir*;"" "» conc.rned'w.th socSactivities than with carrying out their r.sponsibilltl.s. Th. staff's p.rformanc. to dat. has b..n poor. THIS LEADER WOULD
Discuss the low performance with the staff, andsupport their efforts to specify corrective
measures.
Define roles and responsibilities and supervisetheir work closely
Allow staff members to define their ownresponsibilities and tasks
Direct and organize the necessary con-ectiveaction, but make sure staff members sugges-tions are heard
20. On. of th. .mployMt is .ag.r to tak. on a now aMlgnnunt. Sh. has had llttl. .xp.n.nc In th. aru in which sh. wants to work Sh.has don. a good job with othar tasks that hav. bMn gjv.n to h.r. THIS LEADER WOULDa. Explain to her what she must do, but support c. Encourage her to try the job and support her
her enthusiasm for the new assignment. efforts.
b. Give her the assignment and let her determine d. Tell her exactly what must be done to sue-the best way to do it. cessfully complete the assignment and closely
supervise her
nwrooucmn o> mt aoctmm la goiMou mikw ormw umonutan im auncitn irmrni ma OMmxwii nc

APPENDIX D
LEADER BEHAVIOR QUESTIONNAIRE
192
The Leader Behavior QuestionnaireDirections:
Below is a list of statements that describe a particular way a leaderm.ght behave. Circle the number from the response category thatdescnbes how true that statement is about your manager
u u <u-< H H 3 >N
< V u H 3)
" " j: >, (U< " 3 ^*i
J a o B5^000IS < CO 3: o
pays clos. acce^ion co whac I say when we are talking.1 2 3 . 5
1.
2. ...does not conmunicate very clearly
3 .
'1 2 3 4 5
J. ...is trustworthy.
12 3 4 5...shows that he/she really cares about people. 12345...is very concerned about avoiding failure
1 2 3 4 5...makes me feel that my work is meaningful
1 2 3 4 5
...cries to keep at a distance from subordinates. , , , ,i i J 4 5
...helps others set specific high goals for themselves. 123 4 5
...expectspeopletofind. on their own. ways to do their jobs better 1 2 3 4 5
...tries to get people to work together as a team. 1 , . ci ^ 3 4 5
hls^hervilw^' '°'''' °^ 'P-^^^*^ Of
1 2 3 4 5
4.
5.
6.
7.
8.
9.
10.
11.
12.
13.
'.n.TtV ^° ^"""^ ''^"^ "^ys that you couldn'tpossibly misunderstand or forget."-""xua t 1 2 3 4 5
1 2 3 4 5
1 2 3 4 5
1 2 3 4 5
1 2 3 4 5
...concentrates on developing his/her own argument while the 12 3 4 5other person is speaking. j h j
..can be relied on to follow through on commitments.
14. ...does not have a great deal of self-respect.
..tries to avoid taking any risks.
..helps me feel more competent in what I do.
18. ...encourages people to try their best rather than reaching for some 1specific "number."
2 3 4 5
19. . .-provides information people need to effectively plan their work. 12 3 4 5
20. ...provides opportunities for people to get together and share ideas 12 3 4 5and infomation.
21. ...has a clear set of priorities. 12 3 4 5
22. ...often does not notice how others feel. 12 3 4 5
23. ...often finds it desirable to change or alter his/her position. 12 3 4 5
24. ...focuses on strengths of self and of others. 12 3 4 5
25. ...seems most alive when committed to some project. 12 3 4 5
193
26.
27.
28.
29.
30.
31.
32.
33.
34.
35.
36.
37.
38.
39.
40.
41.
42.
43.
44.
45.
46.
47.
48.
49.
50.
®
...manages to avoid being stuck with the blan,e when there is a problem.
...is understanding when people come to him/her with their problems.
...does not expect too much of people.
...expects people to solve their own work problems.
...makes it easier for people to work together to get the job done.
...literally "grabs" your attention to focus on the important issuesin a discussion.
...communicates feelings as well as ideas.
...avoids committing to a position, preferring to remain flexible.
...knows and can express exactly how he/she "fits" into the organization
...learns from mistakes; does not treat errors as disasters but asopportunities for learning.
...has a no-nonsense approach to work.
...shows people that he/she is concerned about them.
...expects a great deal from others, in terms of performance.
...makes sure people have the resources they need to do a good job.
...prefers to work with individuals one-on-one, rather than improvingthe group.
...finds it difficult to get your attention when talking with you.
...is able to get complicated ideas across clearly.
...is someone in whom people can put absolute faith.
...shows little concern for other people's feelings.
. . . cooDunicates excitement about future possibilities.
...makes me feel that I'm really part of this organization.
...shows others that he/she is really listening to them.
...helps others identify clear and specific performance goals.
...helps people get the training they need to perform the job effectively
...rarely spends time in work group meetings.
Copyright 1985. Marshall Sashkin
3 3 HU JJH H 3 >,
" .= >. a
•H 4) « "S.— E 91 E^000< w r «
2 3
2 3
2 3
2 3
2 3 4 5
2 3 4 5
2 3 4 5
2 3 4 5
2 3 4 5
2 3 4 5
2 3 4 5
2 3 4 5
2 3 4 5
2 3 4 5
2 3 4 5
2 3 4 5
2 3 4 5
2 3 4 5
2 3 4 5
2 3 4 5
2 3 4 5
2 3 4 5
2 3 4 5
APPENDIX E
LEADERSHIP PRACTICES INVENTORY
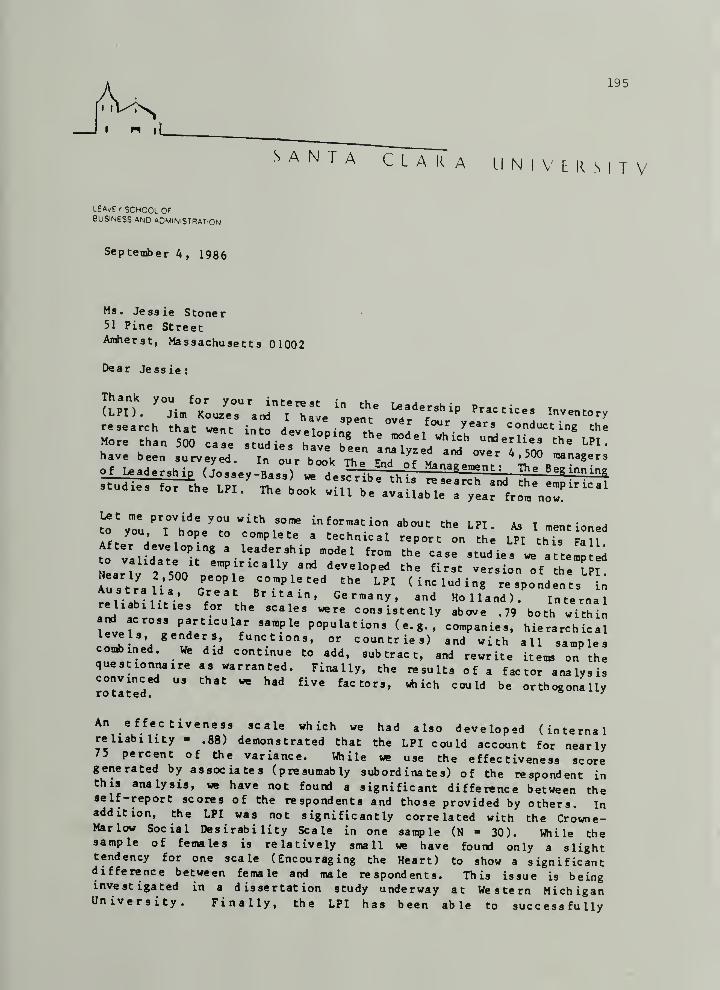
195
I r
I " iL
SANTA C L A K A U N I V E K S I T
LEavff SCHOOL OFBUSINESS AND ADMINISTRATION
September 4, 1986
Ms. Je3sie S toner51 Pine StreetAmherst, Massachusetts 01002
Dear Jessie:
aPn. "L'7oJe7^arV^::e%ent%r7"^^ '-'''^ -research that went into develooinr.L J
conducting the
More than 500 case ^t^dies havrbt.""'^^l «hich underlies the LPI
.
have been surveyed. "lnl\\r. \he" ^:'rrL:.tZZ\^^^-^
of leadership ( Jossey-Bass) we describe this ^searcTL ""V ""^"^^
studies for the LPI. book will be avaUabTa^rearfr^m^r
^^%ou 'ThooVto''''' rr ^•'-^ I-PI- AS I mentionedto you I hope to complete a technical report on the LPI this Fall
tn l\ r'°'-""^a leadership model from the case studies we attelp i
Nearlv 2 5V ''^}'''''''\'"' <^«-l°P«d the first version of he [
Australia GrT./ r-T'''^'(including respondents in
^5^^*= Britain, Germany, and Holland). InternalreUab.Ut.es for the scales were consistently above .79 both withinP"ticular sample popuUtions (e.g., companies, hierarchical
IZl^nlA^^l V-:°^ countries) and with all samplescombined. We did continue to add, subtract, and rewrite items on thequestionnaire as warranted. Finally, the results of a factor analysisconvinced us that we had five factors, which could be orthogonally
rotated. " •'
An effectiveness scale which we had also developed (internalreliability - .88) demonstrated that the LPI could account for nearly75 percent of the variance. While we use the effectiveness scoregenerated by associates (presumably subordinates) of the respondent inthis analysis, we have not found a significant difference between theself-report scores of the respondents and those provided by others. Inaddition, the LPI was not significantly correlated with the Crowne-Marlow Social Desirability Scale in one sample (N - 30). While thesample of females is relatively small we have found only a slighttendency for one scale (Encouraging the Heart) to show a significantdifference between female and male respondents. This issue is beinginvestigated in a dissertation study underway at Western MichiganUniversity. Finally, the LPI has been able to successfully
V
196
discriminate between hieh andsenior management). " P"fo'^™ing managers (as rated by
concurrent and predicti,. vf Udit, ^ ,
Xico«, Inc. (Tuxedo Park, *rvorw " ""'"i""""Itsby
«e. 8e» .ishe, with your dL.elJattoS ° "
Cord ially,
Barry z/ Posner, Ph.D.Assoc i^e Professor
197
Jessie Stoner
51 Pine Street
Amherst, MA 01002
Tel (413)549-4566
Dr. Barry PosnerNovember 3, 1 986
Management Department
Santa Clara University
Santa Clara, California 95053
Dear Barry,
I am vi/riting to confirm the agreement we made about my use of theLeadership Practices Inventory (LPI).
I v^ill use the LPI as part of my doctoral research project. Theinstrument will be given to about 100 workers in organizations who willbe asked rate their immediate superior For this reason, only the "Other"report form will be used.
To facilitate administration, I will retype the questions with the 5point "likert" scale next to each question. You and James Kouzes will begiven credit as authors on the retyped version, the copyright symbol willappear on each page of the retyped version, and you will be given full
credit in my dissertation.
Also, the LPI will not be used by me for any other purpose, it will
not be sold, and I will not give copies of it to anyone who is not directlyinvolved with the research project.
I will be glad to share the data 1 collect with you. Thank you for
your time, help, and cooperation.
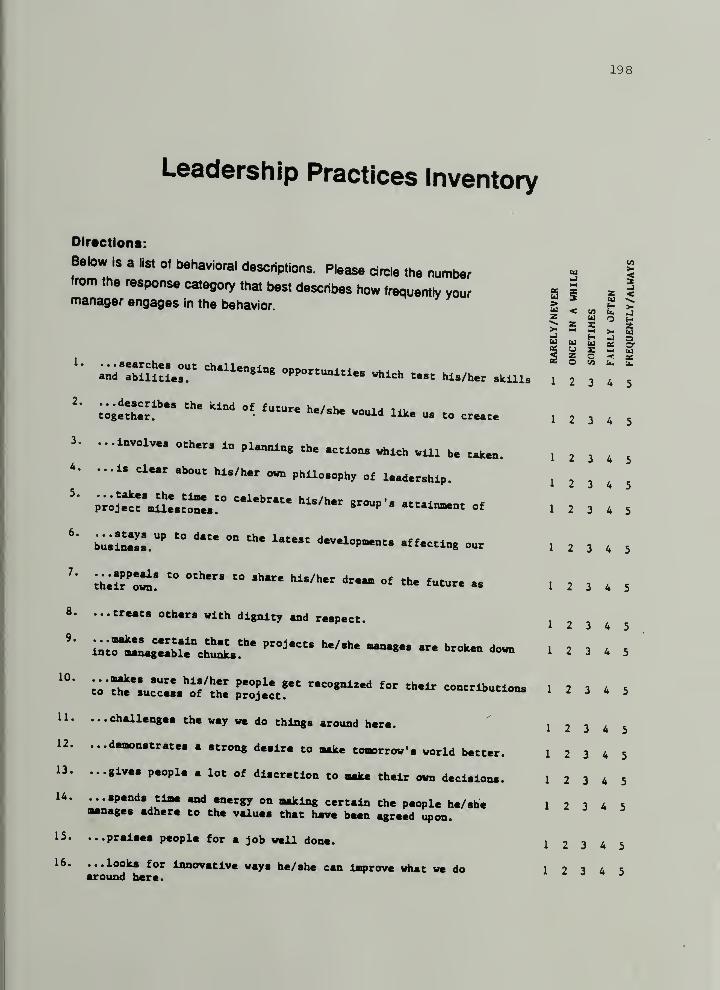
19 8
Leadership Practices Inventory
Directions:
Below is a list of behavioral descriptions. Please drcle the number 2from the response category that best describes how frequently your g 1 - ^manager engages in the behavior. g I « S
is < w (». JU) O l_i
^ 5 = S>- — -I >, M« « S ^2 u r N- 22 5 O -<•. as* O CO u. ti.
1 2 3 A 5
1 2 3 4 5
1 2 3 4 5
1 2 3 4 5
°^ "•^l" -^i- 11^ u. to cr..„ ,23,5...involv.. oth.r. in pluming th. .etlon. which .Ul b. t^.n....i. clMr .bout hl./h.r o« phUo.oph, of l«<l.t.hlp.
p;;l.«'^':.Li:."""'"^
of
i^mV..'^ " °° "* l—lop^ot. .ff«tl.g our
" ""*" " *• .. i z , ,
,
...treats others with dignity and respect.
»sr:u«::.'i?'^;: iixi'"""""^ "«"butio.. 123*5
...challenges the way we do things around here.
12. ...demonstrates a strong desire to make tomorrow's world better.
...gives people a lot of discretion to make their own decisions.
...spends time and energy on making certain the people he/shemanages adhere to the values that have been agreed upon.
15. ...praises people for a Job well done.
16. ...looks for innovative ways he/she can improve ^at we doaround here.
2.
3.
4.
5.
6.
7.
8.
9.
1 2 3 4 5
1 2 3 4 5
10.
11.
13.
14.
1 2 3 4 5
1 2 3 4 5
1 2 3 4 5
1 2 3 4 5
1 2 3 4 5
1 2 3 4 5
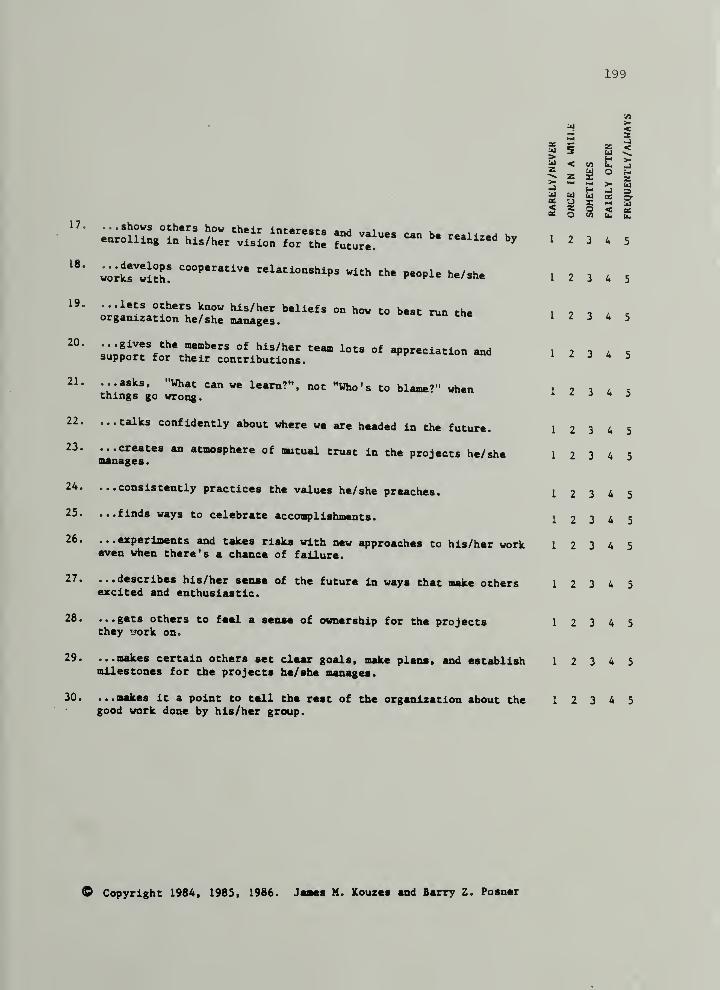
199
hi
OS
17,
18.
19.
20.
21,
22.
23. ...creates an atmosphere of mutual trust in the projects he/shemanages
.
24, ...consistently practices the values he/she preaches.
25. ...finds ways to celebrate accomplishments.
26. ...experiments and takes rislcs with new approaches to his/her workeven when there's a chance of failure.
27. ...describes his/her sense of the future in ways that make othersexcited and enthusiastic.
28. ...gets others to feel a sense of omiershlp for the projectsthey Hork on.
29. ...makes certain others set clear goals, make plans, and establishmilestones for the projects be/she manages.
30. ...makes it a point to tell the rest of the organization about thegood work done by his/her group.
is £ <
S ^12 g £
>-<-.>.£S g S £ I5 5 o < «K O w ci. iZ
1 2 3 4 5^^^^Xr^oir^^ - -—d by
.o^iTllli: 1 2 3 4 5
...lets others know his/her beliefs on how to best run the 12 7^.organization he/she manages.«- tun tne
1 2 3 4 5
...gives the members of his/her team lots of appreciation andsupport for their contributions.
...asks. "What can we learn?", not "Who's to blame?" whenthings go wrong.
...talks confidently about where we are headed in the future.
1 2 3 4 5
1 2 3 4 5
1 2 3 4 5
1 2 3 4 5
1 2 3 4 5
1 2 3 4 5
1 2 3 4 5
1 2 3 4 5
1 2 3 4 5
1 2 3 4 5
1 2 3 4 5
(D Copyright 1984. 198S. 1986. Jaaes H. Kouzes and Barry Z. Posner
APPENDIX F
RECRUITMENT LETTER AND DEMOGRAPHIC DATA FORM
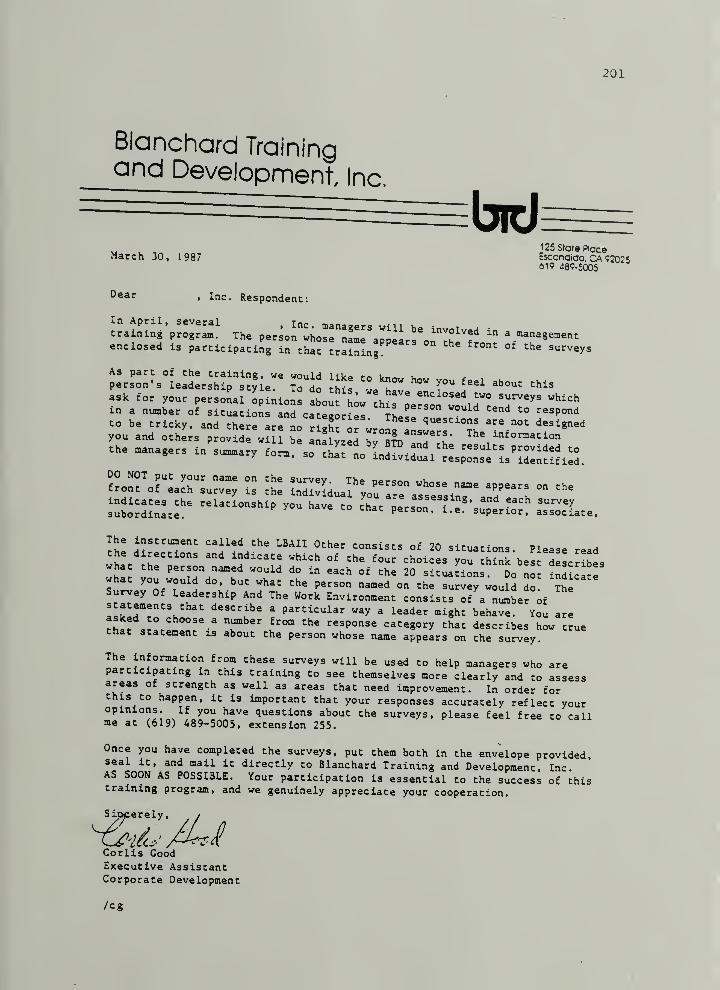
201
Blanchard Trainingand Development, Inc.
bid125 state Place
March 30, 1987 Esconaiao, CA, 92025619 489-5005
^^^^. Inc. Respondent:
lraZll.l\Toir:.] Xhe Per;o;";hor^^"a^'ears^n^^heTenclosed is parcicipacing in chat training °^ ^^"^^^^^
p:rs^"Me:d:r:hTs;yIe''^ ^^^do" '^^^ ^'^i^
ask for your personal o i;ion o^^L^'Ih fL^^^'ir "^^'^^
in a number of situations and categories ^Lc!'""^ '°
to be tricky, and there are L r5!hrquestions are not designed
you and othe;s pro^Lrwi InlTyzll ^rSlD^anrth
'
Che managers in s^ary form, so ^^tJ'l^^^'^^sZ^l/]^^,DO NOT put your name on the survey. The oerson uho=»f-rnnf r^f ^--u ,
' •person whose name appears on therronc ot each survey is the indiviHuai
ft"=a.Ls uu une
^u2^rd^::t:^^ —Lte.
^p^ir--:- -i^j^dj-^-;^^^wha the person named would do in each of the 20 situations. Do no ^ndica^ewhat you would do, but what the person named on the survey would do ?heSurvey Of Leadership And The Work Environment consists of a number ^f
'^^'"'"^ ^ particular way a leader might behave. You are
ch.r T response category that describes how trueChat statement is about the person whose name appears on the survey.
The information from these surveys will be used to help managers who areparticipating in this training to see themselves more clearly and to assessareas of strength as well as areas that need improvement. In order forthis to happen, it is important that your responses accurately reflect youropinions. If you have questions about the surveys, please feel free to callme at (619) 489-5005, extension 255.
Once you have completed the surveys, put them both in the envelope provided,seal it, and mail it directly to Blanchard Training and Development, Inc.AS SOON AS POSSIBLE. Your participation is essential to the success of thistraining program, and we genuinely appreciate your cooperation.
Siacerely, /
Corlis GoodExecutive AssistantCorporate Development
/eg
202
Demographic Information
mterpret the data and to batter understand how leadership praotices affect differentgroups of people. Your responses will remain oomplelely confidential.
Olrwstlons: Pl.e« • check next to ttia description that best applies to
Your sex:
you.
Your age:
Male
Female
How long have you been a naember of the work
unit for which your manager is responsible?
Less than 1 year
1 through 2 years
3 through 6 years
7 through 10 years
11 years or more
25 years old or less
26 years through 35 years
36 years through 45 years
46 years through 55 years
56 years or over
How long has your manager been
responsible for your woik unit?
Less than 1 year
1 through 2 years
3 through 6 years
7 through 10 years
11 years or more
How much formal education have you had? Your race is best described as:
Up to some high school
Completed high school
Some college
Completed college
Completed graduate school
(Degree obtained:
White
Black
Hispanic
Asian
Native American
Other - (Please specify:
)
In addition to being used for management training in your organization, your responses to these
questionnaires could also be used in an important national study on how leadership behaviors affect
the work environment Your responses will remain anonymous. If you are nfll willing to have your
responses included as part of this study, please check this box: No
REFERENCES
Ackerman, Linda S "Tho tpi^,, o+.,i.
Adams, John D. (ed.) . Transforming Work- A CollerH^r, „f „tional Transfor,n..
, ,
I n i??" „^ ^M^^IJ'Rxver Press. iQRzi ' ^-^^y^nia. lyiiies
Adizes itchak. "Organizational Passages: Diagnosing and Treatina
llll^: llfs':^'°' organizations." Or^aniza^ional'D;:^:?L
,
Allen Robert F. and Kraft, Charlotte. "Transformations That Last- Acultural Approach," in Adams, John D. (ed.) Transforming Work -"
ICollection of Organizational Transformation Readings . Ai.^.n^—
Virginia^ Miles River Press, 1984.~ — """^^^"^^i^'
Psychological Testing. New York: Macmillan, 1965.
Bass 'Bernard M. Leadership and Performance Beyond Expectations . NewYork: Macmillan, 1985. —Bass, Bernard M. Stogdill's Handbook of Leadership . New York • The •
Free Press, 1981.
Belenky, M.F., Clinchy, B.M., Goldberger, N.R., and Tarule , J.M.Women's Ways of Knowing . New York: Basic Books, 1986.
Bennis, Warren G. "The Four Competencies of Leadership." Training andDevelopment Journal , 1984, 38 (8) .
Bennis, Warren and Nanus, Bert. Leaders: The Strategies for TakingCharge . New York: Harper and Row, 1985. ~ ~
Berlew, David E. "Leadership and Organizational Excitement," inCalifornia Management Review
, 1974, 17, 21-30.
Blake, R.R. and Mouton, Jane S. The Managerial Grid . Houston,Texas: Gulf Publishing Co., 1964.
Blanchard, Kenneth H. Situational Leadership II . Escondido, Califor-nia: B Ianchard Training and Development, 1985.
Bolman, Lee and Deal, Terrence. Modern Approaches to Understanding andManaging Organizations . San Francisco, California: Jossey-Bass,1984
.
204
Row, 1978,
Boulding, Kenneth. "General Systems Theorv—Th^ cjVoi ^in Buckley, Walter (^ri \ MrJ^"^^^^ Skeleton of Science,"
^J- bcientist. Chicago: Aldine Publishing Co., 1968:
Bowers, D.G. and Seashore. S F "-dy-^^a^^--
ness With a Pou.-Pac;o^?.eorr:f L Sr^^lr^L^ffuvr"Science Quarterly . 1966, 11 , 238-263.Administrative
Burns, James McGregor. Leadership . New York: Harper and
Carew Donald K Parisi-Carew, Eunice, and Blanchard, Kenneth HGroup Development and Situational Leadership: A Model £r*
iSiil^^^^ and
Cronbach. "Coefficient Alpha and the Internal Structure of Tests "Psychometrika
. 1951, December, 297-334.
'''^'''n!ll!\i.!''^°''^°^ Leadership Effectivene...
.New York : McGraw-
Fiedler, F. "The Contingency Model: New Directions of Leadership Uti-lization. Journal of Contemporary Business , Autumn 1974, 65-80.
Follett, Mary Parker. Dynamic Administration . New York: Harper andRow, 1941.'
Fritz, Robert. The Path of Least Resistance . Hanover, Mass.- Halli-day Lithograph, Inc., 1984.
Gaffney, Rachel. "Systems Thinking in Business: An Interview withPeter Senge," in ReVISION , 1984, 7_, 56-63.
Garfield, Charles A. Peak Performance: Mental Training Techniques ofthe World 's Greatest Athletes . New York: Warner Books, 1984.
Gilligan, Carol. In a Different Voice: Psychological Theory andWomen's Development . Cambridge, Massachusetts: Harvard Univer-sity Press, 1982.
Hersey, Paul and Blanchard, Ken. Management of Organizational Behav-ior. Englewood Cliffs, New Jersey: Prentice-Hall Inc., 1969.
House, R.J. "A Path-Goal Theory of Leader Effectiveness." Administra-tive Science Quarterly , 1971, 16^, 321-338.
House, R.J. and Baetz, M.L. "Leadership: Some Empirical Generaliza-tions and New Research Directions," in Staw, B.M. (ed.) Researchin Organizational Behavior . Greenwich, Connecticut: JAI Press,1979.
205
Q^ga^ization Developmen t: and Chanae d= ,
West Publishing Co., 1980." ^^^1' Minnesota:
lacocca, Lee. lacocca . New York: Bantam, 1984.
Mxa..,.,.= Unxversity Microfilms "inteinatlo^i!' igerJacques. Elliott. Ti.e-Span Handbook. London: Hainemann. 1964.
Kahn R.L. and Katz, D. "Leadership Practices in Relationshio toProductxvity and Morale," in Cartwright, Darwin and zj^der! Alvin(eds.)^GroupDynam.cs. Evanston, Illinois: Row, Peters" and
"^"''shus^I^'Ss""''-"^""^^ "^"''-'<= Simon and
''^^\l:^''LZTAT'T,.:''' ^^-^--3 Approach. Hew
""'Hrj:rKr'„iS?; LI:"-"^-"-^--^ Oraani..t,on-.
Kiefer, Charles F. A Pocket Companion to Leadership and MasteryFramingham, Massachusetts
: Innovation Associates, 1983.
Kiefer, Charles F. and Senge, Peter. "Metanoic Organizations," inAdams, John D. (ed.) Transforming Work: A Collection of Organi-zational Transformation Readings . Alexandria, v-i ^g-i r,-; . .
Rxver Press, 1984.
Kiefer, Charles F. and Stroh, Peter. "A New Paradigm for DevelopingOrganizations," in Adams, John D. (ed.) Transforming Work: ACollection of Organizational Transformation Readings .
Alexnadria, Virginia: Miles River Press, 1984.
Kimberly, John R. and Miles, Robert H. The Organizational Life Cycle .
San Francisco, California: Jossey-Bass, 1980.
Kouzes, James M. and Posner, Barry Z. The Leadership Practices Inven-tory; Trainer's Manual . San Diego, California: UniversityAssociates, 1988.
Kouzes, James M. and Posner, Barry Z. The Leadership Practices Inven-tory ; Other . San Diego, California: University Associates, 1988,
206
Kouzes, James M. and Posner, Barry Z. The Leadershin rh.nto Get Extraordinary Thi n.sjone,i^^^|^^California: Jossey Bass, 1987. ' ^^rancisco,
Kouzes James M. and Posner, Barry Z. "i^e Eye of the Follower "Administrative Radiology . 1986, April.
^oiiower.
^'"'Seorv' V' ^^f- ^V-^le of Groups: Gronn nevelopment StaaPTheory. New York: Human Service Press, 1980. —Latham, Gary and Locke, Edwin. "Goal Setting - a Motivational Tech-nique That works." Organizational Dvnami . Autumn, 1979.
Lawrence, P and Lorsch, J. Organization and Environment . Cambridge-Harvard University Press, 1969.'
^c^iiiuriage
.
^^^^^^'J^^^^^^^'New Patterns of Management . New York: McGraw-Hill
Lippitt, R., Watson, J., and Westley, B. The Dynamics of PlannedChange. New York: Harcourt, Brace, 1958.'
Maslow, A.H. Motivation and Personality . New York: Harper, 1954.
Mayo, Elton. The Social Problems of an Industrial Civilization.Boston: Harvard Business School, 1945.
~
McGregor, Douglas. "The Human Side of Enterprise" in Bennis, Warren Gand Schein, Edgar H. (eds.) Leadership and Motivation: Essays ofDouglas McGregor . Cambridge
, Massachusetts : M.I.T. Press, 1966.
Morris, William (ed.). The American Heritage Dictionary of the English
Language . Boston, Massachusetts: Houghton Mifflin Co., 1976.
Mott, Paul E. The Characteristics of Effective Organizations . NewYork: Harper and Row, 1972.
Naisbitt, John. Megatrends . New York: Warner, 1982.
Ouchi, William. Theory Z; How American Business Can Meet the JapaneseChallenge . Reading, Massachusetts: Addison-Wesley , 1981.
Pascale, Richard and Athos , Anthony. The Art of Japanese Management .
New York: Simon and Schuster, 1981.
Peters, Thomas and Austin, Nancy. A Passion for Excellence . New York:Warner Books, 1985.
Peters, Thomas J. and Waterman, Robert H., Jr. In Search of Excel -
lence . New York: Warner Books, 1984.
207
Pondy, Louis R. and Mitroff T^n t ^ ^Organization " Vn p u
^^Yond Open System Models of
l! 3-39Research m Organizational Behavior . 197^
Posner, Barry Z. Personal Conununication, September 4, 1986.
''''^^raltitV''^Pacanowsky, Michael (eds.). Communication andorganizations: An Interpretive Persoecti ..^-^.TT-TT-^
California: Sage Publications, 1983.nxiis,
Sashkin, Marshall and Fulmer, Robert M. "Toward an OrganizationalLeadership Theory," in Hunt, J.G., Baliga, B.R., DachlS H Pand Schriesheim, C.A. (eds.) Emerging Leadership vi ....'
Lexington, Massachusetts: Lexington Books, 1987.
""'^^n'e, Zy! -^i-il^-^
'"'^'"'/^f^^^^J-Trainer Guide: Leader Behavior Questionnaire .Bryn^Mawr, Pennsylvania: Organization Design and Development,
Sashkin, Marshall and Fulmer, Robert. A New Framework for Le.d.r.HHp.Vision, Charisma, and Culture. Paper presented at the Biennial •
July 1985^2y™P°siuin, Texas Tech University, Lubbock, Texas,
Sashkin, Marshall. "Leadership Style and Group Decision Effectiveness-Correlational and Behavioral Tests of Fiedler's Contingency Model,"Organizational Behavior and Human Performance
, 1972, 8, 347-362.
Schein, Edgar. Organizational Culture and Leadership . San Francisco,California: Jossey-Bass , 1985.
Schein, Edgar. Process Consultation: Its Role in Organization Devel-opment
. Reading, Massachusetts: Addison-Wesley , 1969.
Shaw, M.E. Group Dynamics: The Psychology of Small Group Behavior .
New York: McGraw-Hill, 1981. '
"
Sisk, Dorothy and Shallcross, Doris. Leadership: Making Things Happen .
Buffalo, New York: Bearly Limited, 1986.'
Smircich, Linda. "Implications of the Interpretive Paradigm for Manage-ment Theory," in Putnam, Linda and Pacanowsky, Michael (eds.)Communication and Organizations: An Interpretive Perspective .
Beverly Hills, California: Sage Publications, 1983.
208
Smircich, Linda and Morgan, Gareth "t f^^riovoK^
Sorenson, T. Kennedy. New York: Bantam Books, 1966.
Stogdill, R.M. and Coons, A.E. Leader Behavior: its Descriotion ^
Leader Behavior Description Questionnaire - Pn^ xil
Sse^ch,'Ohio State ulu^^iTiliT^^^^
Stroh Peter. "The O.D. Practitioner as a Visionary Leader," inVisxon/Actxon: The Journal of the Bay Area on^
1934,
Tannenbaum, Robert and Schmidt, Warren. "How to Choose a Leadership
95 101"'Harvard Business Review . March-April 19 58, 36,
Taylor, Fredrick W. The Principles of Scientific Manaa....n. NewYork: Harper and Brothers, 1911.~ ~
Taylor, J.C. and Bowers, D.G. Survey of Organizations . Ann Arbor,Michigan: Institute for Social Research, The University ofMichigan, 1972.
^^"""^Se?^^^'^ °* Organizations in Action
. New York: McGraw-Hill,
Tichy, Noel M. and Devanna, Mary Anne. "The Transformational Leader."Training and Development Journal , 1986, July, 27-32.
Vaill, Peter B. "Toward a Behavioral Description of High-PerformingSystems," in McCall, M.W. Jr. and Lombardo, M.M. (eds.).Leadership
: Where Else Can We Go? Durham, North Carolina:Duke University Press, 1978.
Weick, Karl. The Social Psychology of Organizing . Reading, Massachu-setts: Addison Wesley, 1979.
Wilner, A.R. Charismatic Political Leadership: A Theory . Princeton,New Jersey: Princeton University, Center for InternationalStudies, 1968.
Yukl, G. "Toward a Behavioral Theory of Leadership." OrganizationalBehavior and Human Performance
, 1971, 6, 414-440.
209
'^"''Ha^^.^'f • "^^"-g-- and Leaders: Are They Different-Harvard Business Review . 1977, 55 (5), 67-80.
Zigarmi Drea. Personal communication of unpublished research conducted at Blanchard Training and Development, Escond'oCalifornia, October 31, 1986.^^^^onaiao.