Embed Size (px)
Citation preview
YEAR THREE REPORTFebruary 2017
No goal is more ambitious than zero, but at the same time no other goal is acceptable. We have accomplished a lot in the first three years of Vision Zero, but we will not rest until we have accomplished that ultimate goal.
Mayor Bill de Blasio
VISION ZERO YEAR THREE REPORT 3
Table of Contents
Vision Zero Year Three
4 Executive Summary
8 Vision Zero By the Numbers
10 STATISTICS AND METRICS
Traffic Fatalities in 2016
17 DATA-DRIVEN SOLUTIONS
Cross-Agency Evaluation and Data-Driven Collaboration
24 ENGINEERING
Designs to Protect the Most Vulnerable Users
38 ENFORCEMENT
Focus on the Prevention of Serious Crashes
48 FLEETS
Expanded Technology for Safer City Vehicles
57 ENGAGEMENT
Connecting with New Yorkers Where They Live
Vision Zero Year Four
66 Vision Zero Year Four Initiatives
Appendix
69 Year One Scorecard
72 Year Two Scorecard
74 Year Three Scorecard
75 Glossary
77 Helpful Links
78 Task Force Members
VISION ZERO YEAR THREE REPORT4
Vision Zero Year Three
Executive Summary
2016 had the fewest traffic fatalities on record, improving on a record year in 2015. The first three years of Vision Zero is the safest three-year period in New York City’s history.
Vision Zero's progress in preventing serious crashes is encouraging, because
it indicates that the City’s strategy is working. However, even in the City’s
safest year there was a fatal crash every 38 hours. New Yorkers are still losing
their lives in traffic crashes, and their families and neighbors must grapple with
the grief caused by sudden loss. Much remains to be done in order to reach
Mayor de Blasio’s goal of zero deaths.
The following pages summarize the City’s progress to date and introduce new
initiatives that build on the accomplishments of Vision Zero’s first three years.
The City will continue to refine its strategies and develop new tactics in order
to accelerate progress towards eliminating fatalities and serious injuries on
City streets.
Statistics and Metrics // Year Three
Priority Corridors, Intersections and Areas
In 2015, New York City Department of Transportation (DOT) and New York
Police Department (NYPD) outlined a strategy in the Borough Pedestrian
Safety Action Plans, concentrating street redesign, enforcement, education
and engagement resources on the most high-crash corridors and intersections
in each borough. This effort is proving effective. Declines in traffic fatalities at
these locations are outpacing the citywide decline in traffic deaths. For the
five years prior to Vision Zero there were 141 deaths annually at Vision Zero
priority locations; this year, there were 100 fatalities, a 29 percent decline. For
pedestrians, there was a similar decline: from an average of 99 fatalities a year
from 2009-2013 at such locations to 72 in 2016, 27 percent lower.
VISION ZERO YEAR THREE REPORT 5
Data-Driven Solutions // Year Three
Cross-Agency Evaluation and Data-Driven Collaboration
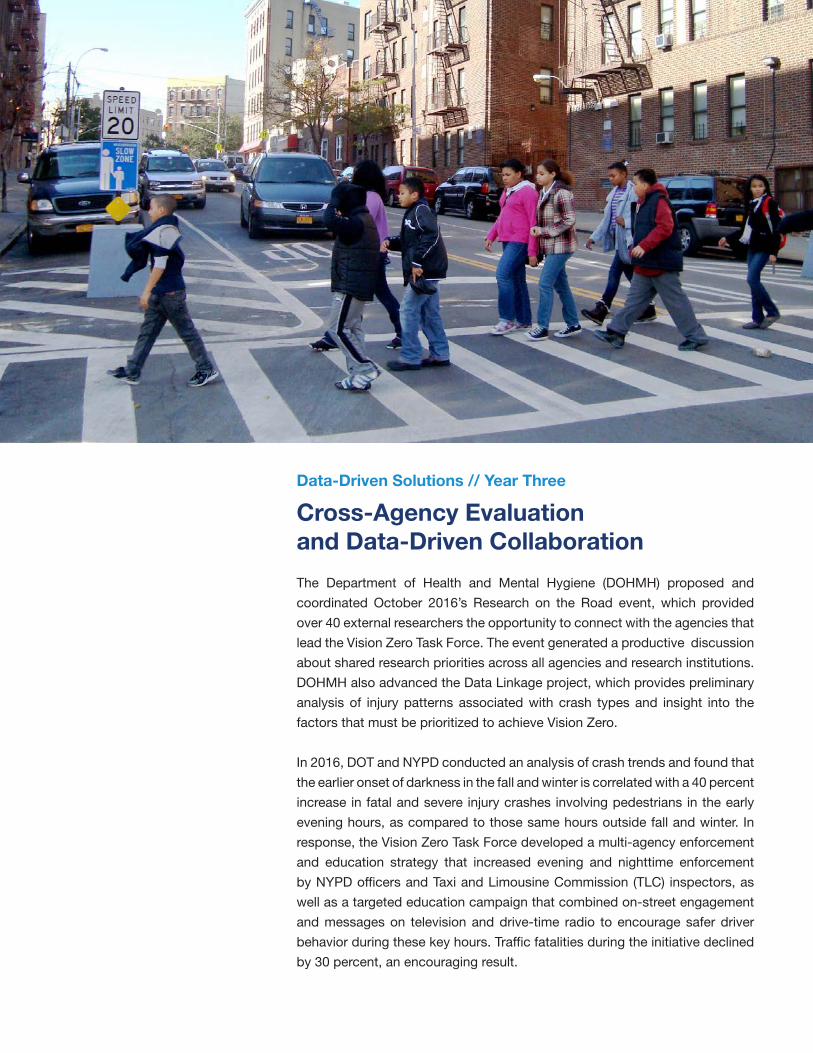
The Department of Health and Mental Hygiene (DOHMH) proposed and
coordinated October 2016’s Research on the Road event, which provided
over 40 external researchers the opportunity to connect with the agencies that
lead the Vision Zero Task Force. The event generated a productive discussion
about shared research priorities across all agencies and research institutions.
DOHMH also advanced the Data Linkage project, which provides preliminary
analysis of injury patterns associated with crash types and insight into the
factors that must be prioritized to achieve Vision Zero.
In 2016, DOT and NYPD conducted an analysis of crash trends and found that
the earlier onset of darkness in the fall and winter is correlated with a 40 percent
increase in fatal and severe injury crashes involving pedestrians in the early
evening hours, as compared to those same hours outside fall and winter. In
response, the Vision Zero Task Force developed a multi-agency enforcement
and education strategy that increased evening and nighttime enforcement
by NYPD officers and Taxi and Limousine Commission (TLC) inspectors, as
well as a targeted education campaign that combined on-street engagement
and messages on television and drive-time radio to encourage safer driver
behavior during these key hours. Traffic fatalities during the initiative declined
by 30 percent, an encouraging result.
VISION ZERO YEAR THREE REPORT6
Engineering // Year Three
Designs to Protect the Most Vulnerable Users
Since the beginning of Vision Zero, DOT has completed 242 Safety Engineering
Projects. These redesigns make New Yorkers safer by simplifying complex in-
tersections, narrowing lanes, adding bicycle paths, making pedestrians and
cyclists more visible, and shortening pedestrian crossing distances. In 2016,
DOT implemented 105 of these Safety Engineering Projects—more than ever
before, and at more than double the pace of implementation prior to Vision
Zero. Notably, in 2016 a record-breaking 18.5 miles of protected bike lanes
were installed, triple the number DOT installed prior to Vision Zero. Addition-
ally, DOT installed 776 Leading Pedestrian Intervals (LPIs), bringing the total
completed under Vision Zero to 1,248—nearly 5 times the number of LPIs that
existed in New York prior to Vision Zero. In 2016, DOT also launched the Left
Turn Traffic Calming pilot at 107 locations across the City. These treatments
have proven effective at reducing median left turn speeds by 24 percent,
which will make pedestrians safer at those locations.
Enforcement // Year Three
Combatting Dangerous Driving Behavior
NYPD’s focus on consistent and predictable enforcement deters reckless
driving, prevents crashes, and saves lives. Indeed, 60 percent of all traffic
violations that NYPD issued in 2016 were for Vision Zero hazardous violations.
NYPD officers issued over 137,000 speeding summonses in 2016, a 78
percent increase over the five year average prior to Vision Zero. Over 42,000
summonses were issued to motorists who failed to yield to pedestrians in the
crosswalk, an increase of 243 percent over the five year average prior to Vision
Zero. In addition, NYPD officers issued over 1,900 summonses and made 39
arrests of drivers who struck a pedestrian or cyclist in violation of the Right of
Way law.
VISION ZERO YEAR THREE REPORT 7
Fleets // Year Three
Expanded Technology for Safer City Vehicles
The largest fleets in the City are: the for-hire vehicle sector, which is regulated
by TLC; the City’s government vehicle fleet, which is regulated in part by
the Department of Citywide Administrative Services (DCAS); and the public
buses, which are operated by the Metropolitan Transit Authority (MTA). All
three of these agencies are preventing serious crashes by strengthening their
drivers’ skills through enhanced Vision Zero training regimens, which includes
a segment featuring members of Families for Safe Streets talking about the
devastating loss of loved ones in traffic crashes. These three agencies have
trained over 70,000 vehicle operators since the beginning of Vision Zero.
After extensive research, TLC developed rules to prevent for-hire vehicle
operators from driving while excessively fatigued. DCAS, after conducting
extensive research about distracted driving, developed and announced a
policy prohibiting City employees from using any cell phones, even with a
hands-free set. MTA expanded their pilot of collision avoidance sensor and
pedestrian alert technologies to prevent serious crashes, and will expand it
further in 2017.
Engagement // Year Three
Connecting with New Yorkers Where They Live
In September 2016, the Department of Education announced the development
and implementation of the Cross This Way curriculum for elementary and
middle school students. This curriculum was informed by data analysis
performed by DOT, and teaches children about the risks posed by reckless
driving and ways to help protect themselves.
The Task Force also expanded the Vision Zero ad campaign in 2016, increased
the visibility of the campaign and targeted the ads according to crash data,
DOHMH surveys, and other data. The advertisements are proving effective at
changing attitudes: 75 percent of New Yorkers report that the campaign leads
them to expect more enforcement, and 82 percent report that they are more
likely to drive carefully and yield to pedestrians when turning at crosswalks.
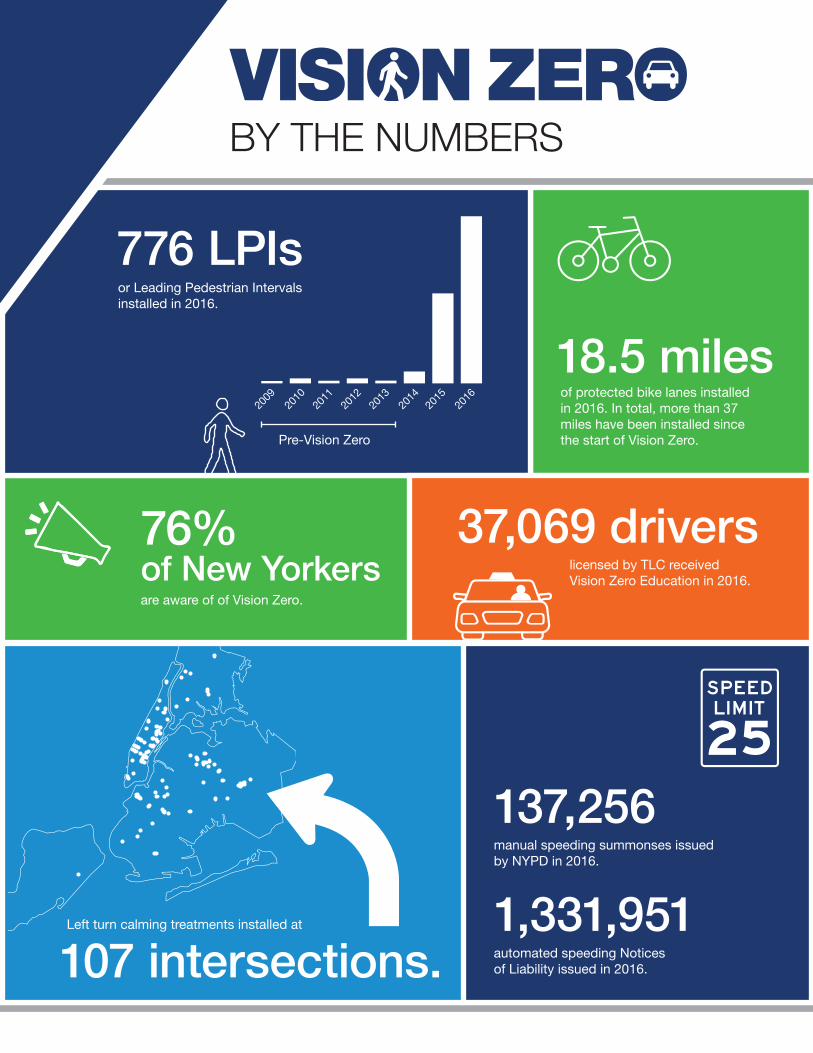
BY THE NUMBERS
776 LPIsor Leading Pedestrian Intervals installed in 2016.
18.5 milesof protected bike lanes installed in 2016. In total, more than 37 miles have been installed since the start of Vision Zero.
licensed by TLC received Vision Zero Education in 2016.
manual speeding summonses issued by NYPD in 2016.
are aware of of Vision Zero.
automated speeding Notices of Liability issued in 2016.
Pre-Vision Zero
2009
2010
2011
2012
2013
2014
2015
2016
37,069 drivers
137,256
76% of New Yorkers
1,331,951107 intersections.Left turn calming treatments installed at
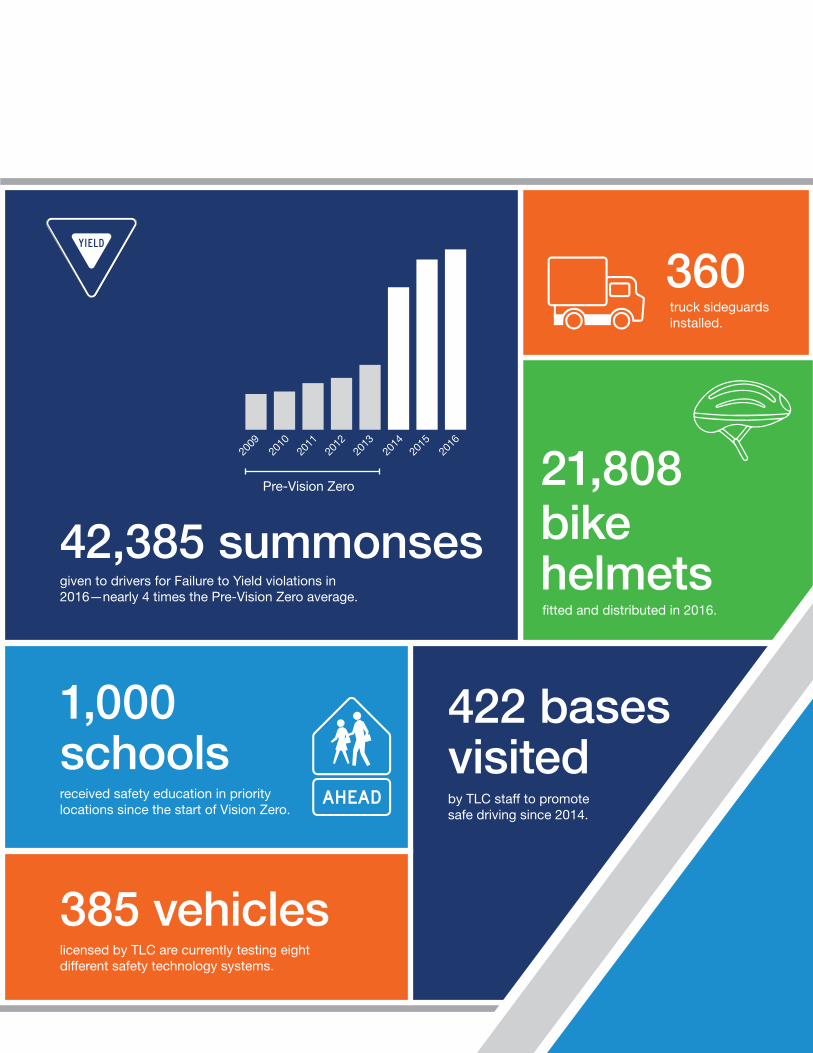
42,385 summonses
1,000 schools
385 vehicles
360
21,808bike helmetsgiven to drivers for Failure to Yield violations in
2016—nearly 4 times the Pre-Vision Zero average.
received safety education in priority locations since the start of Vision Zero.
licensed by TLC are currently testing eight different safety technology systems.
truck sideguards installed.
fitted and distributed in 2016.
by TLC staff to promote safe driving since 2014.
Pre-Vision Zero
2009
2010
2011
2012
2013
2014
2015
2016
422 bases visited
VISION ZERO YEAR THREE REPORT10
VISION ZERO YEAR THREE REPORT 11
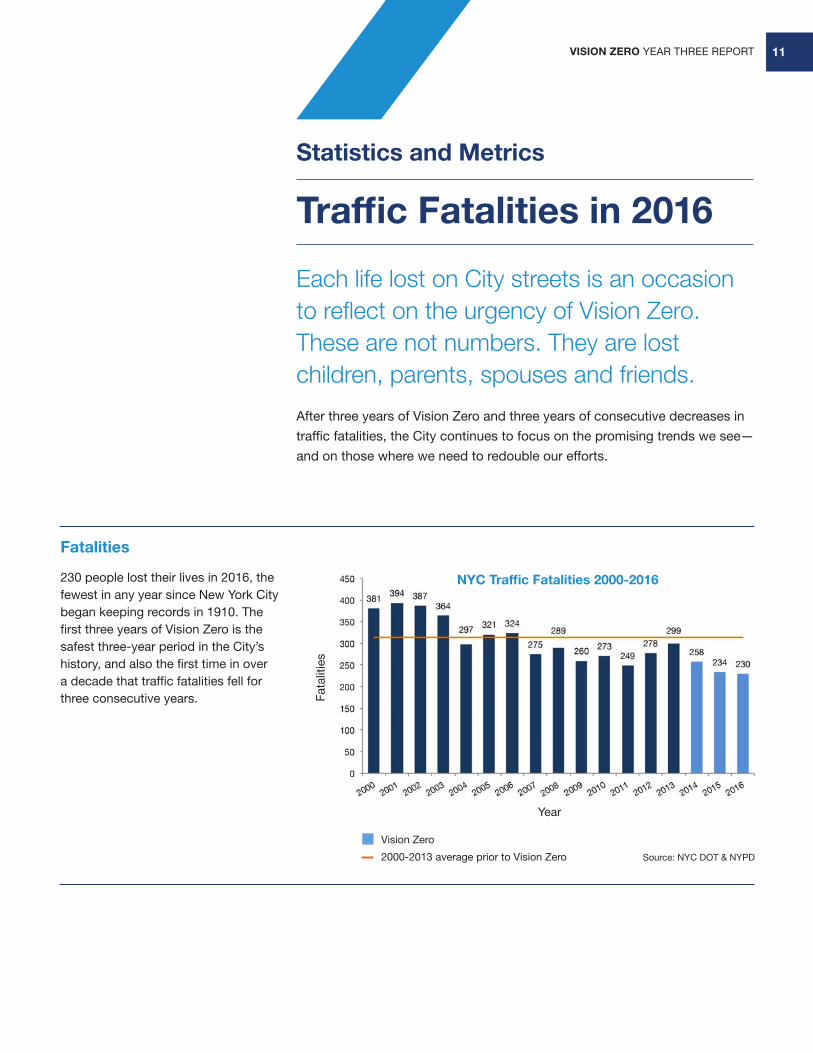
Statistics and Metrics
Traffic Fatalities in 2016
Each life lost on City streets is an occasion to reflect on the urgency of Vision Zero.These are not numbers. They are lost children, parents, spouses and friends.
After three years of Vision Zero and three years of consecutive decreases in
traffic fatalities, the City continues to focus on the promising trends we see—
and on those where we need to redouble our efforts.
Fatalities
230 people lost their lives in 2016, the fewest in any year since New York City began keeping records in 1910. The first three years of Vision Zero is the safest three-year period in the City’s history, and also the first time in over a decade that traffic fatalities fell for three consecutive years.
Year
Fata
litie
s
Source: NYC DOT & NYPD
Vision Zero
2000-2013 average prior to Vision Zero
NYC Traffic Fatalities 2000-2016
VISION ZERO YEAR THREE REPORT12
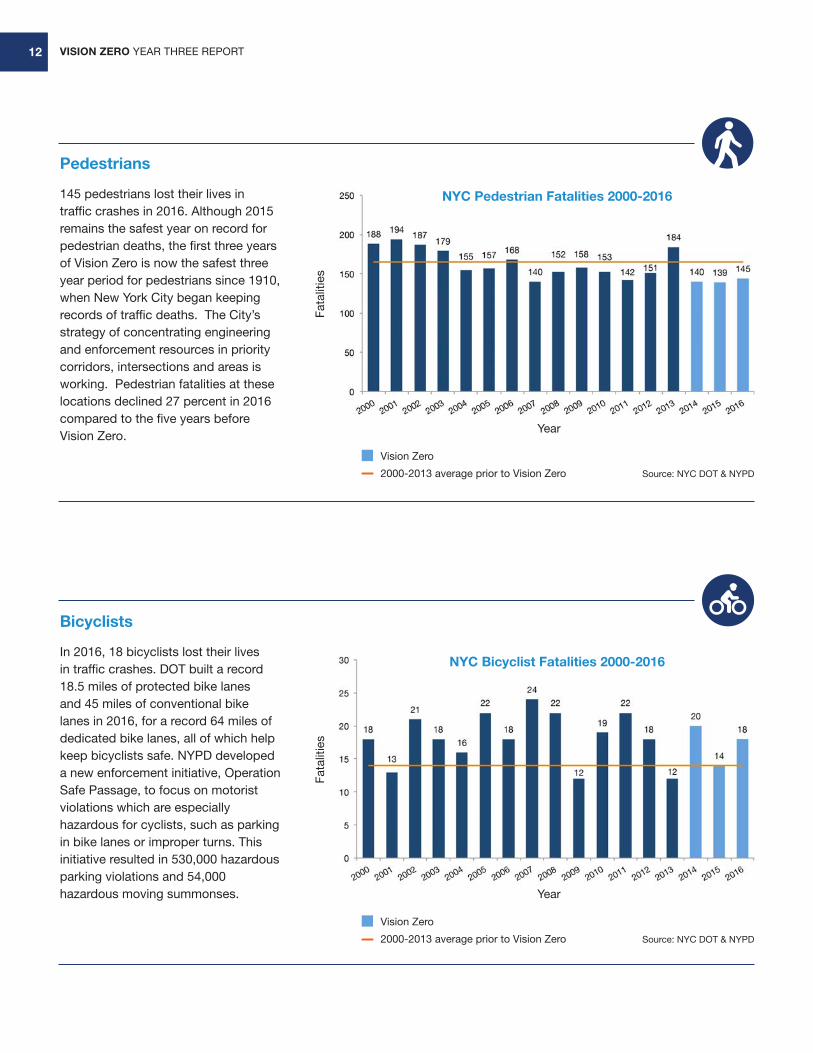
Pedestrians
145 pedestrians lost their lives in traffic crashes in 2016. Although 2015 remains the safest year on record for pedestrian deaths, the first three years of Vision Zero is now the safest three year period for pedestrians since 1910, when New York City began keeping records of traffic deaths. The City’s strategy of concentrating engineering and enforcement resources in priority corridors, intersections and areas is working. Pedestrian fatalities at these locations declined 27 percent in 2016 compared to the five years before Vision Zero.
Bicyclists
In 2016, 18 bicyclists lost their lives in traffic crashes. DOT built a record 18.5 miles of protected bike lanes and 45 miles of conventional bike lanes in 2016, for a record 64 miles of dedicated bike lanes, all of which help keep bicyclists safe. NYPD developed a new enforcement initiative, Operation Safe Passage, to focus on motorist violations which are especially hazardous for cyclists, such as parking in bike lanes or improper turns. This initiative resulted in 530,000 hazardous parking violations and 54,000 hazardous moving summonses.
Year
Year
Fata
litie
sFa
talit
ies
Source: NYC DOT & NYPD
Source: NYC DOT & NYPD
Vision Zero
2000-2013 average prior to Vision Zero
Vision Zero
2000-2013 average prior to Vision Zero
NYC Pedestrian Fatalities 2000-2016
NYC Bicyclist Fatalities 2000-2016
VISION ZERO YEAR THREE REPORT 13
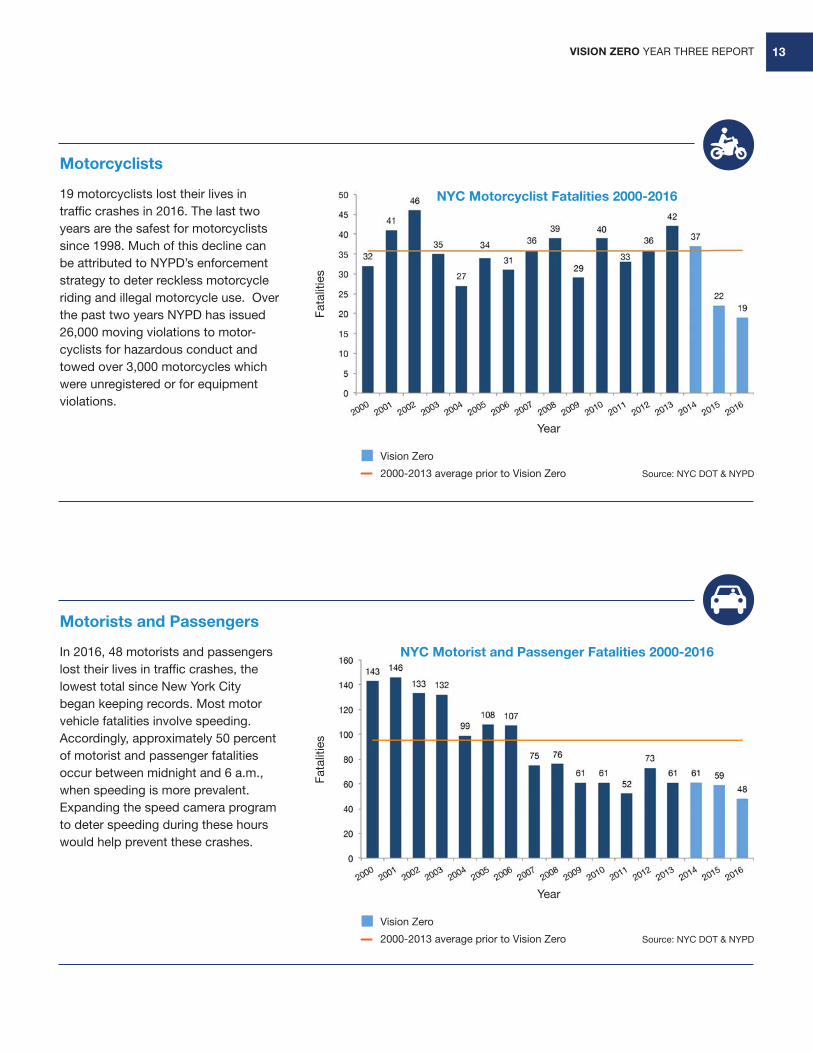
Motorcyclists
19 motorcyclists lost their lives in traffic crashes in 2016. The last two years are the safest for motorcyclists since 1998. Much of this decline can be attributed to NYPD’s enforcement strategy to deter reckless motorcycle riding and illegal motorcycle use. Over the past two years NYPD has issued 26,000 moving violations to motor-cyclists for hazardous conduct and towed over 3,000 motorcycles which were unregistered or for equipment violations.
Motorists and Passengers
In 2016, 48 motorists and passengers lost their lives in traffic crashes, the lowest total since New York City began keeping records. Most motor vehicle fatalities involve speeding. Accordingly, approximately 50 percent of motorist and passenger fatalities occur between midnight and 6 a.m., when speeding is more prevalent. Expanding the speed camera program to deter speeding during these hours would help prevent these crashes.
Year
Year
Fata
litie
sFa
talit
ies
Source: NYC DOT & NYPD
Source: NYC DOT & NYPD
Vision Zero
2000-2013 average prior to Vision Zero
Vision Zero
2000-2013 average prior to Vision Zero
NYC Motorcyclist Fatalities 2000-2016
NYC Motorist and Passenger Fatalities 2000-2016
VISION ZERO YEAR THREE REPORT14
60 60
80 80
Pedestrian Safety Action Plans
In 2015, the Department of Transportation (DOT) and the New York City Police
Department (NYPD) released five Borough Pedestrian Safety Action Plans.
These plans analyzed pedestrian deaths and serious injuries (KSI) which
occurred between 2009 and 2013, to identify the approximately 8 percent
of New York’s corridors on which 51 percent of pedestrian KSI occurred, the
nearly 1 percent of intersections where 15 percent of pedestrian KSI occurred,
and the 19 percent of land area where 50 percent of pedestrian KSI occurred.
In addition, DOT and NYPD integrated insights from New Yorkers through 28
Vision Zero town halls and public workshops and more than 10,000 recom-
mendations submitted through the online Vision Zero Public Input Map, which
aided the development of solutions for these priority corridors, intersections
and areas. DOT and NYPD, within the Borough Pedestrian Safety Action
Plans, are implementing a number of strategies to prevent serious crashes at
priority locations. Since the beginning of Vision Zero:
» DOT has completed 178 safety engineering projects at priority locations.
» NYPD and DOT Street Teams have deployed at more than 350 priority locations
» DOT has activated over 1,200 Leading Pedestrian Intervals to give pedestrians a head start as they cross the street at priority locations.
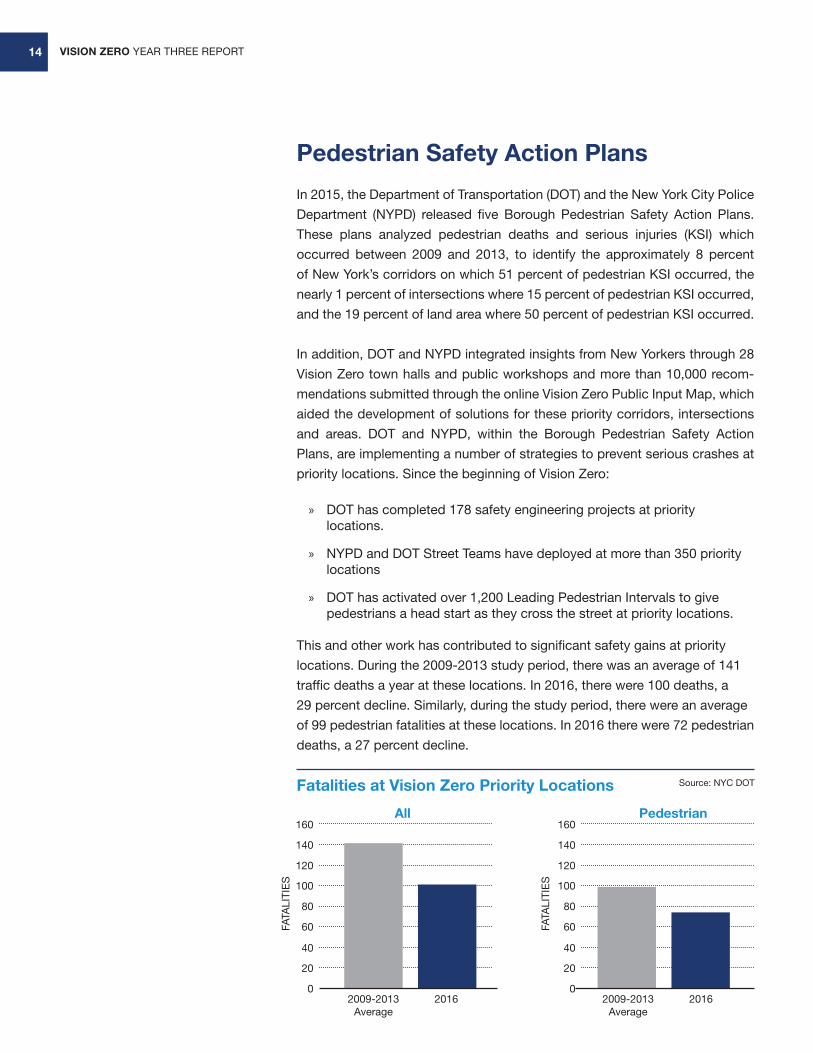
This and other work has contributed to significant safety gains at priority
locations. During the 2009-2013 study period, there was an average of 141
traffic deaths a year at these locations. In 2016, there were 100 deaths, a
29 percent decline. Similarly, during the study period, there were an average
of 99 pedestrian fatalities at these locations. In 2016 there were 72 pedestrian
deaths, a 27 percent decline.
20 20
0 0
40 40
100 100
120 120
140 140
160 160
Fatalities at Vision Zero Priority Locations Source: NYC DOT
All Pedestrian
FATA
LITI
ES
FATA
LITI
ES
2009-2013 Average
2009-2013 Average
20162016
VISION ZERO YEAR THREE REPORT 15
Vision Zero Nationwide Spotlightby Jeff Michael Co-Chair, Road to Zero Coalition
In 2015, 35,092 people lost their lives in traffic crashes in America—a 7.2
percent increase over the previous year, and the biggest single-year increase
since 1966. Preliminary estimates for January through September of 2016
indicate a further increase in traffic fatalities of approximately 8 percent as
compared to the same months of 2015.
In response, the U.S. Department of Transportation and the National Safety
Council joined with dozens of nonprofit groups, public health officials and
technology companies to launch the Road to Zero Coalition in October 2016
with the goal to end traffic fatalities in the United States within 30 years.
The Road to Zero Coalition will initially focus on promoting proven lifesaving
strategies, such as improving seat belt use, truck safety, roadway improve-
ments, behavior change campaigns and data-driven enforcement. Addition-
ally, the Coalition will lead the development of a scenario describing how
an American community 30 years from now will achieve zero traffic deaths.
This 30-year vision will project how advanced vehicle technology—including
high levels of automation, together with improvements in roadway design,
road user behavior and emergency care—will contribute to the elimination
of traffic deaths. Our focus will be to identify innovative technology, policy
and programs that will ensure that inevitable human mistakes do not result in
fatalities.
This is a dramatic reorientation of the federal governments’ approach. We
were inspired by the Toward Zero Death National Strategy and the Vision Zero
movement that began in Sweden in 1997, as well as the leadership shown by
cities like New York and twenty-one others which have adopted a Vision Zero
goal.
Achieving Vision Zero across the United States will require new innovative
approaches and strategic planning. As important, however, is that local, state
and national governments act with urgency. The work of the Road to Zero
Coalition is to plot out how our nation attains that goal.
VISION ZERO YEAR THREE REPORT16
Vision Zero is promoting cross-disciplinary research collaborations.
VISION ZERO YEAR THREE REPORT 17
Data-Driven Solutions
Cross-Agency Evaluation and Data-Driven CollaborationVision Zero is personal. The Vision Zero Task Force uses data shared across agencies and departments to identify problems, find solutions and ultimately, protect the lives of New Yorkers on the street.
DataKind
DOT teamed up with DataKind, a data science nonprofit, to develop a compre-
hensive injury/fatality analytical model which can help the City understand how
engineering treatments, such as bike lanes, median extensions, or pedestrian
plazas interact with the existing conditions of an area to impact traffic injuries
and fatalities. The model considers close to 100 factors including crash data
and project history, census data, motor vehicle volume estimates, land use
data and transit usage in order to present a clearer picture of the engineering
intervention’s effectiveness. Once complete, this model will serve to help refine
DOT’s engineering workplan, as well as help develop and evaluate policies
and programs based upon insights derived from the data.
Driver Behavior Index
In 2014 the New York City Department of Citywide Administrative Services
(DCAS) began installing CANceiver devices which record information about
speeds, hard braking and hard acceleration. The installation of these devices
on the 29,000 vehicle fleet with 80,000 authorized vehicle operators provides
the opportunity to gain an unprecedented amount of information about driver
behavior taking place on corridors across New York City.
VISION ZERO YEAR THREE REPORT18
DOT will be working with the Smart Cities Center at Columbia University to
create a Driver Behavior Index (DBI) system that will assist the agency in the
planning and implementation of Vision Zero safety engineering projects and
programs. The DBI system will be a safety ranking and classification system
of NYC corridors and intersections, based on driver behavior data drawn
from DCAS CANceiver fleet data. This data would be combined with DOT
crash data to create several easy to understand metrics and classifications
that would give planners and project managers a quick understanding of a
particular location.
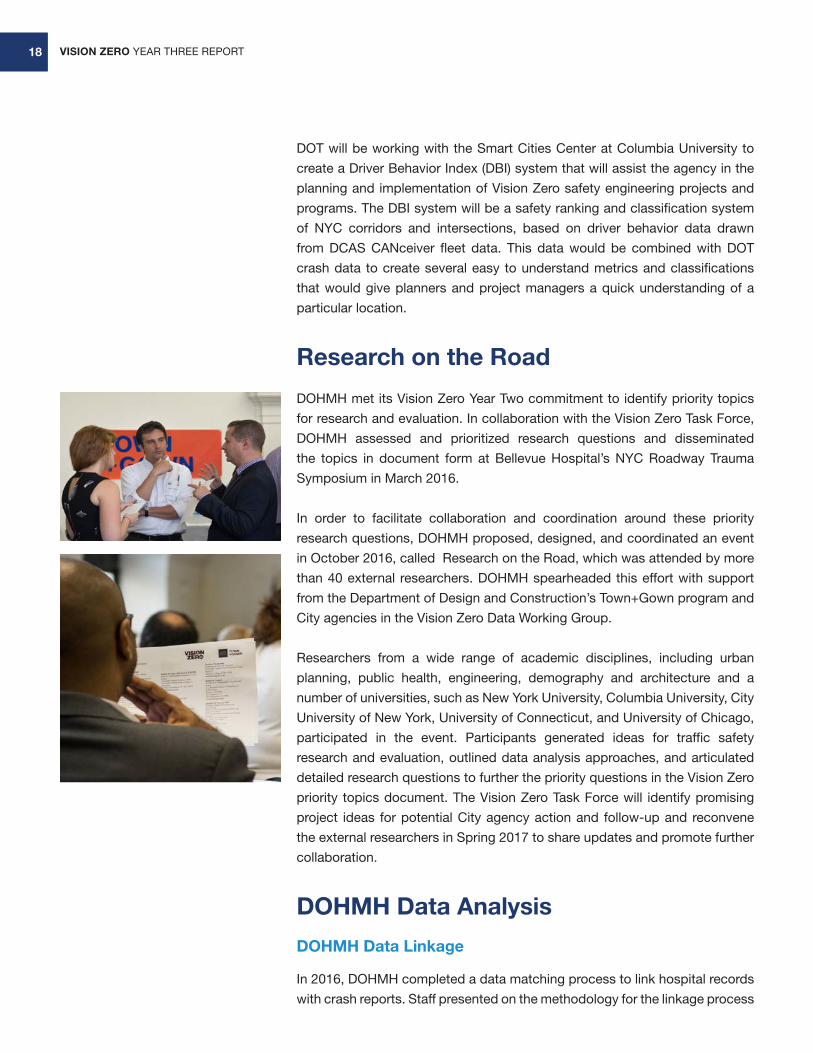
Research on the Road
DOHMH met its Vision Zero Year Two commitment to identify priority topics
for research and evaluation. In collaboration with the Vision Zero Task Force,
DOHMH assessed and prioritized research questions and disseminated
the topics in document form at Bellevue Hospital’s NYC Roadway Trauma
Symposium in March 2016.
In order to facilitate collaboration and coordination around these priority
research questions, DOHMH proposed, designed, and coordinated an event
in October 2016, called Research on the Road, which was attended by more
than 40 external researchers. DOHMH spearheaded this effort with support
from the Department of Design and Construction’s Town+Gown program and
City agencies in the Vision Zero Data Working Group.
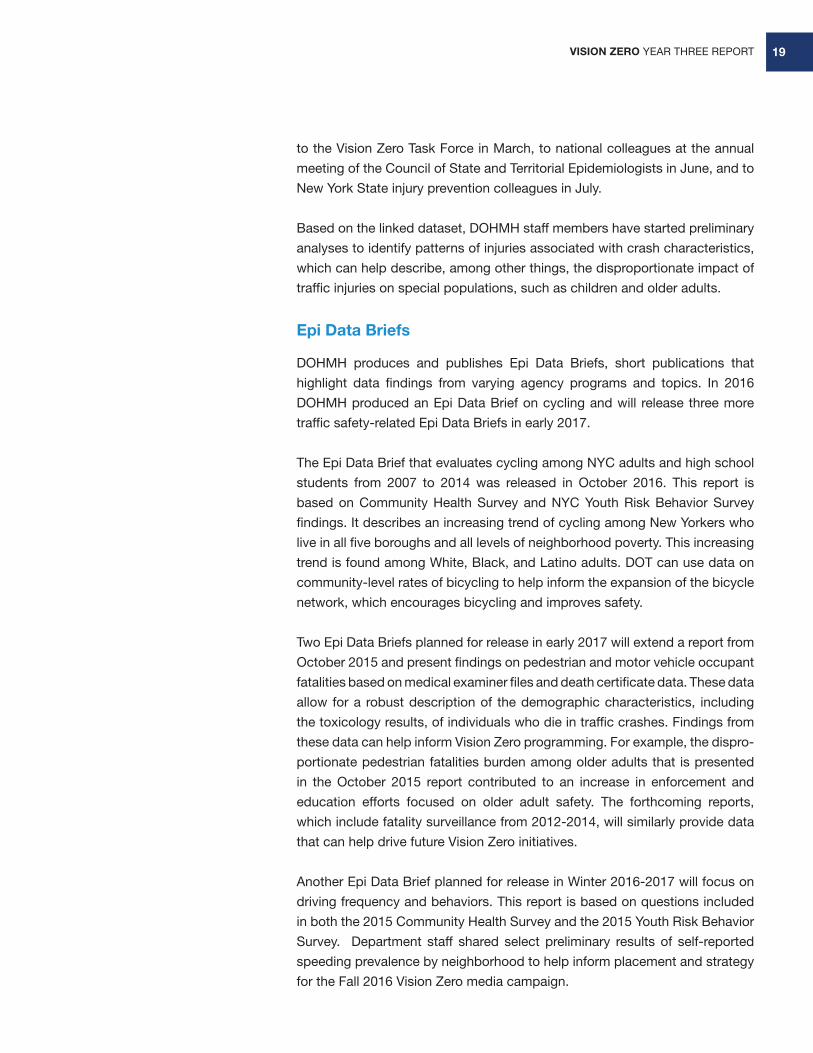
Researchers from a wide range of academic disciplines, including urban
planning, public health, engineering, demography and architecture and a
number of universities, such as New York University, Columbia University, City
University of New York, University of Connecticut, and University of Chicago,
participated in the event. Participants generated ideas for traffic safety
research and evaluation, outlined data analysis approaches, and articulated
detailed research questions to further the priority questions in the Vision Zero
priority topics document. The Vision Zero Task Force will identify promising
project ideas for potential City agency action and follow-up and reconvene
the external researchers in Spring 2017 to share updates and promote further
collaboration.
DOHMH Data Analysis
DOHMH Data Linkage
In 2016, DOHMH completed a data matching process to link hospital records
with crash reports. Staff presented on the methodology for the linkage process
VISION ZERO YEAR THREE REPORT 19
to the Vision Zero Task Force in March, to national colleagues at the annual
meeting of the Council of State and Territorial Epidemiologists in June, and to
New York State injury prevention colleagues in July.
Based on the linked dataset, DOHMH staff members have started preliminary
analyses to identify patterns of injuries associated with crash characteristics,
which can help describe, among other things, the disproportionate impact of
traffic injuries on special populations, such as children and older adults.
Epi Data Briefs
DOHMH produces and publishes Epi Data Briefs, short publications that
highlight data findings from varying agency programs and topics. In 2016
DOHMH produced an Epi Data Brief on cycling and will release three more
traffic safety-related Epi Data Briefs in early 2017.
The Epi Data Brief that evaluates cycling among NYC adults and high school
students from 2007 to 2014 was released in October 2016. This report is
based on Community Health Survey and NYC Youth Risk Behavior Survey
findings. It describes an increasing trend of cycling among New Yorkers who
live in all five boroughs and all levels of neighborhood poverty. This increasing
trend is found among White, Black, and Latino adults. DOT can use data on
community-level rates of bicycling to help inform the expansion of the bicycle
network, which encourages bicycling and improves safety.
Two Epi Data Briefs planned for release in early 2017 will extend a report from
October 2015 and present findings on pedestrian and motor vehicle occupant
fatalities based on medical examiner files and death certificate data. These data
allow for a robust description of the demographic characteristics, including
the toxicology results, of individuals who die in traffic crashes. Findings from
these data can help inform Vision Zero programming. For example, the dispro-
portionate pedestrian fatalities burden among older adults that is presented
in the October 2015 report contributed to an increase in enforcement and
education efforts focused on older adult safety. The forthcoming reports,
which include fatality surveillance from 2012-2014, will similarly provide data
that can help drive future Vision Zero initiatives.
Another Epi Data Brief planned for release in Winter 2016-2017 will focus on
driving frequency and behaviors. This report is based on questions included
in both the 2015 Community Health Survey and the 2015 Youth Risk Behavior
Survey. Department staff shared select preliminary results of self-reported
speeding prevalence by neighborhood to help inform placement and strategy
for the Fall 2016 Vision Zero media campaign.
VISION ZERO YEAR THREE REPORT20
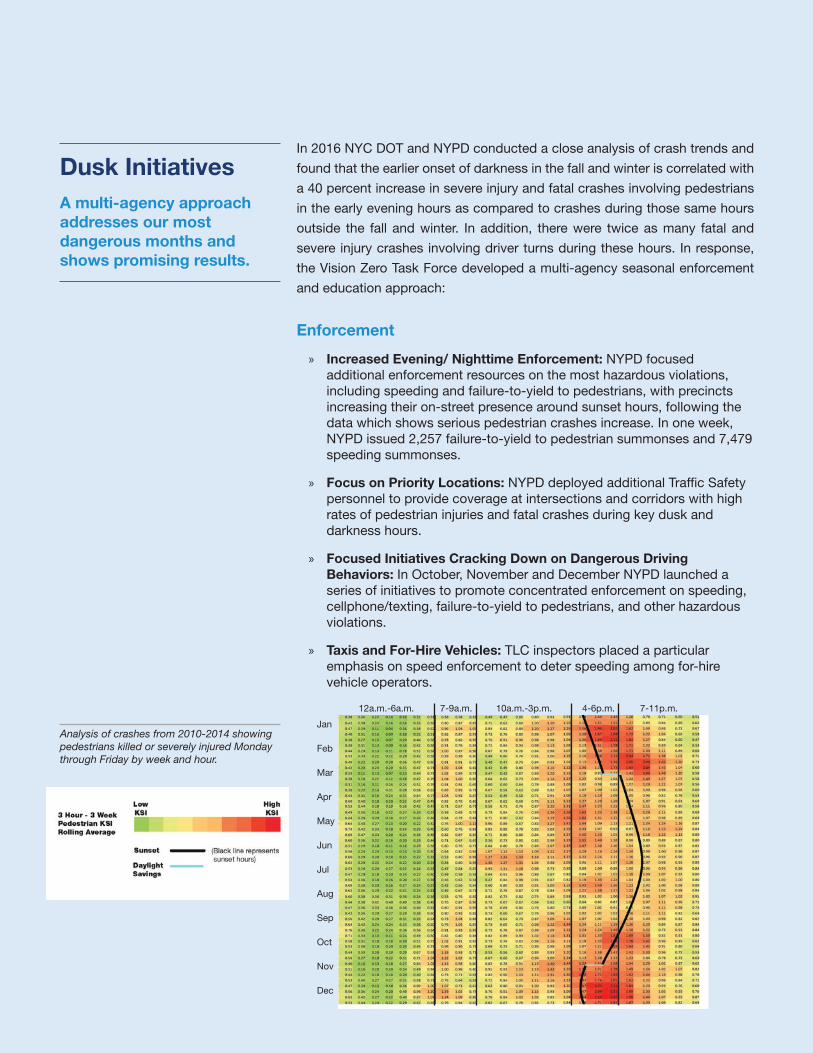
In 2016 NYC DOT and NYPD conducted a close analysis of crash trends and
found that the earlier onset of darkness in the fall and winter is correlated with
a 40 percent increase in severe injury and fatal crashes involving pedestrians
in the early evening hours as compared to crashes during those same hours
outside the fall and winter. In addition, there were twice as many fatal and
severe injury crashes involving driver turns during these hours. In response,
the Vision Zero Task Force developed a multi-agency seasonal enforcement
and education approach:
Enforcement
» Increased Evening/ Nighttime Enforcement: NYPD focused additional enforcement resources on the most hazardous violations, including speeding and failure-to-yield to pedestrians, with precincts increasing their on-street presence around sunset hours, following the data which shows serious pedestrian crashes increase. In one week, NYPD issued 2,257 failure-to-yield to pedestrian summonses and 7,479 speeding summonses.
» Focus on Priority Locations: NYPD deployed additional Traffic Safety personnel to provide coverage at intersections and corridors with high rates of pedestrian injuries and fatal crashes during key dusk and darkness hours.
» Focused Initiatives Cracking Down on Dangerous Driving Behaviors: In October, November and December NYPD launched a series of initiatives to promote concentrated enforcement on speeding, cellphone/texting, failure-to-yield to pedestrians, and other hazardous violations.
» Taxis and For-Hire Vehicles: TLC inspectors placed a particular emphasis on speed enforcement to deter speeding among for-hire vehicle operators.
A multi-agency approach addresses our most dangerous months and shows promising results.
Dusk Initiatives
Analysis of crashes from 2010-2014 showing pedestrians killed or severely injured Monday through Friday by week and hour.
12a.m.-6a.m.
Jan
Feb
Mar
Apr
May
Jun
Jul
Aug
Sep
Oct
Nov
Dec
7-9a.m. 10a.m.-3p.m. 4-6p.m. 7-11p.m.
VISION ZERO YEAR THREE REPORT 21
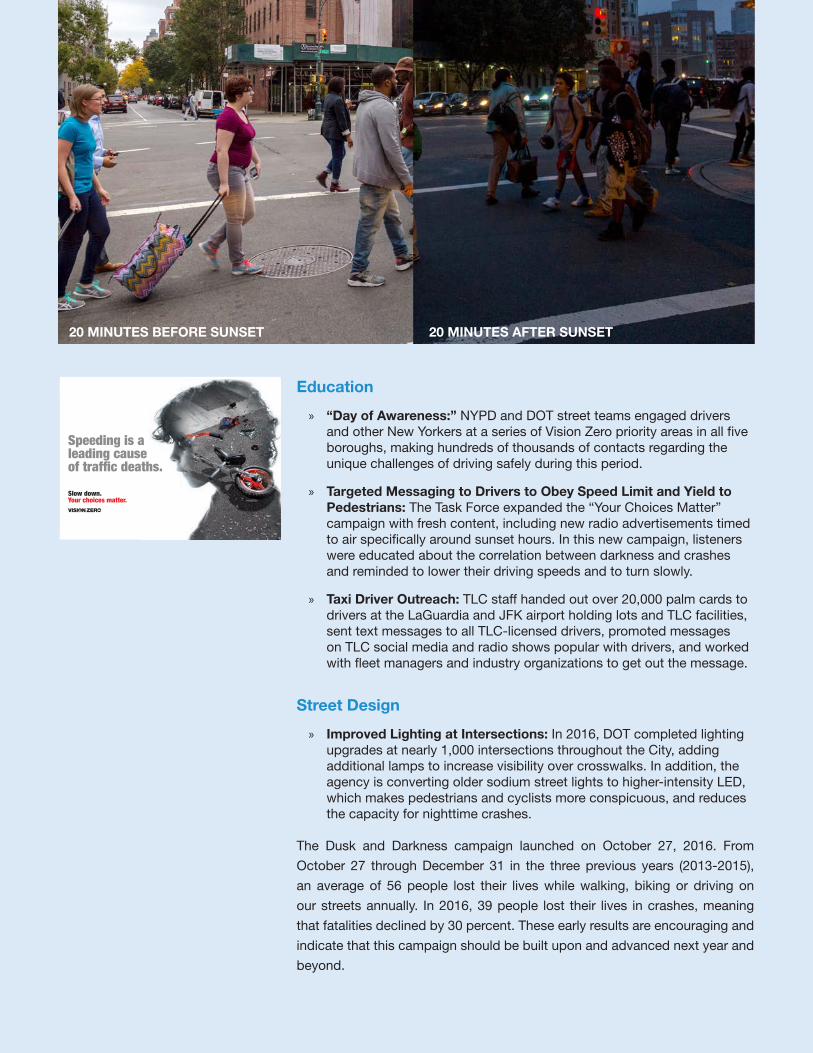
Education
» “Day of Awareness:” NYPD and DOT street teams engaged drivers and other New Yorkers at a series of Vision Zero priority areas in all five boroughs, making hundreds of thousands of contacts regarding the unique challenges of driving safely during this period.
» Targeted Messaging to Drivers to Obey Speed Limit and Yield to Pedestrians: The Task Force expanded the “Your Choices Matter” campaign with fresh content, including new radio advertisements timed to air specifically around sunset hours. In this new campaign, listeners were educated about the correlation between darkness and crashes and reminded to lower their driving speeds and to turn slowly.
» Taxi Driver Outreach: TLC staff handed out over 20,000 palm cards to drivers at the LaGuardia and JFK airport holding lots and TLC facilities, sent text messages to all TLC-licensed drivers, promoted messages on TLC social media and radio shows popular with drivers, and worked with fleet managers and industry organizations to get out the message.
Street Design
» Improved Lighting at Intersections: In 2016, DOT completed lighting upgrades at nearly 1,000 intersections throughout the City, adding additional lamps to increase visibility over crosswalks. In addition, the agency is converting older sodium street lights to higher-intensity LED, which makes pedestrians and cyclists more conspicuous, and reduces the capacity for nighttime crashes.
The Dusk and Darkness campaign launched on October 27, 2016. From
October 27 through December 31 in the three previous years (2013-2015),
an average of 56 people lost their lives while walking, biking or driving on
our streets annually. In 2016, 39 people lost their lives in crashes, meaning
that fatalities declined by 30 percent. These early results are encouraging and
indicate that this campaign should be built upon and advanced next year and
beyond.
Speeding is a leading cause of traffic deaths.
Slow down. Your choices matter.
Speeding is a leading cause of traffic deaths.
Slow down. Your choices matter.
20 MINUTES BEFORE SUNSET 20 MINUTES AFTER SUNSET
VISION ZERO YEAR THREE REPORT22
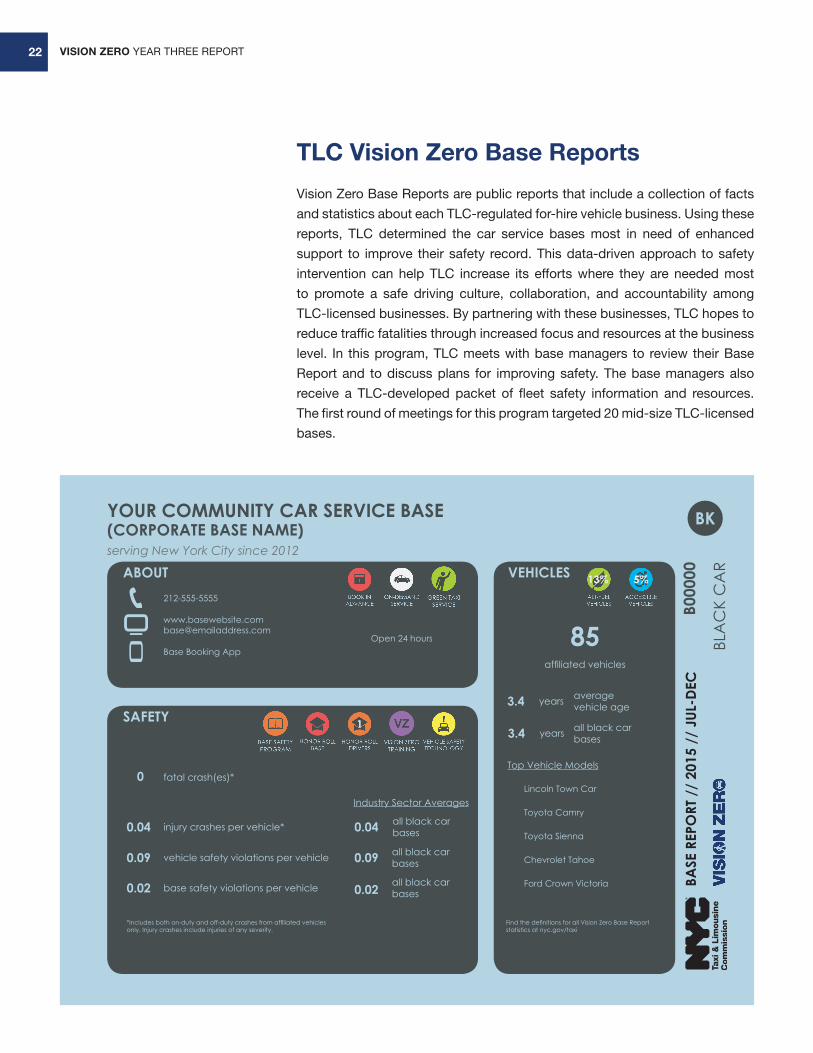
TLC Vision Zero Base Reports
Vision Zero Base Reports are public reports that include a collection of facts
and statistics about each TLC-regulated for-hire vehicle business. Using these
reports, TLC determined the car service bases most in need of enhanced
support to improve their safety record. This data-driven approach to safety
intervention can help TLC increase its efforts where they are needed most
to promote a safe driving culture, collaboration, and accountability among
TLC-licensed businesses. By partnering with these businesses, TLC hopes to
reduce traffic fatalities through increased focus and resources at the business
level. In this program, TLC meets with base managers to review their Base
Report and to discuss plans for improving safety. The base managers also
receive a TLC-developed packet of fleet safety information and resources.
The first round of meetings for this program targeted 20 mid-size TLC-licensed
bases.
ABOUT
SAFETY
VEHICLES
Open 24 hours
BASE
REP
ORT
//
2015
//
JUL-
DEC
fatal crash(es)*
injury crashes per vehicle*
vehicle safety violations per vehicle
base safety violations per vehicle
affiliated vehicles
years averagevehicle age
Top Vehicle Models
*Includes both on-duty and off-duty crashes from affiliated vehicles only. Injury crashes include injuries of any severity.
years
Industry Sector Averages
Find the definitions for all Vision Zero Base Report statistics at nyc.gov/taxi
YOUR COMMUNITY CAR SERVICE BASE
serving New York City since 2012
BLA
CK
CA
R
212-555-5555
Base Booking App
B000
00
0
0.04
0.09
0.02
85
3.4
Lincoln Town Car
Toyota Camry
Toyota Sienna0.04 all black car
bases
0.09 all black carbases
0.02 all black carbases
(CORPORATE BASE NAME)
Chevrolet Tahoe
Ford Crown Victoria
3.4 all black carbases
13%
1
5%
VISION ZERO YEAR THREE REPORT 23
DCAS CRASH
DCAS led the development of the City’s first citywide tracking system for
collisions called CRASH. In order to ensure that agencies are held accountable
for their safety performance, CRASH data is now reported in the publicly
available Mayor’s Management Report (MMR). From FY15 to FY16, fatalities
involving City vehicles declined from five to one, injuries declined 24 percent
and preventable collisions also declined 2 percent. DCAS is also using data
from vehicle tracking devices to identify safety concerns in driving behavior
and to help focus training efforts.
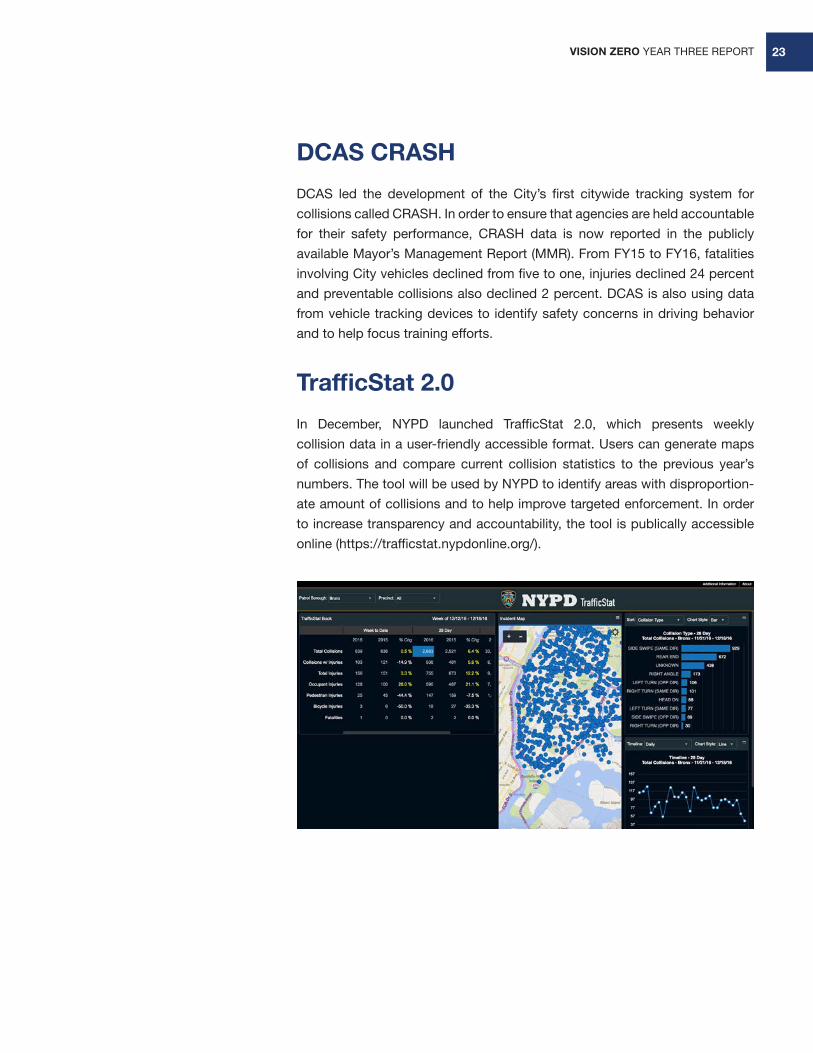
TrafficStat 2.0
In December, NYPD launched TrafficStat 2.0, which presents weekly
collision data in a user-friendly accessible format. Users can generate maps
of collisions and compare current collision statistics to the previous year’s
numbers. The tool will be used by NYPD to identify areas with disproportion-
ate amount of collisions and to help improve targeted enforcement. In order
to increase transparency and accountability, the tool is publically accessible
online (https://trafficstat.nypdonline.org/).
VISION ZERO YEAR THREE REPORT24
Engineering
Designs to Protect the Most Vulnerable Users
Safer, more usable streets that address the needs of all New Yorkers are a cornerstone of Vision Zero. The City has broadened efforts to make streets safer by addressing dangerous corridors and implementing new treatments to minimize pedestrian and cyclist risks.
In 2015, the Department of Transportation (DOT) and the New York City Police
Department (NYPD) released five Pedestrian Safety Action Plans. These
plans analyzed data about pedestrian deaths and serious injuries within each
borough in order to identify the most crash-prone corridors, intersections
and areas. In addition, DOT and NYPD integrated ideas from New Yorkers
through 28 Vision Zero town halls and public workshops and more than 10,000
recommendations submitted through the online Vision Zero Public Input Map,
which aided in the development of solutions for these priority locations.
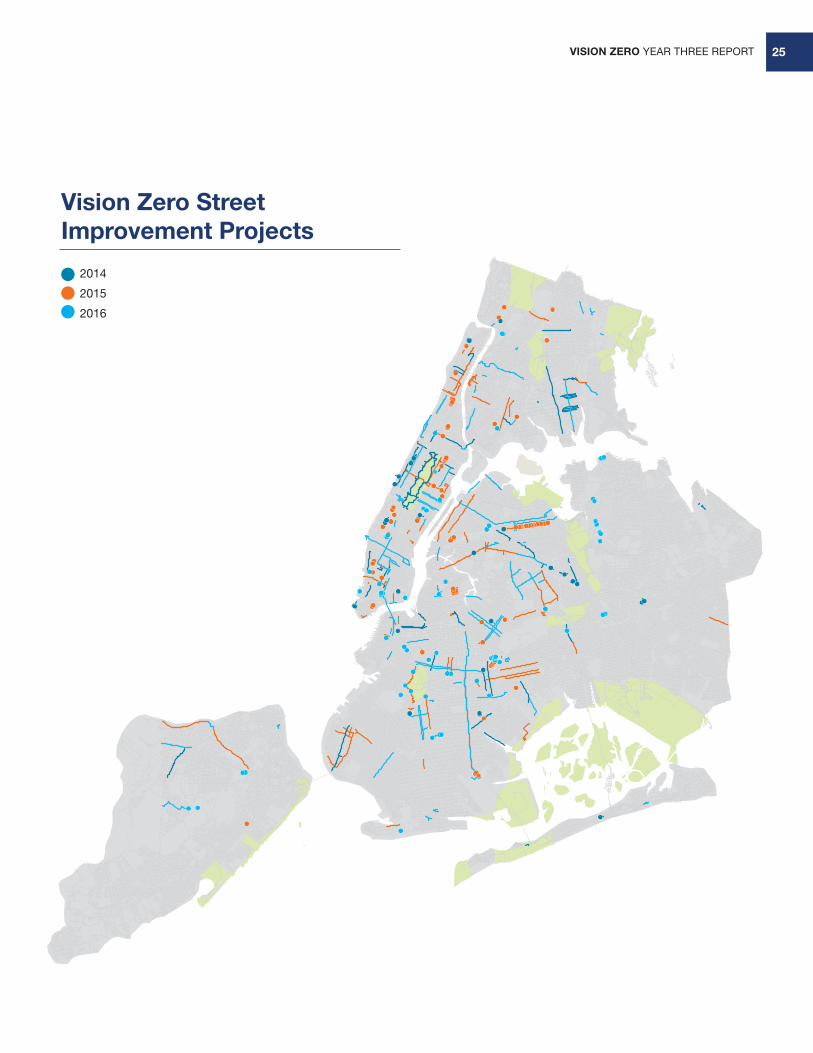
Under Vision Zero, DOT has accelerated the pace of their project implemen-
tation for these crash-prone areas by targeting improvements to the areas
specified in the Plans. In 2016, DOT completed 76 safety projects at priority
locations—a 162 percent increase over the five years prior to Vision Zero.
Since the launch of Vision Zero, DOT has completed a total of 178 safety
projects at priority locations, and 242 such projects citywide.
VISION ZERO YEAR THREE REPORT 25
Vision Zero Street Improvement Projects
2014
2015
2016
VISION ZERO YEAR THREE REPORT26
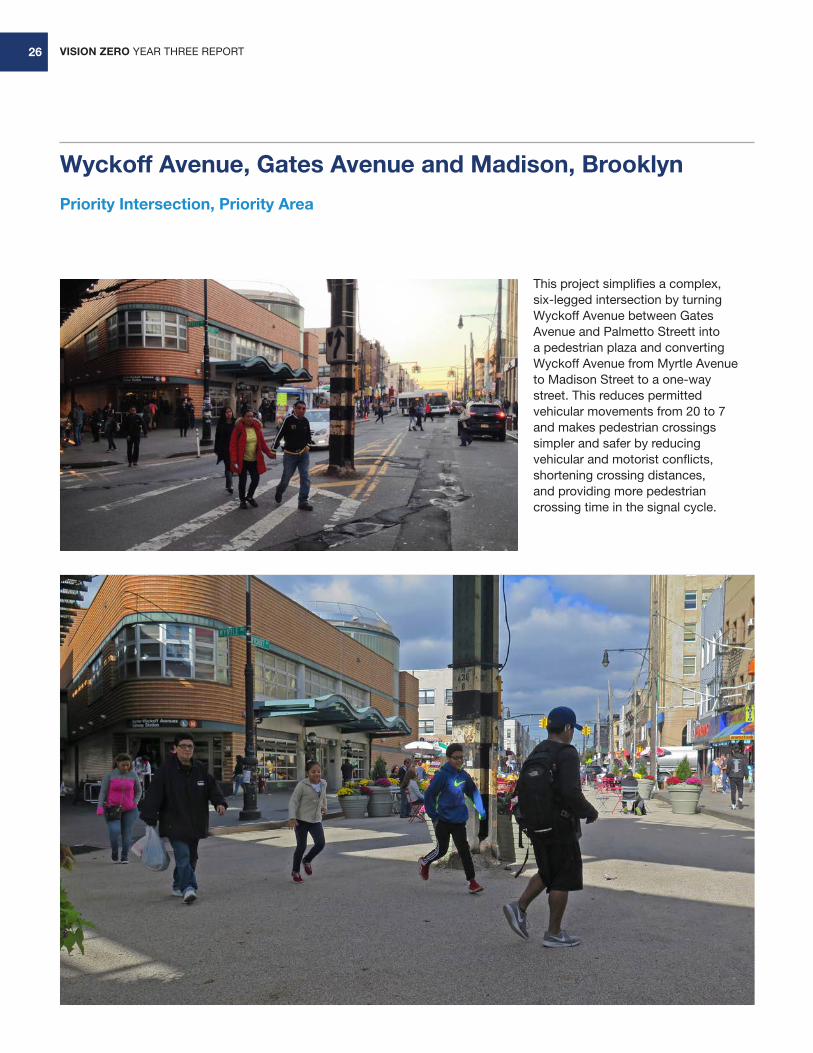
This project simplifies a complex, six-legged intersection by turning Wyckoff Avenue between Gates Avenue and Palmetto Streett into a pedestrian plaza and converting Wyckoff Avenue from Myrtle Avenue to Madison Street to a one-way street. This reduces permitted vehicular movements from 20 to 7 and makes pedestrian crossings simpler and safer by reducing vehicular and motorist conflicts, shortening crossing distances, and providing more pedestrian crossing time in the signal cycle.
Wyckoff Avenue, Gates Avenue and Madison, Brooklyn
Priority Intersection, Priority Area
VISION ZERO YEAR THREE REPORT 27
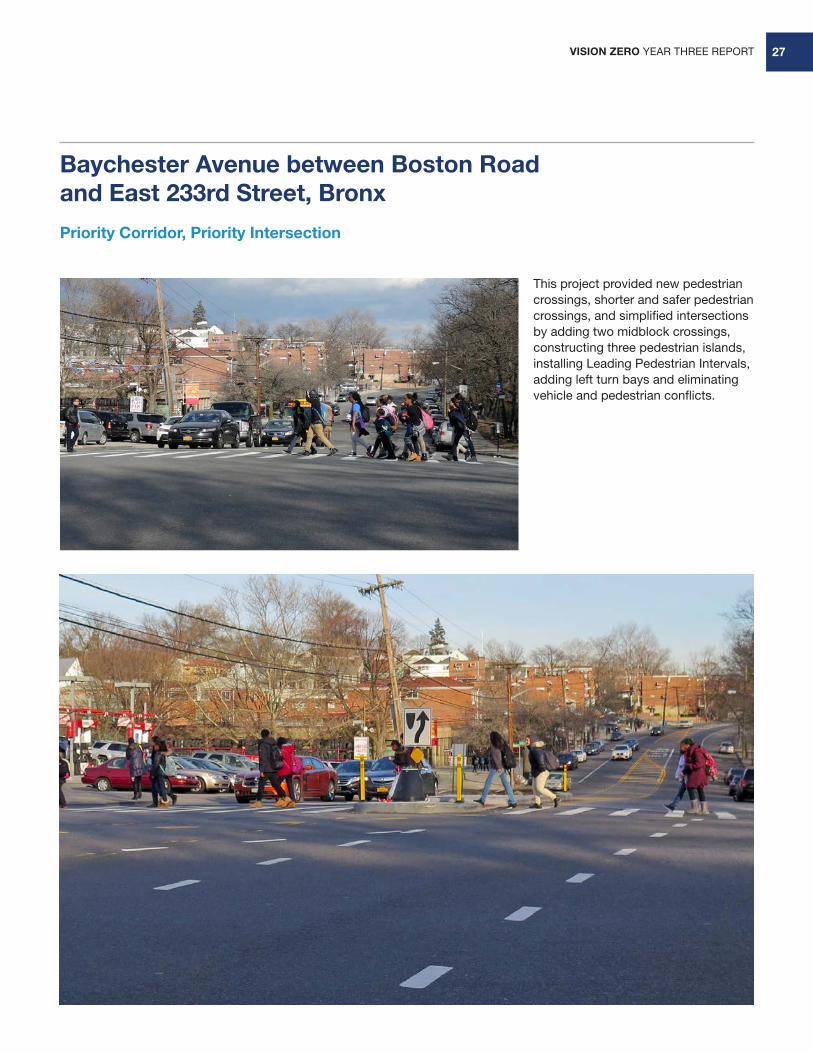
This project provided new pedestrian crossings, shorter and safer pedestrian crossings, and simplified intersections by adding two midblock crossings, constructing three pedestrian islands, installing Leading Pedestrian Intervals, adding left turn bays and eliminating vehicle and pedestrian conflicts.
Baychester Avenue between Boston Road and East 233rd Street, Bronx
Priority Corridor, Priority Intersection
VISION ZERO YEAR THREE REPORT28
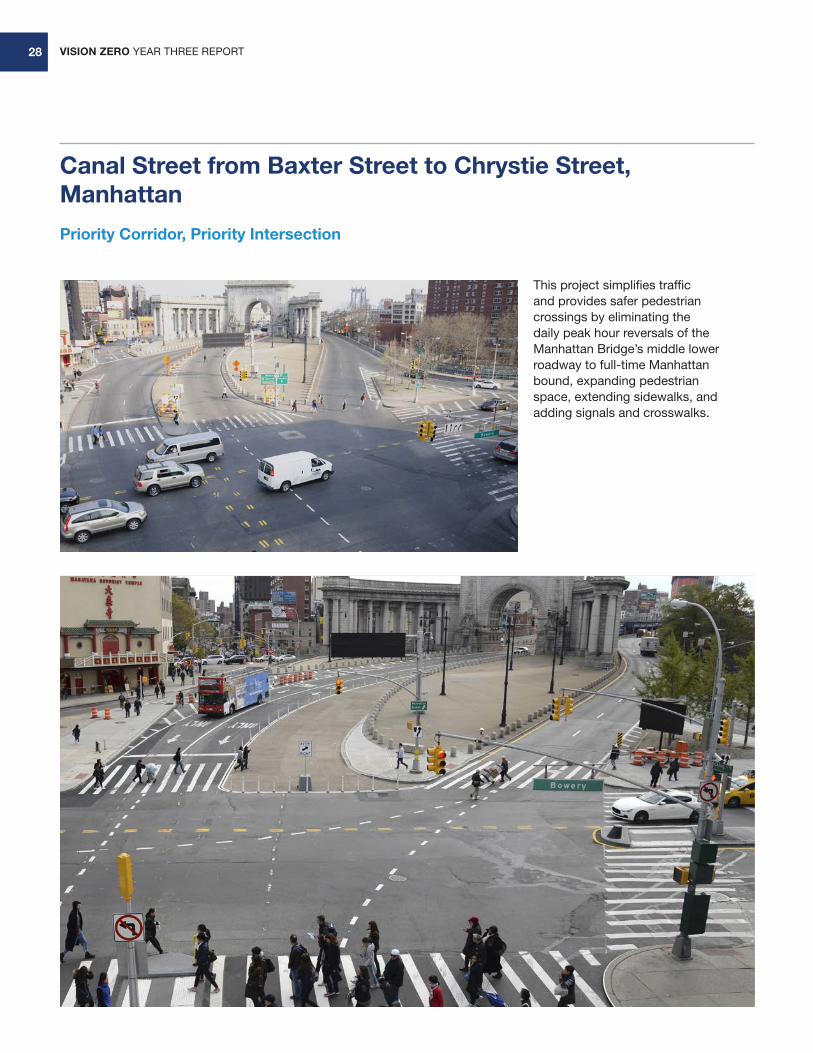
This project simplifies traffic and provides safer pedestrian crossings by eliminating the daily peak hour reversals of the Manhattan Bridge’s middle lower roadway to full-time Manhattan bound, expanding pedestrian space, extending sidewalks, and adding signals and crosswalks.
Canal Street from Baxter Street to Chrystie Street, Manhattan
Priority Corridor, Priority Intersection
VISION ZERO YEAR THREE REPORT 29
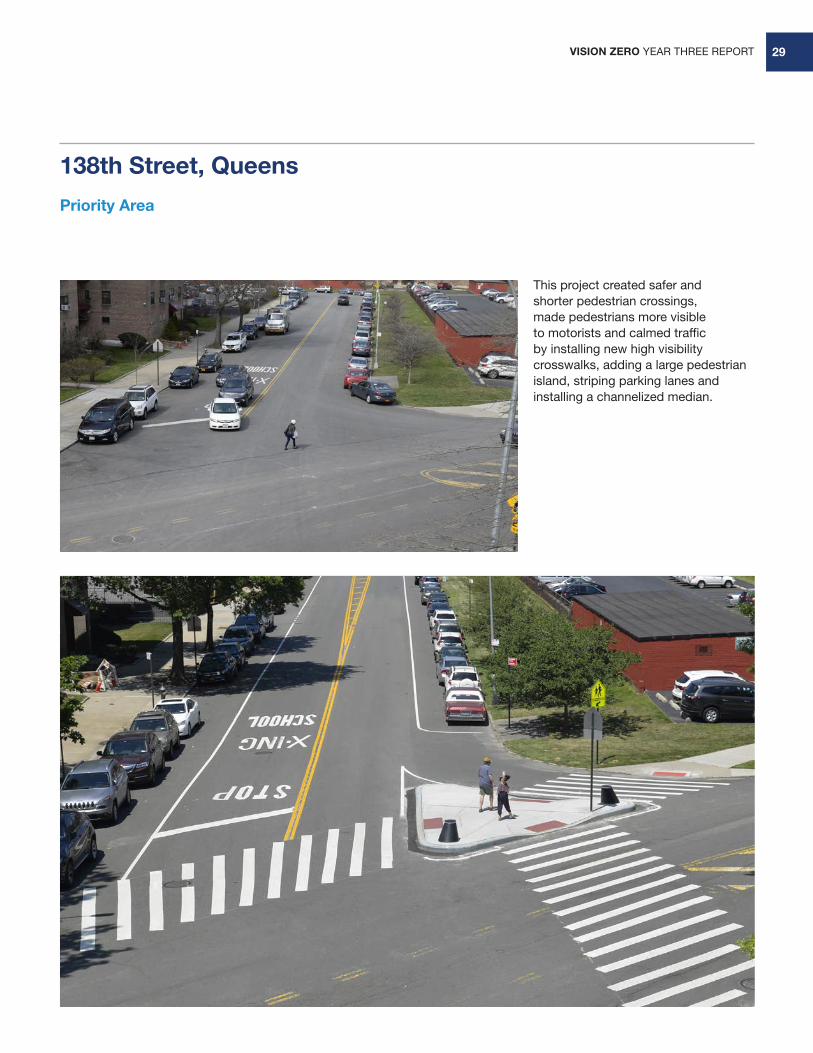
This project created safer and shorter pedestrian crossings, made pedestrians more visible to motorists and calmed traffic by installing new high visibility crosswalks, adding a large pedestrian island, striping parking lanes and installing a channelized median.
138th Street, Queens
Priority Area
VISION ZERO YEAR THREE REPORT30
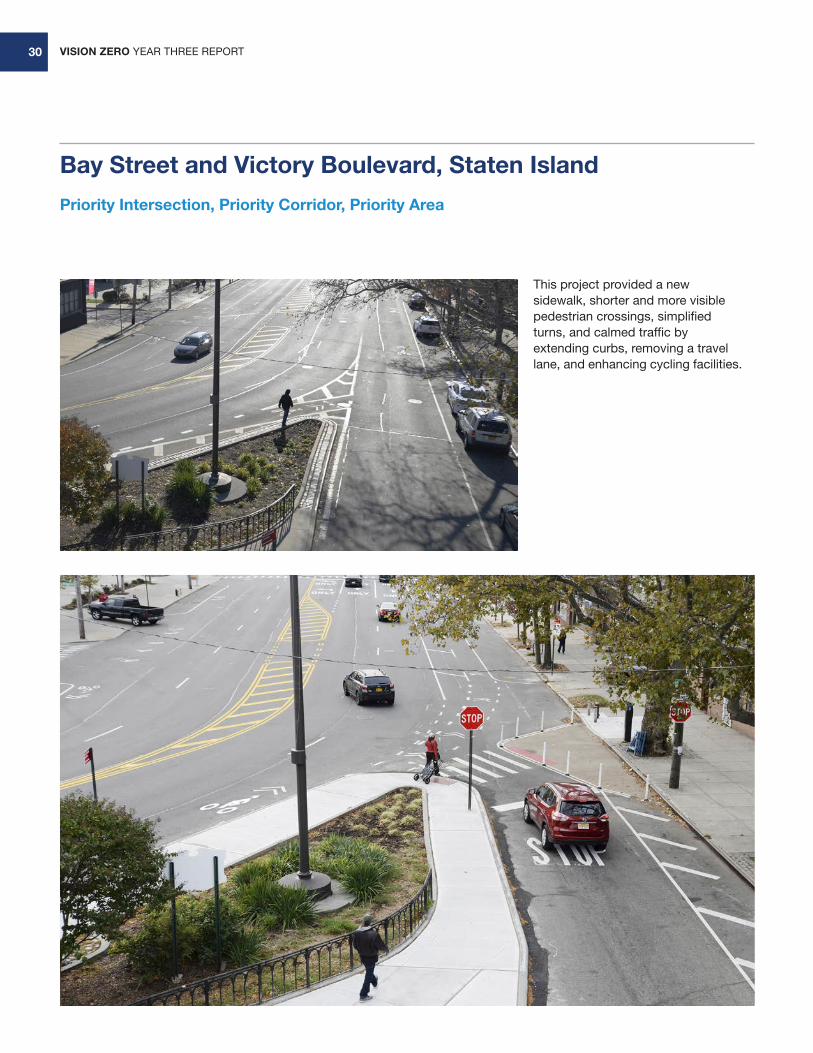
This project provided a new sidewalk, shorter and more visible pedestrian crossings, simplified turns, and calmed traffic by extending curbs, removing a travel lane, and enhancing cycling facilities.
Bay Street and Victory Boulevard, Staten Island
Priority Intersection, Priority Corridor, Priority Area
VISION ZERO YEAR THREE REPORT 31
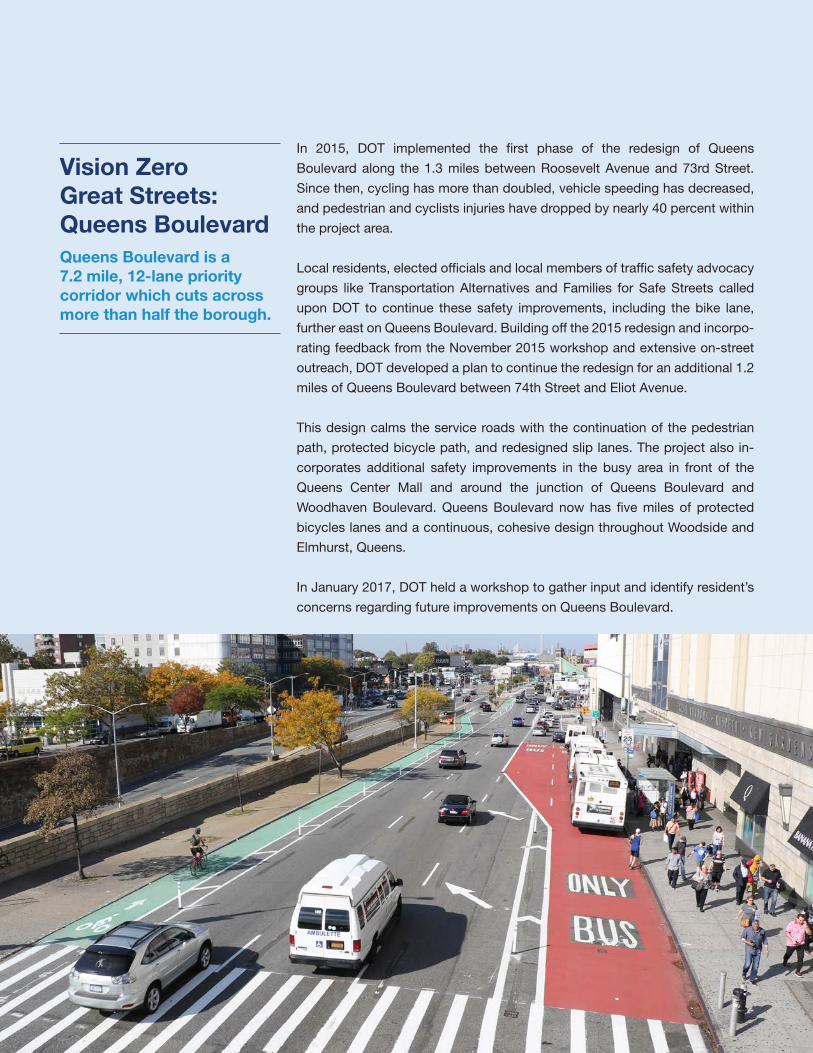
Queens Boulevard is a 7.2 mile, 12-lane priority corridor which cuts across more than half the borough.
In 2015, DOT implemented the first phase of the redesign of Queens
Boulevard along the 1.3 miles between Roosevelt Avenue and 73rd Street.
Since then, cycling has more than doubled, vehicle speeding has decreased,
and pedestrian and cyclists injuries have dropped by nearly 40 percent within
the project area.
Local residents, elected officials and local members of traffic safety advocacy
groups like Transportation Alternatives and Families for Safe Streets called
upon DOT to continue these safety improvements, including the bike lane,
further east on Queens Boulevard. Building off the 2015 redesign and incorpo-
rating feedback from the November 2015 workshop and extensive on-street
outreach, DOT developed a plan to continue the redesign for an additional 1.2
miles of Queens Boulevard between 74th Street and Eliot Avenue.
This design calms the service roads with the continuation of the pedestrian
path, protected bicycle path, and redesigned slip lanes. The project also in-
corporates additional safety improvements in the busy area in front of the
Queens Center Mall and around the junction of Queens Boulevard and
Woodhaven Boulevard. Queens Boulevard now has five miles of protected
bicycles lanes and a continuous, cohesive design throughout Woodside and
Elmhurst, Queens.
In January 2017, DOT held a workshop to gather input and identify resident’s
concerns regarding future improvements on Queens Boulevard.
Vision Zero Great Streets: Queens Boulevard
VISION ZERO YEAR THREE REPORT32
Biking
New York’s experience has shown that the best way to improve the safety of
cycling is to increase the number of cyclists on the streets, and the best way
to encourage more cycling is a network of high-quality bicycling infrastructure.
From 2011-2013, New Yorkers took approximately 118 million trips by bicycle
each year. In the first two years of Vision Zero, the number of bicycling trips
had grown to 158 million trips—a 34 percent increase. During this same period
bicyclist KSI fell 11 percent, from 403 annually in 2009-2013 to 359 in 2014
and 2015. The growth in cycling, in part due to Citibike, has led to motorists
becoming more accustomed to driving on the same streets as bicyclists. In
addition, the vigorous growth of the bike network has made New Yorkers safer
when they travel by bike.
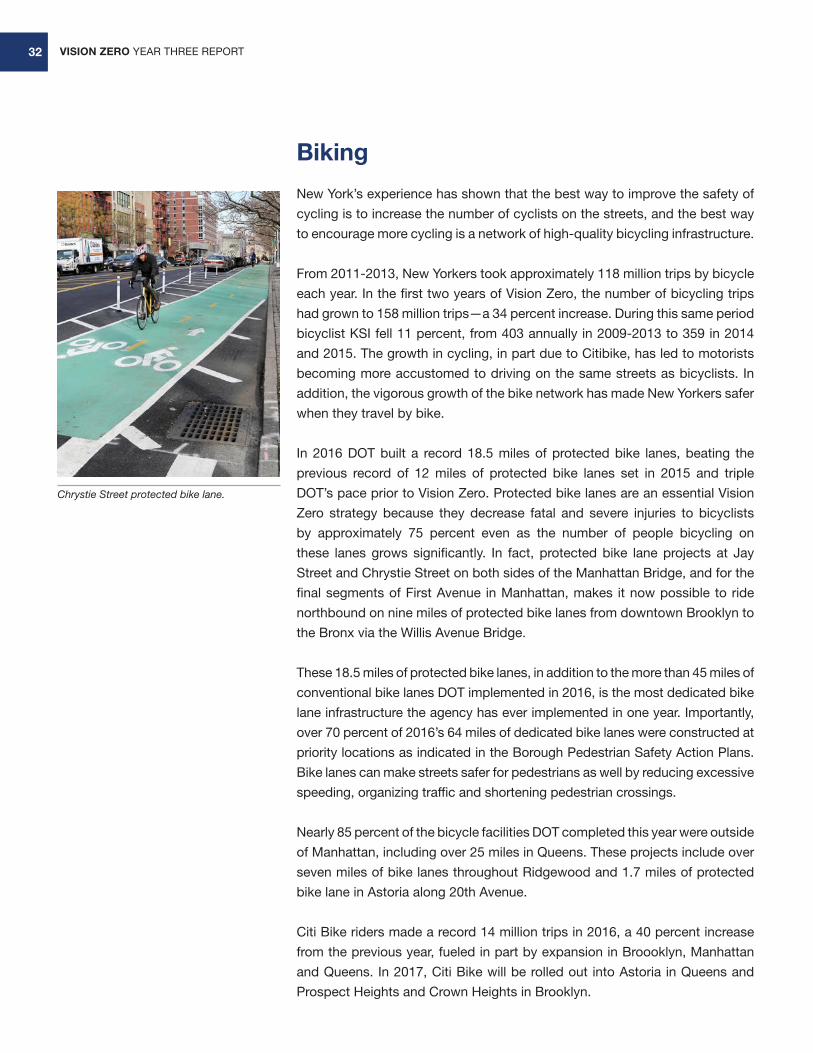
In 2016 DOT built a record 18.5 miles of protected bike lanes, beating the
previous record of 12 miles of protected bike lanes set in 2015 and triple
DOT’s pace prior to Vision Zero. Protected bike lanes are an essential Vision
Zero strategy because they decrease fatal and severe injuries to bicyclists
by approximately 75 percent even as the number of people bicycling on
these lanes grows significantly. In fact, protected bike lane projects at Jay
Street and Chrystie Street on both sides of the Manhattan Bridge, and for the
final segments of First Avenue in Manhattan, makes it now possible to ride
northbound on nine miles of protected bike lanes from downtown Brooklyn to
the Bronx via the Willis Avenue Bridge.
These 18.5 miles of protected bike lanes, in addition to the more than 45 miles of
conventional bike lanes DOT implemented in 2016, is the most dedicated bike
lane infrastructure the agency has ever implemented in one year. Importantly,
over 70 percent of 2016’s 64 miles of dedicated bike lanes were constructed at
priority locations as indicated in the Borough Pedestrian Safety Action Plans.
Bike lanes can make streets safer for pedestrians as well by reducing excessive
speeding, organizing traffic and shortening pedestrian crossings.
Nearly 85 percent of the bicycle facilities DOT completed this year were outside
of Manhattan, including over 25 miles in Queens. These projects include over
seven miles of bike lanes throughout Ridgewood and 1.7 miles of protected
bike lane in Astoria along 20th Avenue.
Citi Bike riders made a record 14 million trips in 2016, a 40 percent increase
from the previous year, fueled in part by expansion in Broooklyn, Manhattan
and Queens. In 2017, Citi Bike will be rolled out into Astoria in Queens and
Prospect Heights and Crown Heights in Brooklyn.
Chrystie Street protected bike lane.
VISION ZERO YEAR THREE REPORT 33
The addition of protected bike lanes and other facilities, combined with the
expansion of Citi Bike, has led to more New Yorkers biking than ever, which
means that New York is becoming a much safer and more convenient place
to bike.
Accessibility
The City’s more than 800,000 residents with disabilities benefit whenever the
City simplifies complex intersections, deters speeding, shortens crossing
distances, and encourages safer driving at intersections.
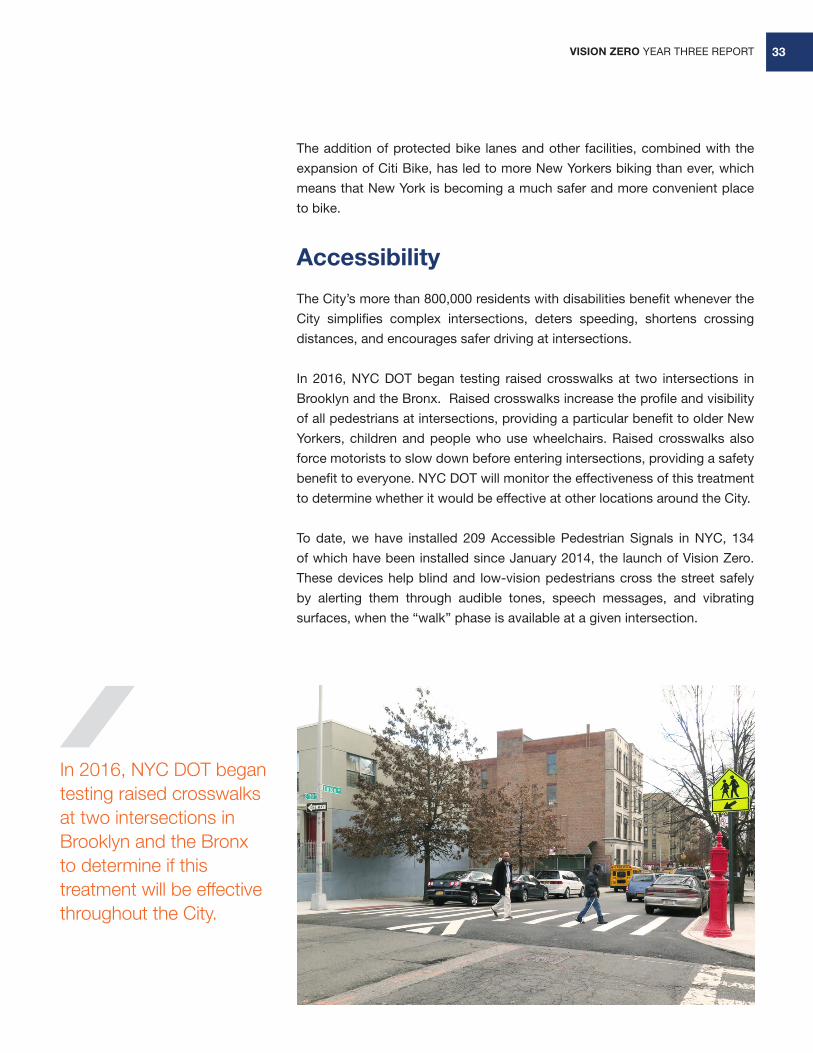
In 2016, NYC DOT began testing raised crosswalks at two intersections in
Brooklyn and the Bronx. Raised crosswalks increase the profile and visibility
of all pedestrians at intersections, providing a particular benefit to older New
Yorkers, children and people who use wheelchairs. Raised crosswalks also
force motorists to slow down before entering intersections, providing a safety
benefit to everyone. NYC DOT will monitor the effectiveness of this treatment
to determine whether it would be effective at other locations around the City.
To date, we have installed 209 Accessible Pedestrian Signals in NYC, 134
of which have been installed since January 2014, the launch of Vision Zero.
These devices help blind and low-vision pedestrians cross the street safely
by alerting them through audible tones, speech messages, and vibrating
surfaces, when the “walk” phase is available at a given intersection.
In 2016, NYC DOT began testing raised crosswalks at two intersections in Brooklyn and the Bronx to determine if this treatment will be effective throughout the City.
VISION ZERO YEAR THREE REPORT34
In addition, DOT is working to develop the next generation of technological
approaches which can help blind and low-vision pedestrians safely navigate
intersections. In 2017, NYC DOT will host a “hack-a-thon” to encourage
developers to find alternative modes to deliver pedestrian signal information
to a pedestrian’s smart phone. NYC DOT will also test tactile maps which use
braille to inform pedestrians of the geometry of intersections at Accessible
Pedestrian Signal locations.
Leading Pedestrian Intervals
A Leading Pedestrian Interval (LPI) provides pedestrians a seven to eleven
second head start when entering an intersection before traffic, including turning
traffic, is released with a corresponding green signal. This reduces conflicts
during a vehicle’s turn through the crosswalk by enhancing the visibility of
pedestrians in the intersection and reinforcing the pedestrian’s right-of-way.
This treatment is appropriate for longer crossings with substantial pedestrian
volumes and frequent conflicts between pedestrians and turning vehicles.
DOT performed a before and after crash analysis of 104 intersections with
LPIs and found that total pedestrian and bicyclist fatal and severe injuries
involving a turning vehicle declined by 62 percent after the LPI was installed.
DOT and NYPD identified the installation of LPIs at every feasible school
crosswalk on a priority corridor and at every feasible priority intersection by
the end of 2017 as a key initiative within the Borough Pedestrian Safety Action
Plans.
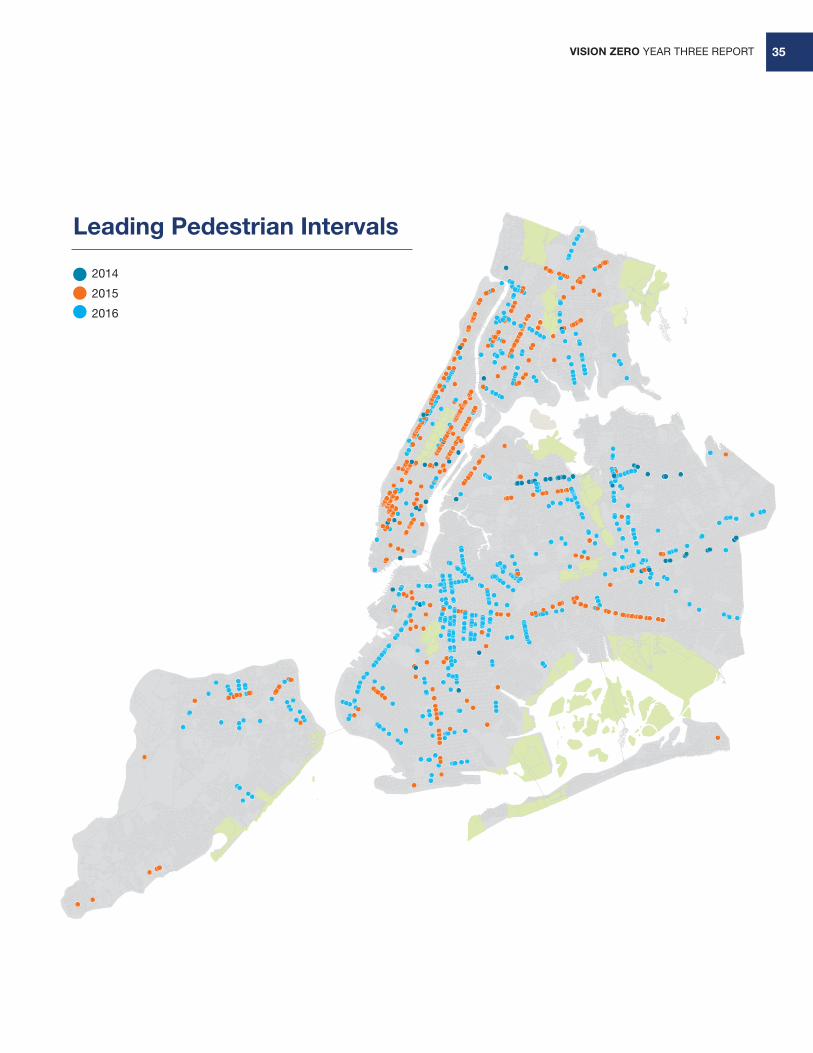
DOT implemented 776 LPIs in 2016; in a typical year prior to Vision Zero DOT
would have implemented 16 of these treatments.
VISION ZERO YEAR THREE REPORT 35
Leading Pedestrian Intervals
2014
2015
2016
VISION ZERO YEAR THREE REPORT36
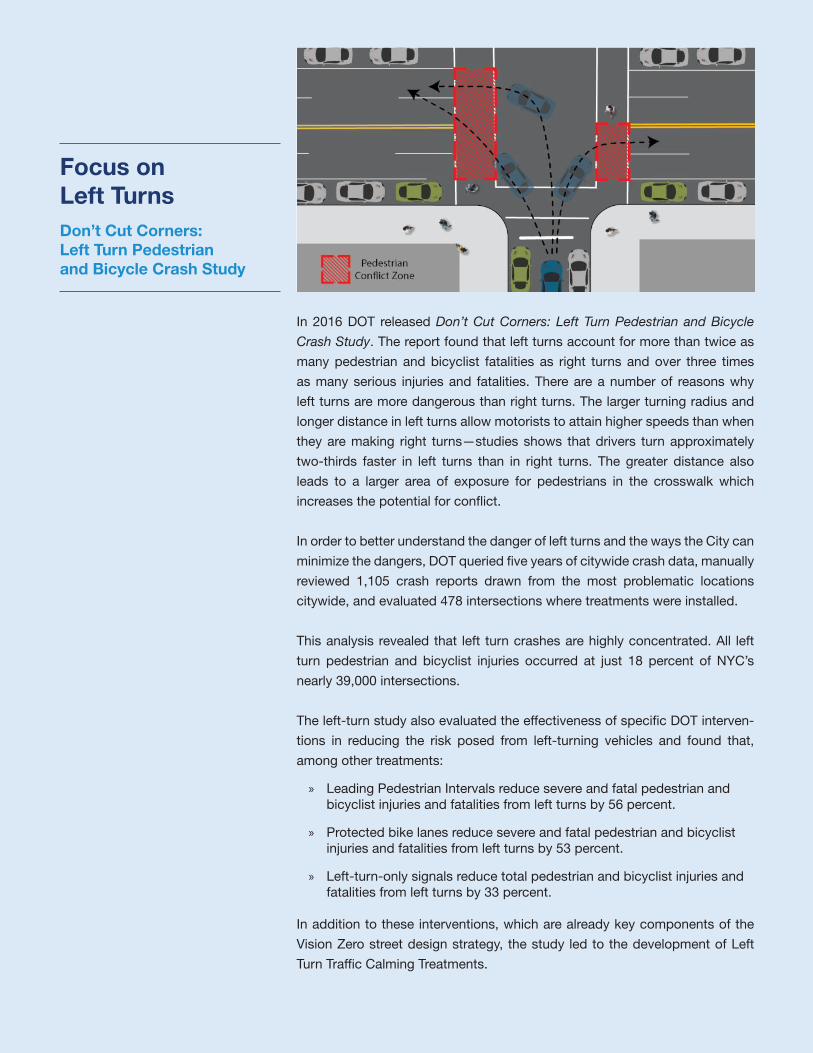
Don’t Cut Corners: Left Turn Pedestrian and Bicycle Crash Study
Focus on Left Turns
In 2016 DOT released Don’t Cut Corners: Left Turn Pedestrian and Bicycle
Crash Study. The report found that left turns account for more than twice as
many pedestrian and bicyclist fatalities as right turns and over three times
as many serious injuries and fatalities. There are a number of reasons why
left turns are more dangerous than right turns. The larger turning radius and
longer distance in left turns allow motorists to attain higher speeds than when
they are making right turns—studies shows that drivers turn approximately
two-thirds faster in left turns than in right turns. The greater distance also
leads to a larger area of exposure for pedestrians in the crosswalk which
increases the potential for conflict.
In order to better understand the danger of left turns and the ways the City can
minimize the dangers, DOT queried five years of citywide crash data, manually
reviewed 1,105 crash reports drawn from the most problematic locations
citywide, and evaluated 478 intersections where treatments were installed.
This analysis revealed that left turn crashes are highly concentrated. All left
turn pedestrian and bicyclist injuries occurred at just 18 percent of NYC’s
nearly 39,000 intersections.
The left-turn study also evaluated the effectiveness of specific DOT interven-
tions in reducing the risk posed from left-turning vehicles and found that,
among other treatments:
» Leading Pedestrian Intervals reduce severe and fatal pedestrian and bicyclist injuries and fatalities from left turns by 56 percent.
» Protected bike lanes reduce severe and fatal pedestrian and bicyclist injuries and fatalities from left turns by 53 percent.
» Left-turn-only signals reduce total pedestrian and bicyclist injuries and fatalities from left turns by 33 percent.
In addition to these interventions, which are already key components of the
Vision Zero street design strategy, the study led to the development of Left
Turn Traffic Calming Treatments.
nyc.gov/visionzero Left Turn Pedestrian & Bicycle Crash Study
1. The Left Turn Problem
HIGHER SPEEDS • The larger possible turning radii and longer
distance before the turn encourages drivers to take left turns at higher speeds than right turns
• Crash reconstruction analysis shows left turns occur at an average of 9.3 mph vs. right turns at 5.6 mph*
GREATER PEDESTRIAN EXPOSURE • Larger area of exposure for pedestrians in the
crosswalk • Seen here in Figure 1 as the “Pedestrian Conflict
Zone”
9
*Roudsari, Bahman, Kaufman, Robert, and Koespell, Thomas; “Turning at Intersections and Pedestrian Injuries,” 2006.
Figure 1
VISION ZERO YEAR THREE REPORT 37
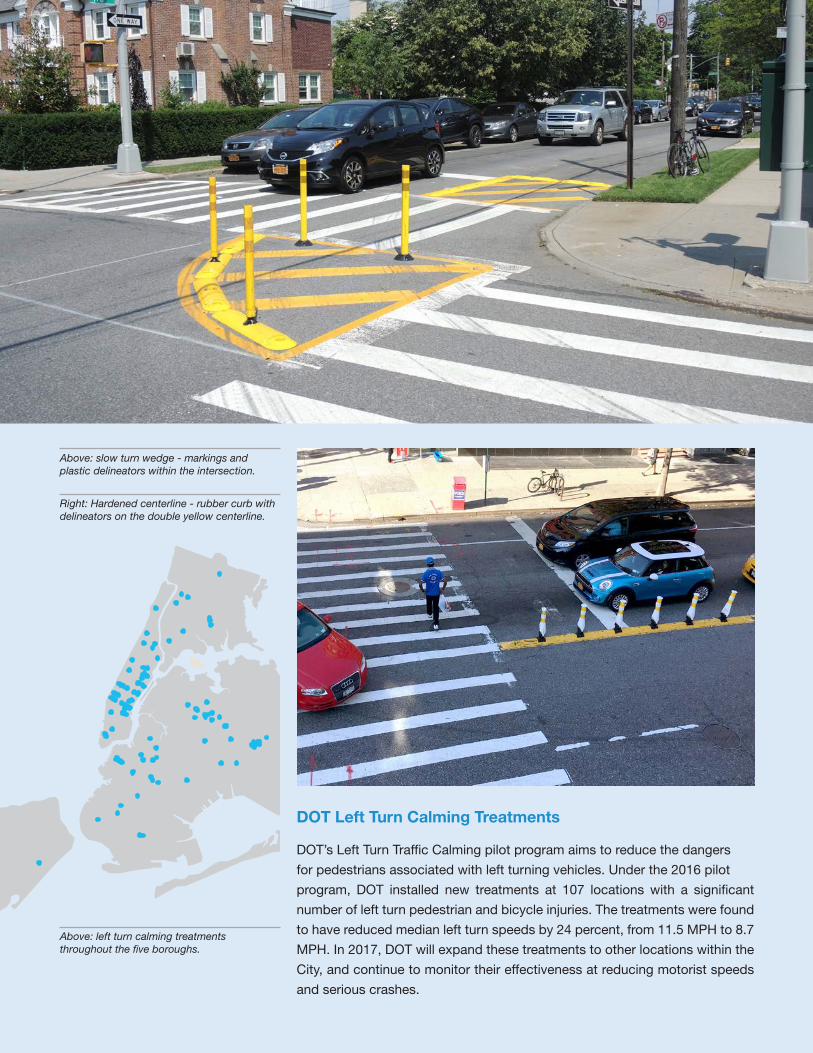
DOT Left Turn Calming Treatments
DOT’s Left Turn Traffic Calming pilot program aims to reduce the dangers
for pedestrians associated with left turning vehicles. Under the 2016 pilot
program, DOT installed new treatments at 107 locations with a significant
number of left turn pedestrian and bicycle injuries. The treatments were found
to have reduced median left turn speeds by 24 percent, from 11.5 MPH to 8.7
MPH. In 2017, DOT will expand these treatments to other locations within the
City, and continue to monitor their effectiveness at reducing motorist speeds
and serious crashes.
Right: Hardened centerline - rubber curb with delineators on the double yellow centerline.
Above: slow turn wedge - markings and plastic delineators within the intersection.
Above: left turn calming treatments throughout the five boroughs.
VISION ZERO YEAR THREE REPORT38
Enforcement
Focus on the Prevention of Serious Crashes
Consistent and predictable enforcement of traffic laws helps to reduce dangerous driving behavior and saves lives.
Moving Violations
In 2016, NYPD continued to address the violations which, according to the
data, are highly associated with serious traffic crashes:
1. Speeding2. Failure-to-yield to pedestrians3. Fail to stop at traffic signal4. Improper turn5. Cell phone/texting6. Disobeying signs
The enforcement of these “Vision Zero violations” has improved steadily over
the last three years.
By targeting the behaviors that are known to contribute to traffic fatalities,
NYPD has targeted the culture where drivers disregard the possible ramifica-
tions of their actions. Whether on their way to work, school, an appointment,
or a recreational event, drivers need to understand that unsafe driving may
lead to catastrophic consequences. Ignoring the potential to injure or kill has
been and will continue to be met with an increasing number of enforcement
actions to alter behavior.
VISION ZERO YEAR THREE REPORT 39
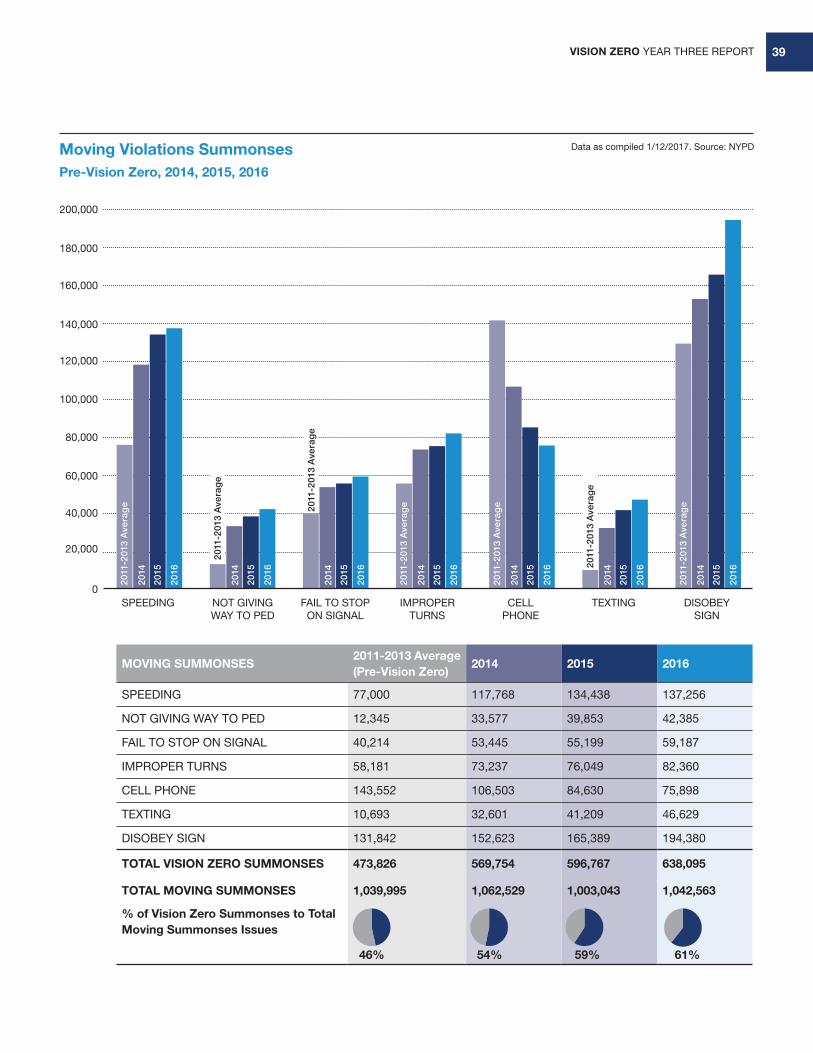
Moving Violations SummonsesPre-Vision Zero, 2014, 2015, 2016
Data as compiled 1/12/2017. Source: NYPD
SPEEDING
20,000
0
40,000
60,000
80,000
100,000
120,000
140,000
160,000
180,000
200,000
NOT GIVING WAY TO PED
FAIL TO STOP ON SIGNAL
IMPROPER TURNS
CELL PHONE
TEXTING DISOBEY SIGN
2011
-201
3 A
vera
ge
2011
-201
3 A
vera
ge
2011
-201
3 A
vera
ge
2011
-201
3 A
vera
ge
2011
-201
3 A
vera
ge
2011
-201
3 A
vera
ge
2011
-201
3 A
vera
ge
2014
2014
2014
2014
2014
2014
2014
2015
2015
2015
2015
2015
2015
2015
2016
2016
2016
2016
2016
2016
2016
MOVING SUMMONSES2011-2013 Average (Pre-Vision Zero)
2014 2015 2016
SPEEDING 77,000 117,768 134,438 137,256
NOT GIVING WAY TO PED 12,345 33,577 39,853 42,385
FAIL TO STOP ON SIGNAL 40,214 53,445 55,199 59,187
IMPROPER TURNS 58,181 73,237 76,049 82,360
CELL PHONE 143,552 106,503 84,630 75,898
TEXTING 10,693 32,601 41,209 46,629
DISOBEY SIGN 131,842 152,623 165,389 194,380
TOTAL VISION ZERO SUMMONSES 473,826 569,754 596,767 638,095
TOTAL MOVING SUMMONSES 1,039,995 1,062,529 1,003,043 1,042,563
% of Vision Zero Summonses to Total Moving Summonses Issues
46% 54% 59% 61%
VISION ZERO YEAR THREE REPORT40
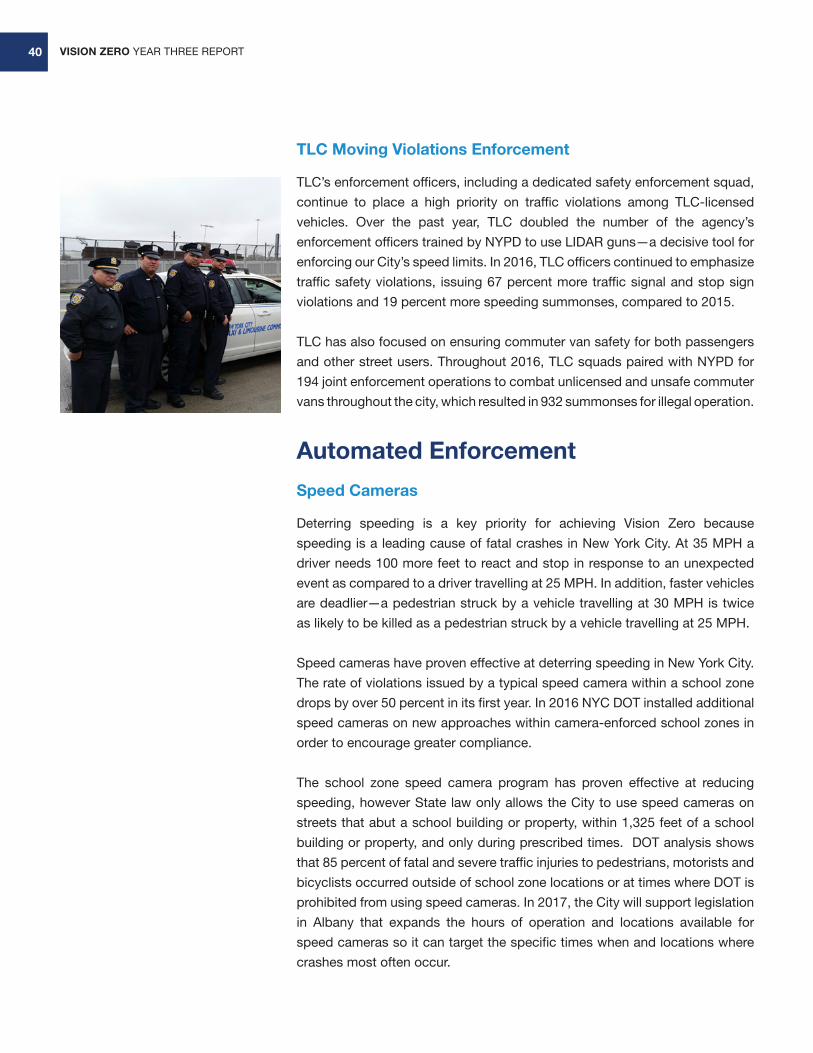
TLC Moving Violations Enforcement
TLC’s enforcement officers, including a dedicated safety enforcement squad,
continue to place a high priority on traffic violations among TLC-licensed
vehicles. Over the past year, TLC doubled the number of the agency’s
enforcement officers trained by NYPD to use LIDAR guns—a decisive tool for
enforcing our City’s speed limits. In 2016, TLC officers continued to emphasize
traffic safety violations, issuing 67 percent more traffic signal and stop sign
violations and 19 percent more speeding summonses, compared to 2015.
TLC has also focused on ensuring commuter van safety for both passengers
and other street users. Throughout 2016, TLC squads paired with NYPD for
194 joint enforcement operations to combat unlicensed and unsafe commuter
vans throughout the city, which resulted in 932 summonses for illegal operation.
Automated Enforcement
Speed Cameras
Deterring speeding is a key priority for achieving Vision Zero because
speeding is a leading cause of fatal crashes in New York City. At 35 MPH a
driver needs 100 more feet to react and stop in response to an unexpected
event as compared to a driver travelling at 25 MPH. In addition, faster vehicles
are deadlier—a pedestrian struck by a vehicle travelling at 30 MPH is twice
as likely to be killed as a pedestrian struck by a vehicle travelling at 25 MPH.
Speed cameras have proven effective at deterring speeding in New York City.
The rate of violations issued by a typical speed camera within a school zone
drops by over 50 percent in its first year. In 2016 NYC DOT installed additional
speed cameras on new approaches within camera-enforced school zones in
order to encourage greater compliance.
The school zone speed camera program has proven effective at reducing
speeding, however State law only allows the City to use speed cameras on
streets that abut a school building or property, within 1,325 feet of a school
building or property, and only during prescribed times. DOT analysis shows
that 85 percent of fatal and severe traffic injuries to pedestrians, motorists and
bicyclists occurred outside of school zone locations or at times where DOT is
prohibited from using speed cameras. In 2017, the City will support legislation
in Albany that expands the hours of operation and locations available for
speed cameras so it can target the specific times when and locations where
crashes most often occur.
VISION ZERO YEAR THREE REPORT 41
Red Light Cameras
Crashes caused by motorists who run red lights are highly associated with
right angle crashes, which lead to high rates of fatal and severe injury crashes.
DOT’s red light camera program is effective at increasing compliance with
traffic signals: in the first year of the red light camera program in 1994, the
average camera issued 32 Notices of Liability (NOLs) on a daily basis. In 2015,
the average camera issued 8 NOLs on a daily basis—a 75 percent drop.
Red light enforcement has helped prevent crashes which are associated with
red light running. A comparison of the three years prior to the launch of the
program to 2011-2014 shows that reportable right angle crashes at signalized
intersections have declined by 62 percent citywide, from 7,221 to 2,723
annually. In addition severe injuries from such crashes have declined by 76
percent, from 633 to 155 annually.
While this program has been very effective in reducing unsafe driving on the
City’s streets, the New York State Legislature prohibits the use of red light
cameras at more than 150 intersections at a time. This means only about
one percent of the City’s 12,700 signalized intersections can have red light
cameras. Red light cameras are effective at reducing violations because
motorists expect consistent enforcement across the City. An increase in the
total number of intersections where red light cameras can be operated by the
City would make this public safety tool even more effective.
Collision Investigations
NYPD has a finite amount of resources and a seemingly infinite array of re-
sponsibilities. It is, therefore, imperative that it utilize its resources in an
efficient manner. It is with this in mind that NYPD is exploring two proposals
which are anticipated to enhance its traffic program.
Collision Investigation Squad (CIS)
The Collision Investigation Squad investigates crashes which involve fatalities
and the most serious of injuries. These expert investigators scrutinize a
collision scene and seek to determine the cause of the collision and whether
any criminality occurred. The District Attorneys have been working closely
with CIS to ensure immediate communication and real time assistance in
these in vestigations. In 2016, the District Attorneys hosted numerous trainings
with NYPD about the recovery of cell phone information, video evidence and
many other technological collision reconstruction innovations to determine
crash culpability.
Reportable right angle crashes at signalized intersections have declined by 62 percent citywide since red light cameras were installed.
VISION ZERO YEAR THREE REPORT42
The District Attorneys recognize that CIS is uniquely trained and equipped
to determine if criminality is involved in a time sensitive manner. NYPD is
exploring the expansion of the criteria for when the Collision In vestigation
Squad conducts an investigation. An analysis of traffic collisions and any
related injuries is ongoing. This evaluation must balance resources with the
potential benefits of any expansion.
Traffic Enforcement Agents
In 2014 the Department launched a pilot program where Traffic Enforcement
Agents (TEAs), who typically issue parking violations and direct traffic, began
to respond to collisions that only involve property damage. This allowed
uniformed patrol officers to concentrate on hazardous moving violations.
In the period since the inception of this program, TEAs have responded to
approximately 12,000 vehicle collisions, freeing up uniformed officers. In
addition, customer service improved as the average response time to these
collisions was reduced by 40 percent. In 2016, TEAs assigned to this pilot
responded to approximately double the number of vehicle collisions than they
did in the prior year.
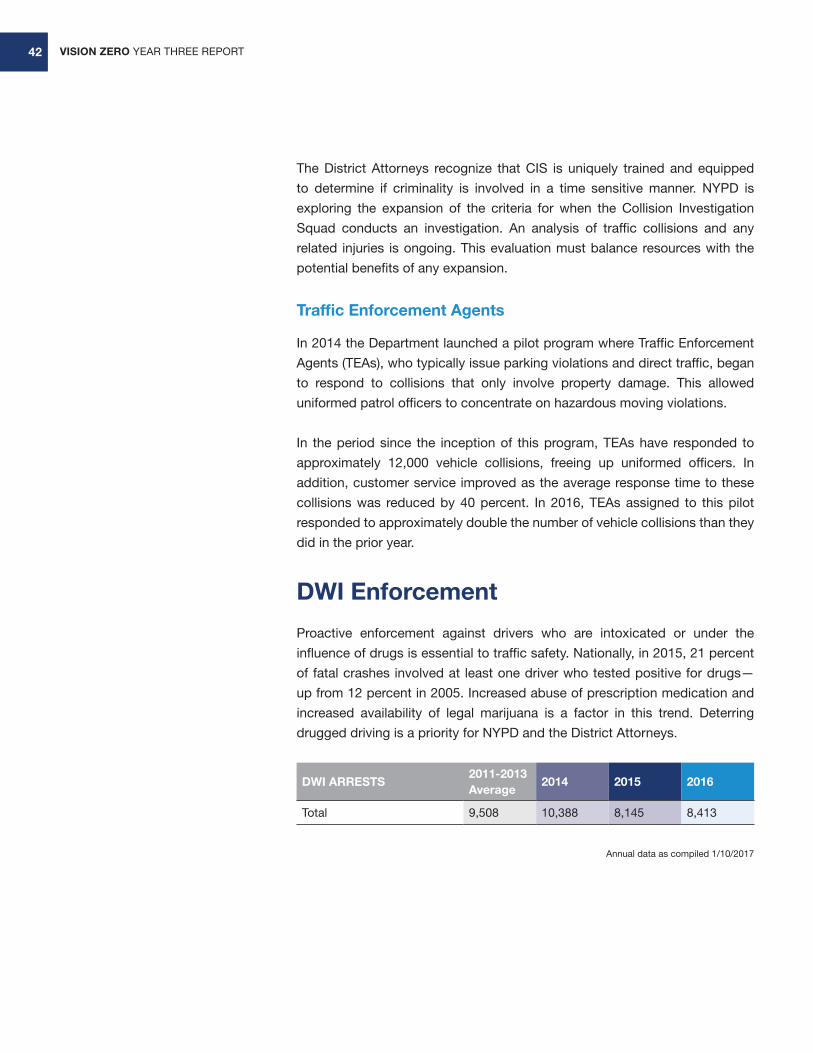
DWI Enforcement
Proactive enforcement against drivers who are intoxicated or under the
influence of drugs is essential to traffic safety. Nationally, in 2015, 21 percent
of fatal crashes involved at least one driver who tested positive for drugs—
up from 12 percent in 2005. Increased abuse of prescription medication and
increased availability of legal marijuana is a factor in this trend. Deterring
drugged driving is a priority for NYPD and the District Attorneys.
DWI ARRESTS2011-2013Average
2014 2015 2016
Total 9,508 10,388 8,145 8,413
Annual data as compiled 1/10/2017
VISION ZERO YEAR THREE REPORT 43
In 2016 NYPD, with the support of the District Attorneys, began using saliva
swabs to test drivers for drug use when they had been involved in a serious
crash. These preliminary screening tests alert the police officers to the potential
presence of drugs and assist them with the development of probable cause
and the request for a search warrant to further test the motorist. NYPD is
leading the nation in the swift implementation of this new process. In 2017, the
District Attorneys will be breaking new ground with the use of this evidence
in court.
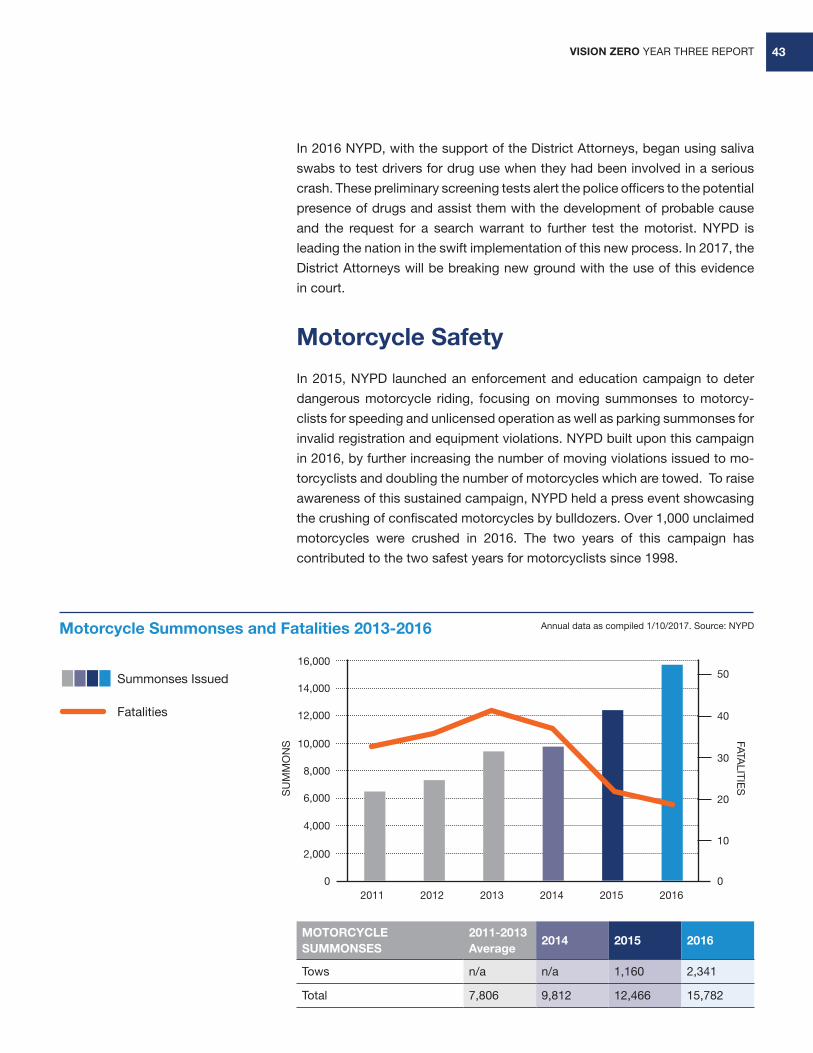
Motorcycle Safety
In 2015, NYPD launched an enforcement and education campaign to deter
dangerous motorcycle riding, focusing on moving summonses to motorcy-
clists for speeding and unlicensed operation as well as parking summonses for
invalid registration and equipment violations. NYPD built upon this campaign
in 2016, by further increasing the number of moving violations issued to mo-
torcyclists and doubling the number of motorcycles which are towed. To raise
awareness of this sustained campaign, NYPD held a press event showcasing
the crushing of confiscated motorcycles by bulldozers. Over 1,000 unclaimed
motorcycles were crushed in 2016. The two years of this campaign has
contributed to the two safest years for motorcyclists since 1998.
2011
SU
MM
ON
S FATALITIE
S
2012 2013 2014 2015 2016
2,000
0
10
0
20
30
40
50
4,000
Summonses Issued
Fatalities
6,000
8,000
10,000
12,000
14,000
16,000
MOTORCYCLE SUMMONSES
2011-2013Average
2014 2015 2016
Tows n/a n/a 1,160 2,341
Total 7,806 9,812 12,466 15,782
Motorcycle Summonses and Fatalities 2013-2016 Annual data as compiled 1/10/2017. Source: NYPD
VISION ZERO YEAR THREE REPORT44
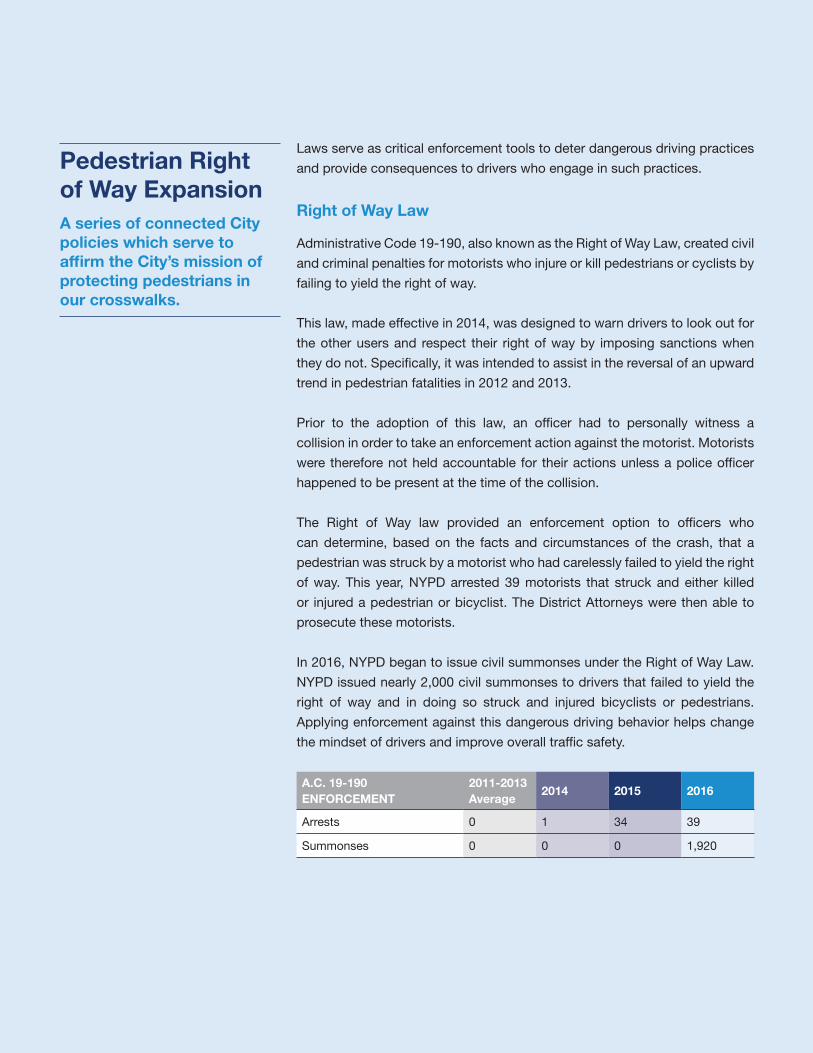
Laws serve as critical enforcement tools to deter dangerous driving practices
and provide consequences to drivers who engage in such practices.
Right of Way Law
Administrative Code 19-190, also known as the Right of Way Law, created civil
and criminal penalties for motorists who injure or kill pedestrians or cyclists by
failing to yield the right of way.
This law, made effective in 2014, was designed to warn drivers to look out for
the other users and respect their right of way by imposing sanctions when
they do not. Specifically, it was intended to assist in the reversal of an upward
trend in pedestrian fatalities in 2012 and 2013.
Prior to the adoption of this law, an officer had to personally witness a
collision in order to take an enforcement action against the motorist. Motorists
were therefore not held accountable for their actions unless a police officer
happened to be present at the time of the collision.
The Right of Way law provided an enforcement option to officers who
can determine, based on the facts and circumstances of the crash, that a
pedestrian was struck by a motorist who had carelessly failed to yield the right
of way. This year, NYPD arrested 39 motorists that struck and either killed
or injured a pedestrian or bicyclist. The District Attorneys were then able to
prosecute these motorists.
In 2016, NYPD began to issue civil summonses under the Right of Way Law.
NYPD issued nearly 2,000 civil summonses to drivers that failed to yield the
right of way and in doing so struck and injured bicyclists or pedestrians.
Applying enforcement against this dangerous driving behavior helps change
the mindset of drivers and improve overall traffic safety.
A.C. 19-190 ENFORCEMENT
2011-2013Average
2014 2015 2016
Arrests 0 1 34 39
Summonses 0 0 0 1,920
Pedestrian Right of Way ExpansionA series of connected City policies which serve to affirm the City’s mission of protecting pedestrians in our crosswalks.
VISION ZERO YEAR THREE REPORT 45
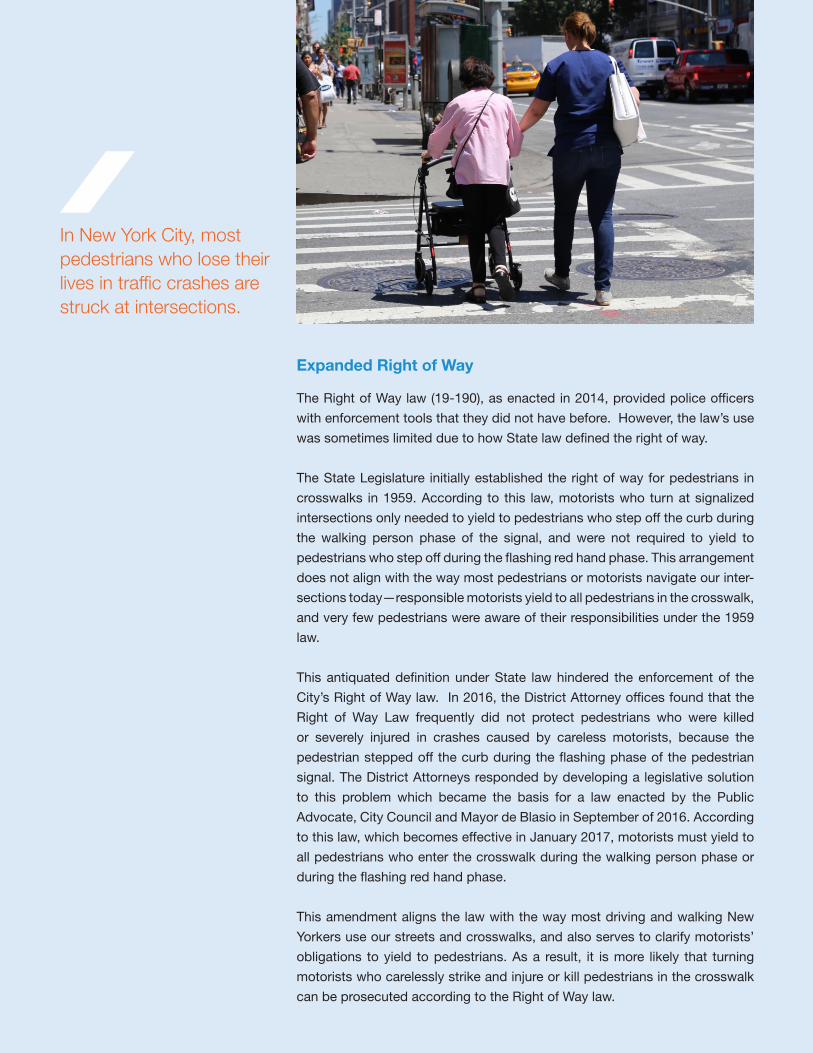
Expanded Right of Way
The Right of Way law (19-190), as enacted in 2014, provided police officers
with enforcement tools that they did not have before. However, the law’s use
was sometimes limited due to how State law defined the right of way.
The State Legislature initially established the right of way for pedestrians in
crosswalks in 1959. According to this law, motorists who turn at signalized
intersections only needed to yield to pedestrians who step off the curb during
the walking person phase of the signal, and were not required to yield to
pedestrians who step off during the flashing red hand phase. This arrangement
does not align with the way most pedestrians or motorists navigate our inter-
sections today—responsible motorists yield to all pedestrians in the crosswalk,
and very few pedestrians were aware of their responsibilities under the 1959
law.
This antiquated definition under State law hindered the enforcement of the
City’s Right of Way law. In 2016, the District Attorney offices found that the
Right of Way Law frequently did not protect pedestrians who were killed
or severely injured in crashes caused by careless motorists, because the
pedestrian stepped off the curb during the flashing phase of the pedestrian
signal. The District Attorneys responded by developing a legislative solution
to this problem which became the basis for a law enacted by the Public
Advocate, City Council and Mayor de Blasio in September of 2016. According
to this law, which becomes effective in January 2017, motorists must yield to
all pedestrians who enter the crosswalk during the walking person phase or
during the flashing red hand phase.
This amendment aligns the law with the way most driving and walking New
Yorkers use our streets and crosswalks, and also serves to clarify motorists’
obligations to yield to pedestrians. As a result, it is more likely that turning
motorists who carelessly strike and injure or kill pedestrians in the crosswalk
can be prosecuted according to the Right of Way law.
In New York City, most pedestrians who lose their lives in traffic crashes are struck at intersections.
VISION ZERO YEAR THREE REPORT46
FORMS
An essential component of the traffic enforcement plan is the analysis of collision
data. The ongoing upgrading of the systems used to capture collision data are
essential to NYPD’s traffic enforcement strategies. The FORMS application
went live in 2016 and NYPD began to electronically record collisions. Although
there will be a transition period to acclimate to the new system, the potential
technological upgrades within FORMS will lead to broader capabilities for
traffic data analysis. NYPD also developed a TrafficStat 2.0 application,
described earlier in this report, which allows the precincts to more efficiently
analyze the collision statistics using interactive maps.
Data-Driven Approach to Crime and Traffic Safety
The Data-Driven Approach to Crime and Traffic Safety (DDACTS) program,
a strategic approach to crash prevention through an efficient deployment of
resources to reduce both crime and traffic crashes, took a step forward for
NYPD in 2016. The Department has almost completed the multi-year task of
automating the crash reporting process so that officers can now complete
crash reports on desktops, tablets, and phones (FORMS). These upgrades
will enable the Department to better analyze traffic data which is an essential
component of DDACTS. The next step will be technology upgrades in how the
Department captures traffic summonses. This will provide the Department with
a whole new data set by which to identify what kind of violations are taking
place in various locations and will allow the Department to better assess the
impact of DDACTS. The ultimate goal of DDACTS is that police presence will
reduce the need for enforcement actions while, at the same time, reducing
crashes and injuries from crashes.
Safe Passage
Pedestrians and bicyclists are the most vulnerable road users. This year
NYPD conducted Operation Safe Passage, an enforcement initiative intended
to relay a message to motorists regarding their responsibility to safely share
the roadways with bicyclists. To promote pedestrian safety the Department
is stressing enforcement of failure to yield to pedestrian violations. Citywide
traffic initiatives were conducted during the summer months, including
enforcing against hazardous parking (including blocking the bike lane and
double parking) and moving violations which interfere with the safe passage of
cyclists. These citywide initiatives resulted in over 530,000 parking summonses
and 54,000 moving summonses being issued during these initiatives.
VISION ZERO YEAR THREE REPORT 47
Tougher Laws Against Dangerous Driving
Leaving the Scene of a Collision
In 2016 the City supported legislation to increase criminal penalties and jail
time for drivers who flee crashes so that they mirror the penalties for impaired
driving. Under current law, an impaired driver who stays at the scene of a
fatal crash risks a higher penalty than a driver who leaves the scene, creating
an unintended incentive for drivers who have been drinking to flee. While
the State legislature passed a bill related to leaving the scene, the legislation
would not have provided any real solution the problems listed. The District
Attorneys, the City and numerous advocacy groups such as MADD conveyed
their concern to Governor Cuomo and he vetoed the bill. The City will continue
to support a legislative fix in 2017.
Ignition Interlock Monitoring
In November 2009, Governor David Paterson signed the Child Passenger
Protection Act, also known as Leandra’s Law, in remembrance of Leandra
Rosado, an 11-year-old victim who was killed as a result of a DWI crash on
the West Side Highway in New York City. With the passage of this law, New
York became one of the first states to mandate ignition interlock devices for
all misdemeanor and felony drunk driving convictions. Currently, federal funds
are used to cover the cost of monitoring offenders to make sure they are
complying with this law. In 2017 that funding runs out. The City will work with
District Attorneys to support legislation to use the current surcharges on DWI
convictions to replace that funding.
Drugged Driving
In 2016 the District Attorneys supported legislation to address a host of issues
involving drivers who operate a car while they are impaired by a drug. Drug
use while driving is a serious and underreported danger on our streets and
we need to make sure law enforcement has the tools needed to prevent the
danger. The City and the District Attorneys will continue to work together in
2017 to address drugged driving.
VISION ZERO YEAR THREE REPORT48
Fleets
Continuing to Improve Fleet Safety
Drivers of the fleets regulated by various agencies focus on the safety of their fellow New Yorkers and work continually to make their vehicles safer.
Recognizing Safe Driving
Second Annual GO Awards
The City of New York has an estimated 80,000 staff members who operate
vehicles full or part time. In November 2015, DCAS, the Mayor’s Office of
Operations, and major fleet owning agencies presented the first-ever Good
Operator (GO) Awards recognizing the best drivers for the City. GO Award
winners were chosen by agencies based on outstanding driving records and
conduct. Criteria to be selected included a minimum of ten years of full time
employment, operation of fleet units on a daily basis as a core part of their
job, at least five years of driving without a preventable collision or violation,
general driving and work performance, and an outstanding commitment and
focus on safety.
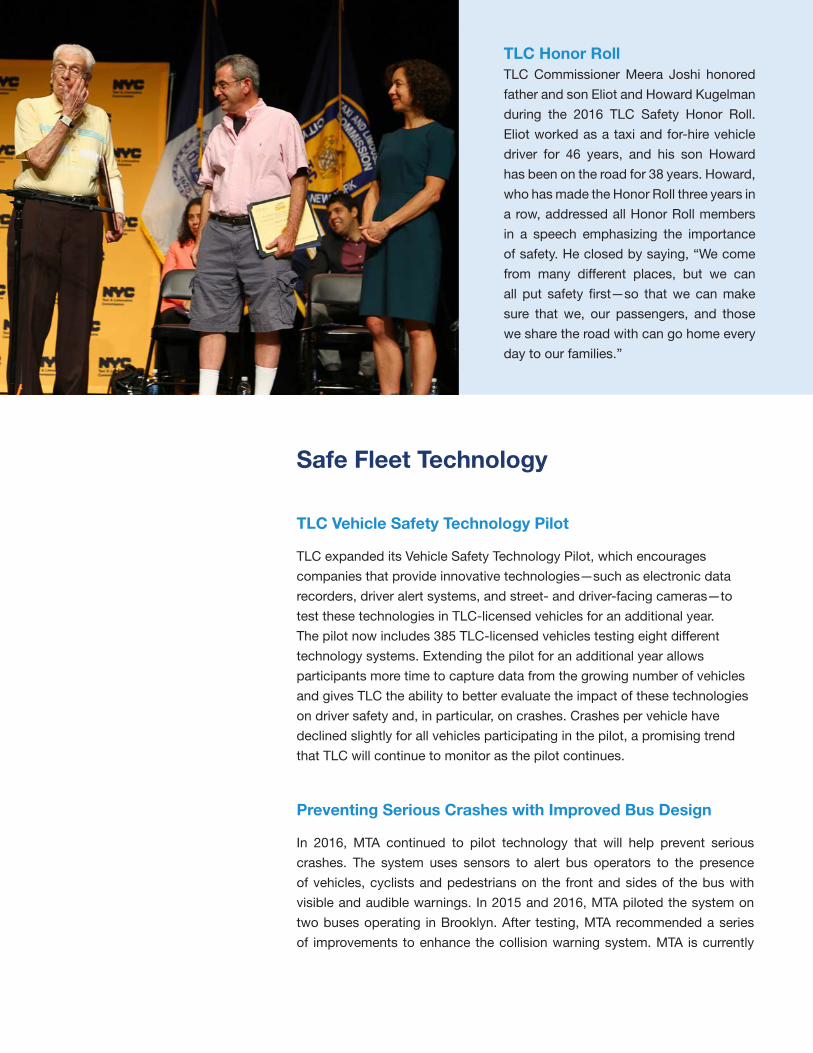
Third Annual TLC Safety Honor Roll
The 2016 TLC Safety Honor Roll is the third annual event recognizing TLC-
licensed drivers who have outstanding records of safe driving over many years
and millions of miles behind the wheel. TLC reviewed all of its licensed drivers’
records and identified drivers who have, over four or more years, not had a
single crash resulting in an injury or fatality, a single traffic violation, or a single
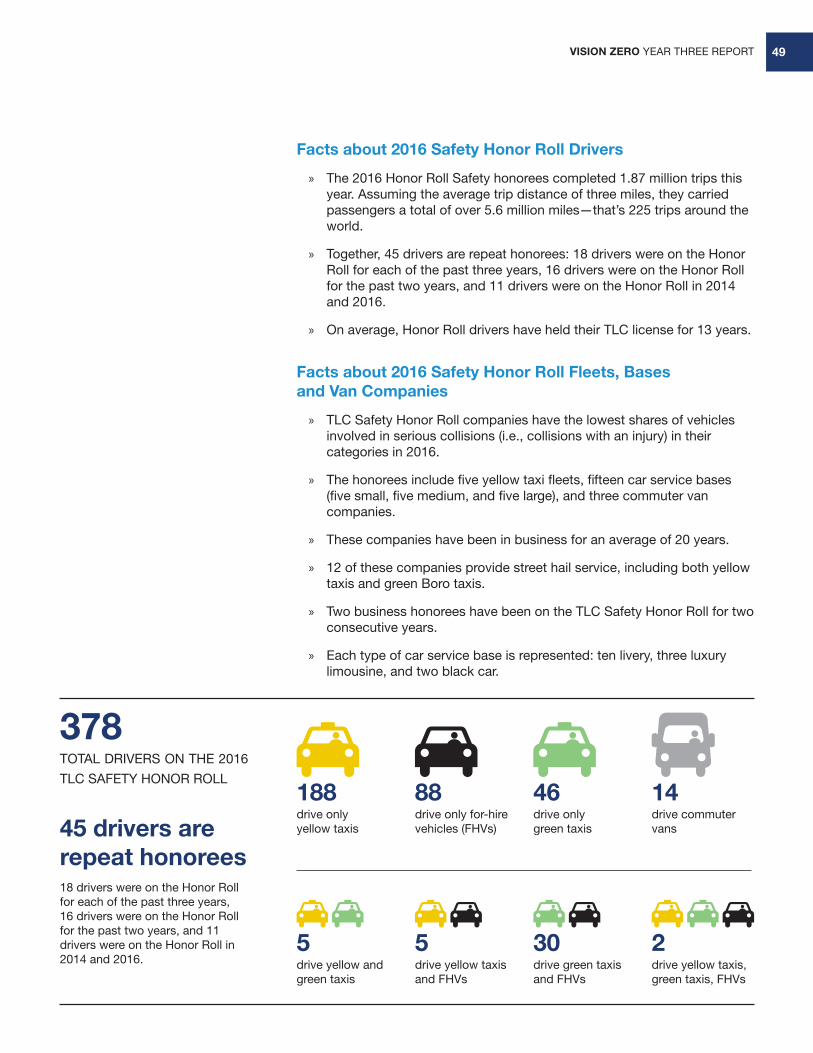
violation of TLC safety-related rules. The 378 drivers on the 2016 TLC Safety
Honor Roll represent a truly elite group.
VISION ZERO YEAR THREE REPORT 49
Facts about 2016 Safety Honor Roll Drivers
» The 2016 Honor Roll Safety honorees completed 1.87 million trips this year. Assuming the average trip distance of three miles, they carried passengers a total of over 5.6 million miles—that’s 225 trips around the world.
» Together, 45 drivers are repeat honorees: 18 drivers were on the Honor Roll for each of the past three years, 16 drivers were on the Honor Roll for the past two years, and 11 drivers were on the Honor Roll in 2014 and 2016.
» On average, Honor Roll drivers have held their TLC license for 13 years.
Facts about 2016 Safety Honor Roll Fleets, Bases and Van Companies
» TLC Safety Honor Roll companies have the lowest shares of vehicles involved in serious collisions (i.e., collisions with an injury) in their categories in 2016.
» The honorees include five yellow taxi fleets, fifteen car service bases (five small, five medium, and five large), and three commuter van companies.
» These companies have been in business for an average of 20 years.
» 12 of these companies provide street hail service, including both yellow taxis and green Boro taxis.
» Two business honorees have been on the TLC Safety Honor Roll for two consecutive years.
» Each type of car service base is represented: ten livery, three luxury limousine, and two black car.
drive only yellow taxis
188drive only for-hire vehicles (FHVs)
88drive only green taxis
46
378
45 drivers are repeat honorees
TOTAL DRIVERS ON THE 2016
TLC SAFETY HONOR ROLL
18 drivers were on the Honor Roll for each of the past three years, 16 drivers were on the Honor Roll for the past two years, and 11 drivers were on the Honor Roll in 2014 and 2016.
drive commuter vans
14
drive yellow and green taxis
5drive yellow taxis and FHVs
5drive green taxis and FHVs
30drive yellow taxis, green taxis, FHVs
2
VISION ZERO YEAR THREE REPORT50
Safe Fleet Technology
TLC Vehicle Safety Technology Pilot
TLC expanded its Vehicle Safety Technology Pilot, which encourages
companies that provide innovative technologies—such as electronic data
recorders, driver alert systems, and street- and driver-facing cameras—to
test these technologies in TLC-licensed vehicles for an additional year.
The pilot now includes 385 TLC-licensed vehicles testing eight different
technology systems. Extending the pilot for an additional year allows
participants more time to capture data from the growing number of vehicles
and gives TLC the ability to better evaluate the impact of these technologies
on driver safety and, in particular, on crashes. Crashes per vehicle have
declined slightly for all vehicles participating in the pilot, a promising trend
that TLC will continue to monitor as the pilot continues.
Preventing Serious Crashes with Improved Bus Design
In 2016, MTA continued to pilot technology that will help prevent serious
crashes. The system uses sensors to alert bus operators to the presence
of vehicles, cyclists and pedestrians on the front and sides of the bus with
visible and audible warnings. In 2015 and 2016, MTA piloted the system on
two buses operating in Brooklyn. After testing, MTA recommended a series
of improvements to enhance the collision warning system. MTA is currently
TLC Honor RollTLC Commissioner Meera Joshi honored
father and son Eliot and Howard Kugelman
during the 2016 TLC Safety Honor Roll.
Eliot worked as a taxi and for-hire vehicle
driver for 46 years, and his son Howard
has been on the road for 38 years. Howard,
who has made the Honor Roll three years in
a row, addressed all Honor Roll members
in a speech emphasizing the importance
of safety. He closed by saying, “We come
from many different places, but we can
all put safety first—so that we can make
sure that we, our passengers, and those
we share the road with can go home every
day to our families.”
VISION ZERO YEAR THREE REPORT 51
working with the vendor to implement these improvements, which will be in
place in time for a launch this winter. The full pilot for the collision warning
system will involve over 100 buses—20 buses were outfitted in 2016 and 80
more will hit the street in 2017. The pilot program will include bus routes in
Brooklyn and Manhattan (B46, B38 and M42).
Additionally, MTA is seeking to increase operators’ visibility by adjusting the
size and positioning of mirrors on the left side of buses. In 2016, MTA met its
goal of replacing 850 rectangular mirrors with smaller square mirrors, thereby
reducing obstructed views. This project was completed as part of a grant
funded by the Safety Research & Demonstration Program of the Federal
Transit Administration, and will help inform the design of buses around the
nation.
MTA is also testing pedestrian warning systems, which are automatical-
ly triggered when the bus makes a right or a left hand turn, activating an
external audio warning that alerts pedestrians and bicyclists that the bus is
turning. External speakers are installed in an area that does not block the bus
operator’s view, and the speaker volume takes into consideration the ambient
sound level in the vicinity of the bus. During the field test of the pedestrian turn
warning system, the technology was installed on four buses, two operating
in Manhattan, one in Brooklyn and a fourth in Queens. After the test, MTA
asked for a series of improvements to the system, asking that the audio
warning sound activate only on the ‘turn side’ of the bus to avoid confusion.
In addition, MTA is working with the manufacturer to develop a visual alert
system that will be automatically triggered to display a visual warning to help
warn customers that the bus is making a turn. This modification will be added
in 2017. The full pilot of the system will involve over 200 buses—40 were put
into operation in 2016 and the remainder will roll out during 2017. The pilot will
include bus routes in Queens, Manhattan and Brooklyn (Q32, Q17, Q41, B36,
B17 and B6).
Safe Fleet Transition Plan
In 2016, DCAS began working closely with fleet agencies to complete the first
Safe Fleet Transition Plan (SFTP). At the Fleet Federation meeting on October
20th, 2016, the US DOT Volpe Center joined 11 City agencies at DCAS to
kick off the final review for the SFTP. The SFTP is a comprehensive look at
all safety options for fleet vehicles. As part of the SFTP, agencies and DCAS
will revise all vehicle specifications to include an agreed upon set of safety
technologies and designs, as well as maintain a framework for regular piloting
and review of other technologies, industry changes and offerings. Volpe has
already completed reports on driver alert systems and truck sideguards in
New York City. DCAS is utilizing the research in the SFTP and other vehicle
VISION ZERO YEAR THREE REPORT52
safety initiatives. In 2016, DCAS completed the initial review of safety tech-
nologies and discussed them with City agencies at the October 20th meeting.
In 2017 Volpe will work with DCAS and the fleet agencies to complete an initial
plan draft in Winter 2017, including interviewing each agency.
DCAS Truck Sideguards Installation
Sideguards are rail or panel style attachments that can help prevent a
pedestrian or bicyclist from being seriously injured or killed by a turning truck.
DCAS has now installed over 550 sideguards on City-owned trucks, the
largest program in the nation. DCAS also worked closely with BIC and DOT to
administer a financial incentive program which covers a majority of the cost
for private fleets to adopt truck side guards and comply with the truck side
guard law, which the City Council passed in 2015. To date, over 80 private
sector trucks regulated by BIC have been outfitted while taking advantage of
this financial incentive. DCAS continues to work with suppliers to expand the
marketplace for truck side-guards.
Cooper’s Law
TLC has the power to suspend and revoke a driver’s TLC license for their
role in a serious crash and applies it to protect the public’s safety. According
to Cooper’s Law, TLC will revoke a driver’s TLC license “upon conviction of
such driver of one or more of the violations or crimes stated in the summons
or such charges and upon a determination that one or more of such violations
or crimes for which conviction occurred was a cause of such critical injury
or death.” Since TLC began receiving NYPD crash reports in May 2014, TLC
has suspended the TLC license of 24 drivers involved in serious crashes. Of
that group, 15 drivers were suspended pursuant to Cooper’s Law and 9 were
suspended pursuant to Local Law 28 of 2014, which does not require a cor-
responding traffic violation for suspension.
A suspension for a serious crash is a concrete consequence for drivers because
it prohibits them from driving for-hire vehicles. These cases can take time to
pursue, including resulting in a driver’s TLC license expiration which renders
a revocation proceeding moot. In November 2016, TLC revoked a driver’s
TLC license under Cooper’s Law for the first time. However, 11 of the 24 other
cases resulted in the driver’s TLC license expiring while under suspension or
in the driver surrendering his or her license, meaning the driver cannot drive
for hire. For serious crashes, TLC is unable to revoke a driver’s TLC license
pursuant to Cooper’s Law until the driver is convicted. TLC closely monitors
these cases and, when necessary, pursues revocation as soon as possible
following conviction.
VISION ZERO YEAR THREE REPORT 53
Maintaining Safety with a Growing Pool of TLC-licensed Drivers
One of the core tenets of TLC’s Vision Zero efforts is improving and broadening
driver training and outreach. In December 2015, TLC expanded the 24-hour
pre-licensure course requirement to drivers of for-hire vehicles, which include
liveries, black cars, and luxury limousines, providing instruction on Vision Zero
and “the rules of the road.” Since 2014, over 43,000 TLC-licensed drivers
have taken this course with the addition of the Vision Zero curriculum, which
provides instruction on new road designs like protected bike lanes, high risk
driving behaviors that lead to crashes, and the important role professional
drivers play in promoting a culture of safe driving, including over 37,000 in
2016 alone. On average in 2016, almost 3,000 drivers took the course each
month.
In addition, TLC staff has continued to hold Vision Zero meetings with drivers.
In these meetings TLC provides safety information and screens “Drive Like
Your Family Lives Here”—a Families for Safe Streets video that shows the
devastating effects of traffic crashes. Since the program began, TLC staff has
visited 422 garages and organizations including 139 visits in 2016 alone.
Since the Vision Zero Initiative began in early 2014, TLC driver and vehicles
licensee totals have grown rapidly. TLC-licensed drivers have grown from
113,000 in January 2014 to over 155,000 in 2016. Similarly, TLC-licensed
vehicles have grown from 69,000 vehicles to over 100,000 vehicles in just
two years. Vehicle licensee growth is almost entirely based in the black car
sector. In 2016, the number of TLC-licensed vehicles involved serious crashes
remained stable compared to 2015 despite licensee growth. TLC monitors
crashes that involve any TLC-licensed vehicle with an occupant (parked or
driving) irrespective of the TLC licensee’s role in the crash.
Since 2014, over 43,000 TLC-licensed drivers have recieved Vision Zero safe driving education.
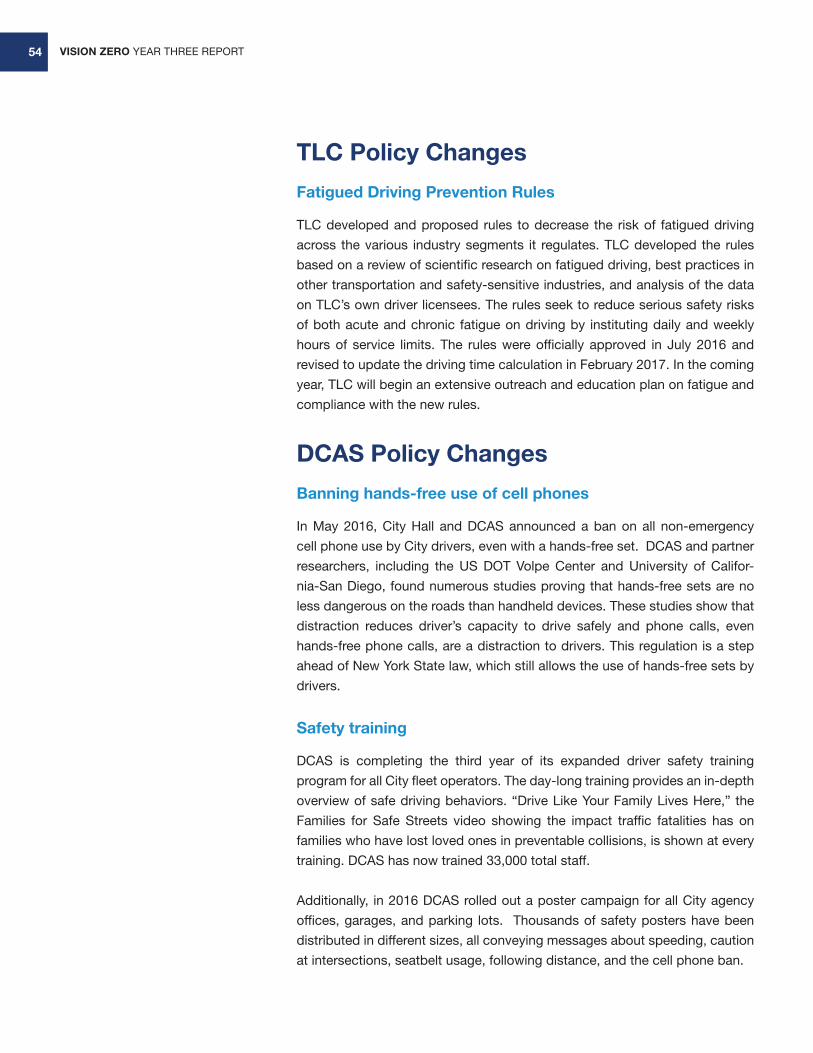
VISION ZERO YEAR THREE REPORT54
TLC Policy Changes
Fatigued Driving Prevention Rules
TLC developed and proposed rules to decrease the risk of fatigued driving
across the various industry segments it regulates. TLC developed the rules
based on a review of scientific research on fatigued driving, best practices in
other transportation and safety-sensitive industries, and analysis of the data
on TLC’s own driver licensees. The rules seek to reduce serious safety risks
of both acute and chronic fatigue on driving by instituting daily and weekly
hours of service limits. The rules were officially approved in July 2016 and
revised to update the driving time calculation in February 2017. In the coming
year, TLC will begin an extensive outreach and education plan on fatigue and
compliance with the new rules.
DCAS Policy Changes
Banning hands-free use of cell phones
In May 2016, City Hall and DCAS announced a ban on all non-emergency
cell phone use by City drivers, even with a hands-free set. DCAS and partner
researchers, including the US DOT Volpe Center and University of Califor-
nia-San Diego, found numerous studies proving that hands-free sets are no
less dangerous on the roads than handheld devices. These studies show that
distraction reduces driver’s capacity to drive safely and phone calls, even
hands-free phone calls, are a distraction to drivers. This regulation is a step
ahead of New York State law, which still allows the use of hands-free sets by
drivers.
Safety training
DCAS is completing the third year of its expanded driver safety training
program for all City fleet operators. The day-long training provides an in-depth
overview of safe driving behaviors. “Drive Like Your Family Lives Here,” the
Families for Safe Streets video showing the impact traffic fatalities has on
families who have lost loved ones in preventable collisions, is shown at every
training. DCAS has now trained 33,000 total staff.
Additionally, in 2016 DCAS rolled out a poster campaign for all City agency
offices, garages, and parking lots. Thousands of safety posters have been
distributed in different sizes, all conveying messages about speeding, caution
at intersections, seatbelt usage, following distance, and the cell phone ban.
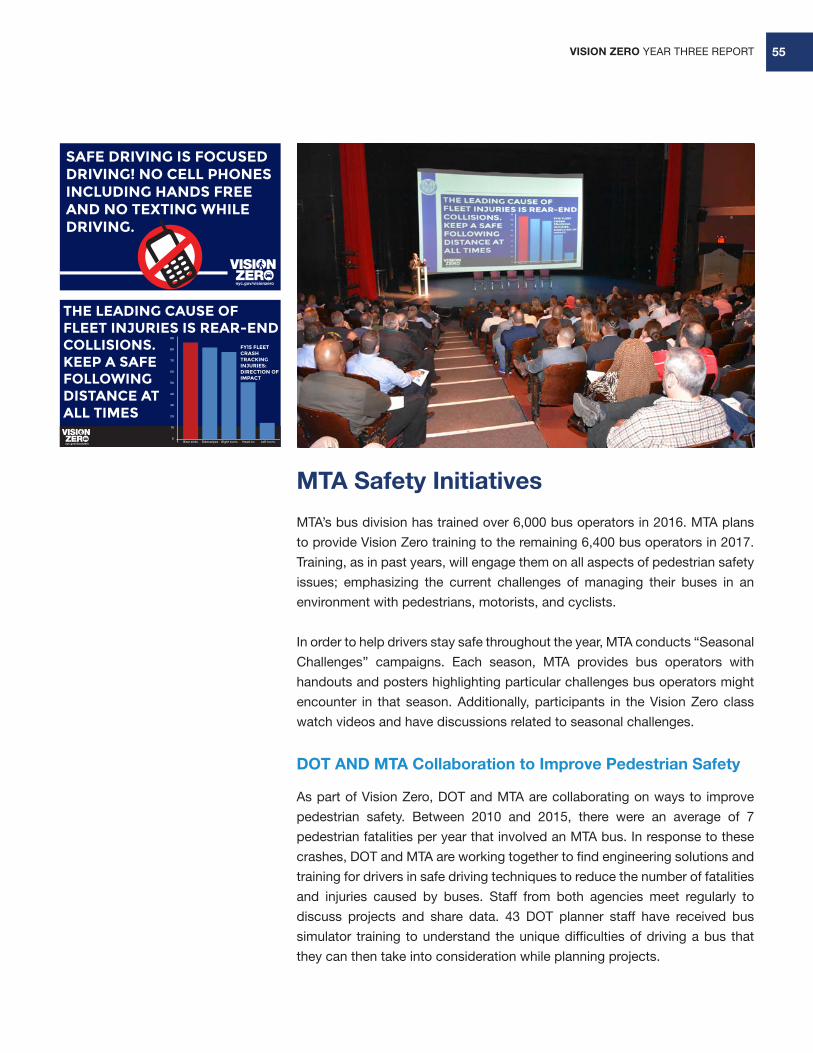
VISION ZERO YEAR THREE REPORT 55
MTA Safety Initiatives
MTA’s bus division has trained over 6,000 bus operators in 2016. MTA plans
to provide Vision Zero training to the remaining 6,400 bus operators in 2017.
Training, as in past years, will engage them on all aspects of pedestrian safety
issues; emphasizing the current challenges of managing their buses in an
environment with pedestrians, motorists, and cyclists.
In order to help drivers stay safe throughout the year, MTA conducts “Seasonal
Challenges” campaigns. Each season, MTA provides bus operators with
handouts and posters highlighting particular challenges bus operators might
encounter in that season. Additionally, participants in the Vision Zero class
watch videos and have discussions related to seasonal challenges.
DOT AND MTA Collaboration to Improve Pedestrian Safety
As part of Vision Zero, DOT and MTA are collaborating on ways to improve
pedestrian safety. Between 2010 and 2015, there were an average of 7
pedestrian fatalities per year that involved an MTA bus. In response to these
crashes, DOT and MTA are working together to find engineering solutions and
training for drivers in safe driving techniques to reduce the number of fatalities
and injuries caused by buses. Staff from both agencies meet regularly to
discuss projects and share data. 43 DOT planner staff have received bus
simulator training to understand the unique difficulties of driving a bus that
they can then take into consideration while planning projects.
SAFE DRIVING IS FOCUSEDDRIVING! NO CELL PHONESINCLUDING HANDS FREEAND NO TEXTING WHILEDRIVING.
THE LEADING CAUSE OFFLEET INJURIES IS REAR-ENDCOLLISIONS.KEEP A SAFEFOLLOWINGDISTANCE ATALL TIMES
Rear ends Sideswipes Right turns Head on Left turns
90
80
70
60
50
40
30
20
10
0
FY15 FLEETCRASHTRACKINGINJURIES:DIRECTION OFIMPACT
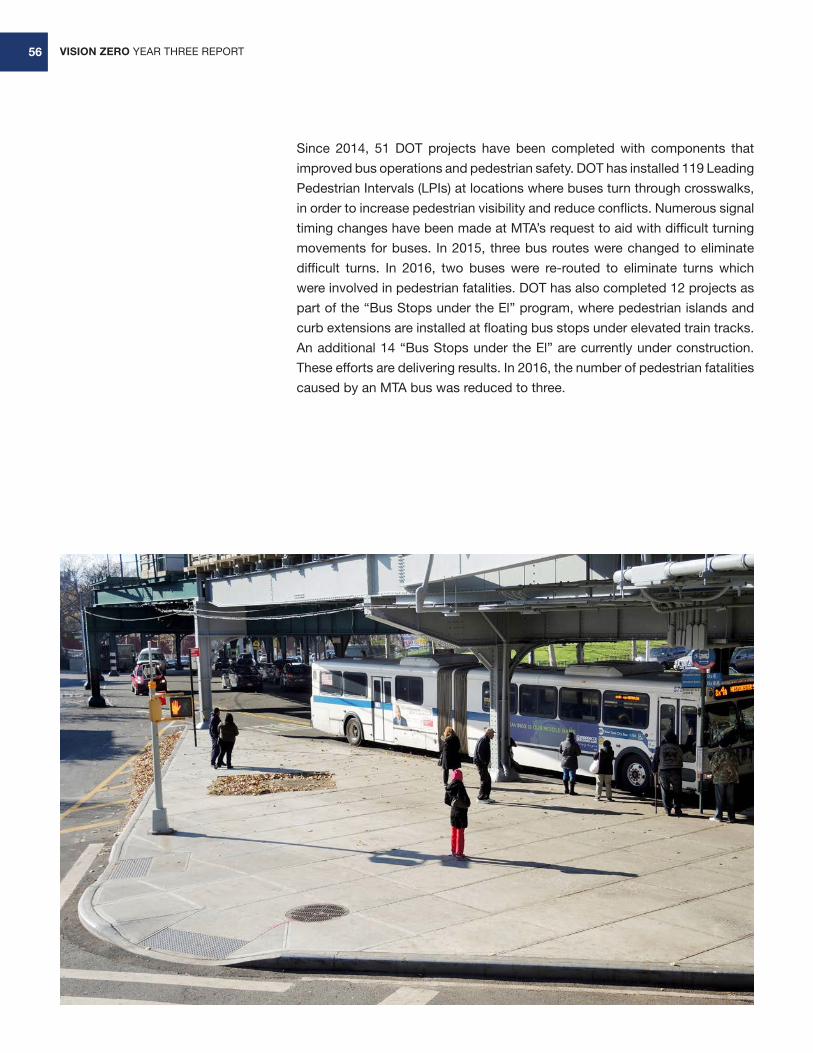
VISION ZERO YEAR THREE REPORT56
Since 2014, 51 DOT projects have been completed with components that
improved bus operations and pedestrian safety. DOT has installed 119 Leading
Pedestrian Intervals (LPIs) at locations where buses turn through crosswalks,
in order to increase pedestrian visibility and reduce conflicts. Numerous signal
timing changes have been made at MTA’s request to aid with difficult turning
movements for buses. In 2015, three bus routes were changed to eliminate
difficult turns. In 2016, two buses were re-routed to eliminate turns which
were involved in pedestrian fatalities. DOT has also completed 12 projects as
part of the “Bus Stops under the El” program, where pedestrian islands and
curb extensions are installed at floating bus stops under elevated train tracks.
An additional 14 “Bus Stops under the El” are currently under construction.
These efforts are delivering results. In 2016, the number of pedestrian fatalities
caused by an MTA bus was reduced to three.
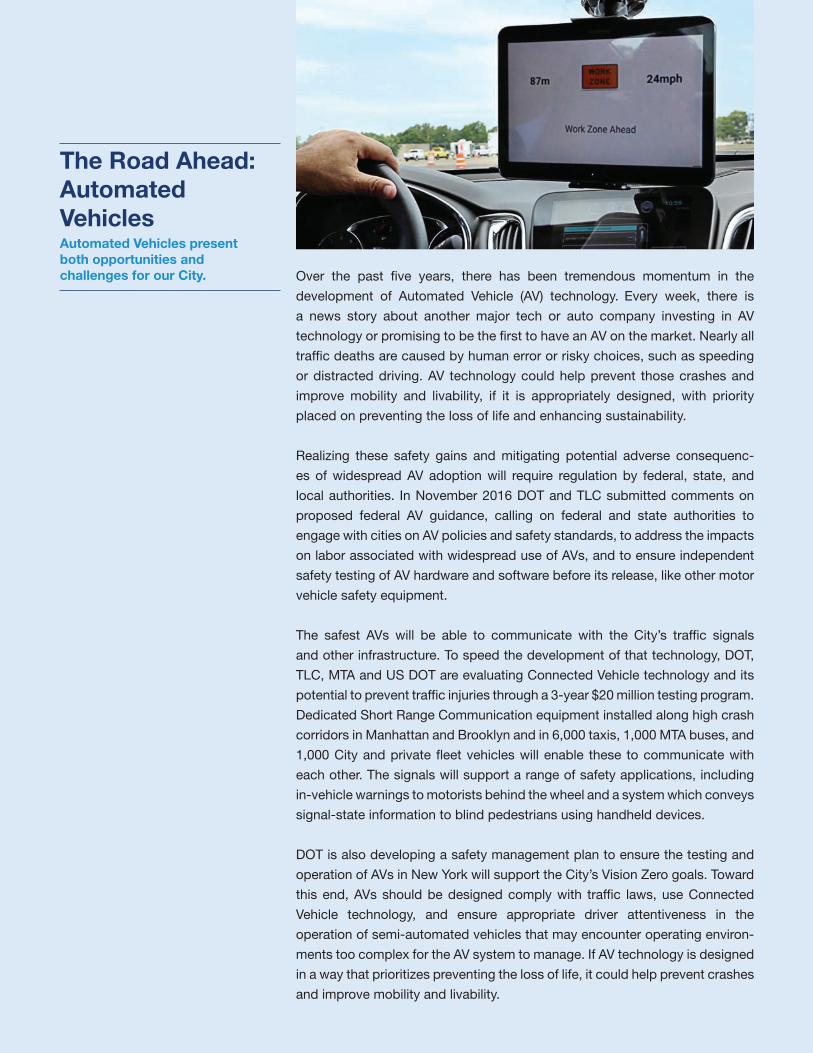
VISION ZERO YEAR THREE REPORT 57
The Road Ahead: Automated Vehicles
Over the past five years, there has been tremendous momentum in the
development of Automated Vehicle (AV) technology. Every week, there is
a news story about another major tech or auto company investing in AV
technology or promising to be the first to have an AV on the market. Nearly all
traffic deaths are caused by human error or risky choices, such as speeding
or distracted driving. AV technology could help prevent those crashes and
improve mobility and livability, if it is appropriately designed, with priority
placed on preventing the loss of life and enhancing sustainability.
Realizing these safety gains and mitigating potential adverse consequenc-
es of widespread AV adoption will require regulation by federal, state, and
local authorities. In November 2016 DOT and TLC submitted comments on
proposed federal AV guidance, calling on federal and state authorities to
engage with cities on AV policies and safety standards, to address the impacts
on labor associated with widespread use of AVs, and to ensure independent
safety testing of AV hardware and software before its release, like other motor
vehicle safety equipment.
The safest AVs will be able to communicate with the City’s traffic signals
and other infrastructure. To speed the development of that technology, DOT,
TLC, MTA and US DOT are evaluating Connected Vehicle technology and its
potential to prevent traffic injuries through a 3-year $20 million testing program.
Dedicated Short Range Communication equipment installed along high crash
corridors in Manhattan and Brooklyn and in 6,000 taxis, 1,000 MTA buses, and
1,000 City and private fleet vehicles will enable these to communicate with
each other. The signals will support a range of safety applications, including
in-vehicle warnings to motorists behind the wheel and a system which conveys
signal-state information to blind pedestrians using handheld devices.
DOT is also developing a safety management plan to ensure the testing and
operation of AVs in New York will support the City’s Vision Zero goals. Toward
this end, AVs should be designed comply with traffic laws, use Connected
Vehicle technology, and ensure appropriate driver attentiveness in the
operation of semi-automated vehicles that may encounter operating environ-
ments too complex for the AV system to manage. If AV technology is designed
in a way that prioritizes preventing the loss of life, it could help prevent crashes
and improve mobility and livability.
Automated Vehicles present both opportunities and challenges for our City.
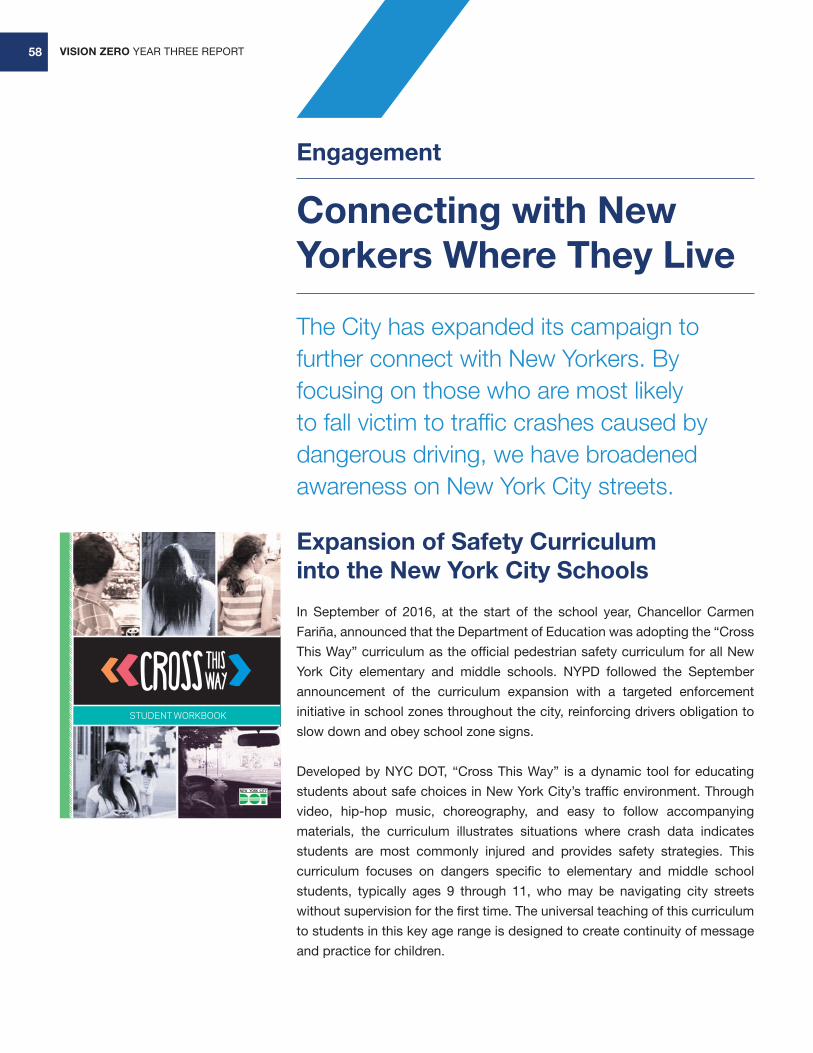
VISION ZERO YEAR THREE REPORT58
Engagement
Connecting with New Yorkers Where They Live
The City has expanded its campaign to further connect with New Yorkers. By focusing on those who are most likely to fall victim to traffic crashes caused by dangerous driving, we have broadened awareness on New York City streets.
Expansion of Safety Curriculum into the New York City Schools
In September of 2016, at the start of the school year, Chancellor Carmen
Fariña, announced that the Department of Education was adopting the “Cross
This Way” curriculum as the official pedestrian safety curriculum for all New
York City elementary and middle schools. NYPD followed the September
announcement of the curriculum expansion with a targeted enforcement
initiative in school zones throughout the city, reinforcing drivers obligation to
slow down and obey school zone signs.
Developed by NYC DOT, “Cross This Way” is a dynamic tool for educating
students about safe choices in New York City’s traffic environment. Through
video, hip-hop music, choreography, and easy to follow accompanying
materials, the curriculum illustrates situations where crash data indicates
students are most commonly injured and provides safety strategies. This
curriculum focuses on dangers specific to elementary and middle school
students, typically ages 9 through 11, who may be navigating city streets
without supervision for the first time. The universal teaching of this curriculum
to students in this key age range is designed to create continuity of message
and practice for children.
STUDENT WORKBOOK
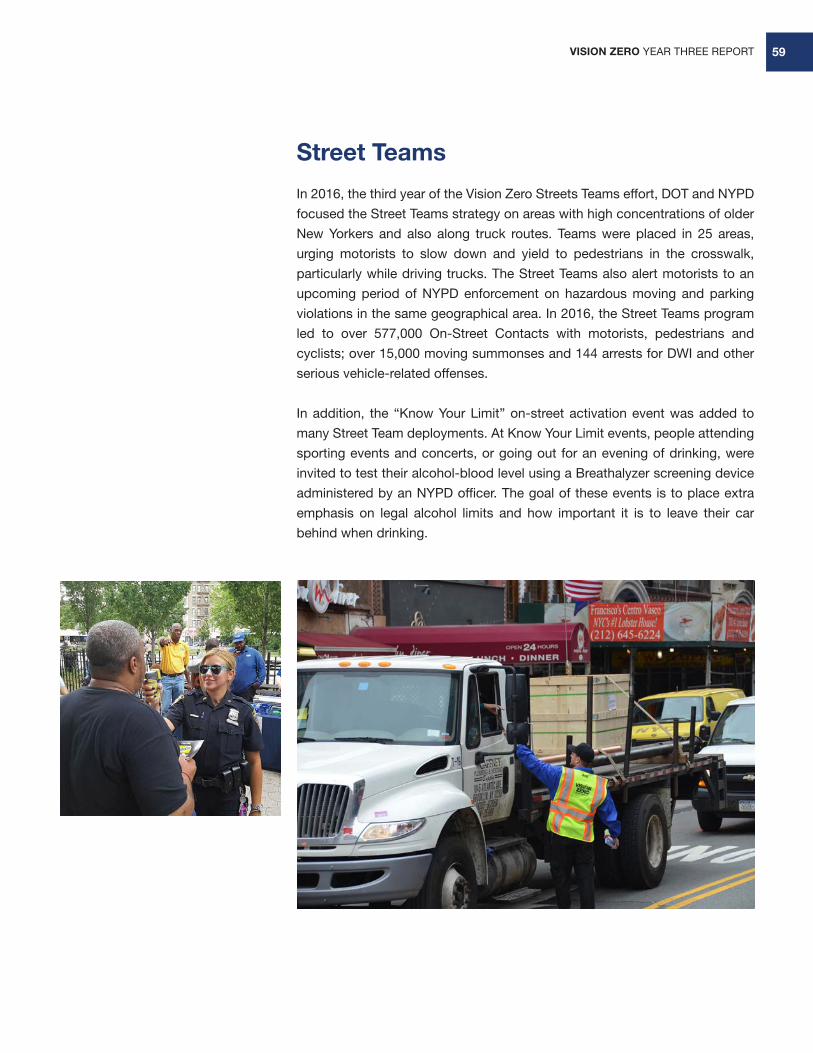
VISION ZERO YEAR THREE REPORT 59
Street Teams
In 2016, the third year of the Vision Zero Streets Teams effort, DOT and NYPD
focused the Street Teams strategy on areas with high concentrations of older
New Yorkers and also along truck routes. Teams were placed in 25 areas,
urging motorists to slow down and yield to pedestrians in the crosswalk,
particularly while driving trucks. The Street Teams also alert motorists to an
upcoming period of NYPD enforcement on hazardous moving and parking
violations in the same geographical area. In 2016, the Street Teams program
led to over 577,000 On-Street Contacts with motorists, pedestrians and
cyclists; over 15,000 moving summonses and 144 arrests for DWI and other
serious vehicle-related offenses.
In addition, the “Know Your Limit” on-street activation event was added to
many Street Team deployments. At Know Your Limit events, people attending
sporting events and concerts, or going out for an evening of drinking, were
invited to test their alcohol-blood level using a Breathalyzer screening device
administered by an NYPD officer. The goal of these events is to place extra
emphasis on legal alcohol limits and how important it is to leave their car
behind when drinking.
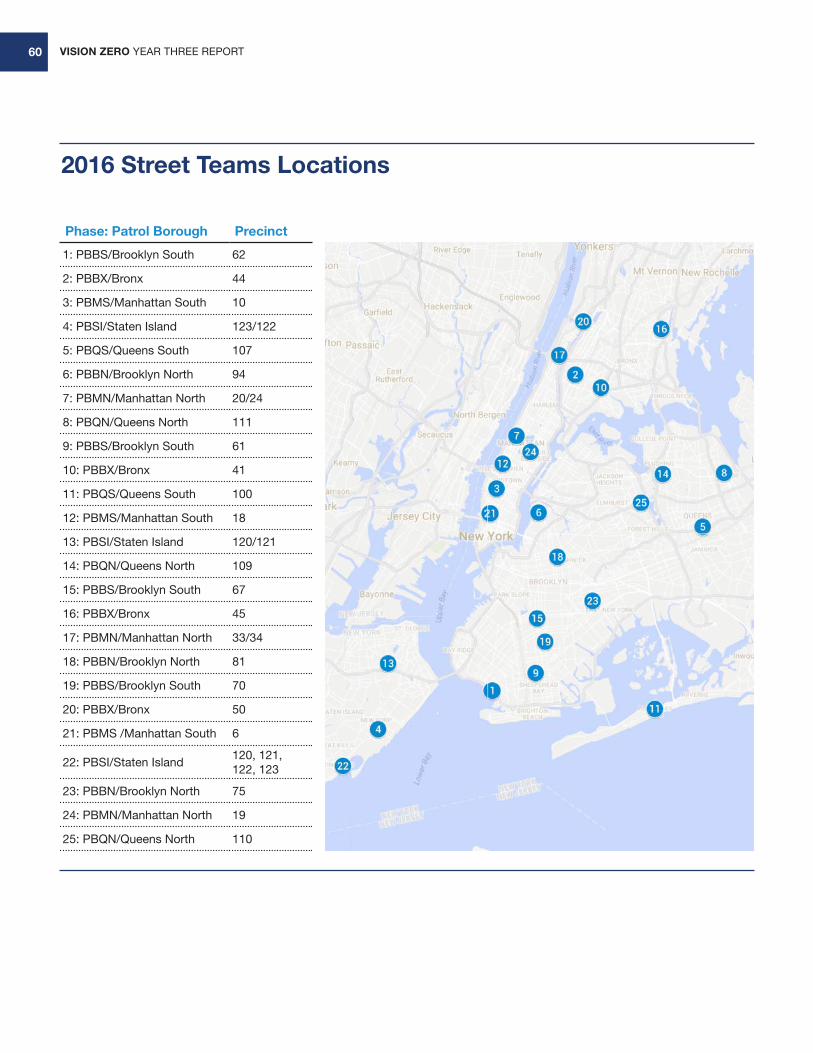
VISION ZERO YEAR THREE REPORT60
2016 Street Teams Locations
Phase: Patrol Borough Precinct
1: PBBS/Brooklyn South 62
2: PBBX/Bronx 44
3: PBMS/Manhattan South 10
4: PBSI/Staten Island 123/122
5: PBQS/Queens South 107
6: PBBN/Brooklyn North 94
7: PBMN/Manhattan North 20/24
8: PBQN/Queens North 111
9: PBBS/Brooklyn South 61
10: PBBX/Bronx 41
11: PBQS/Queens South 100
12: PBMS/Manhattan South 18
13: PBSI/Staten Island 120/121
14: PBQN/Queens North 109
15: PBBS/Brooklyn South 67
16: PBBX/Bronx 45
17: PBMN/Manhattan North 33/34
18: PBBN/Brooklyn North 81
19: PBBS/Brooklyn South 70
20: PBBX/Bronx 50
21: PBMS /Manhattan South 6
22: PBSI/Staten Island120, 121, 122, 123
23: PBBN/Brooklyn North 75
24: PBMN/Manhattan North 19
25: PBQN/Queens North 110
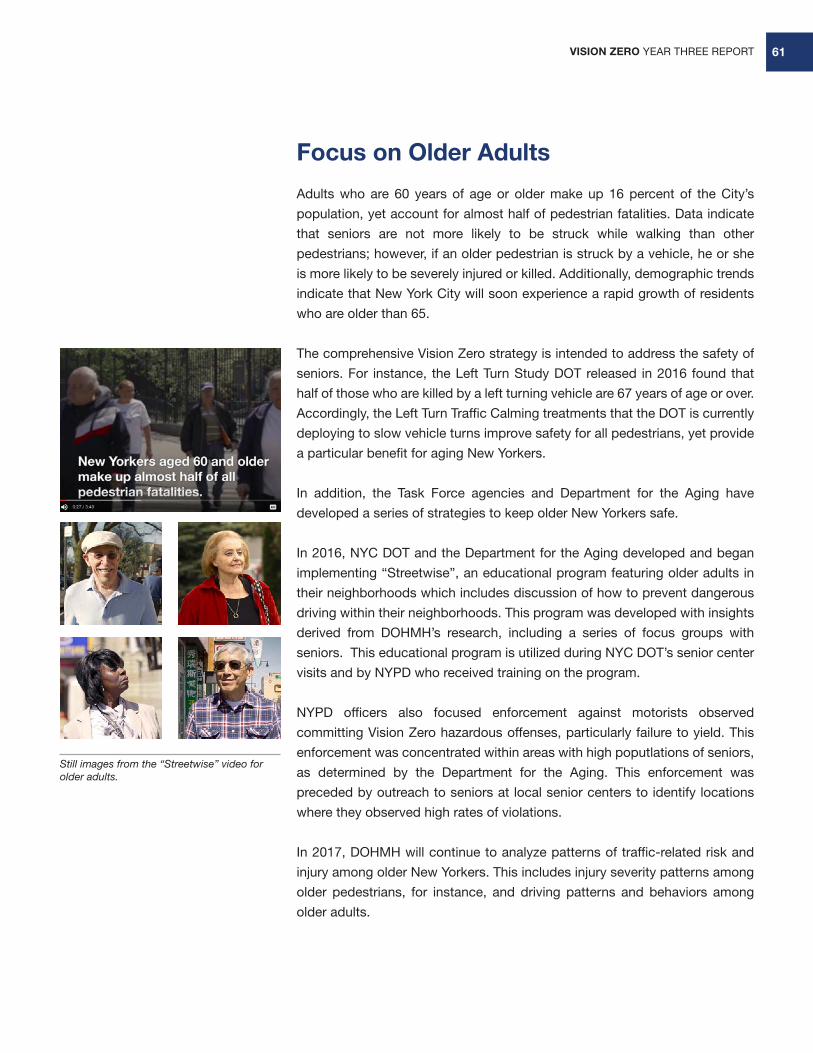
VISION ZERO YEAR THREE REPORT 61
Focus on Older Adults
Adults who are 60 years of age or older make up 16 percent of the City’s
population, yet account for almost half of pedestrian fatalities. Data indicate
that seniors are not more likely to be struck while walking than other
pedestrians; however, if an older pedestrian is struck by a vehicle, he or she
is more likely to be severely injured or killed. Additionally, demographic trends
indicate that New York City will soon experience a rapid growth of residents
who are older than 65.
The comprehensive Vision Zero strategy is intended to address the safety of
seniors. For instance, the Left Turn Study DOT released in 2016 found that
half of those who are killed by a left turning vehicle are 67 years of age or over.
Accordingly, the Left Turn Traffic Calming treatments that the DOT is currently
deploying to slow vehicle turns improve safety for all pedestrians, yet provide
a particular benefit for aging New Yorkers.
In addition, the Task Force agencies and Department for the Aging have
developed a series of strategies to keep older New Yorkers safe.
In 2016, NYC DOT and the Department for the Aging developed and began
implementing “Streetwise”, an educational program featuring older adults in
their neighborhoods which includes discussion of how to prevent dangerous
driving within their neighborhoods. This program was developed with insights
derived from DOHMH’s research, including a series of focus groups with
seniors. This educational program is utilized during NYC DOT’s senior center
visits and by NYPD who received training on the program.
NYPD officers also focused enforcement against motorists observed
committing Vision Zero hazardous offenses, particularly failure to yield. This
enforcement was concentrated within areas with high poputlations of seniors,
as determined by the Department for the Aging. This enforcement was
preceded by outreach to seniors at local senior centers to identify locations
where they observed high rates of violations.
In 2017, DOHMH will continue to analyze patterns of traffic-related risk and
injury among older New Yorkers. This includes injury severity patterns among
older pedestrians, for instance, and driving patterns and behaviors among
older adults.
Still images from the “Streetwise” video for older adults.
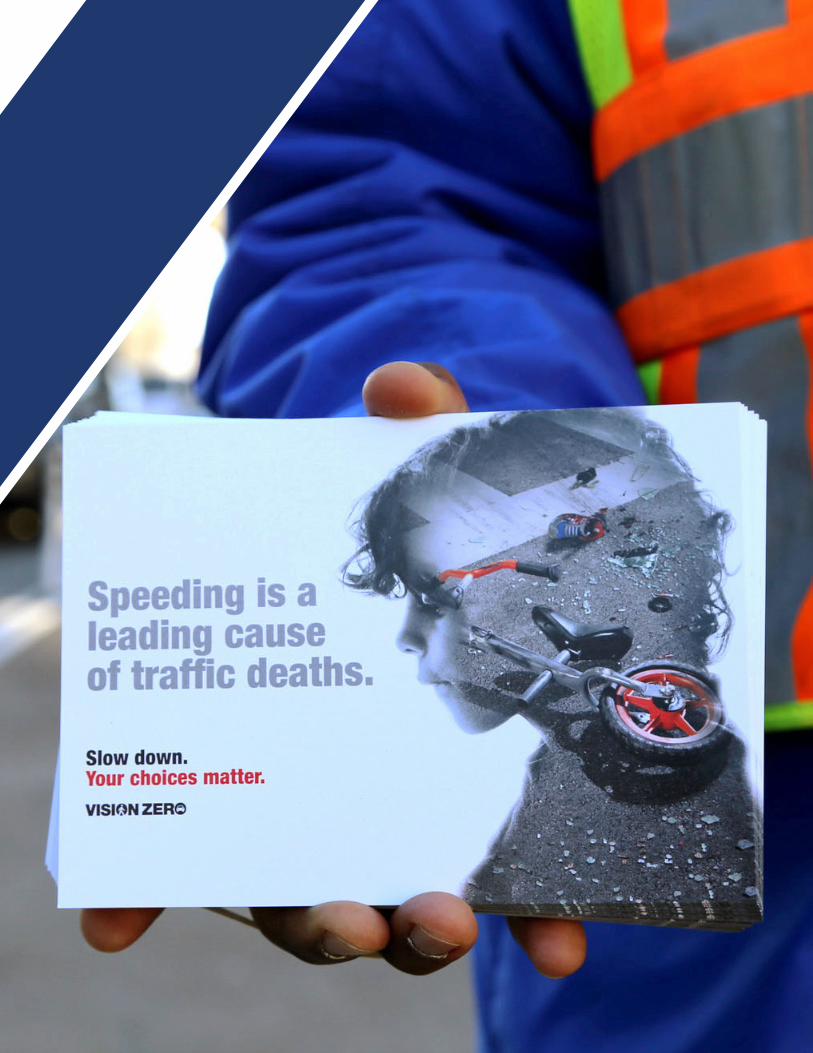
VISION ZERO YEAR THREE REPORT62
VISION ZERO YEAR THREE REPORT 63
Media Campaign
Your Choices Matter
As part of the 2016 Dusk Initiative, the City committed to an aggressive com-
munications push utilizing media. The award-winning Your Choices Matter
campaign was refreshed to feature silhouettes framing crash scenes. These
ads depict the severe consequences of crashes and educate drivers by in-
corporating speeding, turning, and visibility facts into the headlines. Each ad
features a specific action—and the tagline reminds drivers that the choices
they make behind the wheel can save lives.
The Fall 2016 campaign media plan included 28 billboards, over 1,400 bus
tails, and 37 gas stations—locations that were identified by aggregating
crash data, speeding violation data, and and survey-based dangerous driving
behavior by neighborhood. Vision Zero digital ads achieved over five million
views, delivered directly to New Yorkers based on geographic, demographic,
and behavioral targeting.
According to a DOT poll, the Your Choices Matter campaign is proving
successful at changing attitudes. 76 percent of New Yorkers are aware
of Vision Zero. Drivers agreed that these ads lead them to expect more
enforcement (75 percent), drive carefully and yield to pedestrians when turning
and approaching crosswalks (82 percent), and avoid texting or making calls
while driving (84 percent).
Just One More Drink Can Hurt
DOHMH highlighted the related risks of excessive alcohol consumption and
traffic safety by co-branding its 2016 release of the Just One More Drink Can
Hurt Campaign with Vision Zero and featuring the image of a car about to
strike a bicyclist. The purpose of the campaign was to remind New Yorkers
about the risks of excessive alcohol drinking, which can contribute to traffic
injuries and deaths, among other preventable injuries and illnesses.
76% of New Yorkers were aware of the Vision Zero initiative, due in part to ads placed on 28 billboards, over 1,400 buses, and at 37 gas stations.
VISION ZERO YEAR THREE REPORT64
DOHMH Bicycling Engagement
DOHMH supported the coordination, activation, and evaluation of Boogie on
the Boulevard in partnership with DOT, the Bronx Museum of the Arts, Bronx
Health REACH, Transportation Alternatives, Bronx Works, and Montefiore
Health System. 5,217 people attended Weekend Walks which were held once
a month from August to May. In addition, 55 bicycles were distributed to
children and adults through a partnership with Recycle-A-Bicycle.
As part of the Better Bike Share Partnership, led by Bedford-Stuyvesant
Restoration Corporation, DOHMH partnered with Interfaith Medical Center to
create the Prescribe-a-Bike Program. After attending an orientation and being
cleared by their doctors, over 40 providers and patients received free annual
Citi Bike memberships and helmets.
As part of Citi Bike for Youth, DOHMH piloted a Citi Bike to School program.
Eight high school students completed an all day bike safety class, received an
annual free Citi Bike membership, and will serve as “Citi Bike Champions” to
recruit additional students in Spring 2017.
DCAS Partnering with Private Fleets
DCAS held its third Vision Zero Safety Forum on November 29th. The forum
was an opportunity for private and public fleets to meet with each other and
for industry experts to seek common approaches to improving safety. The
program included numerous presentations by the private sector, public sector,
non-profits, and academia on the topic of vehicle safety. The event also
included an interactive discussion with the audience, speakers and vendors
in vehicle safety.
The event serves as a fantastic opportunity for participants to learn best
practices from various industries. NYC Fleet has adopted safety ideas from
non-public sector fleets, while many organizations are also following the lead
of NYC Fleet, for example, by adopting truck side guards.
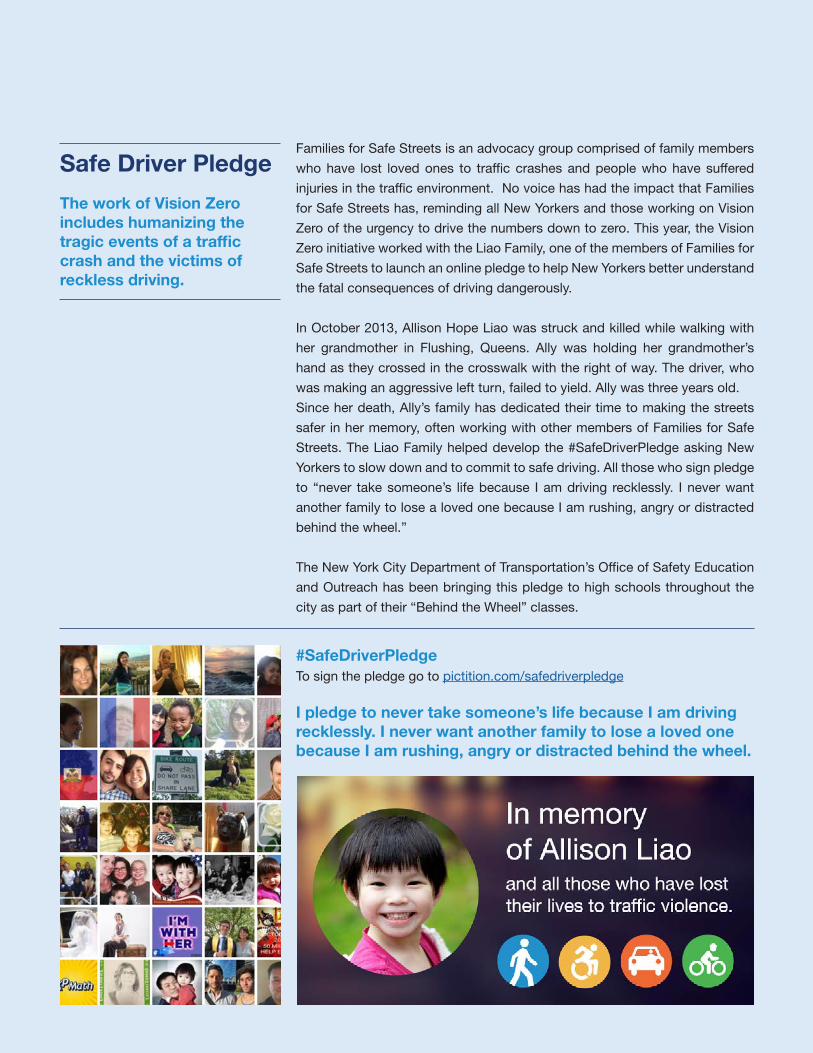
VISION ZERO YEAR THREE REPORT 65
Safe Driver Pledge
The work of Vision Zero includes humanizing the tragic events of a traffic crash and the victims of reckless driving.
Families for Safe Streets is an advocacy group comprised of family members
who have lost loved ones to traffic crashes and people who have suffered
injuries in the traffic environment. No voice has had the impact that Families
for Safe Streets has, reminding all New Yorkers and those working on Vision
Zero of the urgency to drive the numbers down to zero. This year, the Vision
Zero initiative worked with the Liao Family, one of the members of Families for
Safe Streets to launch an online pledge to help New Yorkers better understand
the fatal consequences of driving dangerously.
In October 2013, Allison Hope Liao was struck and killed while walking with
her grandmother in Flushing, Queens. Ally was holding her grandmother’s
hand as they crossed in the crosswalk with the right of way. The driver, who
was making an aggressive left turn, failed to yield. Ally was three years old.
Since her death, Ally’s family has dedicated their time to making the streets
safer in her memory, often working with other members of Families for Safe
Streets. The Liao Family helped develop the #SafeDriverPledge asking New
Yorkers to slow down and to commit to safe driving. All those who sign pledge
to “never take someone’s life because I am driving recklessly. I never want
another family to lose a loved one because I am rushing, angry or distracted
behind the wheel.”
The New York City Department of Transportation’s Office of Safety Education
and Outreach has been bringing this pledge to high schools throughout the
city as part of their “Behind the Wheel” classes.
#SafeDriverPledgeTo sign the pledge go to pictition.com/safedriverpledge
I pledge to never take someone’s life because I am driving recklessly. I never want another family to lose a loved one because I am rushing, angry or distracted behind the wheel.
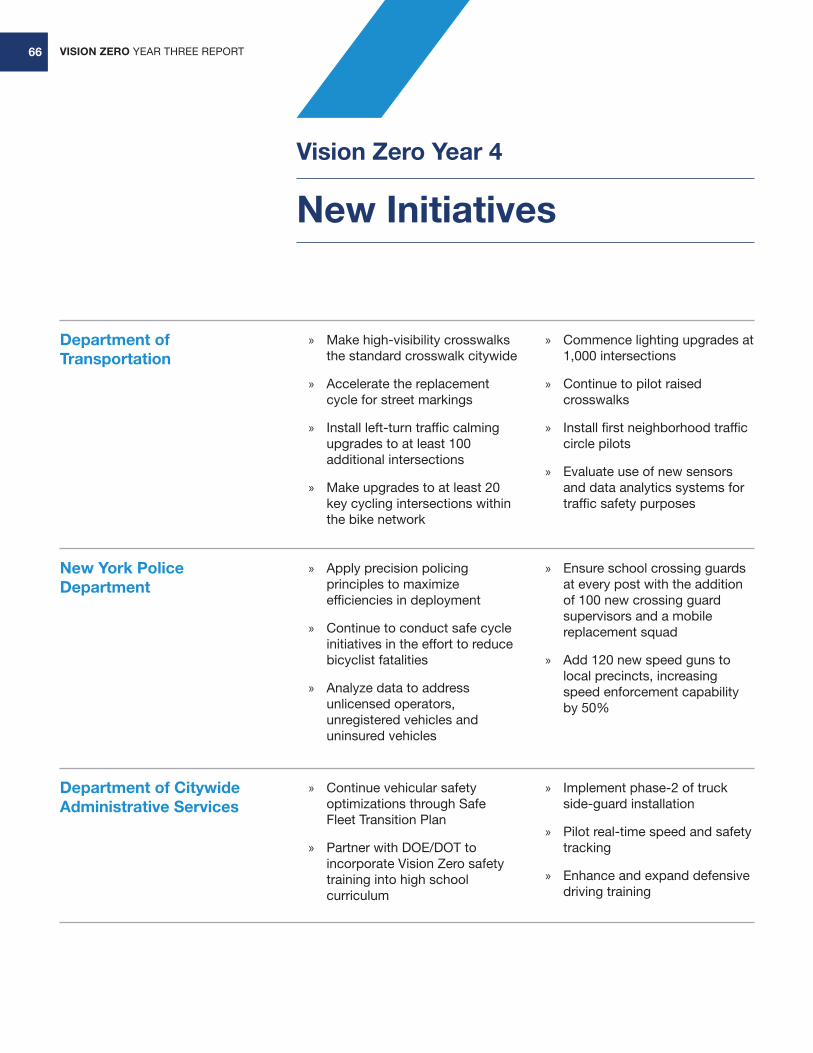
VISION ZERO YEAR THREE REPORT66
Vision Zero Year 4
New Initiatives
Department of Transportation
New York Police Department
Department of Citywide Administrative Services
» Make high-visibility crosswalks the standard crosswalk citywide
» Accelerate the replacement cycle for street markings
» Install left-turn traffic calming upgrades to at least 100 additional intersections
» Make upgrades to at least 20 key cycling intersections within the bike network
» Commence lighting upgrades at 1,000 intersections
» Continue to pilot raised crosswalks
» Install first neighborhood traffic circle pilots
» Evaluate use of new sensors and data analytics systems for traffic safety purposes
» Apply precision policing principles to maximize efficiencies in deployment
» Continue to conduct safe cycle initiatives in the effort to reduce bicyclist fatalities
» Analyze data to address unlicensed operators, unregistered vehicles and uninsured vehicles
» Ensure school crossing guards at every post with the addition of 100 new crossing guard supervisors and a mobile replacement squad
» Add 120 new speed guns to local precincts, increasing speed enforcement capability by 50%
» Continue vehicular safety optimizations through Safe Fleet Transition Plan
» Partner with DOE/DOT to incorporate Vision Zero safety training into high school curriculum
» Implement phase-2 of truck side-guard installation
» Pilot real-time speed and safety tracking
» Enhance and expand defensive driving training
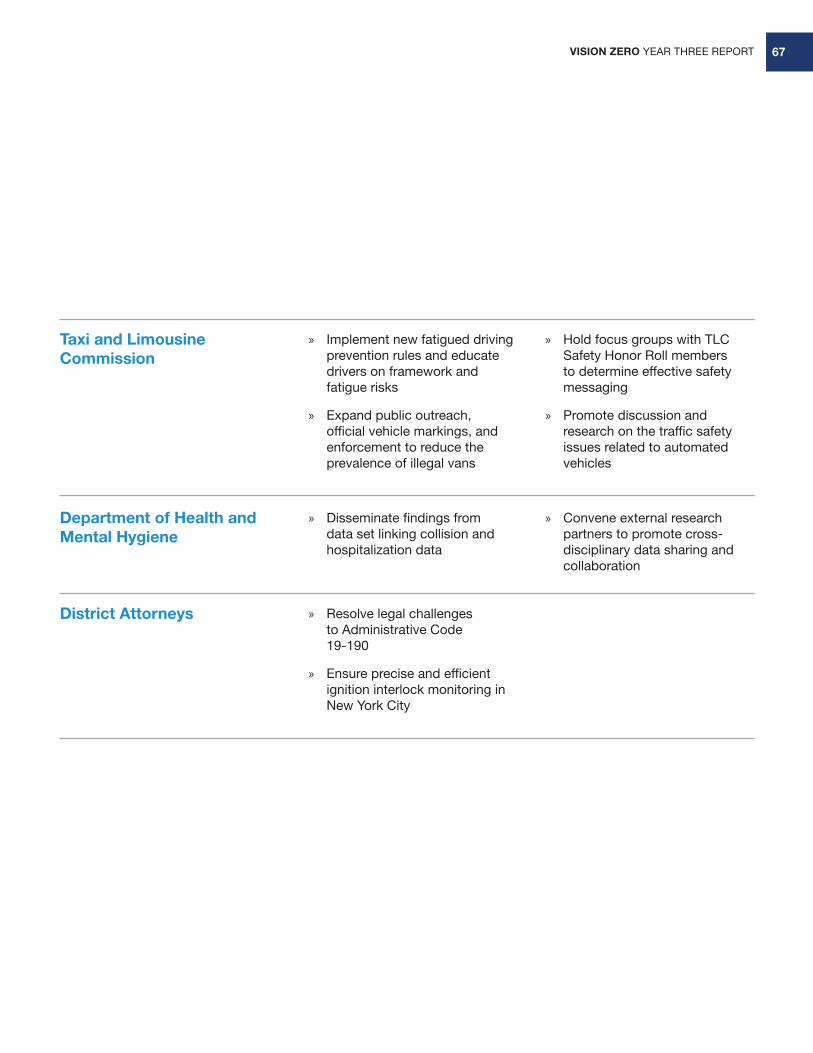
VISION ZERO YEAR THREE REPORT 67
Taxi and Limousine Commission
Department of Health and Mental Hygiene
District Attorneys
» Implement new fatigued driving prevention rules and educate drivers on framework and fatigue risks
» Expand public outreach, official vehicle markings, and enforcement to reduce the prevalence of illegal vans
» Hold focus groups with TLC Safety Honor Roll members to determine effective safety messaging
» Promote discussion and research on the traffic safety issues related to automated vehicles
» Disseminate findings from data set linking collision and hospitalization data
» Convene external research partners to promote cross-disciplinary data sharing and collaboration
» Resolve legal challenges to Administrative Code 19-190
» Ensure precise and efficient ignition interlock monitoring in New York City

VISION ZERO YEAR THREE REPORT68
Appendix
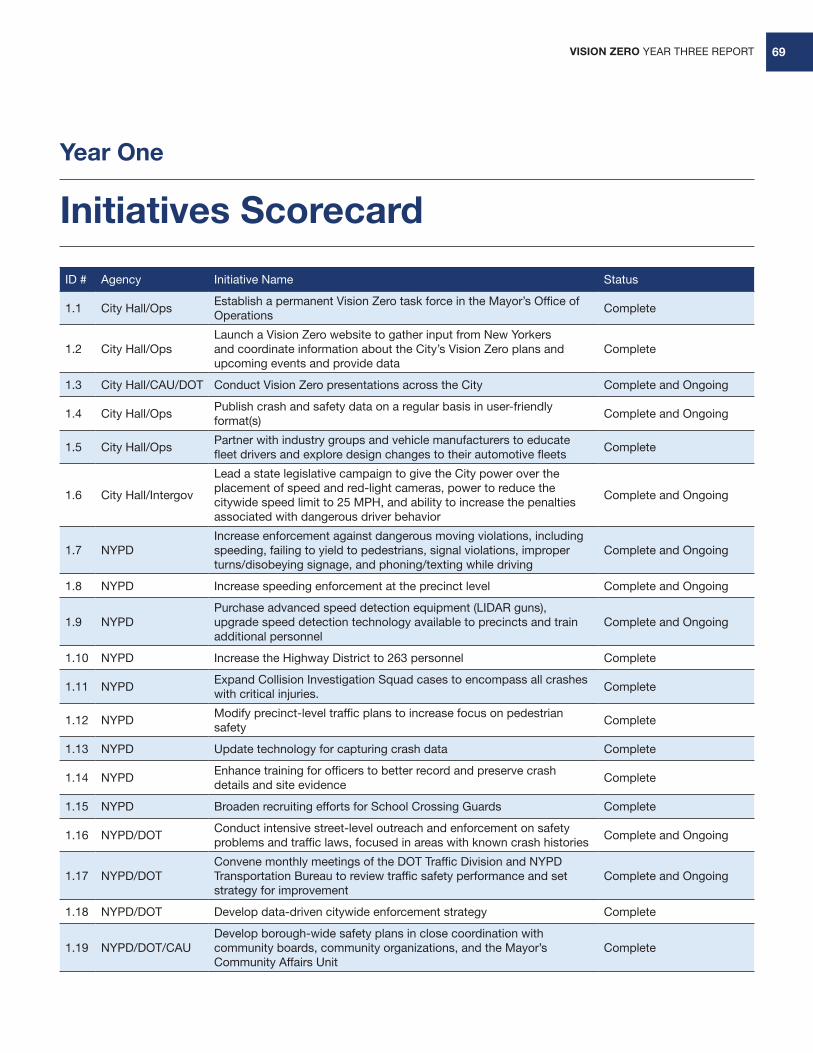
VISION ZERO YEAR THREE REPORT 69
Year One
Initiatives Scorecard
ID # Agency Initiative Name Status
1.1 City Hall/OpsEstablish a permanent Vision Zero task force in the Mayor’s Office of Operations
Complete
1.2 City Hall/OpsLaunch a Vision Zero website to gather input from New Yorkers and coordinate information about the City’s Vision Zero plans and upcoming events and provide data
Complete
1.3 City Hall/CAU/DOT Conduct Vision Zero presentations across the City Complete and Ongoing
1.4 City Hall/OpsPublish crash and safety data on a regular basis in user-friendly format(s)
Complete and Ongoing
1.5 City Hall/OpsPartner with industry groups and vehicle manufacturers to educate fleet drivers and explore design changes to their automotive fleets
Complete
1.6 City Hall/Intergov
Lead a state legislative campaign to give the City power over the placement of speed and red-light cameras, power to reduce the citywide speed limit to 25 MPH, and ability to increase the penalties associated with dangerous driver behavior
Complete and Ongoing
1.7 NYPDIncrease enforcement against dangerous moving violations, including speeding, failing to yield to pedestrians, signal violations, improper turns/disobeying signage, and phoning/texting while driving
Complete and Ongoing
1.8 NYPD Increase speeding enforcement at the precinct level Complete and Ongoing
1.9 NYPDPurchase advanced speed detection equipment (LIDAR guns), upgrade speed detection technology available to precincts and train additional personnel
Complete and Ongoing
1.10 NYPD Increase the Highway District to 263 personnel Complete
1.11 NYPDExpand Collision Investigation Squad cases to encompass all crashes with critical injuries.
Complete
1.12 NYPDModify precinct-level traffic plans to increase focus on pedestrian safety
Complete
1.13 NYPD Update technology for capturing crash data Complete
1.14 NYPDEnhance training for officers to better record and preserve crash details and site evidence
Complete
1.15 NYPD Broaden recruiting efforts for School Crossing Guards Complete
1.16 NYPD/DOTConduct intensive street-level outreach and enforcement on safety problems and traffic laws, focused in areas with known crash histories
Complete and Ongoing
1.17 NYPD/DOTConvene monthly meetings of the DOT Traffic Division and NYPD Transportation Bureau to review traffic safety performance and set strategy for improvement
Complete and Ongoing
1.18 NYPD/DOT Develop data-driven citywide enforcement strategy Complete
1.19 NYPD/DOT/CAUDevelop borough-wide safety plans in close coordination with community boards, community organizations, and the Mayor’s Community Affairs Unit
Complete
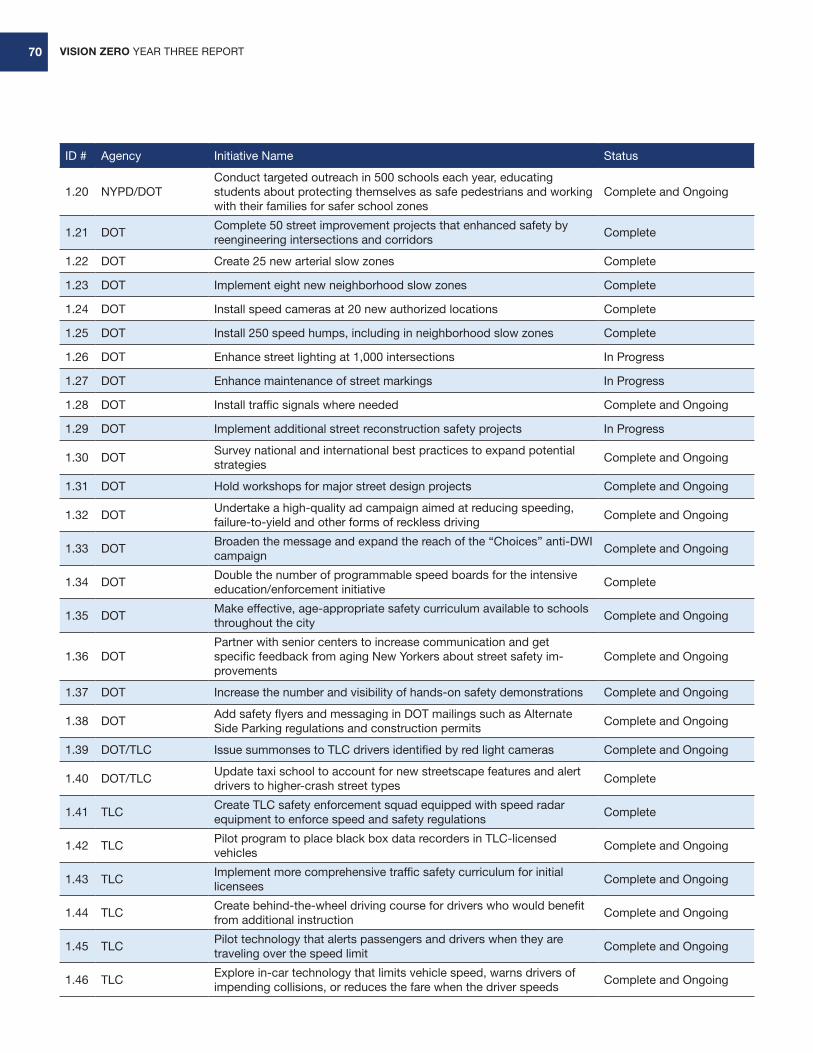
VISION ZERO YEAR THREE REPORT70
ID # Agency Initiative Name Status
1.20 NYPD/DOTConduct targeted outreach in 500 schools each year, educating students about protecting themselves as safe pedestrians and working with their families for safer school zones
Complete and Ongoing
1.21 DOTComplete 50 street improvement projects that enhanced safety by reengineering intersections and corridors
Complete
1.22 DOT Create 25 new arterial slow zones Complete
1.23 DOT Implement eight new neighborhood slow zones Complete
1.24 DOT Install speed cameras at 20 new authorized locations Complete
1.25 DOT Install 250 speed humps, including in neighborhood slow zones Complete
1.26 DOT Enhance street lighting at 1,000 intersections In Progress
1.27 DOT Enhance maintenance of street markings In Progress
1.28 DOT Install traffic signals where needed Complete and Ongoing
1.29 DOT Implement additional street reconstruction safety projects In Progress
1.30 DOTSurvey national and international best practices to expand potential strategies
Complete and Ongoing
1.31 DOT Hold workshops for major street design projects Complete and Ongoing
1.32 DOTUndertake a high-quality ad campaign aimed at reducing speeding, failure-to-yield and other forms of reckless driving
Complete and Ongoing
1.33 DOTBroaden the message and expand the reach of the “Choices” anti-DWI campaign
Complete and Ongoing
1.34 DOTDouble the number of programmable speed boards for the intensive education/enforcement initiative
Complete
1.35 DOTMake effective, age-appropriate safety curriculum available to schools throughout the city
Complete and Ongoing
1.36 DOTPartner with senior centers to increase communication and get specific feedback from aging New Yorkers about street safety im-provements
Complete and Ongoing
1.37 DOT Increase the number and visibility of hands-on safety demonstrations Complete and Ongoing
1.38 DOTAdd safety flyers and messaging in DOT mailings such as Alternate Side Parking regulations and construction permits
Complete and Ongoing
1.39 DOT/TLC Issue summonses to TLC drivers identified by red light cameras Complete and Ongoing
1.40 DOT/TLCUpdate taxi school to account for new streetscape features and alert drivers to higher-crash street types
Complete
1.41 TLCCreate TLC safety enforcement squad equipped with speed radar equipment to enforce speed and safety regulations
Complete
1.42 TLCPilot program to place black box data recorders in TLC-licensed vehicles
Complete and Ongoing
1.43 TLCImplement more comprehensive traffic safety curriculum for initial licensees
Complete and Ongoing
1.44 TLCCreate behind-the-wheel driving course for drivers who would benefit from additional instruction
Complete and Ongoing
1.45 TLCPilot technology that alerts passengers and drivers when they are traveling over the speed limit
Complete and Ongoing
1.46 TLCExplore in-car technology that limits vehicle speed, warns drivers of impending collisions, or reduces the fare when the driver speeds
Complete and Ongoing
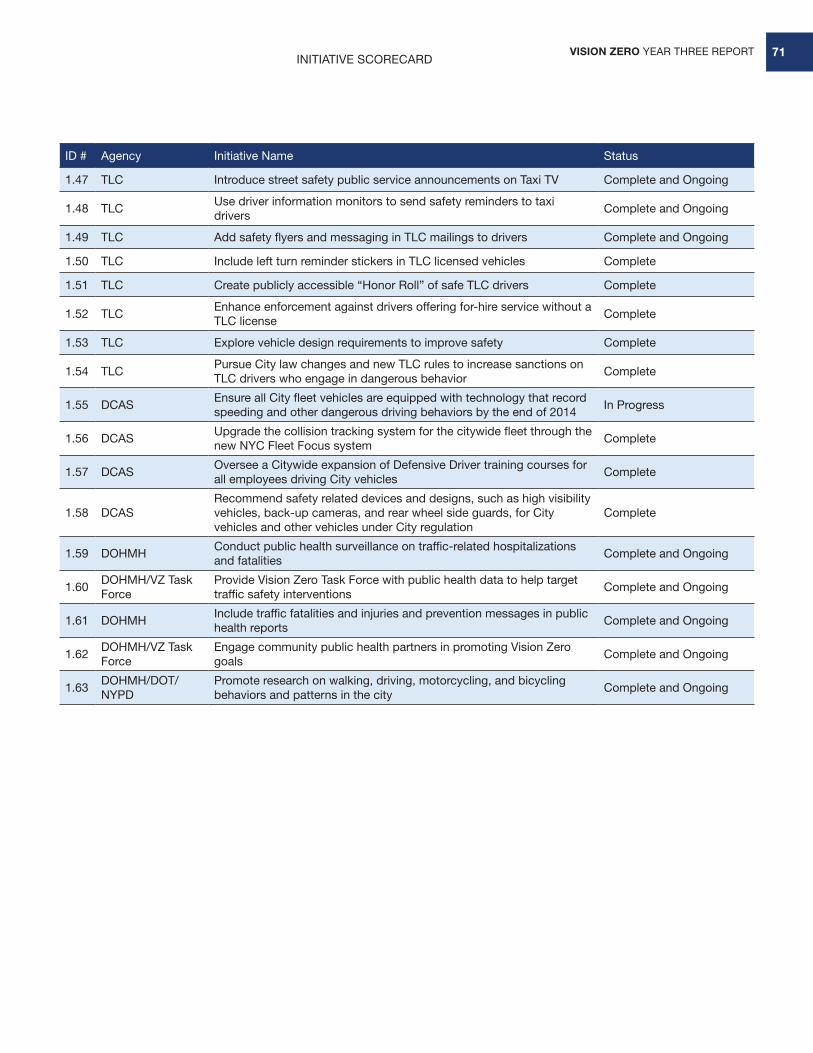
VISION ZERO YEAR THREE REPORT 71INITIATIVE SCORECARD
ID # Agency Initiative Name Status
1.47 TLC Introduce street safety public service announcements on Taxi TV Complete and Ongoing
1.48 TLCUse driver information monitors to send safety reminders to taxi drivers
Complete and Ongoing
1.49 TLC Add safety flyers and messaging in TLC mailings to drivers Complete and Ongoing
1.50 TLC Include left turn reminder stickers in TLC licensed vehicles Complete
1.51 TLC Create publicly accessible “Honor Roll” of safe TLC drivers Complete
1.52 TLCEnhance enforcement against drivers offering for-hire service without a TLC license
Complete
1.53 TLC Explore vehicle design requirements to improve safety Complete
1.54 TLCPursue City law changes and new TLC rules to increase sanctions on TLC drivers who engage in dangerous behavior
Complete
1.55 DCASEnsure all City fleet vehicles are equipped with technology that record speeding and other dangerous driving behaviors by the end of 2014
In Progress
1.56 DCASUpgrade the collision tracking system for the citywide fleet through the new NYC Fleet Focus system
Complete
1.57 DCASOversee a Citywide expansion of Defensive Driver training courses for all employees driving City vehicles
Complete
1.58 DCASRecommend safety related devices and designs, such as high visibility vehicles, back-up cameras, and rear wheel side guards, for City vehicles and other vehicles under City regulation
Complete
1.59 DOHMHConduct public health surveillance on traffic-related hospitalizations and fatalities
Complete and Ongoing
1.60DOHMH/VZ Task Force
Provide Vision Zero Task Force with public health data to help target traffic safety interventions
Complete and Ongoing
1.61 DOHMHInclude traffic fatalities and injuries and prevention messages in public health reports
Complete and Ongoing
1.62DOHMH/VZ Task Force
Engage community public health partners in promoting Vision Zero goals
Complete and Ongoing
1.63DOHMH/DOT/NYPD
Promote research on walking, driving, motorcycling, and bicycling behaviors and patterns in the city
Complete and Ongoing
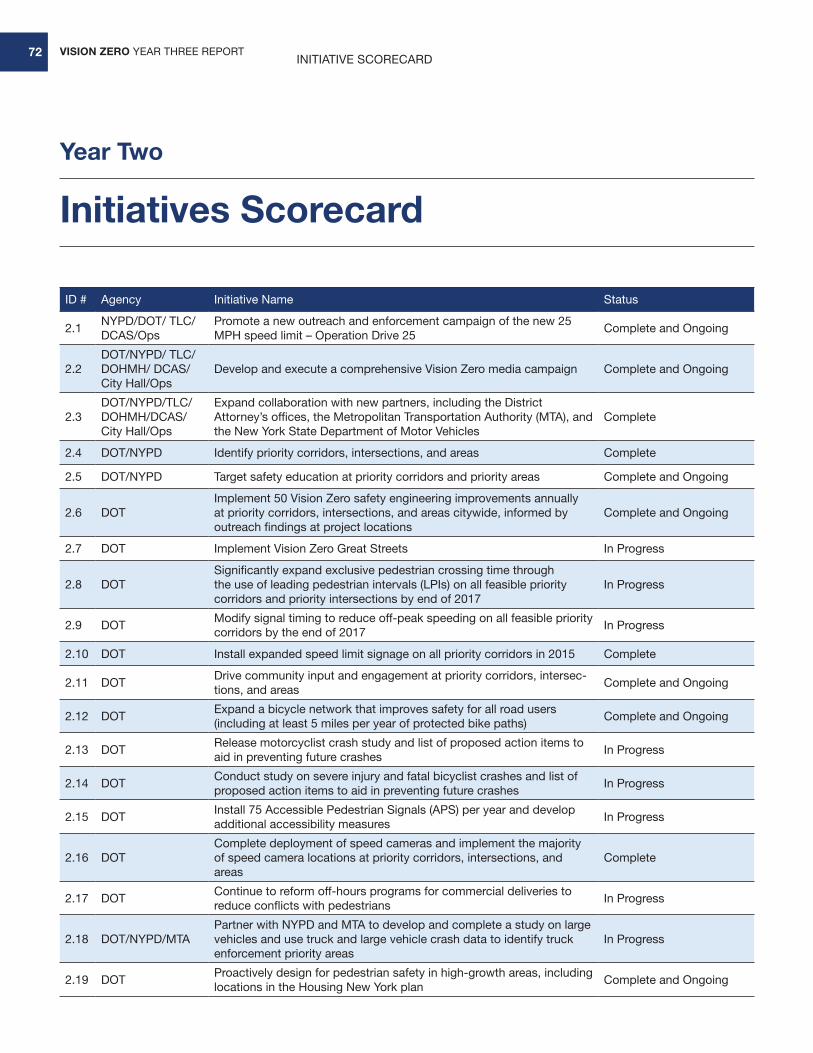
VISION ZERO YEAR THREE REPORT72INITIATIVE SCORECARD
Year Two
Initiatives Scorecard
ID # Agency Initiative Name Status
2.1NYPD/DOT/ TLC/DCAS/Ops
Promote a new outreach and enforcement campaign of the new 25 MPH speed limit – Operation Drive 25
Complete and Ongoing
2.2DOT/NYPD/ TLC/DOHMH/ DCAS/City Hall/Ops
Develop and execute a comprehensive Vision Zero media campaign Complete and Ongoing
2.3DOT/NYPD/TLC/DOHMH/DCAS/City Hall/Ops
Expand collaboration with new partners, including the District Attorney’s offices, the Metropolitan Transportation Authority (MTA), and the New York State Department of Motor Vehicles
Complete
2.4 DOT/NYPD Identify priority corridors, intersections, and areas Complete
2.5 DOT/NYPD Target safety education at priority corridors and priority areas Complete and Ongoing
2.6 DOTImplement 50 Vision Zero safety engineering improvements annually at priority corridors, intersections, and areas citywide, informed by outreach findings at project locations
Complete and Ongoing
2.7 DOT Implement Vision Zero Great Streets In Progress
2.8 DOTSignificantly expand exclusive pedestrian crossing time through the use of leading pedestrian intervals (LPIs) on all feasible priority corridors and priority intersections by end of 2017
In Progress
2.9 DOTModify signal timing to reduce off-peak speeding on all feasible priority corridors by the end of 2017
In Progress
2.10 DOT Install expanded speed limit signage on all priority corridors in 2015 Complete
2.11 DOTDrive community input and engagement at priority corridors, intersec-tions, and areas
Complete and Ongoing
2.12 DOTExpand a bicycle network that improves safety for all road users (including at least 5 miles per year of protected bike paths)
Complete and Ongoing
2.13 DOTRelease motorcyclist crash study and list of proposed action items to aid in preventing future crashes
In Progress
2.14 DOTConduct study on severe injury and fatal bicyclist crashes and list of proposed action items to aid in preventing future crashes
In Progress
2.15 DOTInstall 75 Accessible Pedestrian Signals (APS) per year and develop additional accessibility measures
In Progress
2.16 DOTComplete deployment of speed cameras and implement the majority of speed camera locations at priority corridors, intersections, and areas
Complete
2.17 DOTContinue to reform off-hours programs for commercial deliveries to reduce conflicts with pedestrians
In Progress
2.18 DOT/NYPD/MTAPartner with NYPD and MTA to develop and complete a study on large vehicles and use truck and large vehicle crash data to identify truck enforcement priority areas
In Progress
2.19 DOTProactively design for pedestrian safety in high-growth areas, including locations in the Housing New York plan
Complete and Ongoing
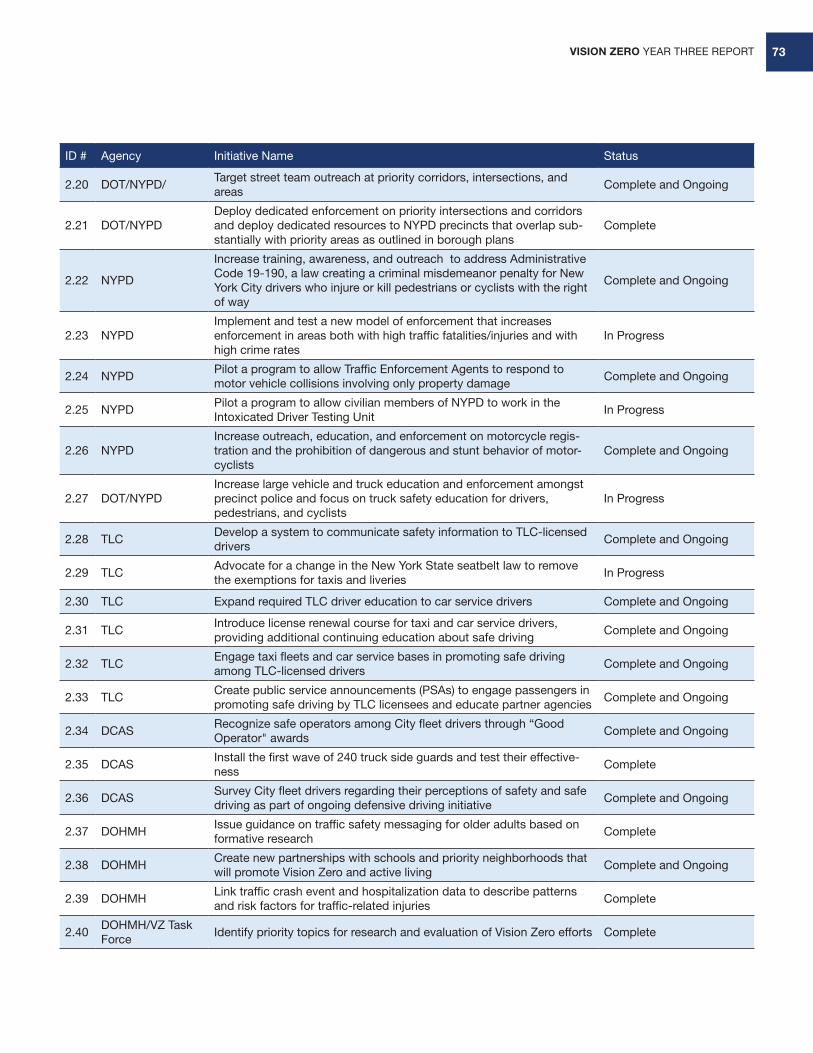
VISION ZERO YEAR THREE REPORT 73
ID # Agency Initiative Name Status
2.20 DOT/NYPD/Target street team outreach at priority corridors, intersections, and areas
Complete and Ongoing
2.21 DOT/NYPDDeploy dedicated enforcement on priority intersections and corridors and deploy dedicated resources to NYPD precincts that overlap sub-stantially with priority areas as outlined in borough plans
Complete
2.22 NYPD
Increase training, awareness, and outreach to address Administrative Code 19-190, a law creating a criminal misdemeanor penalty for New York City drivers who injure or kill pedestrians or cyclists with the right of way
Complete and Ongoing
2.23 NYPDImplement and test a new model of enforcement that increases enforcement in areas both with high traffic fatalities/injuries and with high crime rates
In Progress
2.24 NYPDPilot a program to allow Traffic Enforcement Agents to respond to motor vehicle collisions involving only property damage
Complete and Ongoing
2.25 NYPDPilot a program to allow civilian members of NYPD to work in the Intoxicated Driver Testing Unit
In Progress
2.26 NYPDIncrease outreach, education, and enforcement on motorcycle regis-tration and the prohibition of dangerous and stunt behavior of motor-cyclists
Complete and Ongoing
2.27 DOT/NYPDIncrease large vehicle and truck education and enforcement amongst precinct police and focus on truck safety education for drivers, pedestrians, and cyclists
In Progress
2.28 TLCDevelop a system to communicate safety information to TLC-licensed drivers
Complete and Ongoing
2.29 TLCAdvocate for a change in the New York State seatbelt law to remove the exemptions for taxis and liveries
In Progress
2.30 TLC Expand required TLC driver education to car service drivers Complete and Ongoing
2.31 TLCIntroduce license renewal course for taxi and car service drivers, providing additional continuing education about safe driving
Complete and Ongoing
2.32 TLCEngage taxi fleets and car service bases in promoting safe driving among TLC-licensed drivers
Complete and Ongoing
2.33 TLCCreate public service announcements (PSAs) to engage passengers in promoting safe driving by TLC licensees and educate partner agencies
Complete and Ongoing
2.34 DCASRecognize safe operators among City fleet drivers through “Good Operator" awards
Complete and Ongoing
2.35 DCASInstall the first wave of 240 truck side guards and test their effective-ness
Complete
2.36 DCASSurvey City fleet drivers regarding their perceptions of safety and safe driving as part of ongoing defensive driving initiative
Complete and Ongoing
2.37 DOHMHIssue guidance on traffic safety messaging for older adults based on formative research
Complete
2.38 DOHMHCreate new partnerships with schools and priority neighborhoods that will promote Vision Zero and active living
Complete and Ongoing
2.39 DOHMHLink traffic crash event and hospitalization data to describe patterns and risk factors for traffic-related injuries
Complete
2.40DOHMH/VZ Task Force
Identify priority topics for research and evaluation of Vision Zero efforts Complete
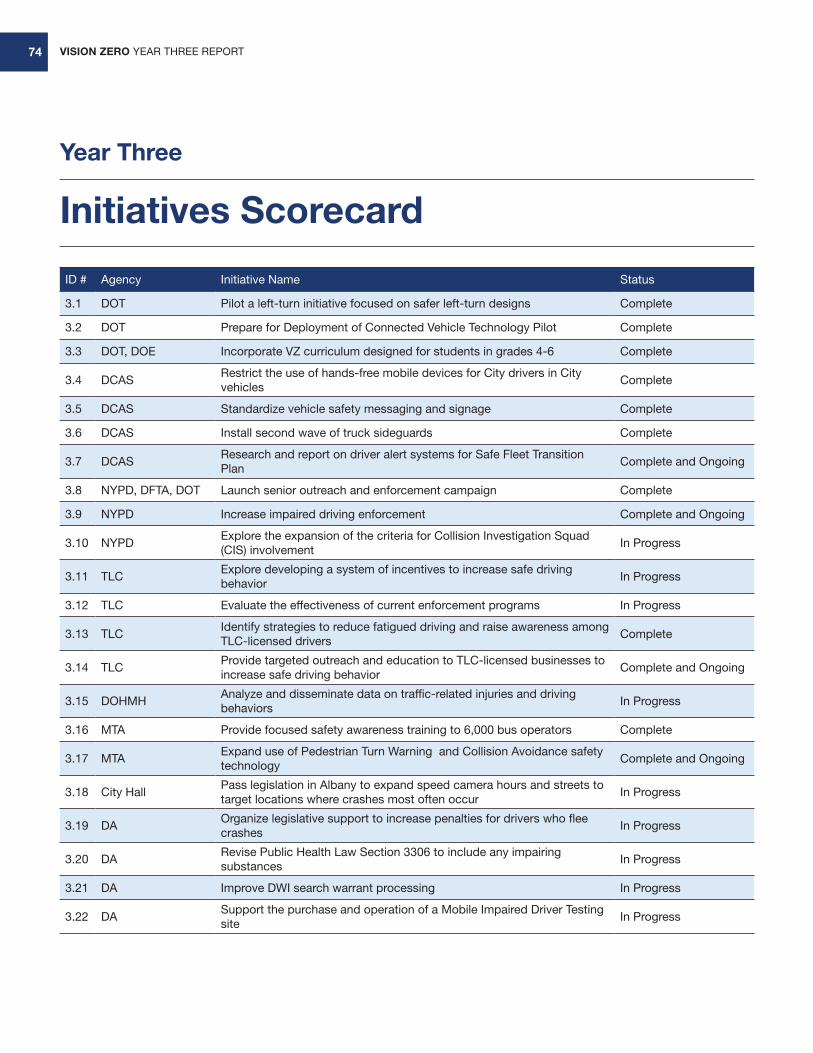
VISION ZERO YEAR THREE REPORT74
Year Three
Initiatives Scorecard
ID # Agency Initiative Name Status
3.1 DOT Pilot a left-turn initiative focused on safer left-turn designs Complete
3.2 DOT Prepare for Deployment of Connected Vehicle Technology Pilot Complete
3.3 DOT, DOE Incorporate VZ curriculum designed for students in grades 4-6 Complete
3.4 DCASRestrict the use of hands-free mobile devices for City drivers in City vehicles
Complete
3.5 DCAS Standardize vehicle safety messaging and signage Complete
3.6 DCAS Install second wave of truck sideguards Complete
3.7 DCASResearch and report on driver alert systems for Safe Fleet Transition Plan
Complete and Ongoing
3.8 NYPD, DFTA, DOT Launch senior outreach and enforcement campaign Complete
3.9 NYPD Increase impaired driving enforcement Complete and Ongoing
3.10 NYPDExplore the expansion of the criteria for Collision Investigation Squad (CIS) involvement
In Progress
3.11 TLCExplore developing a system of incentives to increase safe driving behavior
In Progress
3.12 TLC Evaluate the effectiveness of current enforcement programs In Progress
3.13 TLCIdentify strategies to reduce fatigued driving and raise awareness among TLC-licensed drivers
Complete
3.14 TLCProvide targeted outreach and education to TLC-licensed businesses to increase safe driving behavior
Complete and Ongoing
3.15 DOHMHAnalyze and disseminate data on traffic-related injuries and driving behaviors
In Progress
3.16 MTA Provide focused safety awareness training to 6,000 bus operators Complete
3.17 MTAExpand use of Pedestrian Turn Warning and Collision Avoidance safety technology
Complete and Ongoing
3.18 City HallPass legislation in Albany to expand speed camera hours and streets to target locations where crashes most often occur
In Progress
3.19 DAOrganize legislative support to increase penalties for drivers who flee crashes
In Progress
3.20 DARevise Public Health Law Section 3306 to include any impairing substances
In Progress
3.21 DA Improve DWI search warrant processing In Progress
3.22 DASupport the purchase and operation of a Mobile Impaired Driver Testing site
In Progress
VISION ZERO YEAR THREE REPORT 75
Glossary19-190
A City Law creating a criminal misdemeanor penalty for New York City drivers who injure or kill pedestrians or cyclists with the right of way. In the Fall of 2016, the City Council passed an amendment that specified that motorists must yield to all pedestrians who enter the crosswalk during the walking person phase or the flashing red hand phase.
Accessible Pedestrian Signals
Devices which assist pedestrians who are blind or have low vision in crossing at a signalized intersection. APS provide information in non-visual formats, such as audible tones, speech messages and vibrating surfaces to alert blind or low vision pedestrians when the “walk” phase is available at a given intersection.
Arterial
A wide high-volume roadway.
Arterial Slow Zones
The Arterial Slow Zone program uses a combination of a lower speed limit, signal timing changes, distinctive signs and increased enforcement to improve safety on some of New York City’s highest-crash corridors.
CANceiver
A device mounted in a vehicle that measures the vehicle speed, acceleration, and hard breaking events.
CRASH
CRASH is the New York City vehicle collision and incident management system. All fleet agencies except NYPD are currently using CRASH. It was launched in FY2014.
Curb Extension
Also known as a neckdown. An expansion of the curb line into the lane of the roadway adjacent to the curb for a portion of a block either at a corner or mid-block.
For-hire Vehicle (FHV)
For-hire vehicles are vehicles other than taxis and commuter vans, that are licensed by TLC to transport the public. They include community car services (also known as liveries), black cars (which include app-based black cars, such as those dispatched by Uber), and certain luxury limousines.
FORMS (Finest Online Records Management System)
MV-104 replaced the existing legacy accident system and was deployed by NYPD on March 14, 2016. In addition to replacing the existing department database, it allows officers to do direct entry crash reporting using mobile devices.
Killed or Seriously Injured (KSI)Calculation
A method of analyzing the potential danger of a corridor or intersection by measuring the number of people killed or seriously injured at that location (calculated as a per mile rate for corridors).
Leading Pedestrian Interval (LPI)
A signal timing strategy designed to reduce turning movement/pedestrian conflicts. With an LPI the walkng signal is displayed before the parallel movement of traffic gets a green indication. This allows pedestrians to start their crossing and establish a presence in the crosswalk before the traffic is released.
LIDAR Gun
A laser device used by the police for speed limit enforcement. LIDAR guns allow a police officer to measure the speed of an individual vehicle within a stream of traffic.
Neighborhood Slow Zone
Neighborhood Slow Zones are a community based program that reduces the speed limit to 20 MPH in a select neighborhood area with a combination of markings, signage and speed humps. Slow Zones are selected through a competitive application process, and are meant to slow speeds and lower the incidence and severity of crashes in New York City’s residential areas.
VISION ZERO YEAR THREE REPORT76
Pedestrian Safety Island
A raised area located at crosswalks that serves as pedestrian refuge separating traffic lanes or directions, particularly on wide roadways.
Precision policing (in Traffic Enforcement)
Focusing targeted, highly visible traffic enforcement on the locations with the greatest number of crashes with injury. Greater use of technology will allow NYPD to identify the specific crash causing violations and evaluate the impact of enforcement efforts in these locations in order to adjust as necessary to reduce crashes.
Priority Corridor
Priority Corridors were selected from all corridors (streets measuring at least one mile in length) in each borough and were ranked on a pedestrian KSI per-mile basis. Corridors were selected from the top of this list until the cumulative number of pedestrian KSI reached half of the borough’s total.
Priority Intersection
Priority Intersections were selected from the intersections with the highest number of pedestrian KSI that cumulatively account for 15% of the borough’s total pedestrian KSI.
Protected Bike Lane
Designated on-street bicycle lanes that are protected from motorized traffic by parked vehicles, barriers or bollards.
Raised Center Median
A raised area separating traffic lanes or directions, particularly on wide roadways.
TLC Safety Honor Roll
A list created by TLC of taxi and for-hire vehicle drivers who have, over four years or more, not had a single crash involving injury, a single traffic violation, or a single violation of TLC safety-related rules and TLC-licensed companies with the lowest shares of vehicles involved in serious collisions in their sector over the past year.
TEAs
Traffic Enforcement Agents are unarmed uniformed civilian members of the Police Department responsible for issuing parking summonses, directing traffic, towing vehicles, truck enforcement and construction site inspections.
TrafficStat
Weekly traffic meetings held by NYPD at police headquarters to review motor vehicle, bicyclist and pedestrian crash data.
Truck Sideguards
Sideguards are protective pieces added to trucks that prevent pedestrians, cyclists and smaller motor vehicles from rolling or falling underneath the side body of the truck.
Vision Zero View
A map that helps the Vision Zero team apply a ata-driven approach to enforcement, focusing on improvement in the areas that are vulnerable to injuries and crashes. The map aggregates years of fatality and injury data, as well as displays a variety of other metrics, including injuries and fatalities, speed humps, and slow zones, town hall meetings and schools with safety outreach.
Volpe
A think tank at the US Department of Transportation that DCAS has partnered with to study truck design, including the installation of truck sideguards.
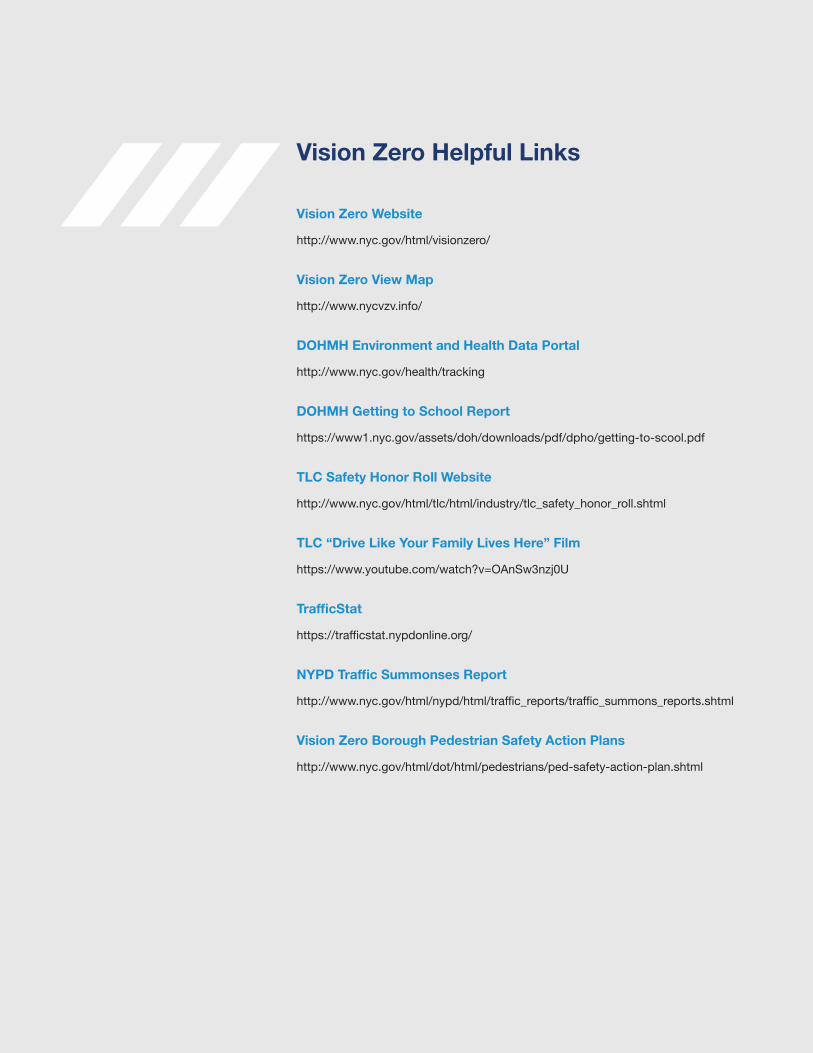
VISION ZERO YEAR THREE REPORT 77
Vision Zero Helpful Links
Vision Zero Website
http://www.nyc.gov/html/visionzero/
Vision Zero View Map
http://www.nycvzv.info/
DOHMH Environment and Health Data Portal
http://www.nyc.gov/health/tracking
DOHMH Getting to School Report
https://www1.nyc.gov/assets/doh/downloads/pdf/dpho/getting-to-scool.pdf
TLC Safety Honor Roll Website
http://www.nyc.gov/html/tlc/html/industry/tlc_safety_honor_roll.shtml
TLC “Drive Like Your Family Lives Here” Film
https://www.youtube.com/watch?v=OAnSw3nzj0U
TrafficStat
https://trafficstat.nypdonline.org/
NYPD Traffic Summonses Report
http://www.nyc.gov/html/nypd/html/traffic_reports/traffic_summons_reports.shtml
Vision Zero Borough Pedestrian Safety Action Plans
http://www.nyc.gov/html/dot/html/pedestrians/ped-safety-action-plan.shtml
VISION ZERO YEAR THREE REPORT78
Vision Zero Task Force
Task Force Members
Shawn Alsop, NYPDAnna Caffarelli, DOHMHMarco A. Carrion, Mayor’s Office, Community Affairs UnitChief Thomas Chan, NYPDAnn Marie Doherty, DOTJeffrey Dupee, Mayor’s Office, Community Affairs UnitInspector Dennis Fulton, NYPDLawrence Fung, DOHMHBenjamin Furnas, Office of the MayorLauren Greenawalt, Mayor’s Office of OperationsToni Gantz, Law DepartmentHarry Goodheart, MTAAli Hamade, DOHMHJill Hoexter, New York County District Attorney’s OfficeGary Johnson, Mayor’s Office of OperationsMahanth Joishy, DCASKeith Kerman, DCASKara Kirchhoff, OMBMadeline Labadie, TLCPhebe Macrae, Law DepartmentJacqueline Matos, Mayor’s Office of OperationsStephen Malmberg, OMBJuan Martinez, DOTJoseph McCormack, Bronx District Attorney’s OfficeDawn Miller, TLCNorma Ponce, Mayor’s Office of OperationsNancy Savasta, Law DepartmentHannah Smith, Mayor’s Office of OperationsSherif Soliman, Office of the Mayor, State Legislative AffairsGeraldine Sweeney, Mayor’s Office of OperationsPierre Vieux, MTAKim Wiley-Schwartz, DOTMiao Zhang, OMB
Data Working Group
Shawn Alsop, NYPDAnna Caffarelli, DOHMHAnn Marie Doherty, DOTInspector Dennis Fulton, NYPDLawrence Fung, DOHMHLauren Greenawalt, Mayor’s Office of OperationsMahanth Joishy, DCASBen Kurland, TLCMadeline Labadie, TLCJennifer Norton, DOHMHAzikiwe Rich, DOTGeraldine Sweeney, Mayor’s Office of OperationsRob Viola, DOT
Marketing Working Group
Shawn Alsop, NYPDAnna Caffarelli, DOHMHAnn-Marie Doherty, DOTMahanth Joishy, DCASMichelle Kaucic, DOTMadeline Labadie, TLCCaryn Resnick, DFTAGeraldine Sweeney, Mayor’s Office of OperationsKim Wiley-Schwartz, DOTJennine Ventura, DFTA
VISION ZERO YEAR THREE REPORT 79
Back Row (left to right)Shawn Alsop, NYPD; Salvador Arrona, BIC; Benjamin Furnas, Office of the Mayor; Ann Marie Doherty, DOT; Mahanth Joishy, DCAS; Madeline Labadie, TLC; Kim Wiley-Schwartz, DOT; Keith Kerman, DCAS; Guenevere Knowles, Mayor’s Office of Operations; Inspector Dennis Fulton, NYPD; Eleanor Nussbaum, OMB; Geraldine Sweeney, Mayor’s Office of Operations; Nancy Savasta, Law Department; Jacqueline Matos, Mayor’s Office of Operations; Hannah Smith, Mayor’s Office of Operations; Miao Zhang, OMB; Lauren Greenawalt, Mayor’s Office of Operations; Gary Johnson, Mayor’s Office of Operations; Joseph McCormack, Bronx District Attorney’s Office
Front Row (left to right)Ali Hamade, DOHMH; Juan Martinez, DOT; Lawrence Fung, DOHMH; Rob Viola, DOT
Not Pictured: Anna Caffarelli, DOHMH; Marco A. Carrion, Mayor’s Office, Community Affairs Unit; Chief Thomas Chan, NYPD; Jeffrey Dupee, Mayor’s Office, Community Affairs Unit; Toni Gantz, Law Department; Harry Goodheart, MTA; Jill Hoexter, New York County District Attorney’s Office; Kara Kirchhoff, OMB; Phebe Macrae, Law Department; Stephen Malmberg, OMB; Dawn Miller, TLC; Norma Ponce, Mayor’s Office of Operations; Nancy Savasta, Law Department; Sherif Soliman, Office of the Mayor, State Legislative Affairs; Pierre Vieux, MTA
Vision Zero Task Force
VISION ZERO YEAR THREE REPORT80
Report developed by the New York City Mayor’s Office of Operations
Report layout: Carly Clark
Photos:
Cover: NYC DOT
Page 2: NYC DOT
Page 5: NYC DOT
Page 10: NYC DOT
Page 16: DDC, Leila (Xinyi) Lin
Page 18: DDC, Leila (Xinyi) Lin

VISION ZERO YEAR THREE REPORT 81
VISION ZERO YEAR THREE REPORT82
Crashes are preventable. Together, we can save lives.