Embed Size (px)
Citation preview
VISION ZERO YEAR FOUR REPORT 1
Table of Contents
Vision Zero Year Four
4 Executive Summary
8 Vision Zero By the Numbers
10 STATISTICS AND METRICS
Traffic Fatalities in 2016
17 DATA-DRIVEN SOLUTIONS
Cross-Agency Evaluation and Data-Driven Collaboration
24 ENGINEERING
Designs to Protect the Most Vulnerable Users
38 ENFORCEMENT
Focus on the Prevention of Serious Crashes
48 FLEETS
Expanded Technology for Safer City Vehicles
57 ENGAGEMENT
Connecting with New Yorkers Where They Live
Vision Zero Year Four
66 Vision Zero Year Four Initiatives
Appendix
69 Year One Scorecard
72 Year Two Scorecard
74 Year Four Scorecard
75 Glossary
77 Helpful Links
78 Task Force Members
YEAR FOUR REPORTMarch 2018
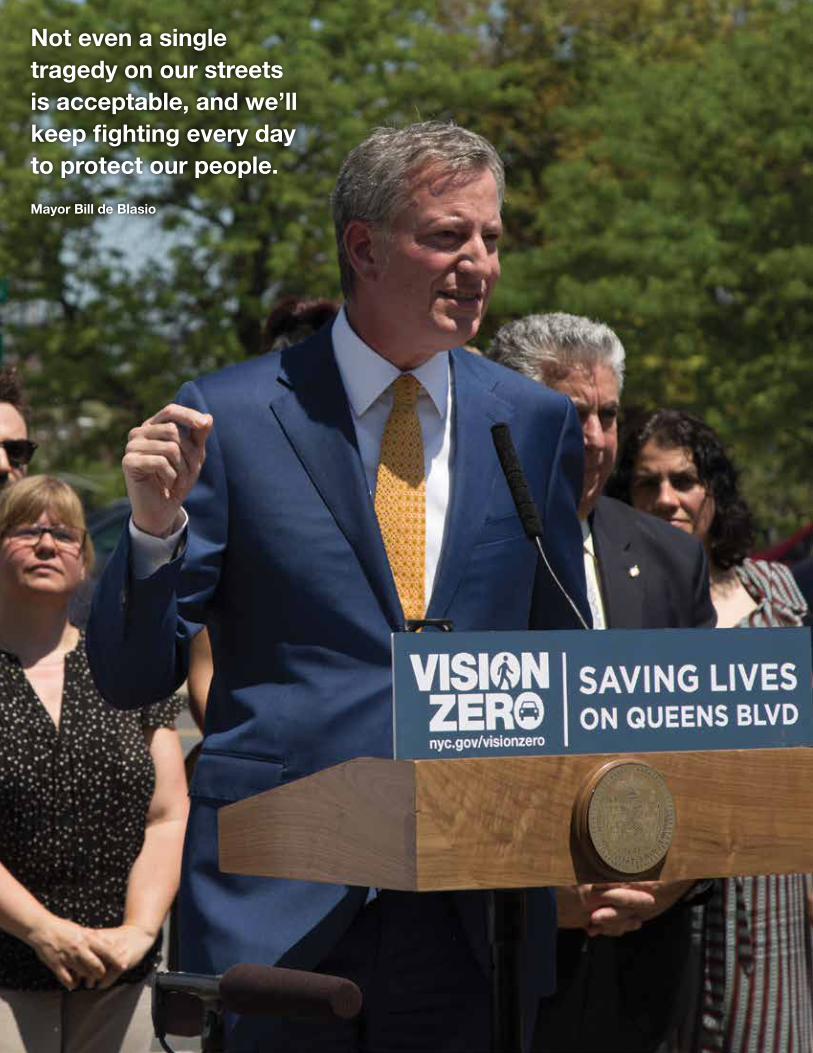
VISION ZERO YEAR FOUR REPORT2Not even a single tragedy on our streets is acceptable, and we’ll keep fighting every day to protect our people.
Mayor Bill de Blasio
VISION ZERO YEAR FOUR REPORT 3
Table of Contents
Vision Zero Year Four
4 Executive Summary
10 Vision Zero By the Numbers
12 STATISTICS AND METRICS
A Focus on Priority Locations
16 DATA-DRIVEN SOLUTIONS
Data Transparency and Partnerships for Innovation
22 ENGINEERING
Accelerated Interventions Where They Are Needed Most
32 ENFORCEMENT
Promoting a Culture of Safe Driving
46 FLEETS
Leading by Example through Smart Procurement and Practices
58 ENGAGEMENT
Connecting with New Yorkers Where They Live
Vision Zero Year Five
72 Vision Zero Year Five Initiatives
Appendix
75 Year One Scorecard
78 Year Two Scorecard
80 Year Three Scorecard
81 Year Four Scorecard
82 Glossary
84 Helpful Links
85 Task Force Members
VISION ZERO YEAR FOUR REPORT
VISION ZERO YEAR FOUR REPORT 55
Vision Zero Year Four
Executive Summary
The past year was the safest year on record on New York City streets, spurred by an unprecedented drop in pedestrian fatalities.
Since the launch of Vision Zero in 2014, New York City has experienced a
28 percent decline in traffic fatalities, and a 45 percent decline specifically
in pedestrian fatalities. The tireless work of City agencies, advocates, and
individual New Yorkers has paid dividends in lives saved even in the face of a
national upward trend in traffic fatalities over the same period.
This progress raises the question of how exactly New York City managed to
defy national trends and improve on its own record year after year. There is
no singular strategy, no simple explanation. This progress happened with the
full force of City government – agencies collaborating since the inception of
Vision Zero to chart a path towards safer streets for all, share best practices,
and implement proven strategies as well as test new ones. A commitment to
prioritizing safety, combined with an emphasis on multi-agency teamwork and
a data-driven approach, has allowed the City to target resources and interven-
tions where they are most needed while also anticipating future urgencies.
The unprecedented number of initiatives completed in 2017, as detailed
in this report, means that agency expertise is being leveraged like never
before to protect all New Yorkers. The following pages show how the City is
changing drivers’ behaviors behind the wheel, cracking down on dangerous
driving, and redesigning streets to make them safer for pedestrians and
bicyclists – all through a combination of data analysis, engineering, outreach
and education, enforcement, and new technology.
VISION ZERO YEAR FOUR REPORT6
Since its inception, Vision Zero has relied on crash and injury data to guide
investments in safety in the highest priority locations. This data-driven
approach also draws attention to the disproportionate concentration of crash
numbers and severities over certain person, place, and time factors. This
year’s report highlights Vision Zero’s ongoing efforts to target investments in
the groups, areas, and times that carry a disproportionate burden, and makes
an ongoing commitment to further address disparities.
Statistics and Metrics / Year Four
A Focus on Priority Locations
At the center of planning for Vision Zero safety investments are the five
Borough Pedestrian Safety Action Plans. These Plans analyze crash data and
identify priority intersections, corridors, and areas for each borough based
on pedestrians killed or seriously injured (KSI) between 2009 and 2013. With
a focus on priority locations, resources go to where they are most urgently
needed, and KSIs continue to decline at these locations. During the 2009-2013
study period, these locations averaged 142 traffic deaths per year. In 2017,
this figure fell to 100, a decline of 30 percent. Looking at pedestrians specifi-
cally, from 2009-2013, these locations averaged 99 deaths a year. In 2017,
there were 54 pedestrian deaths at priority locations, a decline of 45 percent.
Data-Driven Solutions / Year Four
Data Transparency and Partnerships for Innovation
Vision Zero relies on the evaluation of evidence to make decisions about safety
initiatives. The Department of Health and Mental Hygiene (DOHMH), as stewards
of the City’s health-related information, has made data on traffic deaths, hospi-
talizations, and risk factors from numerous sources available to the public. Vision
Zero View, the public portal for crash and street design statistics, was enhanced
in 2017 by the Department of Transportation (DOT) to include information about
additional traffic safety features. Transparency in public-facing data means
that all New Yorkers have the chance to understand what is happening in their
neighborhoods, and how Vision Zero can make streets safer.
In addition to the data collected and disseminated by City agencies, collabora-
tion has strengthened the knowledge base available for complex Vision Zero
VISION ZERO YEAR FOUR REPORT 7
decision-making. The Department of Citywide Administrative Services (DCAS)
and DOT have teamed up with DataKind, Columbia Smart Cities, and the
Columbia University Data Science Institute to gain deeper insights into what
happens on the streets – and why.
Engineering / Year Four
Accelerated Interventions Where They Are Needed Most
Since the start of Vision Zero, DOT has completed 356 safety engineering
projects. In 2017, DOT implemented a record 114 of these projects, over twice
the average annual amount prior to the start of Vision Zero. DOT also more
than doubled the previous average of new dedicated cycling space installed:
66 lane miles, of which 25 were protected lane miles. Mindful that there are
many neighborhoods in New York City with disproportionately high cyclist
KSIs and few bike lanes, DOT has made the cornerstone of its Summer 2017
report Safer Cycling the designation of 10 Priority Bicycle Districts, which will
receive 75 lane miles of new or enhanced bicycle facilities by 2022.
Leading pedestrian intervals (LPIs), signal changes that give pedestrians a
head start crossing the street, were installed at 832 locations in 2017, bringing
the total of new LPIs installed since the start of Vision Zero to more than
2,000. Following progress initiated in 2016, DOT continued its Left Turn Traffic
Calming project, bringing techniques that have reduced median left turn
speeds by 24 percent to an additional 110 locations citywide. Major transfor-
mations of arterial roads have continued, notably on Woodhaven and Cross
Bay Boulevards in Queens, which have been redesigned for greater safety in
conjunction with the launch of Select Bus Service.
Enforcement / Year Four
Promoting a Culture of Safe Driving
The data-driven initiatives of the City’s law enforcement, criminal justice, and
regulatory agencies have continued to focus on promoting behavioral change
and ending a culture of dangerous driving. In 2017, almost two-thirds of the
New York Police Department’s (NYPD) traffic summonses were issued for the
six violations most likely to injure or kill New Yorkers: speeding, failing to yield
to a pedestrian, failing to stop on a signal, improperly turning, using a cell
VISION ZERO YEAR FOUR REPORT8
phone (including texting while driving), and disobeying signs. The Taxi and
Limousine Commission’s (TLC) field enforcement officers issued 59 percent
more traffic safety summonses compared to 2016, and partnered with NYPD
on the use of LIDAR speed enforcement. Both agencies have also increased
their enforcement of motorists obstructing bicycle lanes.
City agencies continue to partner with advocates to support the enhancement
of the speed camera program. At present, State legislation limits the locations
and operating hours of the cameras, as well as the number of locations in
which they may be placed. A DOT report published in Summer 2017 showed
that speeding had been reduced by up to 85 percent in locations with
active speed cameras. The offices of the District Attorneys for each of the
five boroughs have also supported stricter laws against dangerous driving,
including stronger penalties for hit-and-run drivers.
Fleets / Year Four
Leading by Example through Smart Procurement and Practices
The largest fleets in the City continue to be the growing for-hire vehicle sector
regulated by TLC, the City’s own government vehicle fleet administrated by
DCAS, and the public buses of MTA New York City Transit. Over 268,000 drivers
are employed or regulated by City agencies, and they set an example for all
professional fleets by maintaining safe records, engaging in rigorous Vision Zero
training programs, and rewarding best practices. In 2017, TLC’s annual Safety
Honor Roll recognized 420 drivers and 25 businesses from all over the city for
their safety records. Over 35,000 drivers completed TLC’s Vision Zero Driver
Education in 2017, for a total of nearly 87,000 since the start of the program in
2014. DCAS has also expanded its defensive driving training in 2017 to include
employees from the New York City Housing Authority (NYCHA) and the District
Attorney’s offices, with over 10,500 City drivers attending a class in the past
year. Fifty-five City employees from numerous agencies were honored in Fall
2017 for their efforts to train their colleagues in defensive driving.
DCAS published its Safe Fleet Transition Plan in conjunction with the US DOT
Volpe Center in May 2017. This plan stipulates that all vehicles purchased for
Fiscal Year 18 and beyond must include the best available safety technology
including, where applicable, automatic emergency braking, rear and side truck
guards, and back up cameras.
VISION ZERO YEAR FOUR REPORT 9
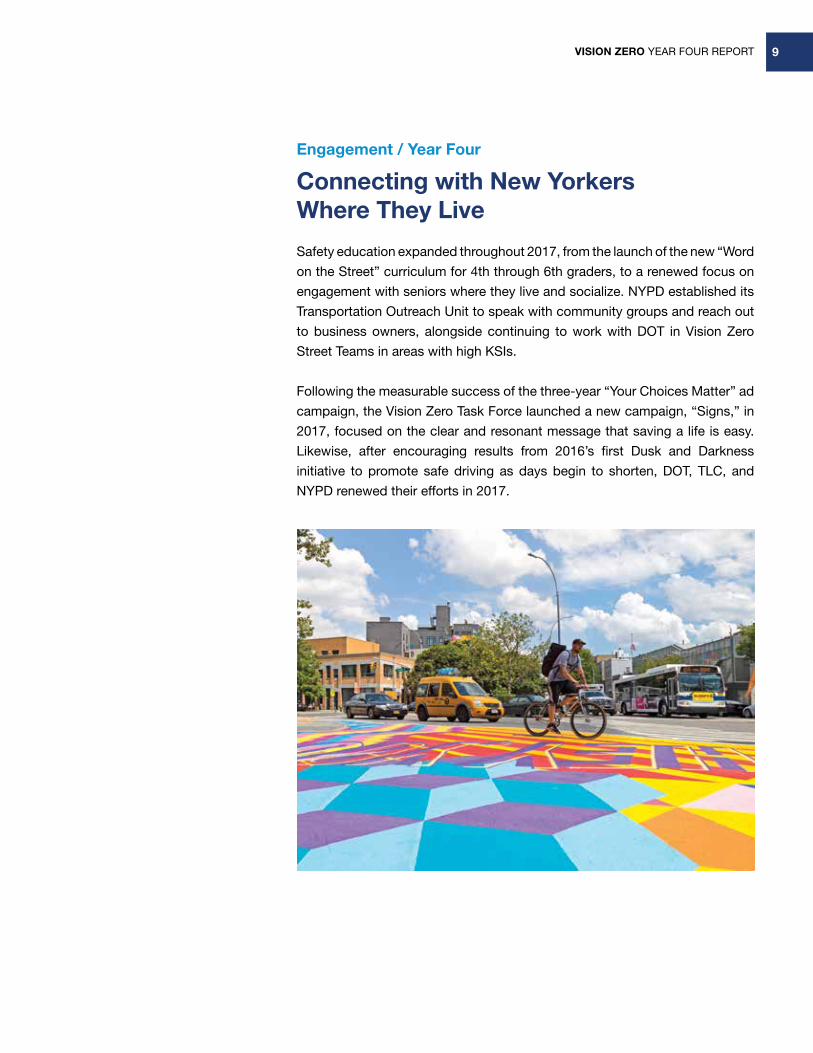
Engagement / Year Four
Connecting with New Yorkers Where They Live
Safety education expanded throughout 2017, from the launch of the new “Word
on the Street” curriculum for 4th through 6th graders, to a renewed focus on
engagement with seniors where they live and socialize. NYPD established its
Transportation Outreach Unit to speak with community groups and reach out
to business owners, alongside continuing to work with DOT in Vision Zero
Street Teams in areas with high KSIs.
Following the measurable success of the three-year “Your Choices Matter” ad
campaign, the Vision Zero Task Force launched a new campaign, “Signs,” in
2017, focused on the clear and resonant message that saving a life is easy.
Likewise, after encouraging results from 2016’s first Dusk and Darkness
initiative to promote safe driving as days begin to shorten, DOT, TLC, and
NYPD renewed their efforts in 2017.
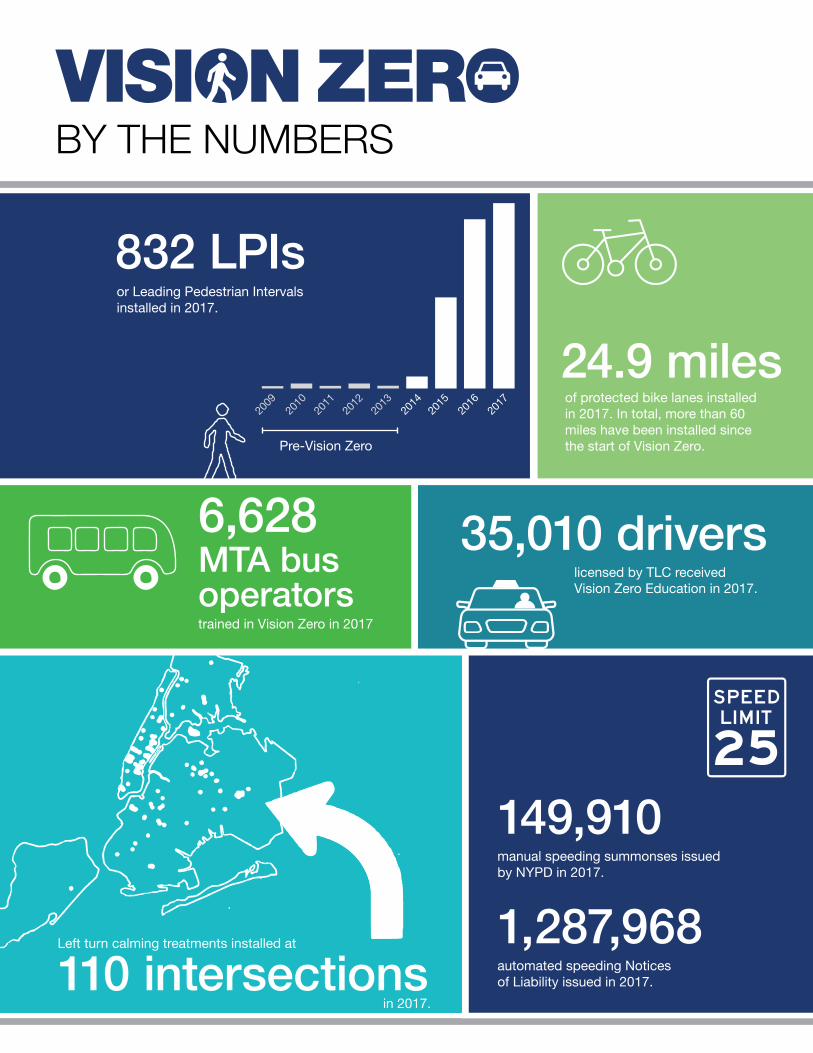
BY THE NUMBERS
832 LPIsor Leading Pedestrian Intervals installed in 2017.
24.9 milesof protected bike lanes installed in 2017. In total, more than 60 miles have been installed since the start of Vision Zero.
licensed by TLC received Vision Zero Education in 2017.
manual speeding summonses issued by NYPD in 2017.
trained in Vision Zero in 2017
automated speeding Notices of Liability issued in 2017.
Pre-Vision Zero
2009
2010
2011
2012
2013
2014
2015
2016
35,010 drivers
149,910
6,628 MTA bus operators
1,287,968110 intersections
in 2017.
Left turn calming treatments installed at
2017
licensed by TLC received Vision Zero Education in 2017.
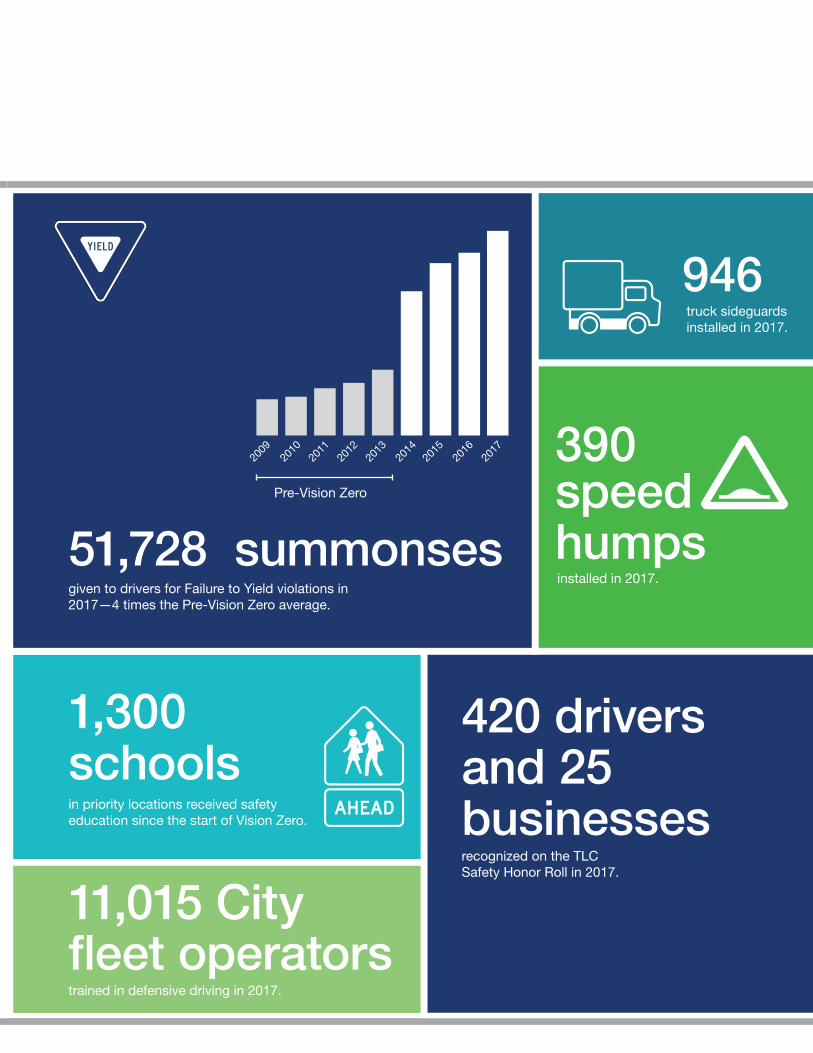
51,728 summonses
1,300 schools
11,015 City fleet operators
946
390 speed humps
given to drivers for Failure to Yield violations in 2017—4 times the Pre-Vision Zero average.
in priority locations received safety education since the start of Vision Zero.
trained in defensive driving in 2017.
truck sideguards installed in 2017.
installed in 2017.
recognized on the TLC Safety Honor Roll in 2017.
Pre-Vision Zero
2009
2010
2011
2012
2013
2014
2015
2016
420 drivers and 25 businesses
2017
VISION ZERO YEAR FOUR REPORT12
VISION ZERO YEAR FOUR REPORT 13
Statistics and Metrics
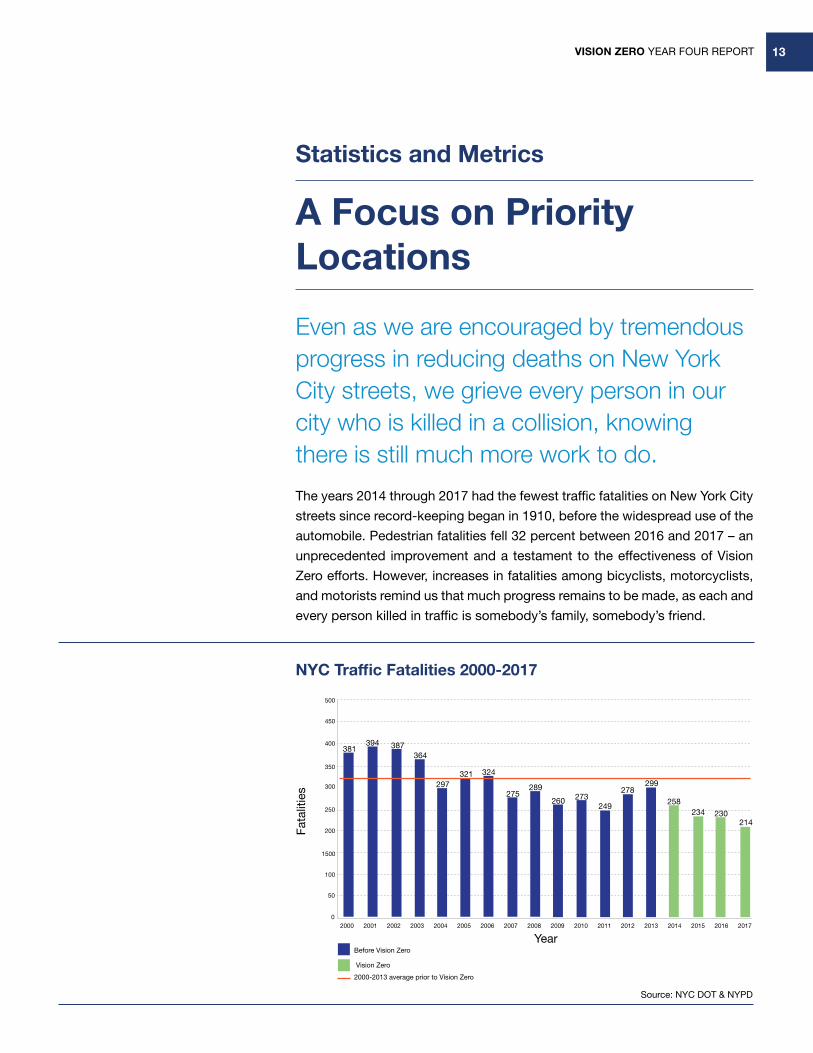
A Focus on Priority Locations
Even as we are encouraged by tremendous progress in reducing deaths on New York City streets, we grieve every person in our city who is killed in a collision, knowing there is still much more work to do.
The years 2014 through 2017 had the fewest traffic fatalities on New York City
streets since record-keeping began in 1910, before the widespread use of the
automobile. Pedestrian fatalities fell 32 percent between 2016 and 2017 – an
unprecedented improvement and a testament to the effectiveness of Vision
Zero efforts. However, increases in fatalities among bicyclists, motorcyclists,
and motorists remind us that much progress remains to be made, as each and
every person killed in traffic is somebody’s family, somebody’s friend.
0
50
100
1500
200
250
300
350
400
450
500
5770
2000
2000-2013 average prior to Vision Zero
Before Vision Zero
Vision Zero
2001 2002 2003 2004 2005 2006 2007 2008 2009 2010 2011 2012 2013 2014 2015 2016 2017
394381 387
364
297321 324
275289
260 273249
278299
258234 230
214
Year
Fata
litie
s
Source: NYC DOT & NYPD
NYC Traffic Fatalities 2000-2017
VISION ZERO YEAR FOUR REPORT14
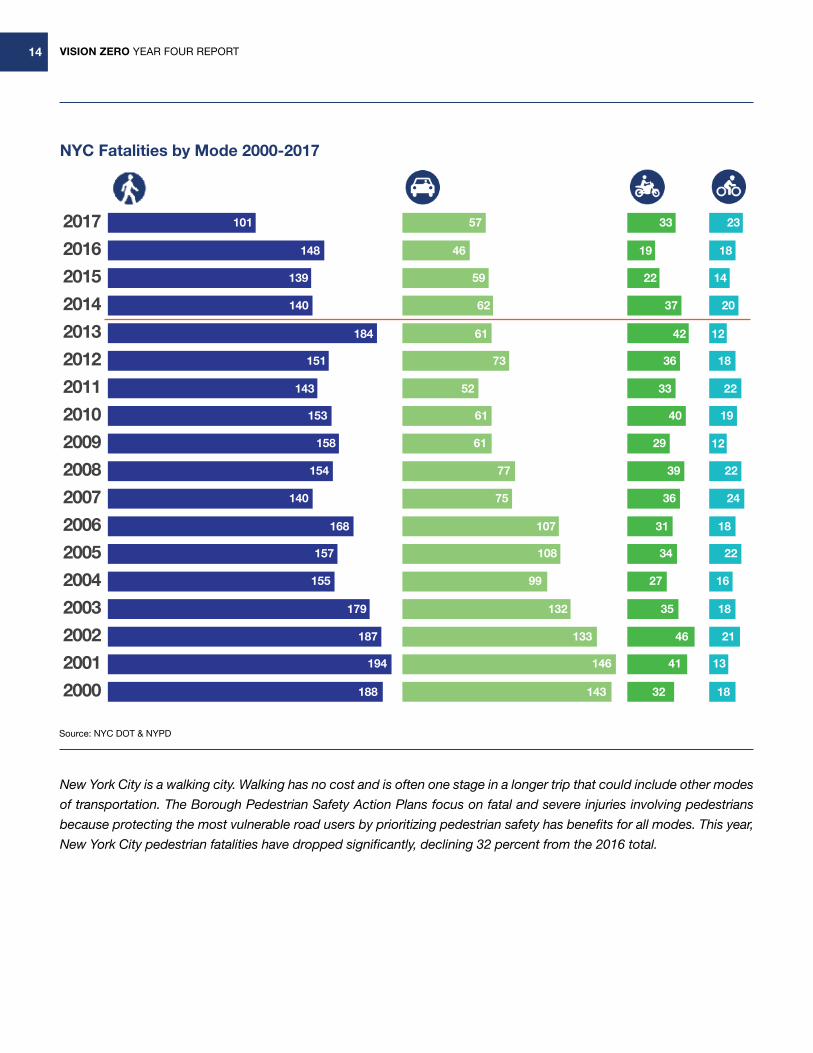
Source: NYC DOT & NYPD
NYC Fatalities by Mode 2000-2017
New York City is a walking city. Walking has no cost and is often one stage in a longer trip that could include other modes
of transportation. The Borough Pedestrian Safety Action Plans focus on fatal and severe injuries involving pedestrians
because protecting the most vulnerable road users by prioritizing pedestrian safety has benefits for all modes. This year,
New York City pedestrian fatalities have dropped significantly, declining 32 percent from the 2016 total.
Traffic Fatalities
2016
2015
2014
2013
2012
2011
2010
2009
2008
2007
2006
2005
2004
2003
2002
2001
2000
2017 101
148
57
46
59
62
61
73
52
61
61
77
75
139
140
184
151
143
153
158
154
140
168
157
155
179
187
194
188
107
108
99
132
133
146
143 32 18
13
21
18
46
35
27
34
31
36
39
29
40
33 22
1836
42
37 20
1422
19
33 23
18
12
22
12
19
24
16
22
18
41
VISION ZERO YEAR FOUR REPORT 15
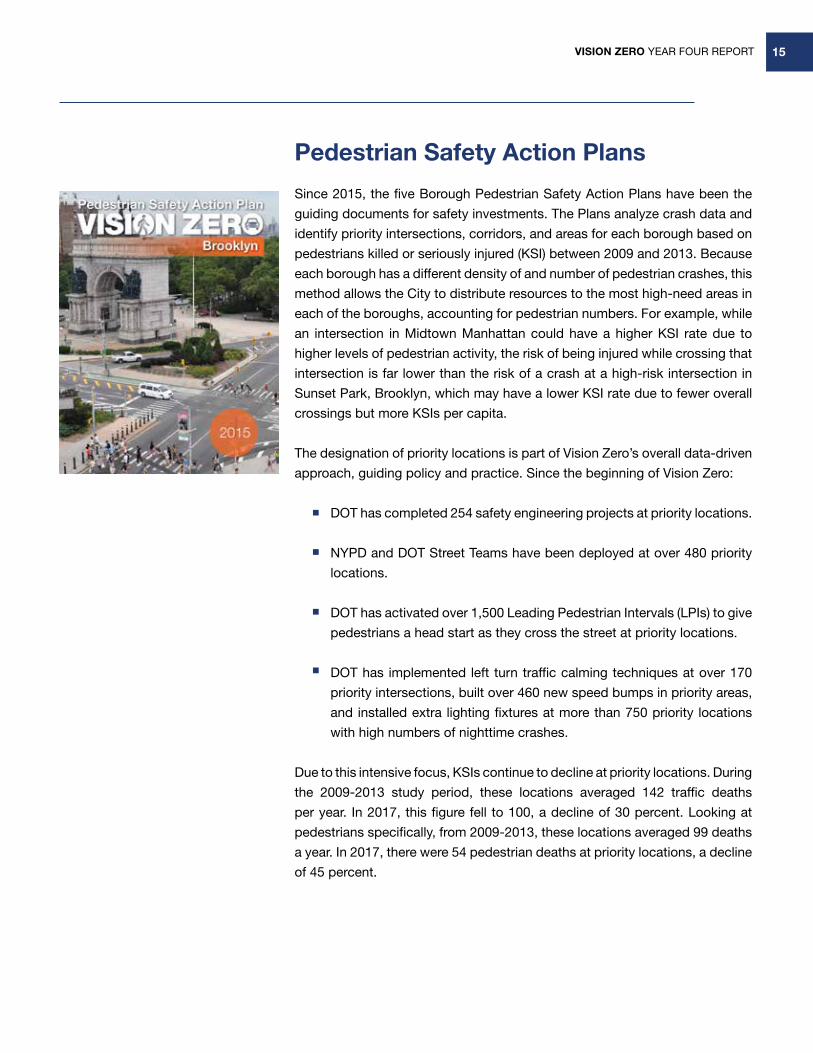
Pedestrian Safety Action Plans
Since 2015, the five Borough Pedestrian Safety Action Plans have been the
guiding documents for safety investments. The Plans analyze crash data and
identify priority intersections, corridors, and areas for each borough based on
pedestrians killed or seriously injured (KSI) between 2009 and 2013. Because
each borough has a different density of and number of pedestrian crashes, this
method allows the City to distribute resources to the most high-need areas in
each of the boroughs, accounting for pedestrian numbers. For example, while
an intersection in Midtown Manhattan could have a higher KSI rate due to
higher levels of pedestrian activity, the risk of being injured while crossing that
intersection is far lower than the risk of a crash at a high-risk intersection in
Sunset Park, Brooklyn, which may have a lower KSI rate due to fewer overall
crossings but more KSIs per capita.
The designation of priority locations is part of Vision Zero’s overall data-driven
approach, guiding policy and practice. Since the beginning of Vision Zero:
DOT has completed 254 safety engineering projects at priority locations.
NYPD and DOT Street Teams have been deployed at over 480 priority
locations.
DOT has activated over 1,500 Leading Pedestrian Intervals (LPIs) to give
pedestrians a head start as they cross the street at priority locations.
DOT has implemented left turn traffic calming techniques at over 170
priority intersections, built over 460 new speed bumps in priority areas,
and installed extra lighting fixtures at more than 750 priority locations
with high numbers of nighttime crashes.
Due to this intensive focus, KSIs continue to decline at priority locations. During
the 2009-2013 study period, these locations averaged 142 traffic deaths
per year. In 2017, this figure fell to 100, a decline of 30 percent. Looking at
pedestrians specifically, from 2009-2013, these locations averaged 99 deaths
a year. In 2017, there were 54 pedestrian deaths at priority locations, a decline
of 45 percent.
VISION ZERO YEAR FOUR REPORT16
VISION ZERO YEAR FOUR REPORT 17
Data-Driven Solutions
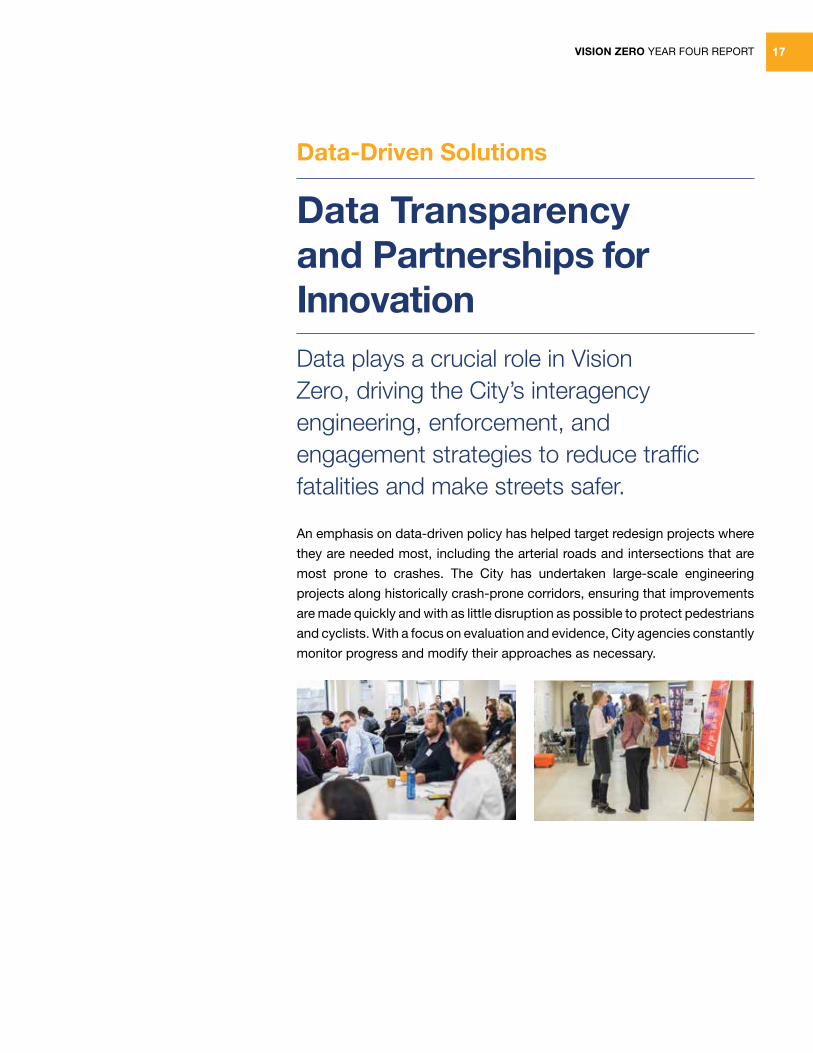
Data Transparency and Partnerships for InnovationData plays a crucial role in Vision Zero, driving the City’s interagency engineering, enforcement, and engagement strategies to reduce traffic fatalities and make streets safer.
An emphasis on data-driven policy has helped target redesign projects where
they are needed most, including the arterial roads and intersections that are
most prone to crashes. The City has undertaken large-scale engineering
projects along historically crash-prone corridors, ensuring that improvements
are made quickly and with as little disruption as possible to protect pedestrians
and cyclists. With a focus on evaluation and evidence, City agencies constantly
monitor progress and modify their approaches as necessary.
VISION ZERO YEAR FOUR REPORT18
Developing Injury/Fatality Analytical Model
In 2015, DOT teamed up with DataKind, a data science nonprofit, to develop a
comprehensive injury/fatality analytical model to help the City better understand
how engineering improvements affect the number of traffic KSIs. The model
considers close to 100 factors including crash data, project history, census data,
motor vehicle volume estimates, and transit usage to assess the effectiveness of
engineering interventions.
Since the model was delivered to DOT in early 2017, DOT has been updating it
to enhance functionality and test different scenarios. The model now includes
a geographic filter to allow more nuanced analyses, and DOT has begun to
investigate the relationship between motor vehicle volume changes and the
number of injuries. In addition, DOT is refining DataKind’s traffic exposure model
to estimate the vehicle volume on any given part of New York City’s street network.
Creating Driver Behavior Index
In 2014, DCAS began installing CANceiver devices on City vehicles to record
important information about driver behavior, including speed, hard braking,
and hard acceleration.
In 2017, DOT worked with the Data Science Institute at Columbia University to
create a Driver Behavior Index (DBI) system. The DBI system, when complete,
will be a safety ranking and classification system of New York City corridors
and intersections, based on driver behavior data drawn from DCAS CANceiver
fleet data. This data will be combined with DOT crash data to create several
metrics and classifications, helping planners and project managers become
more aware of driver behavior at particular locations.
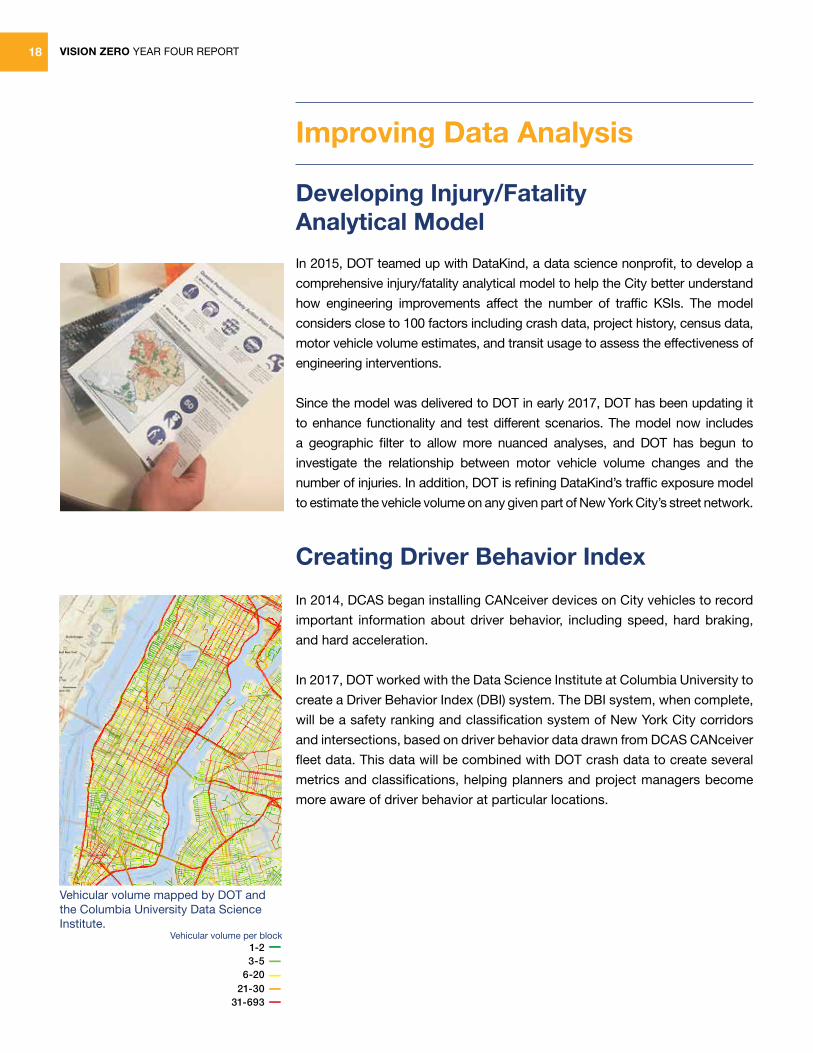
Sources: Esri, HERE, DeLorme, USGS, Intermap, INCREMENT P, NRCan, Esri Japan, METI, Esri China (Hong Kong), EsriKorea, Esri (Thailand), MapmyIndia, NGCC, © OpenStreetMap contributors, and the GIS User Community
Improving Data Analysis
1-23-5
6-2021-30
31-693
Vehicular volume mapped by DOT and the Columbia University Data Science Institute.
Vehicular volume per block
VISION ZERO YEAR FOUR REPORT 19
Completed Data Linkage Project
DOHMH completed a data matching process to link hospital records with
crash reports. Using the linked dataset, staff identified patterns of injuries,
injury type, body part injured, and injury severity associated with crash char-
acteristics. These patterns can help describe, among other things, the dispro-
portionate impact of traffic injuries on special populations, such as children
and older adults, and how injury severity relates to a person’s role in a crash.
Among the matched cases, injury severity is slightly higher among older
adults, pedestrians, and motorcyclists.
Released Epi Data Briefs
DOHMH analyzed medical examiner files and survey data to inform three Epi
Data Brief reports released in 2017: Driving and Self-Reported Dangerous
Driving Behaviors in New York City, Pedestrian Fatalities in New York City, and
Motor Vehicle Occupant Fatalities in New York City.
In addition, in December 2017, DOHMH released a Vital Signs data report
on alcohol-related injuries. During the study period, motor vehicle-related
injuries were a leading specified cause of unintentional alcohol-related injury
emergency department visits and hospitalizations.
Modeling Injury Prediction
The City relies on data to determine where and how to improve street safety,
with Vision Zero agencies constantly working to refine the predictive power of
their models. In collaboration with DOT, the Columbia University Data Science
Institute is working to identify what risk factors are associated with traffic
crashes and their outcomes. A more accurate model can enhance decision
making to improve crash prevention and victim outcomes.
VISION ZERO YEAR FOUR REPORT20
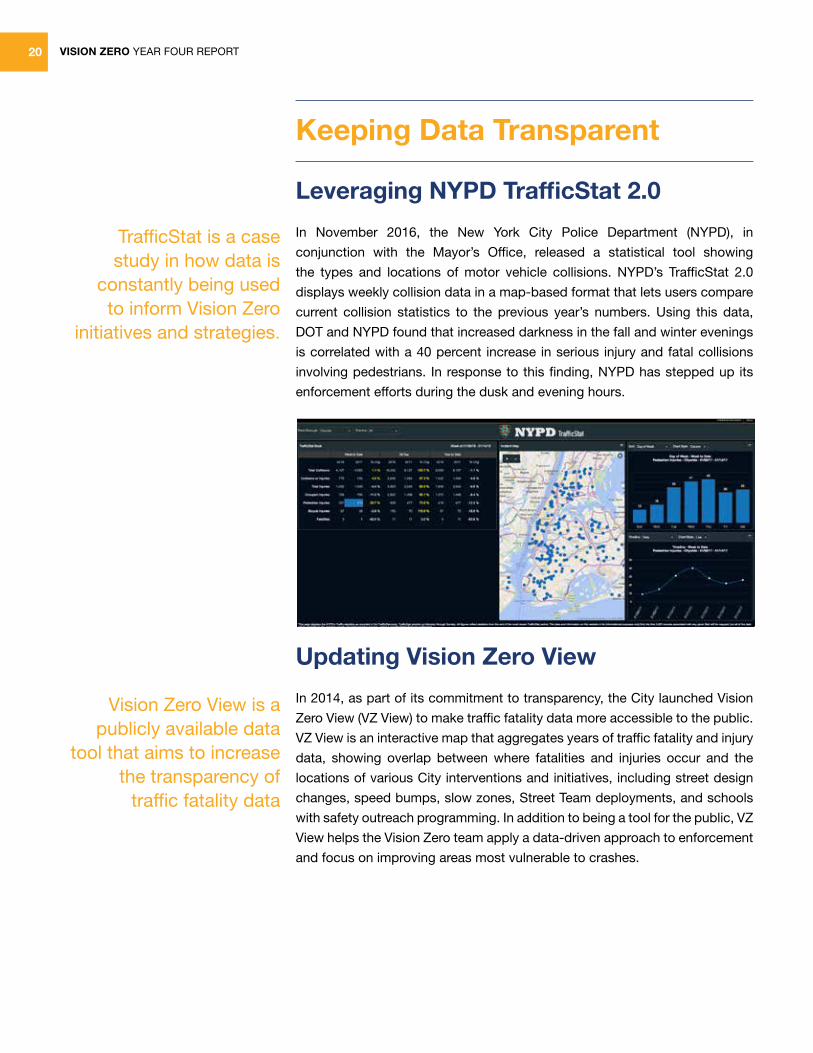
Leveraging NYPD TrafficStat 2.0
In November 2016, the New York City Police Department (NYPD), in
conjunction with the Mayor’s Office, released a statistical tool showing
the types and locations of motor vehicle collisions. NYPD’s TrafficStat 2.0
displays weekly collision data in a map-based format that lets users compare
current collision statistics to the previous year’s numbers. Using this data,
DOT and NYPD found that increased darkness in the fall and winter evenings
is correlated with a 40 percent increase in serious injury and fatal collisions
involving pedestrians. In response to this finding, NYPD has stepped up its
enforcement efforts during the dusk and evening hours.
Updating Vision Zero View
In 2014, as part of its commitment to transparency, the City launched Vision
Zero View (VZ View) to make traffic fatality data more accessible to the public.
VZ View is an interactive map that aggregates years of traffic fatality and injury
data, showing overlap between where fatalities and injuries occur and the
locations of various City interventions and initiatives, including street design
changes, speed bumps, slow zones, Street Team deployments, and schools
with safety outreach programming. In addition to being a tool for the public, VZ
View helps the Vision Zero team apply a data-driven approach to enforcement
and focus on improving areas most vulnerable to crashes.
TrafficStat is a case study in how data is
constantly being used to inform Vision Zero
initiatives and strategies.
Vision Zero View is a publicly available data
tool that aims to increase the transparency of
traffic fatality data
Keeping Data Transparent
VISION ZERO YEAR FOUR REPORT 21
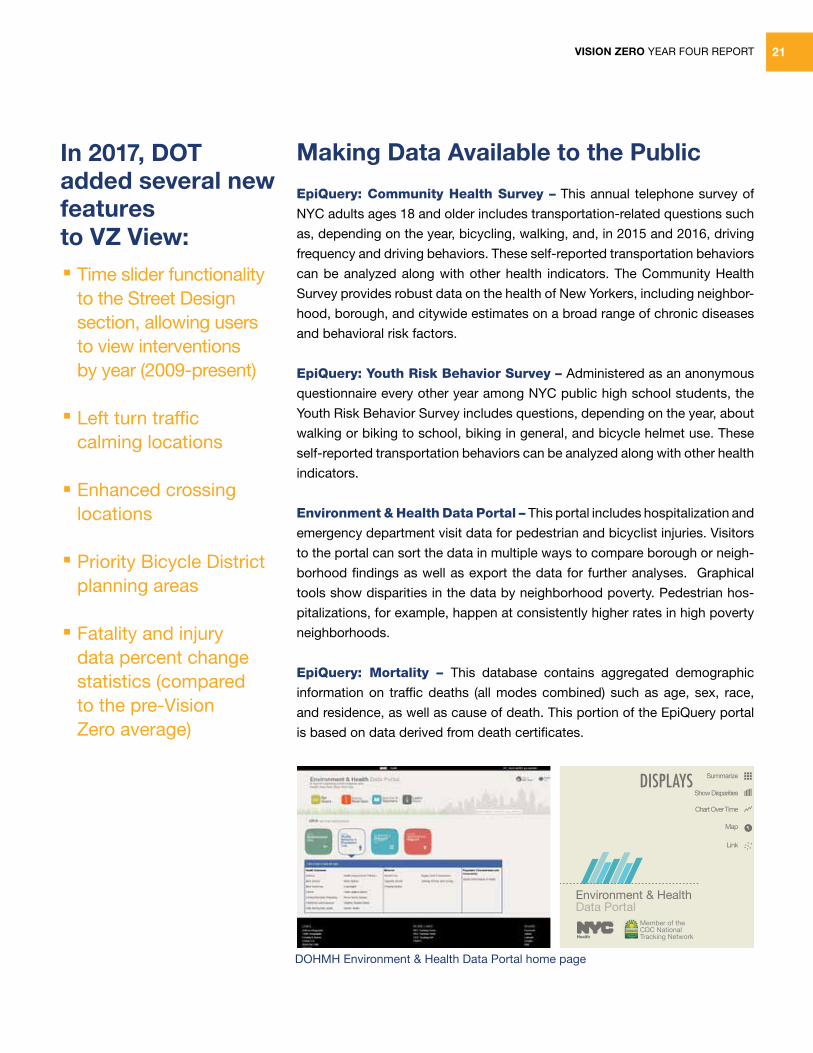
Making Data Available to the Public
EpiQuery: Community Health Survey – This annual telephone survey of
NYC adults ages 18 and older includes transportation-related questions such
as, depending on the year, bicycling, walking, and, in 2015 and 2016, driving
frequency and driving behaviors. These self-reported transportation behaviors
can be analyzed along with other health indicators. The Community Health
Survey provides robust data on the health of New Yorkers, including neighbor-
hood, borough, and citywide estimates on a broad range of chronic diseases
and behavioral risk factors.
EpiQuery: Youth Risk Behavior Survey – Administered as an anonymous
questionnaire every other year among NYC public high school students, the
Youth Risk Behavior Survey includes questions, depending on the year, about
walking or biking to school, biking in general, and bicycle helmet use. These
self-reported transportation behaviors can be analyzed along with other health
indicators.
Environment & Health Data Portal – This portal includes hospitalization and
emergency department visit data for pedestrian and bicyclist injuries. Visitors
to the portal can sort the data in multiple ways to compare borough or neigh-
borhood findings as well as export the data for further analyses. Graphical
tools show disparities in the data by neighborhood poverty. Pedestrian hos-
pitalizations, for example, happen at consistently higher rates in high poverty
neighborhoods.
EpiQuery: Mortality – This database contains aggregated demographic
information on traffic deaths (all modes combined) such as age, sex, race,
and residence, as well as cause of death. This portion of the EpiQuery portal
is based on data derived from death certificates.
Time slider functionality to the Street Design section, allowing users to view interventions by year (2009-present)
Left turn traffic calming locations
Enhanced crossing locations
Priority Bicycle District planning areas
Fatality and injury data percent change statistics (compared to the pre-Vision Zero average)
Environment & Health Data Portal
FEA
TURI
NG
Member of the CDC National Tracking Network
Download a formattedreport on specific topics.
Select any combination of indicators for export in csv.
NeighborhoodReportTOOLS
TOPICS
DISPLAYS
CustomizedTable
EpiQuery
Environment
Health, Behavior & Population
Summarize
Show Disparities
Chart Over Time
Map
Link
Explore health data by individual characteristics.
Bar charts stratify data by poverty.
Line charts show trends by borough.
Maps show the data byneighborhood.
Scatter plots explore associations betweentwo neighborhoodindicators.
• Climate• Housing Quality• Mice and Rats• Alcohol Access• Drinking Water Quality• Air Quality +more
• Asthma• Carbon Monoxide Poisoning• Alcohol Use• Cigarette Smoke+more
Summary tables allow data sorting and filtering.
In 2017, DOT added several new features to VZ View:
DOHMH Environment & Health Data Portal home page
VISION ZERO YEAR FOUR REPORT22 VISION ZERO YEAR FOUR REPORT22
23VISION ZERO YEAR FOUR REPORT 23
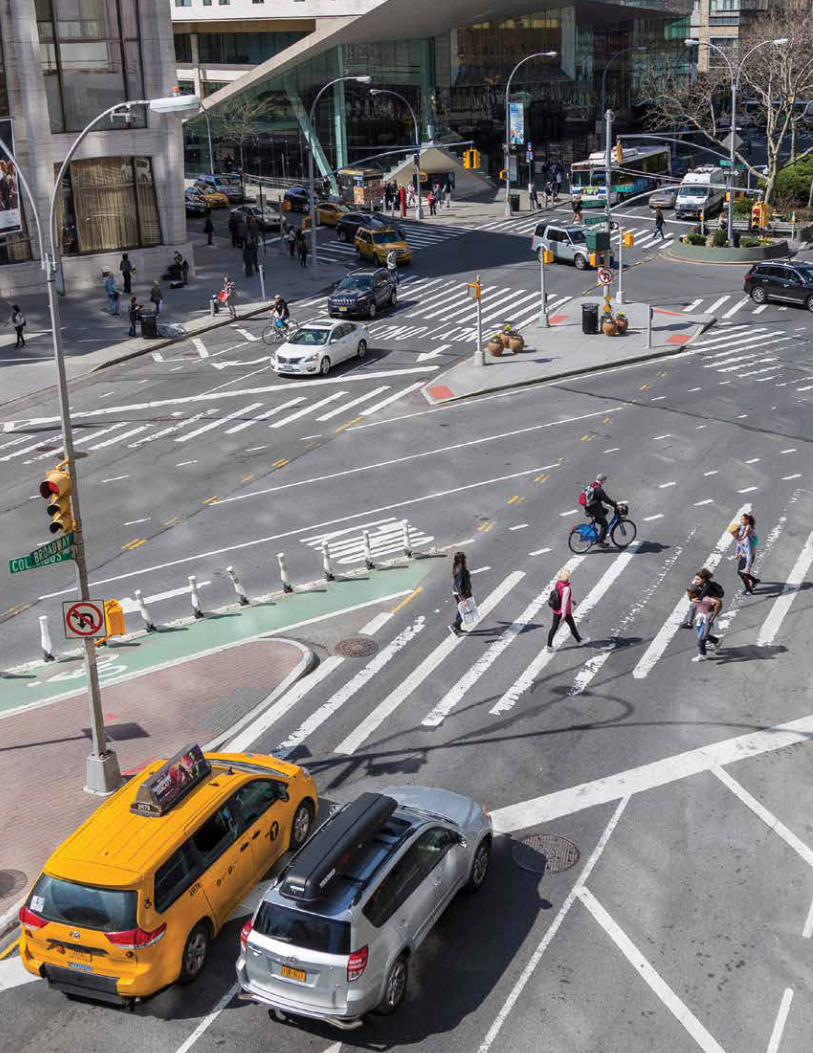
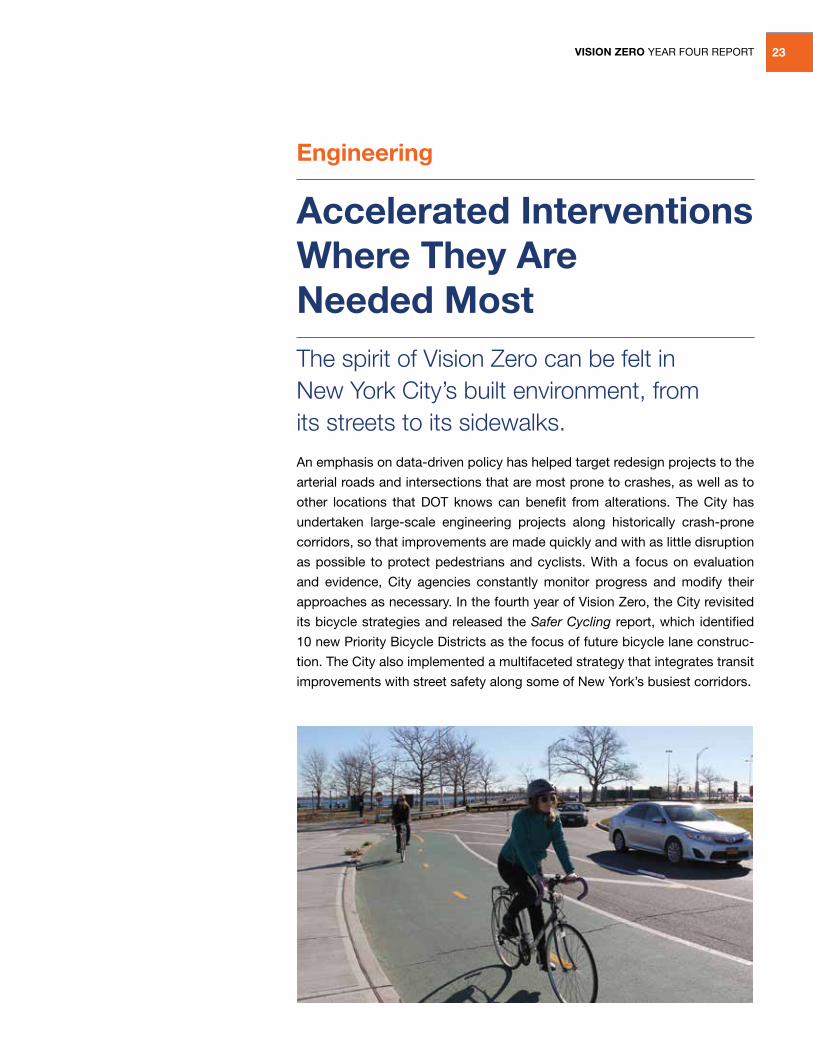
Engineering
Accelerated Interventions Where They Are Needed MostThe spirit of Vision Zero can be felt in New York City’s built environment, from its streets to its sidewalks.
An emphasis on data-driven policy has helped target redesign projects to the
arterial roads and intersections that are most prone to crashes, as well as to
other locations that DOT knows can benefit from alterations. The City has
undertaken large-scale engineering projects along historically crash-prone
corridors, so that improvements are made quickly and with as little disruption
as possible to protect pedestrians and cyclists. With a focus on evaluation
and evidence, City agencies constantly monitor progress and modify their
approaches as necessary. In the fourth year of Vision Zero, the City revisited
its bicycle strategies and released the Safer Cycling report, which identified
10 new Priority Bicycle Districts as the focus of future bicycle lane construc-
tion. The City also implemented a multifaceted strategy that integrates transit
improvements with street safety along some of New York’s busiest corridors.
VISION ZERO YEAR FOUR REPORT24
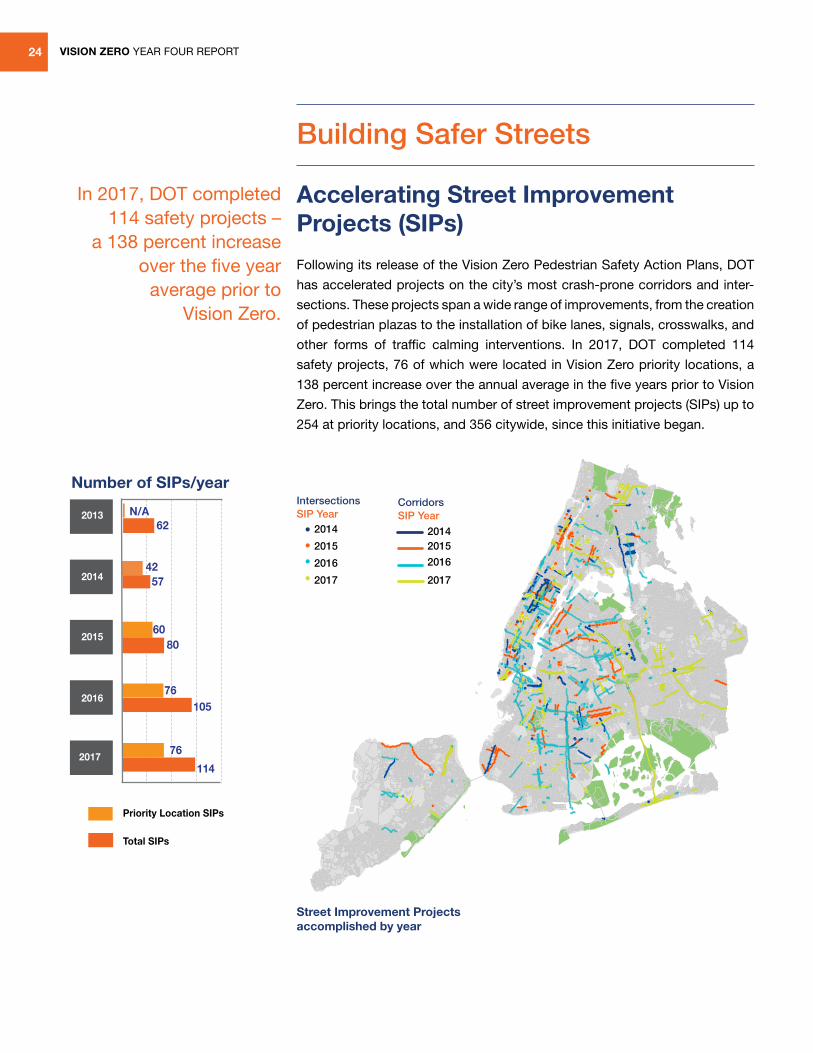
Accelerating Street Improvement Projects (SIPs)
Following its release of the Vision Zero Pedestrian Safety Action Plans, DOT
has accelerated projects on the city’s most crash-prone corridors and inter-
sections. These projects span a wide range of improvements, from the creation
of pedestrian plazas to the installation of bike lanes, signals, crosswalks, and
other forms of traffic calming interventions. In 2017, DOT completed 114
safety projects, 76 of which were located in Vision Zero priority locations, a
138 percent increase over the annual average in the five years prior to Vision
Zero. This brings the total number of street improvement projects (SIPs) up to
254 at priority locations, and 356 citywide, since this initiative began.
In 2017, DOT completed 114 safety projects –
a 138 percent increase over the five year
average prior to Vision Zero.
2013
2014
2015
2016
2017114
105
76
76
60
5742
N/A62
80
Priority Location SIPs
Total SIPs
Number of SIPs/year
Building Safer Streets
IntersectionsSIP Year
2014
2015
2016
CorridorsSIP Year
20142015
2016
20172017
Number of SIPs/year
Street Improvement Projects accomplished by year
LPI Map
VISION ZERO YEAR FOUR REPORT 25
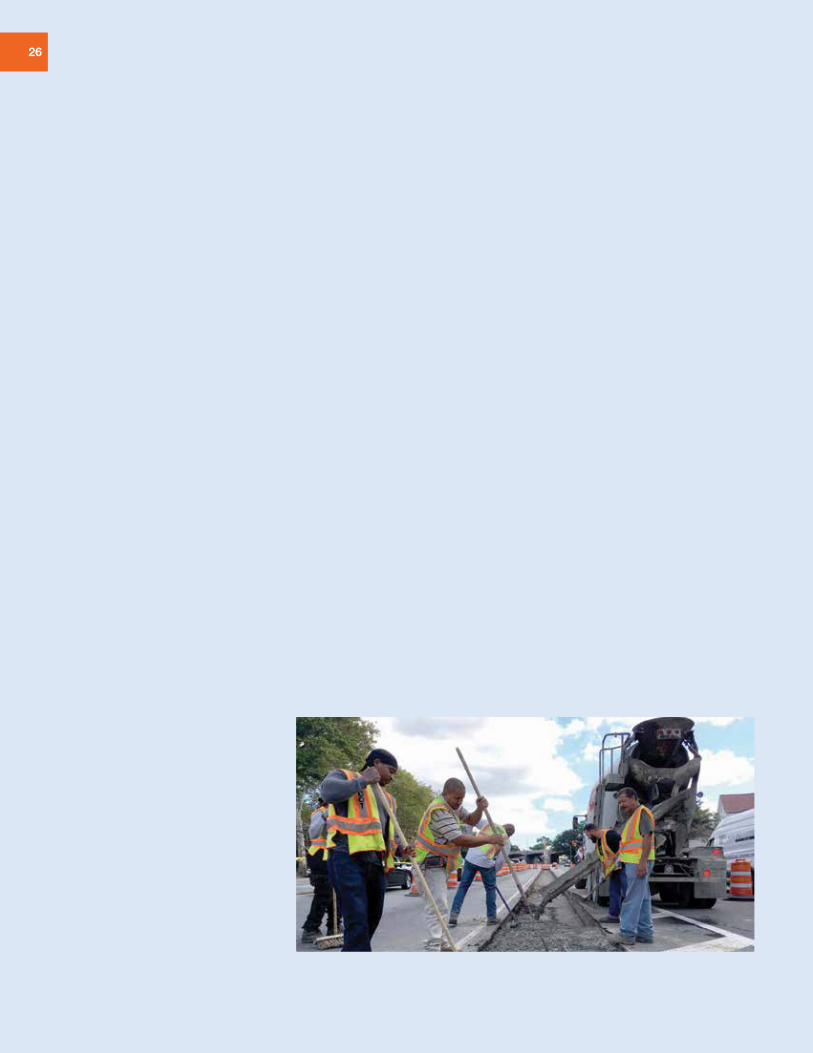
Installing Left Turning Traffic Calming Interventions
Using findings from its data-driven Left Turn Pedestrian and Bicyclist Crash Study, DOT installed hardened centerlines and slow turn wedges at 110 more intersections with high numbers of pedestrian and cyclist injuries caused by turning vehicles. These treatments have been proven to reduce median left turn speeds by 24 percent. A total of 217 intersections have received new left turn safety treatments since the start of 2016.
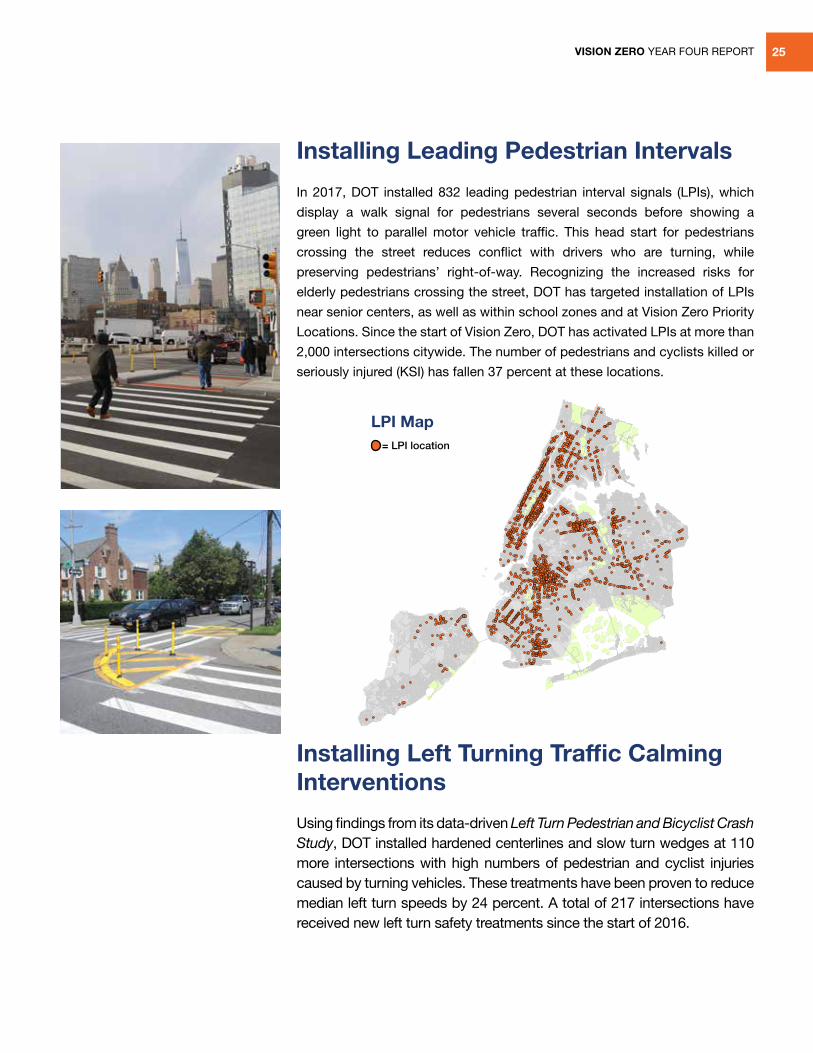
Installing Leading Pedestrian Intervals
In 2017, DOT installed 832 leading pedestrian interval signals (LPIs), which
display a walk signal for pedestrians several seconds before showing a
green light to parallel motor vehicle traffic. This head start for pedestrians
crossing the street reduces conflict with drivers who are turning, while
preserving pedestrians’ right-of-way. Recognizing the increased risks for
elderly pedestrians crossing the street, DOT has targeted installation of LPIs
near senior centers, as well as within school zones and at Vision Zero Priority
Locations. Since the start of Vision Zero, DOT has activated LPIs at more than
2,000 intersections citywide. The number of pedestrians and cyclists killed or
seriously injured (KSI) has fallen 37 percent at these locations.
= LPI location
VISION ZERO YEAR FOUR REPORT
Together, Woodhaven and Cross
Bay Boulevards form the largest
north-south arterial in Queens,
stretching 11 miles between Queens
Boulevard and the Rockaways and
spanning a width of up to 195 feet at
points. Over 30,000 bus riders travel
on the corridor every day. High traffic
speeds and long crossing distances
detracted from pedestrian safety,
and traffic bottlenecks contributed to
long travel times for bus passengers.
Due to its high number of pedestrian
KSIs, the segment between Queens
Boulevard and the northern end of
the Joseph P. Addabbo Memorial
Bridge has been designated a Vision
Zero Priority Corridor.
DOT and MTA first identified
Woodhaven and Cross Bay
Boulevards as locations for bus
service improvements in 2009, after
soliciting extensive feedback from
local neighborhoods that have his-
torically suffered from few transit
options and long commute times.
Though short-term improvements
were implemented between 2011
and 2014, Vision Zero prioritized
both safety and transit enhancement,
with roadway capital improvements
accompanying the development of
Select Bus Service.
In November 2017, Woodhaven-
Cross Bay Boulevards Select Bus
Service launched on the Q52 and
Q53 routes. Bus island construc-
tion, bus lane enforcement, signal
upgrades, and updated street
markings have improved bus travel
times, increased pedestrian safety,
and made traffic smoother and more
predictable. A critical safety project
along Woodhaven Boulevard from
Union Turnpike to 81st Road created
a simpler central median with a
pedestrian refuge, added turn restric-
tions, and created a turn bay at two
high-crash locations. As construction
continues in 2018, DOT will monitor
conditions and make necessary
adjustments for optimal service.
Woodhaven and Cross Bay Boulevards Spotlight
26
VISION ZERO YEAR FOUR REPORT 27
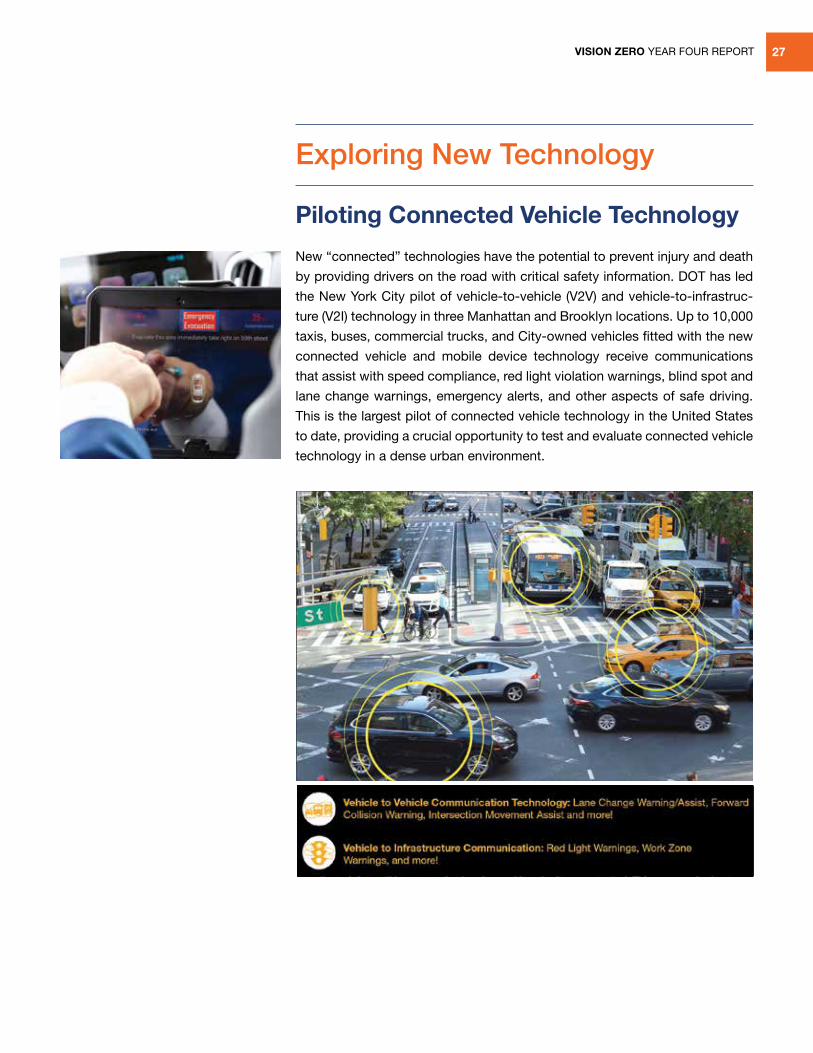
Piloting Connected Vehicle Technology
New “connected” technologies have the potential to prevent injury and death
by providing drivers on the road with critical safety information. DOT has led
the New York City pilot of vehicle-to-vehicle (V2V) and vehicle-to-infrastruc-
ture (V2I) technology in three Manhattan and Brooklyn locations. Up to 10,000
taxis, buses, commercial trucks, and City-owned vehicles fitted with the new
connected vehicle and mobile device technology receive communications
that assist with speed compliance, red light violation warnings, blind spot and
lane change warnings, emergency alerts, and other aspects of safe driving.
This is the largest pilot of connected vehicle technology in the United States
to date, providing a crucial opportunity to test and evaluate connected vehicle
technology in a dense urban environment.
Exploring New Technology
VISION ZERO YEAR FOUR REPORT28
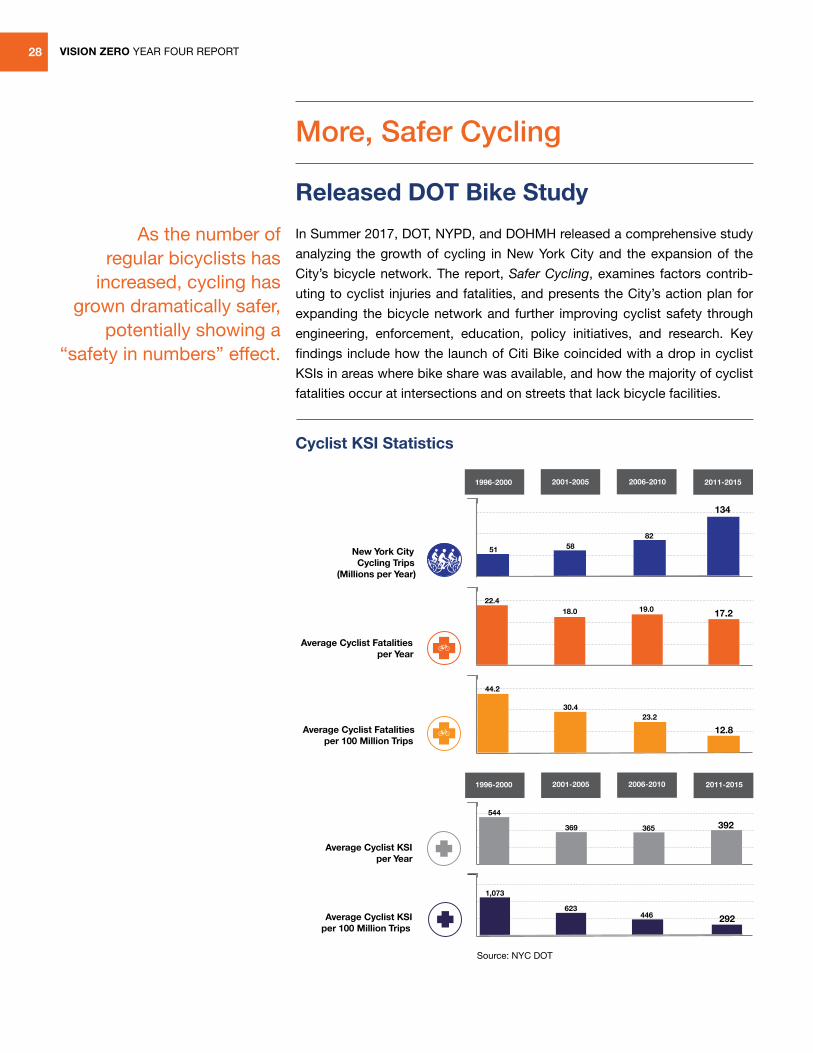
Released DOT Bike Study
In Summer 2017, DOT, NYPD, and DOHMH released a comprehensive study
analyzing the growth of cycling in New York City and the expansion of the
City’s bicycle network. The report, Safer Cycling, examines factors contrib-
uting to cyclist injuries and fatalities, and presents the City’s action plan for
expanding the bicycle network and further improving cyclist safety through
engineering, enforcement, education, policy initiatives, and research. Key
findings include how the launch of Citi Bike coincided with a drop in cyclist
KSIs in areas where bike share was available, and how the majority of cyclist
fatalities occur at intersections and on streets that lack bicycle facilities.
More, Safer Cycling
•
•
•
2001-2005 2006-20101996-2000
17.222.4
18.0 19.0
2011-2015
51 5882
134
44.2
30.423.2
12.8
392544
369 365
1,073
623446 292
2001-2005 2006-20101996-2000 2011-2015
New York City Cycling Trips
(Millions per Year)
Average Cyclist Fatalities per 100 Million Trips
Average Cyclist Fatalities per Year
Average Cyclist KSIper 100 Million Trips
Average Cyclist KSI per Year
As the number of regular bicyclists has
increased, cycling has grown dramatically safer,
potentially showing a “safety in numbers” effect.
Cyclist KSI Statistics
Source: NYC DOT
VISION ZERO YEAR FOUR REPORT 29
About four in five New Yorkers now live within a quarter mile
of a bicycle facility.
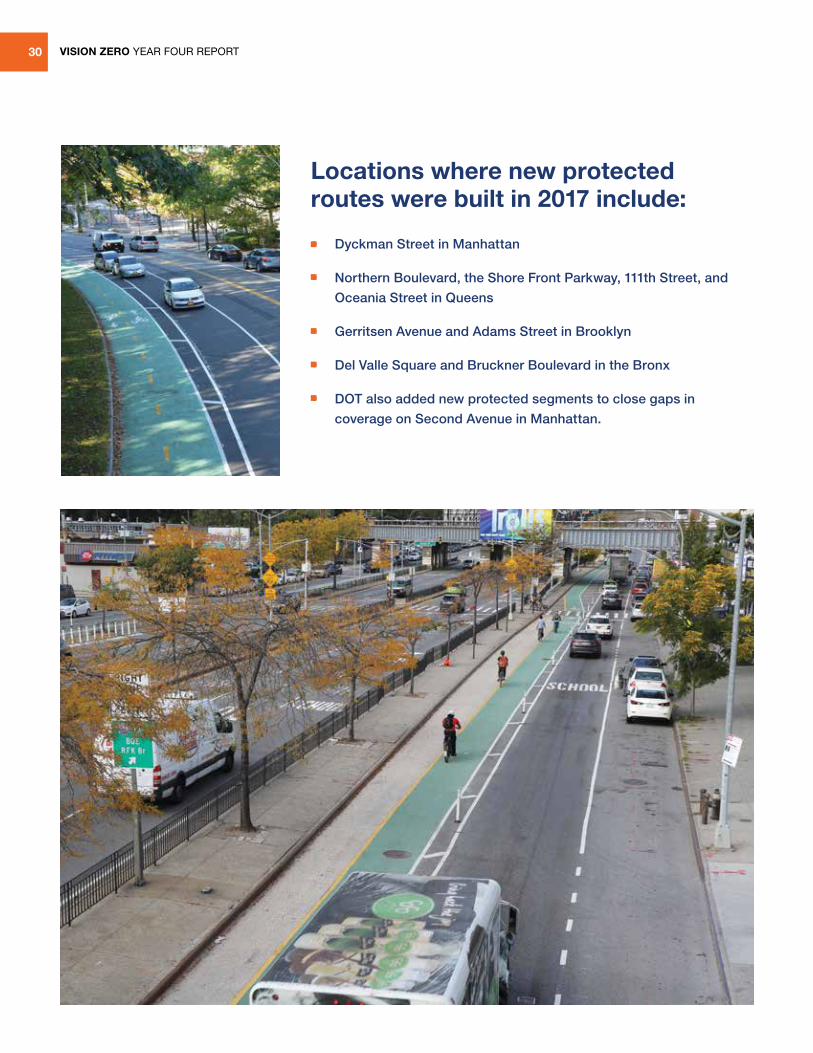
Expanding Protected Bike Lanes
Bicycle network expansion is at the core of the City’s strategy to increase the
number of people who cycle. In 2017, DOT built 41 miles of conventional lanes
and 25 miles of protected bike lanes. DOT will continue to install or enhance
a total of at least 50 bicycle lane miles, including 10 protected lane miles, per
year. DOT aims to increase the proportion of New Yorkers living near a bicycle
facility to 90 percent by 2022, reflecting the City’s goal of providing more op-
portunities for safe cycling outside of Manhattan.
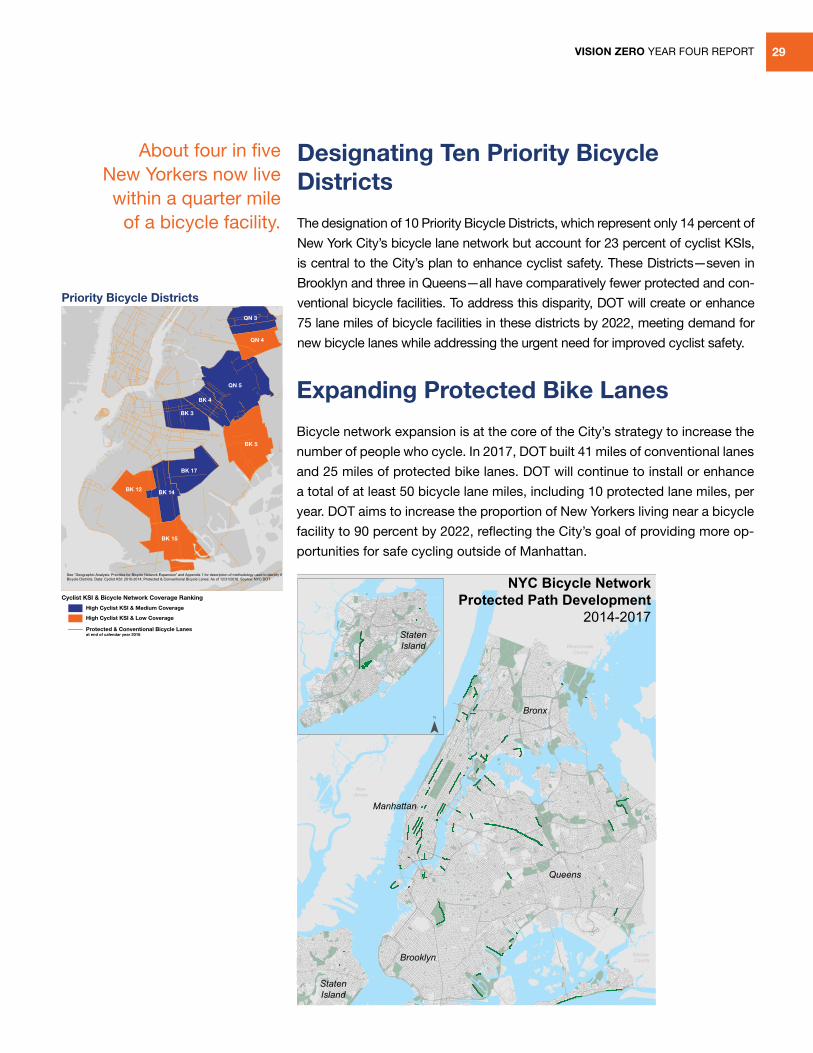
Designating Ten Priority Bicycle Districts
The designation of 10 Priority Bicycle Districts, which represent only 14 percent of
New York City’s bicycle lane network but account for 23 percent of cyclist KSIs,
is central to the City’s plan to enhance cyclist safety. These Districts—seven in
Brooklyn and three in Queens—all have comparatively fewer protected and con-
ventional bicycle facilities. To address this disparity, DOT will create or enhance
75 lane miles of bicycle facilities in these districts by 2022, meeting demand for
new bicycle lanes while addressing the urgent need for improved cyclist safety.QN 4
QN 5
BK 5
BK 4
BK 3
BK 17
BK 14BK 12
BK 15
QN 3
Priority Bicycle Districts
Cyclist KSI & Bicycle Network Coverage Ranking
High Cyclist KSI & Medium Coverage
Protected & Conventional Bicycle Lanes at end of calendar year 2016
High Cyclist KSI & Low Coverage
See “Geographic Analysis: Priorities for Bicycle Network Expansion” and Appendix 1 for description of methodology used to identify the Priority Bicycle Districts. Data: Cyclist KSI: 2010-2014; Protected & Conventional Bicycle Lanes: As of 12/31/2016. Source: NYC DOT
Brooklyn
Queens
Bronx
StatenIsland
StatenIsland
NewJersey
Westchester County
Nassau County
NYC Bicycle NetworkProtected Path Development
2014-2017
Manhattan
¯
¯
Priority Bicycle Districts
VISION ZERO YEAR FOUR REPORT30
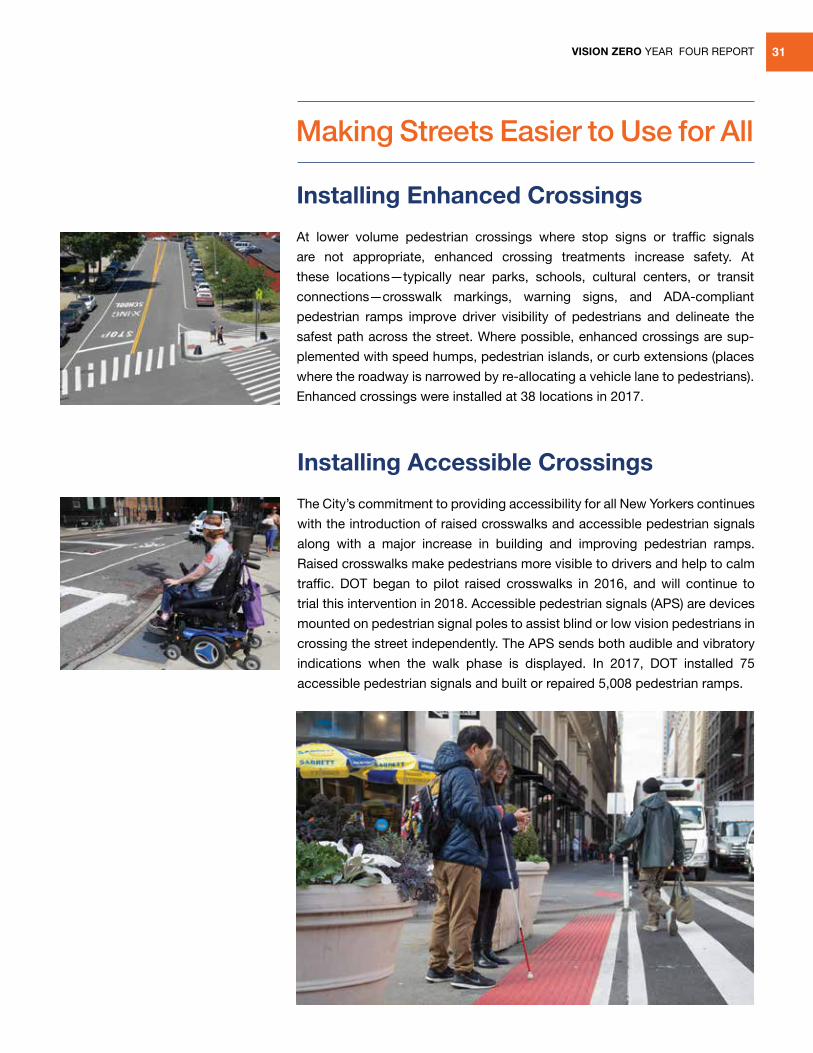
Locations where new protected routes were built in 2017 include:
• Dyckman Street in Manhattan
• Northern Boulevard, the Shore Front Parkway, 111th Street, and
Oceania Street in Queens
• Gerritsen Avenue and Adams Street in Brooklyn
• Del Valle Square and Bruckner Boulevard in the Bronx
• DOT also added new protected segments to close gaps in
coverage on Second Avenue in Manhattan.
VISION ZERO YEAR FOUR REPORT 31
Installing Enhanced Crossings
At lower volume pedestrian crossings where stop signs or traffic signals
are not appropriate, enhanced crossing treatments increase safety. At
these locations—typically near parks, schools, cultural centers, or transit
connections—crosswalk markings, warning signs, and ADA-compliant
pedestrian ramps improve driver visibility of pedestrians and delineate the
safest path across the street. Where possible, enhanced crossings are sup-
plemented with speed humps, pedestrian islands, or curb extensions (places
where the roadway is narrowed by re-allocating a vehicle lane to pedestrians).
Enhanced crossings were installed at 38 locations in 2017.
Making Streets Easier to Use for All
Installing Accessible Crossings
The City’s commitment to providing accessibility for all New Yorkers continues
with the introduction of raised crosswalks and accessible pedestrian signals
along with a major increase in building and improving pedestrian ramps.
Raised crosswalks make pedestrians more visible to drivers and help to calm
traffic. DOT began to pilot raised crosswalks in 2016, and will continue to
trial this intervention in 2018. Accessible pedestrian signals (APS) are devices
mounted on pedestrian signal poles to assist blind or low vision pedestrians in
crossing the street independently. The APS sends both audible and vibratory
indications when the walk phase is displayed. In 2017, DOT installed 75
accessible pedestrian signals and built or repaired 5,008 pedestrian ramps.
VISION ZERO YEAR FOUR REPORT32
VISION ZERO YEAR FOUR REPORT 33
Enforcement
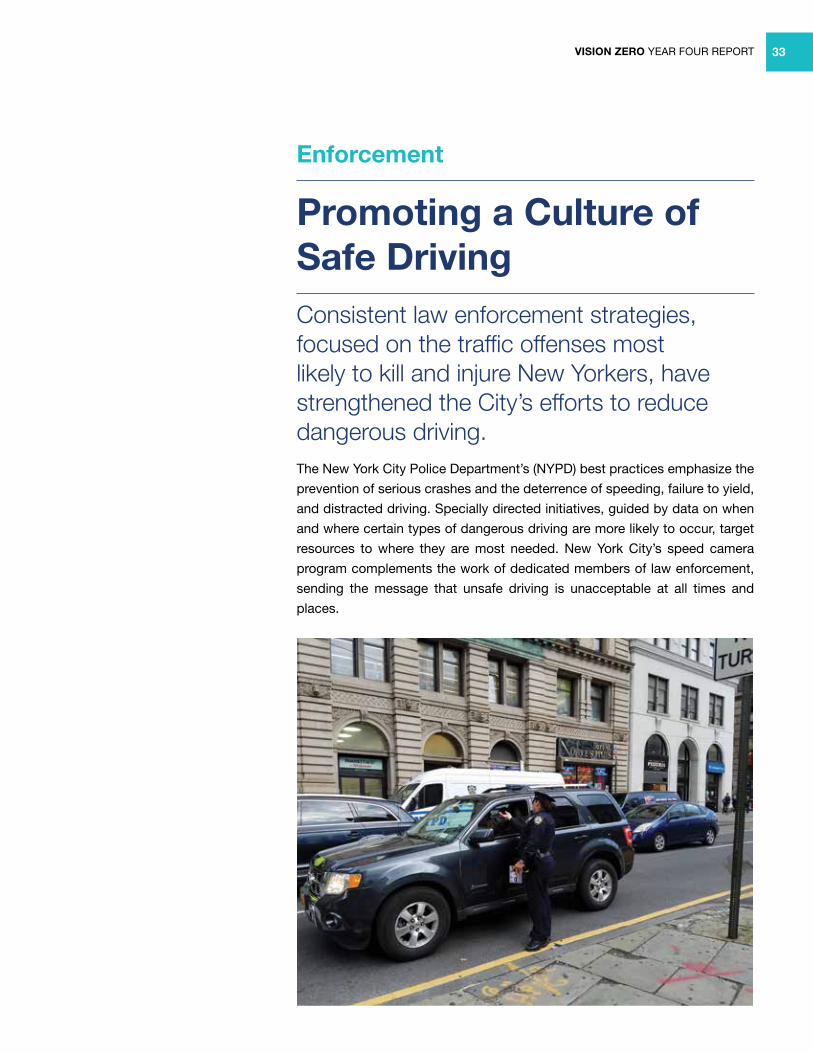
Promoting a Culture of Safe DrivingConsistent law enforcement strategies, focused on the traffic offenses most likely to kill and injure New Yorkers, have strengthened the City’s efforts to reduce dangerous driving.The New York City Police Department’s (NYPD) best practices emphasize the
prevention of serious crashes and the deterrence of speeding, failure to yield,
and distracted driving. Specially directed initiatives, guided by data on when
and where certain types of dangerous driving are more likely to occur, target
resources to where they are most needed. New York City’s speed camera
program complements the work of dedicated members of law enforcement,
sending the message that unsafe driving is unacceptable at all times and
places.
VISION ZERO YEAR FOUR REPORT34
Focusing Enforcement Efforts
The foundation of NYPD’s Vision Zero strategy is using enforcement to stop
collisions before they happen. Speeding, failure to yield to pedestrians, cell
phone use, disobeying signs, illegal turns, and failure to stop on signal are
the primary causes of traffic injuries and fatalities. Known as the “Vision Zero
violations,” these infractions are prioritized to combat dangerous driving and
prevent tragedies.
With an increased focus on the most hazardous behaviors, NYPD has
developed new approaches for distributing enforcement resources more
efficiently and is working to change the current motorist culture that too
often ignores drivers' roles in creating dangerous conditions for motorists,
pedestrians, and bicyclists. Through rigorous enforcement, NYPD is commu-
nicating to motorists that the City will not accept dangerous driving.
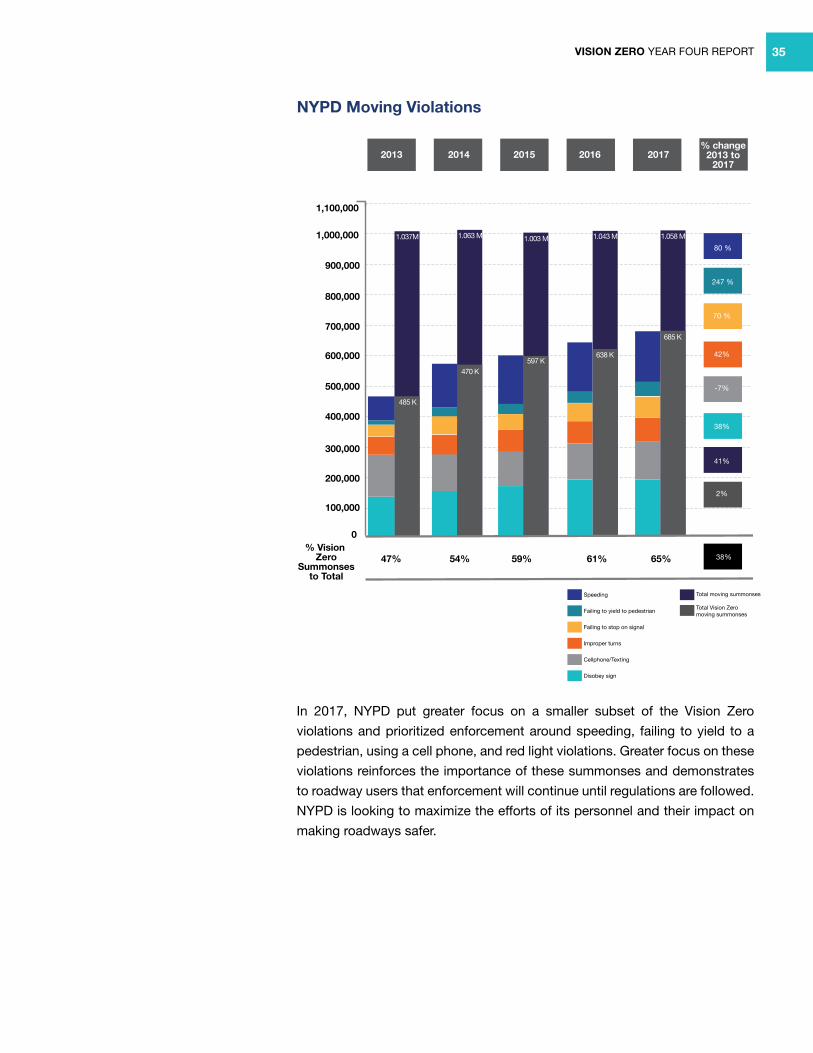
As part of its effort to crack down on dangerous driving, NYPD has strived to
make the six Vision Zero violations a larger percentage of the total summons
issued by the Department. The following chart illustrates the progress made
from 2013, the year before Vision Zero began.
Vision Zero Violations are prioritized to combat
dangerous driving.
Changing Driver Behavior
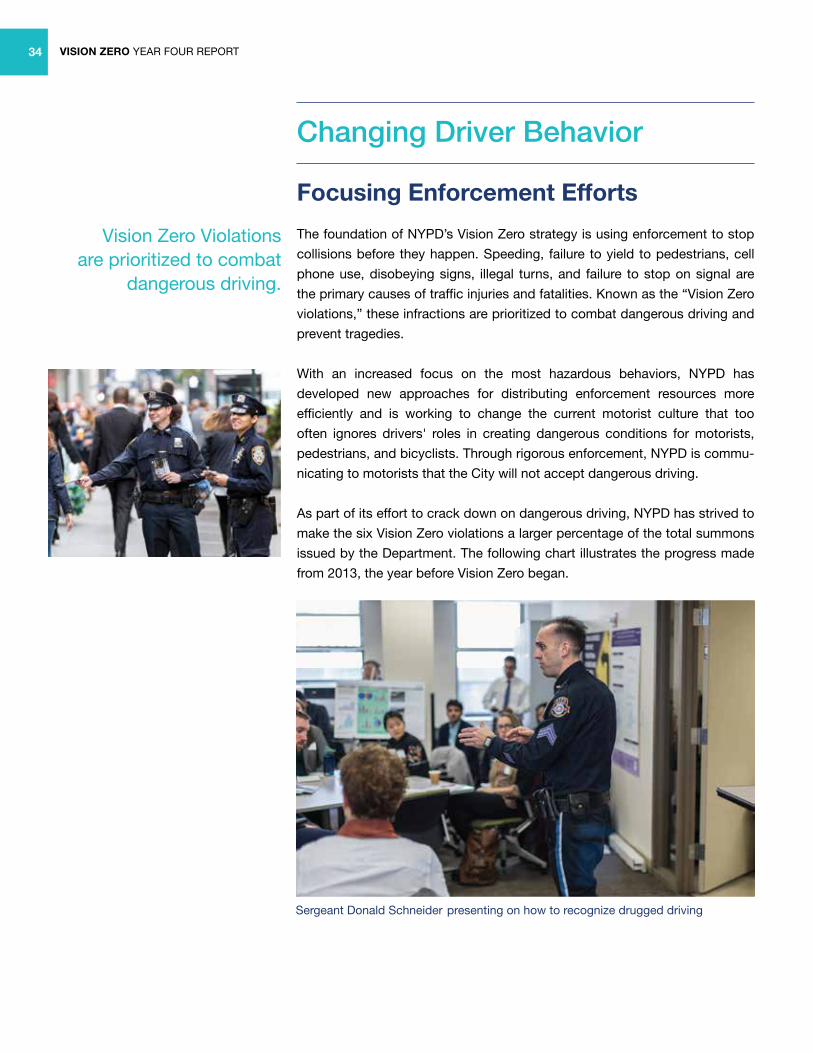
Sergeant Donald Schneider presenting on how to recognize drugged driving
VISION ZERO YEAR FOUR REPORT 35
In 2017, NYPD put greater focus on a smaller subset of the Vision Zero
violations and prioritized enforcement around speeding, failing to yield to a
pedestrian, using a cell phone, and red light violations. Greater focus on these
violations reinforces the importance of these summonses and demonstrates
to roadway users that enforcement will continue until regulations are followed.
NYPD is looking to maximize the efforts of its personnel and their impact on
making roadways safer.
2013
0
100,000
200,000
300,000
400,000
47% 54% 59% 61% 65%
500,000
600,000
700,000
800,000
900,000
1,000,000
1,100,000
2014 2015 2016 2017% change
2013 to2017
Speeding
Failing to yield to pedestrian
Failing to stop on signal
Improper turns
Cellphone/Texting
Disobey sign
Total Vision Zero moving summonses
Total moving summonses
80 %
247 %
70 %
42%
-7%
38%
41%
2%
38%
1.037M
485 K
470 K597 K
638 K
685 K
1.063 M 1.003 M 1.043 M 1.058 M
% Vision Zero
Summonsesto Total
NYPD Moving Violations
VISION ZERO YEAR FOUR REPORT36
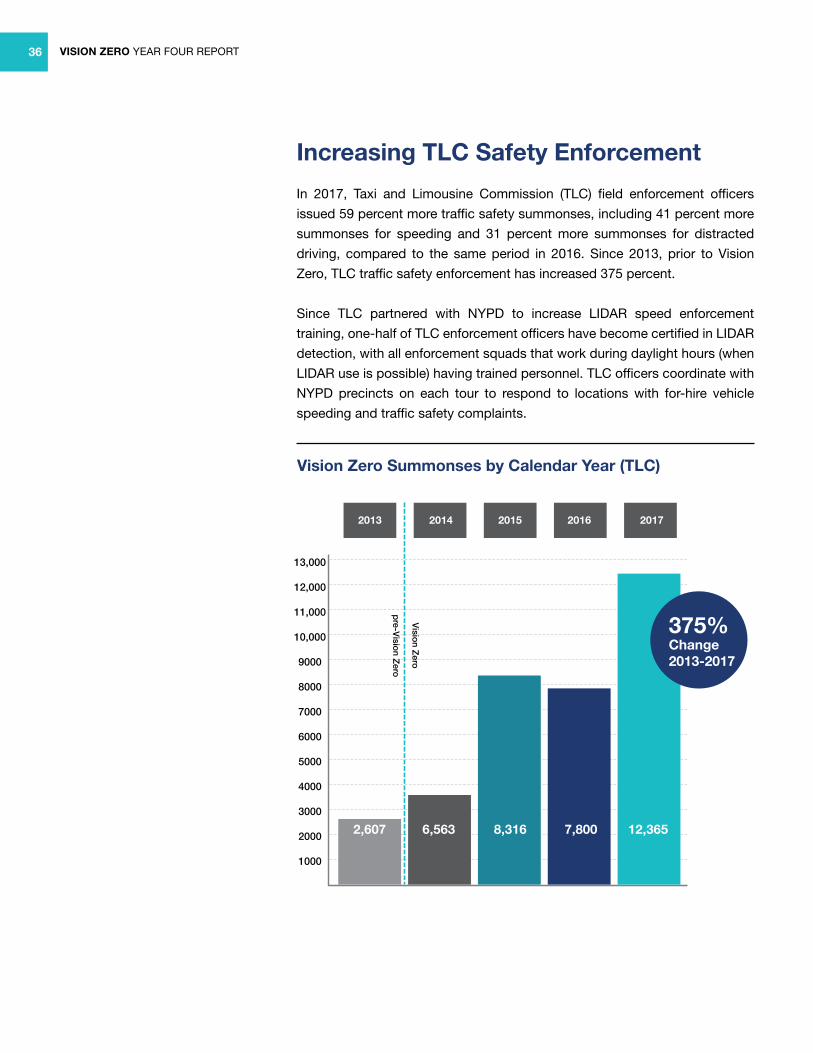
Increasing TLC Safety Enforcement
In 2017, Taxi and Limousine Commission (TLC) field enforcement officers
issued 59 percent more traffic safety summonses, including 41 percent more
summonses for speeding and 31 percent more summonses for distracted
driving, compared to the same period in 2016. Since 2013, prior to Vision
Zero, TLC traffic safety enforcement has increased 375 percent.
Since TLC partnered with NYPD to increase LIDAR speed enforcement
training, one-half of TLC enforcement officers have become certified in LIDAR
detection, with all enforcement squads that work during daylight hours (when
LIDAR use is possible) having trained personnel. TLC officers coordinate with
NYPD precincts on each tour to respond to locations with for-hire vehicle
speeding and traffic safety complaints.
•
2013 2014 2015 2016 2017
2,607 6,563 8,316 7,800 12,365
1000
2000
3000
4000
5000
6000
7000
8000
9000
10,000
11,000
12,000
13,000
pre-Vision Zero
Vision Zero
375%
Change2013-2017
Vision Zero Summonses by Calendar Year (TLC)
VISION ZERO YEAR FOUR REPORT 37
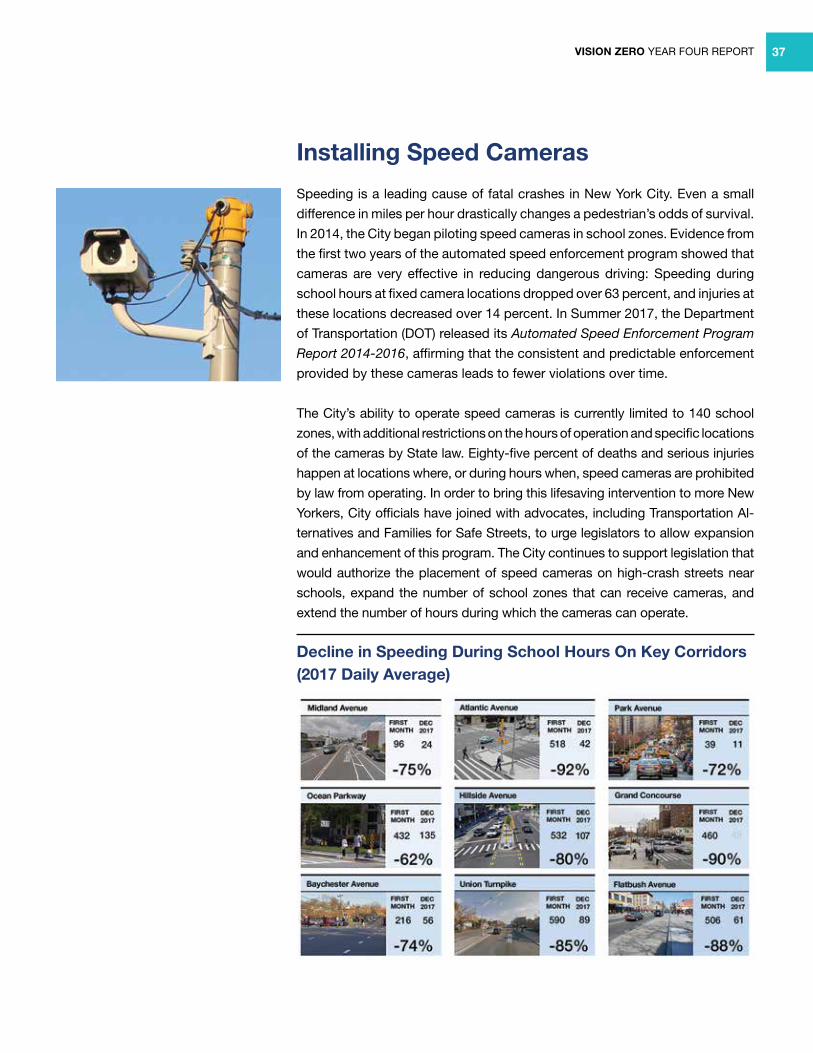
Installing Speed Cameras
Speeding is a leading cause of fatal crashes in New York City. Even a small
difference in miles per hour drastically changes a pedestrian’s odds of survival.
In 2014, the City began piloting speed cameras in school zones. Evidence from
the first two years of the automated speed enforcement program showed that
cameras are very effective in reducing dangerous driving: Speeding during
school hours at fixed camera locations dropped over 63 percent, and injuries at
these locations decreased over 14 percent. In Summer 2017, the Department
of Transportation (DOT) released its Automated Speed Enforcement Program
Report 2014-2016, affirming that the consistent and predictable enforcement
provided by these cameras leads to fewer violations over time.
The City’s ability to operate speed cameras is currently limited to 140 school
zones, with additional restrictions on the hours of operation and specific locations
of the cameras by State law. Eighty-five percent of deaths and serious injuries
happen at locations where, or during hours when, speed cameras are prohibited
by law from operating. In order to bring this lifesaving intervention to more New
Yorkers, City officials have joined with advocates, including Transportation Al-
ternatives and Families for Safe Streets, to urge legislators to allow expansion
and enhancement of this program. The City continues to support legislation that
would authorize the placement of speed cameras on high-crash streets near
schools, expand the number of school zones that can receive cameras, and
extend the number of hours during which the cameras can operate.
Decline in Speeding During School Hours On Key Corridors (2017 Daily Average)
VISION ZERO YEAR FOUR REPORT
Employing Warnings as Educational Tools
Since the launch of Vision Zero, TLC has been reviewing and revising its
enforcement strategies to ensure penalties are appropriate and to emphasize
the important role education plays in promoting safety. In 2017, TLC
developed a new approach for handling vehicle maintenance violations, such
as broken tail lights, to improve compliance by prioritizing remediation of
safety violations over penalties. Rather than issuing a fine, TLC now provides
drivers with a notice of violation (NOV) that allows adequate time to remedy
the issue and have the vehicle re-inspected by TLC without a financial penalty.
Similarly, when TLC launched its red light camera enforcement program in
2014, it issued warnings before issuing penalties. Going forward, TLC will
employ the same enforcement strategy for the new fatigued driving prevention
rules. Warnings help ensure that drivers understand the rules and have an
opportunity to change their behavior before being subjected to financial or
more serious penalties.
38
CRASHESBefore Period,
CitywideAfter Period,
Citywide*Percent
Change
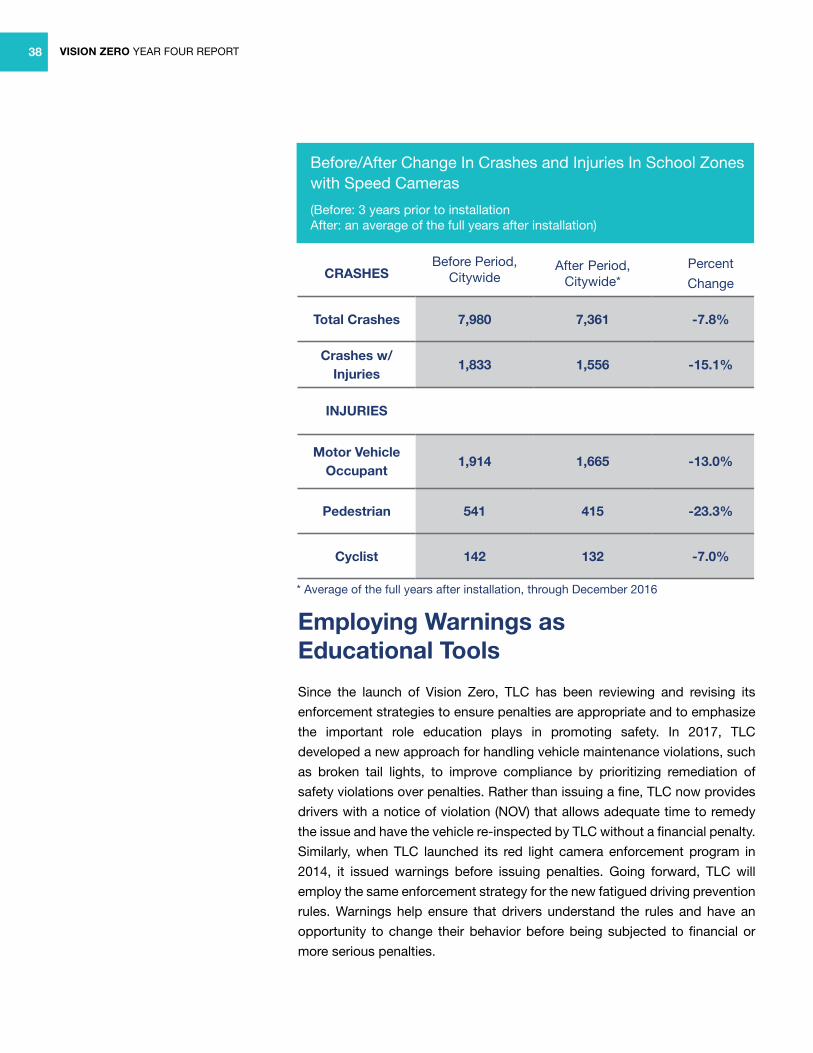
Total Crashes 7,980 7,361 -7.8%
Crashes w/ Injuries
1,833 1,556 -15.1%
INJURIES
Motor Vehicle Occupant
1,914 1,665 -13.0%
Pedestrian 541 415 -23.3%
Cyclist 142 132 -7.0%
Before/After Change In Crashes and Injuries In School Zones with Speed Cameras (Before: 3 years prior to installation After: an average of the full years after installation)
* Average of the full years after installation, through December 2016
CRASHESBefore Period,
CitywideAfter Period,
Citywide*Percent
Change
Total Crashes 7,980 7,361 -7.8%
Crashes w/ Injuries
1,833 1,556 -15.1%
INJURIES
Motor Vehicle Occupant
1,914 1,665 -13.0%
Pedestrian 541 415 -23.3%
Cyclist 142 132 -7.0%
VISION ZERO YEAR FOUR REPORT 39
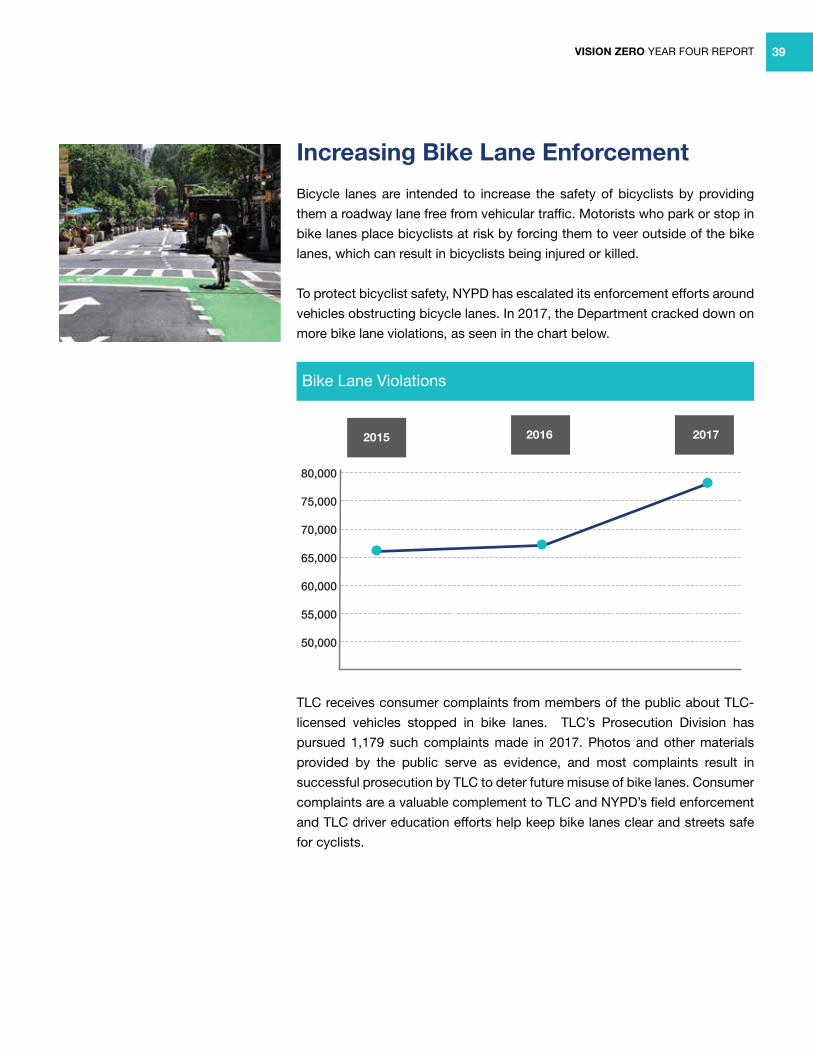
Increasing Bike Lane Enforcement
Bicycle lanes are intended to increase the safety of bicyclists by providing
them a roadway lane free from vehicular traffic. Motorists who park or stop in
bike lanes place bicyclists at risk by forcing them to veer outside of the bike
lanes, which can result in bicyclists being injured or killed.
To protect bicyclist safety, NYPD has escalated its enforcement efforts around
vehicles obstructing bicycle lanes. In 2017, the Department cracked down on
more bike lane violations, as seen in the chart below.
39
• 2015 2016 2017
2,607 6,563 8,316 7,800 12,365
50,000
55,000
60,000
65,000
70,000
75,000
80,000
Bike Lane Violations
TLC receives consumer complaints from members of the public about TLC-
licensed vehicles stopped in bike lanes. TLC’s Prosecution Division has
pursued 1,179 such complaints made in 2017. Photos and other materials
provided by the public serve as evidence, and most complaints result in
successful prosecution by TLC to deter future misuse of bike lanes. Consumer
complaints are a valuable complement to TLC and NYPD’s field enforcement
and TLC driver education efforts help keep bike lanes clear and streets safe
for cyclists.
VISION ZERO YEAR FOUR REPORT
Combating Unlicensed and Unsafe Commuter Vans
With a focus on commuter van safety for both passengers and other street
users, TLC collaborates with the NYPD to combat unlicensed and unsafe van
operation in the city through joint enforcement operations. In June 2017, TLC
and NYPD updated their enforcement strategies for common commuter van
corridors in Brooklyn and Queens.
TLC conducted five surge operations with an entirely uniformed force and
the TLC Mobile Command Post vehicle in Brooklyn, Queens and lower
Manhattan. During surge operations, an average of 40 uniformed TLC officers
patrol commuter van corridors, targeting specific van routes to proactively
deter unlicensed activity. TLC also seizes the vehicles of repeat offenders of
unlicensed operation, pending forfeiture, thus taking them off the street. TLC
officers engage with TLC-licensed drivers, members of the public, and local
NYPD precincts, reinforcing Vision Zero’s goal of safe for-hire transportation
service.
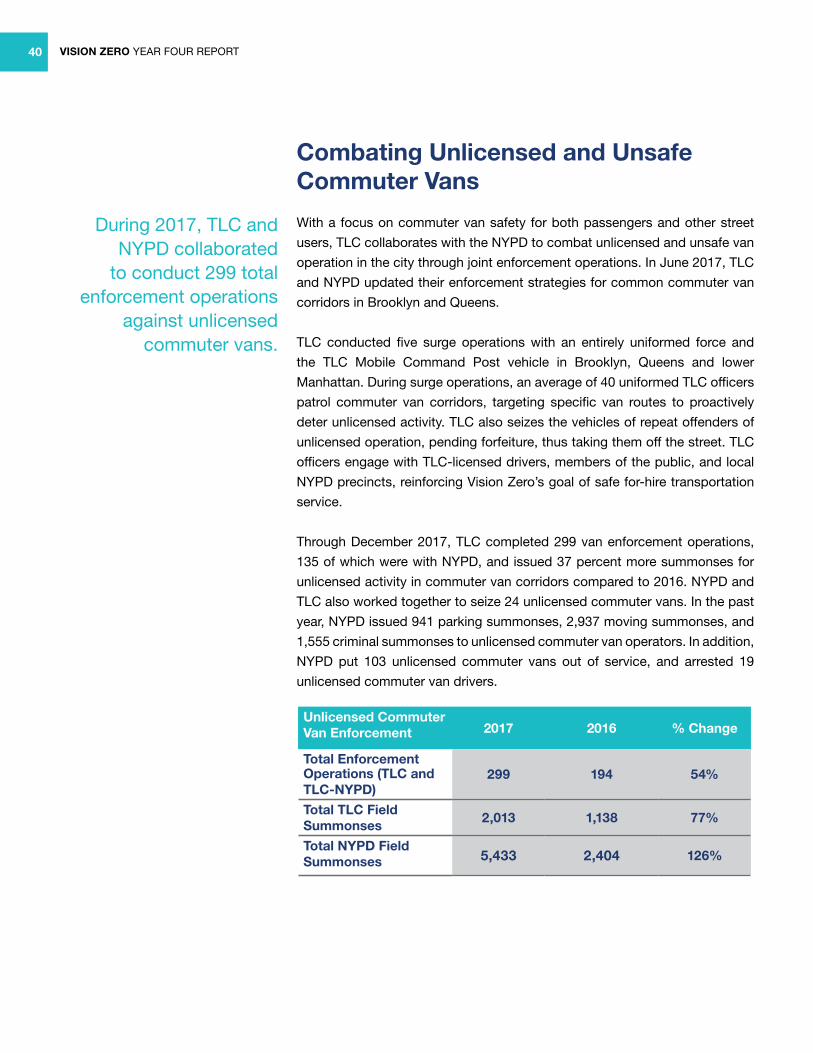
Through December 2017, TLC completed 299 van enforcement operations,
135 of which were with NYPD, and issued 37 percent more summonses for
unlicensed activity in commuter van corridors compared to 2016. NYPD and
TLC also worked together to seize 24 unlicensed commuter vans. In the past
year, NYPD issued 941 parking summonses, 2,937 moving summonses, and
1,555 criminal summonses to unlicensed commuter van operators. In addition,
NYPD put 103 unlicensed commuter vans out of service, and arrested 19
unlicensed commuter van drivers.
Unlicensed Commuter Van Enforcement 2017 2016 % Change
Total Enforcement Operations (TLC and TLC-NYPD)
299 194 54%
Total TLC Field Summonses
2,013 1,138 77%
Total NYPD Field Summonses 5,433 2,404 126%
40
During 2017, TLC and NYPD collaborated
to conduct 299 total enforcement operations
against unlicensed commuter vans.
VISION ZERO YEAR FOUR REPORT 41
Expanding Criteria for Investigating Collisions
The Collision Investigation Squad (CIS) investigates collisions that result in life-
threatening or fatal injuries. The primary responsibility of CIS is to determine
the causes of the collision and if there was any criminality involved. CIS
detectives conduct upwards of 400 investigations a year.
CIS technicians reconstruct the collision scene by examining evidence, inter-
viewing witnesses, locating and reviewing video, and using modern investiga-
tive techniques to bring justice to traffic victims and their families.
In 2017, NYPD expanded the criteria for what triggers a CIS investigation.
These investigations now include incidents in which drivers leave the scene
of the collision after causing pedestrians to suffer injuries rendering them
unconscious. NYPD made this change, in part, to deter drivers from leaving
the scene of a collision and to emphasize its commitment to holding traffic
offenders accountable for their actions.
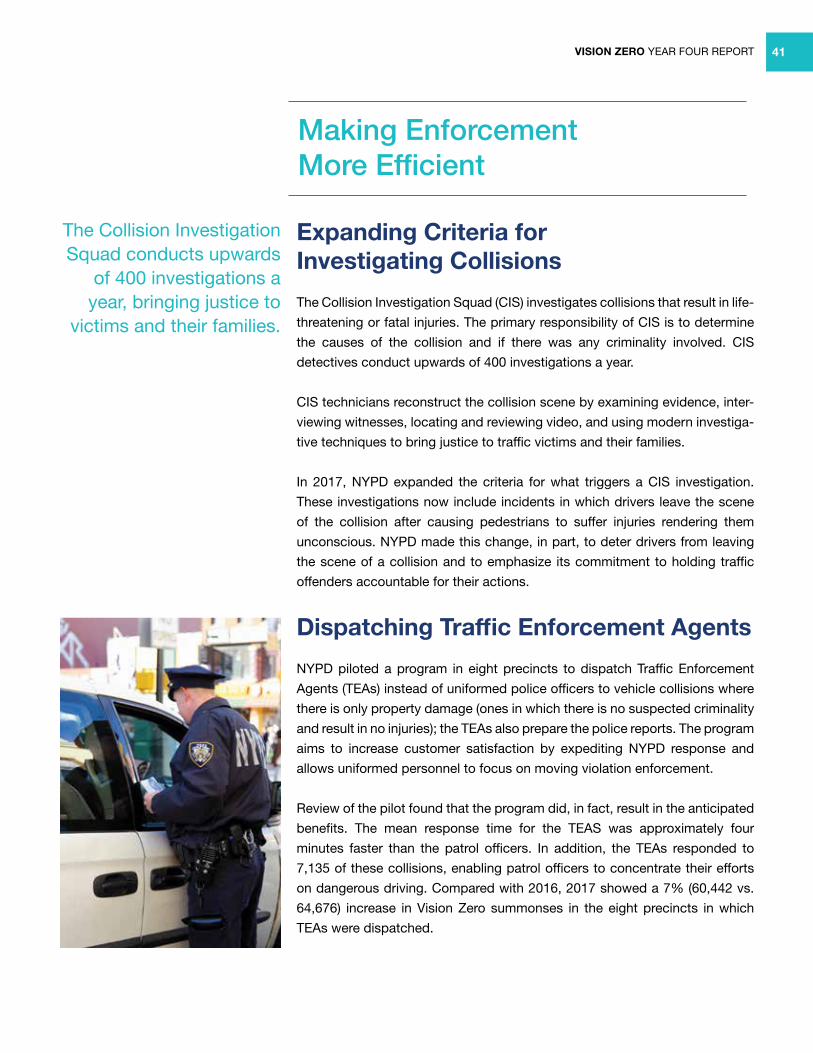
Dispatching Traffic Enforcement Agents
NYPD piloted a program in eight precincts to dispatch Traffic Enforcement
Agents (TEAs) instead of uniformed police officers to vehicle collisions where
there is only property damage (ones in which there is no suspected criminality
and result in no injuries); the TEAs also prepare the police reports. The program
aims to increase customer satisfaction by expediting NYPD response and
allows uniformed personnel to focus on moving violation enforcement.
Review of the pilot found that the program did, in fact, result in the anticipated
benefits. The mean response time for the TEAS was approximately four
minutes faster than the patrol officers. In addition, the TEAs responded to
7,135 of these collisions, enabling patrol officers to concentrate their efforts
on dangerous driving. Compared with 2016, 2017 showed a 7% (60,442 vs.
64,676) increase in Vision Zero summonses in the eight precincts in which
TEAs were dispatched.
Making Enforcement More Efficient
The Collision Investigation Squad conducts upwards
of 400 investigations a year, bringing justice to
victims and their families.
VISION ZERO YEAR FOUR REPORT42
Streamlining Record Management
NYPD developed the Finest Online Records Management System (FORMS)
to improve record management and unify records in a centralized system
with a mobile platform. FORMS provides a single interface for users to
record numerous types of incidents, including police reports that document
vehicle collisions and traffic moving summonses. It standardizes the way this
information is captured, stored, and delivered to downstream applications,
providing capabilities for field-based reporting and electronic summonsing via
mobile devices. It also allows for deeper and faster crash data analysis.
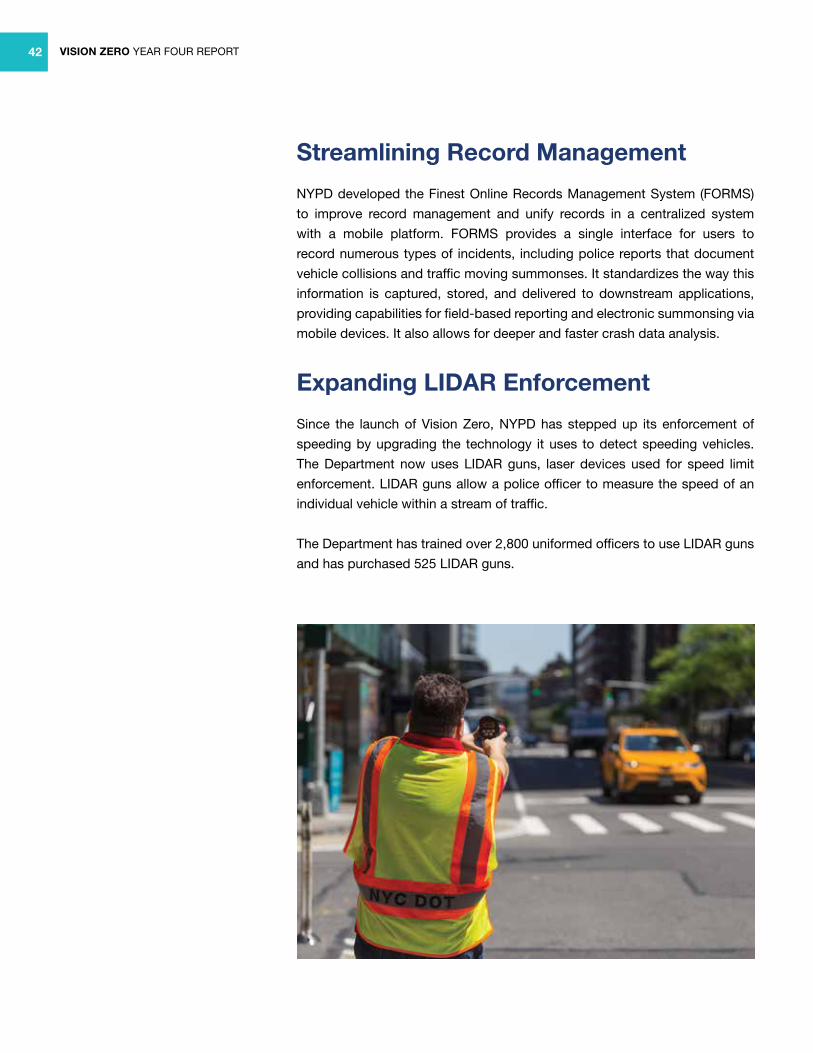
Expanding LIDAR Enforcement
Since the launch of Vision Zero, NYPD has stepped up its enforcement of
speeding by upgrading the technology it uses to detect speeding vehicles.
The Department now uses LIDAR guns, laser devices used for speed limit
enforcement. LIDAR guns allow a police officer to measure the speed of an
individual vehicle within a stream of traffic.
The Department has trained over 2,800 uniformed officers to use LIDAR guns
and has purchased 525 LIDAR guns.
VISION ZERO YEAR FOUR REPORT 43
Predicate Felony Treatment
Currently, defendants charged with a Driving While Intoxicated (DWI) violation
are screened by New York State Office of Alcoholism and Substance Abuse
Services (OASAS) counselors to determine appropriate treatment to deter
repeat violations. Despite this measure, one-third of DWI offenders drive while
intoxicated again. Currently, a driver convicted of a second, fifth, or tenth DWI
can avoid jail time completely because the defendant is always treated as a
first time offender under the sentencing guidelines. There is no mandatory
minimum jail sentence, allowing offenders to receive probation for each
successive DWI conviction. To further deter people from becoming repeat
DWI offenders, the City supports making felony DWIs for repeat offenders
subject to Second Felony Offender sentencing guidelines. A defendant who
endangers the lives of those on the street by drinking and driving would, on
their second felony DWI, be subject to a minimum of one-and-a-half to three
years in jail.
Drugged Driving
Over the past year, several high-profile cases of drivers endangering lives on
crowded New York City streets while under the influence demonstrate the
inadequacy of the current state of the law with regard to drugged drivers. The
law requires that a defendant be impaired by a drug identified on a list which
cannot be updated without the enactment of a law by the State Legislature
and Governor. If the drug is not on the list or the prosecutor cannot prove the
specific drug that caused the impairment of his condition, the charge cannot
be sustained. This list excludes many newer drugs, and without the recovery
of the drug, blood, or the statement of recent drug use, proving the impairment
was caused by a drug on the list is nearly impossible. Drivers continue to
operate motor vehicles while impaired by a mix of various drugs, leading
many to pass out behind the wheel, sometimes with children in the backseat.
District Attorneys support the elimination of reliance on a particular list and
instead will take a more common-sense approach by suggesting legislation
that prohibits driving while on any substance that impairs a driver’s physical
and mental ability to operate a motor vehicle.
Tougher Laws Against Dangerous Driving
City agencies are working to change sentencing
guidelines to better deter people from becoming repeat DWI offenders.
VISION ZERO YEAR FOUR REPORT44
Leaving the Scene of an Incident
For the last several years, the City has supported legislation to increase
criminal penalties for drivers who flee crashes so that they mirror the penalties
for impaired driving. Under current law, an impaired driver who stays at the
scene of a fatal crash risks a higher penalty than a driver who leaves the
scene, creating an unintended incentive for drivers who have been drinking
to flee. In addition, when a driver flees the scene, any alcohol or drugs in
the driver’s body will continue to dissipate, making it difficult to establish,
when and if the driver is apprehended, what alcohol or drug they were on
while driving. Pedestrians also have no recourse for medical bills against a
driver who flees the scene. While there have been past attempts to fix this
problem, all measures have failed. For the last few years, legislation has been
introduced in Albany for consideration, and the District Attorneys and the City
remain committed to finding a solution that treats drivers who flee the scene
the same way drivers who stay at the scene are treated.
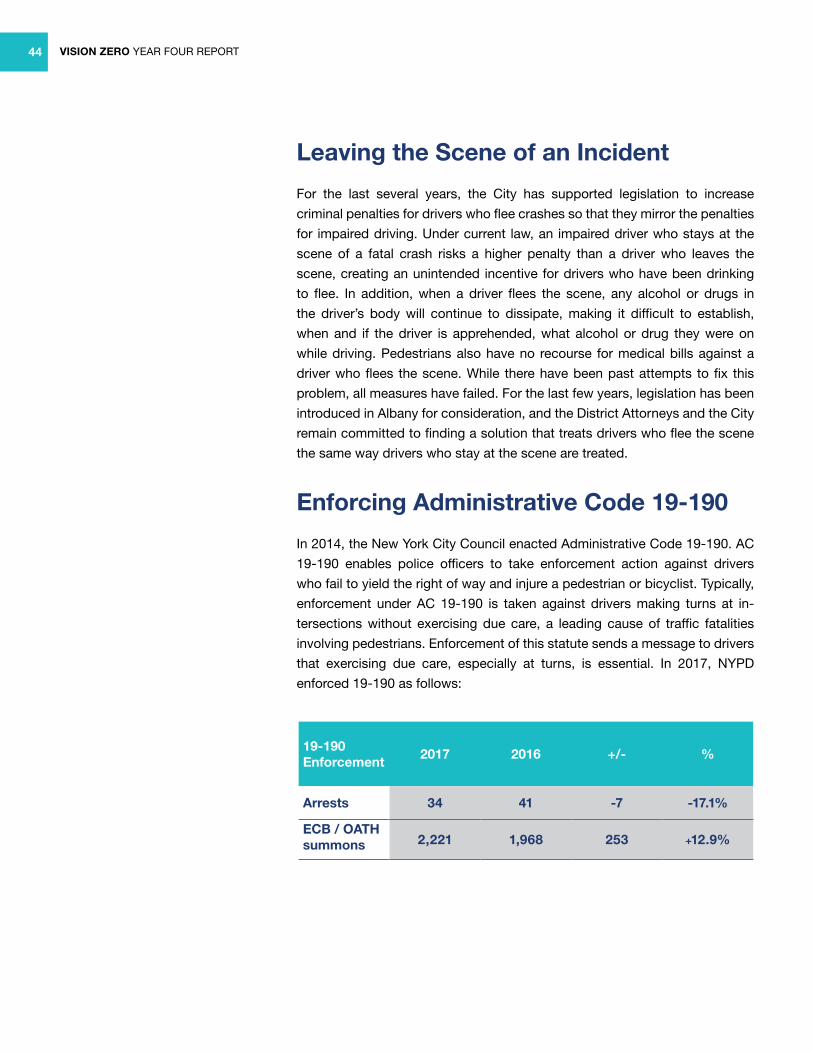
Enforcing Administrative Code 19-190
In 2014, the New York City Council enacted Administrative Code 19-190. AC
19-190 enables police officers to take enforcement action against drivers
who fail to yield the right of way and injure a pedestrian or bicyclist. Typically,
enforcement under AC 19-190 is taken against drivers making turns at in-
tersections without exercising due care, a leading cause of traffic fatalities
involving pedestrians. Enforcement of this statute sends a message to drivers
that exercising due care, especially at turns, is essential. In 2017, NYPD
enforced 19-190 as follows:
19-190 Enforcement
2017 2016 +/- %
Arrests 34 41 -7 -17.1%
ECB / OATH summons 2,221 1,968 253 +12.9%
VISION ZERO YEAR FOUR REPORT 45
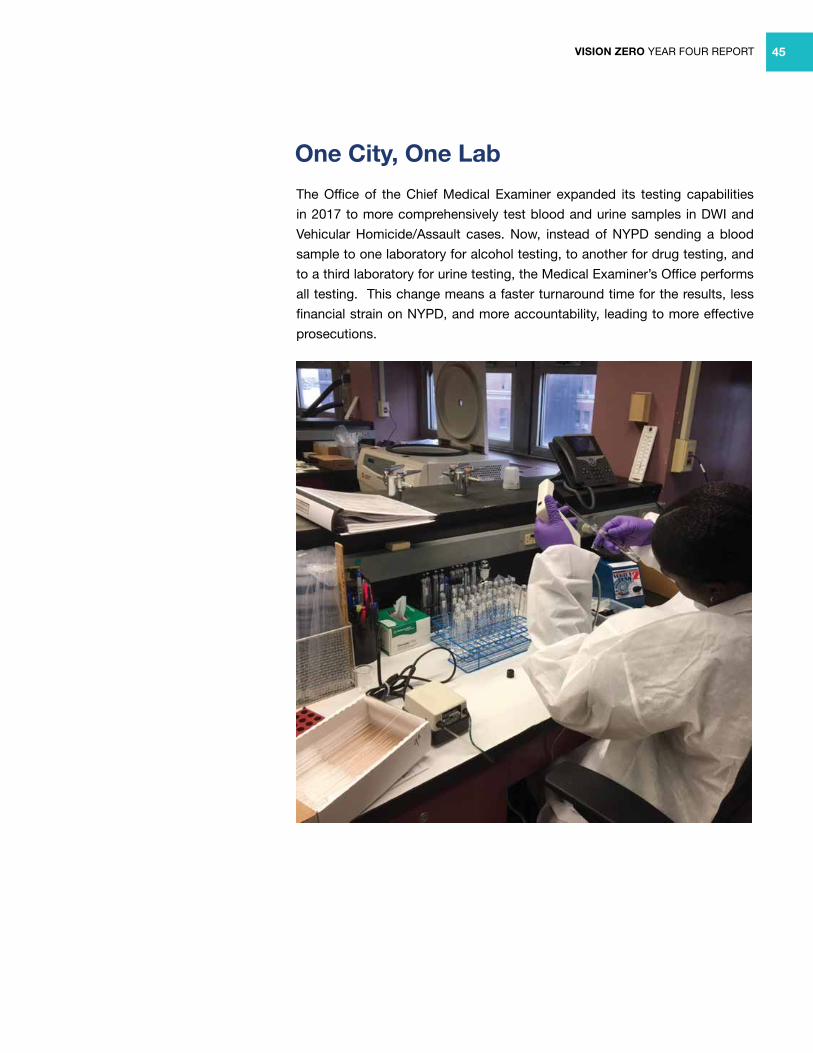
The Office of the Chief Medical Examiner expanded its testing capabilities
in 2017 to more comprehensively test blood and urine samples in DWI and
Vehicular Homicide/Assault cases. Now, instead of NYPD sending a blood
sample to one laboratory for alcohol testing, to another for drug testing, and
to a third laboratory for urine testing, the Medical Examiner’s Office performs
all testing. This change means a faster turnaround time for the results, less
financial strain on NYPD, and more accountability, leading to more effective
prosecutions.
One City, One Lab
VISION ZERO YEAR FOUR REPORT46
VISION ZERO YEAR FOUR REPORT 47VISION ZERO YEAR FOUR REPORT 47
Fleets
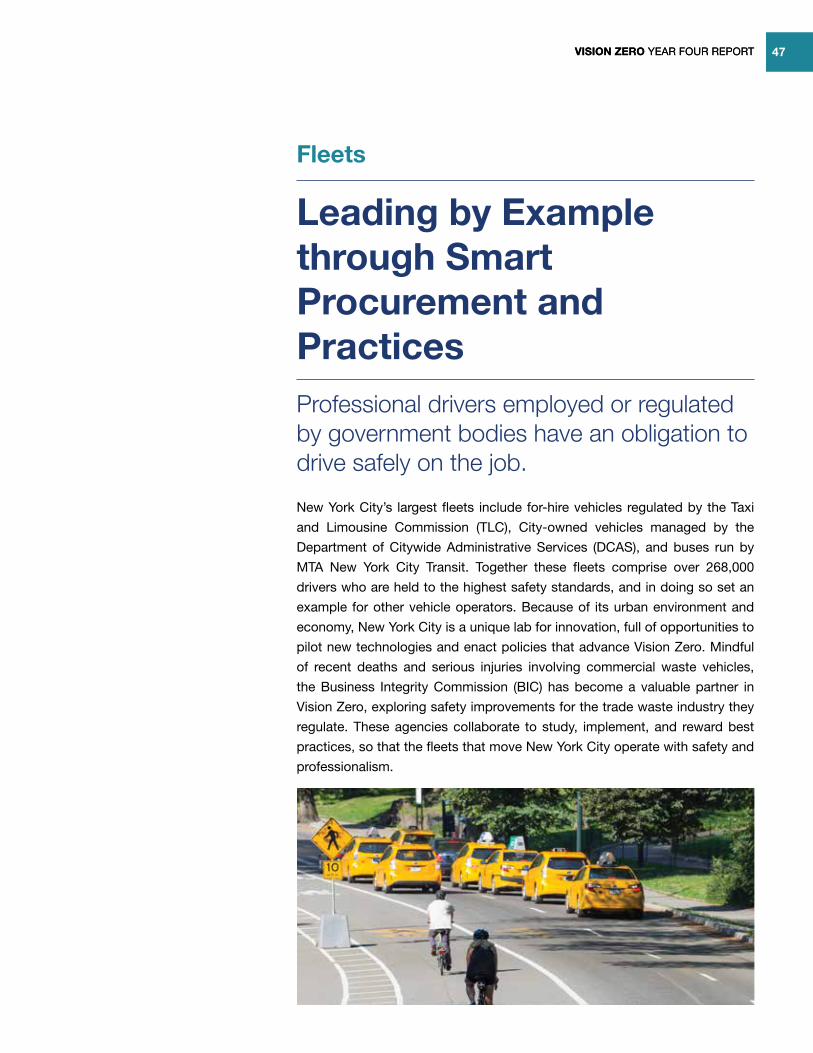
Leading by Example through Smart Procurement and PracticesProfessional drivers employed or regulated by government bodies have an obligation to drive safely on the job.
New York City’s largest fleets include for-hire vehicles regulated by the Taxi
and Limousine Commission (TLC), City-owned vehicles managed by the
Department of Citywide Administrative Services (DCAS), and buses run by
MTA New York City Transit. Together these fleets comprise over 268,000
drivers who are held to the highest safety standards, and in doing so set an
example for other vehicle operators. Because of its urban environment and
economy, New York City is a unique lab for innovation, full of opportunities to
pilot new technologies and enact policies that advance Vision Zero. Mindful
of recent deaths and serious injuries involving commercial waste vehicles,
the Business Integrity Commission (BIC) has become a valuable partner in
Vision Zero, exploring safety improvements for the trade waste industry they
regulate. These agencies collaborate to study, implement, and reward best
practices, so that the fleets that move New York City operate with safety and
professionalism.
VISION ZERO YEAR FOUR REPORT48
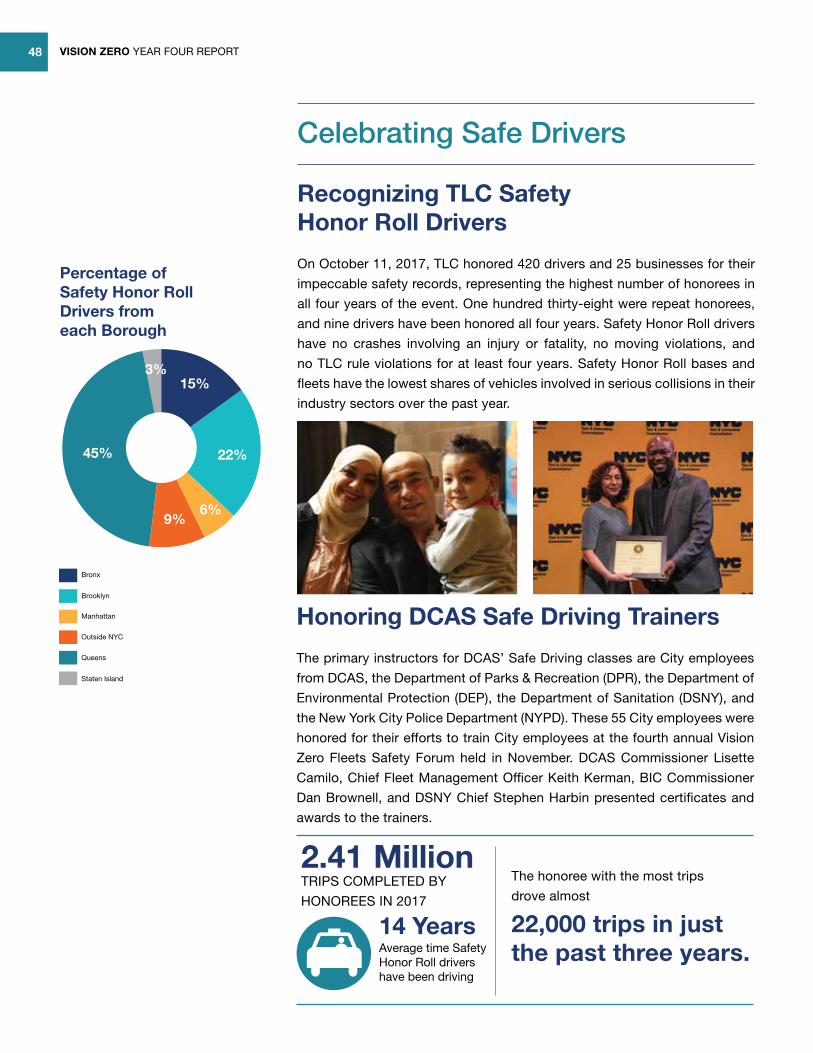
Recognizing TLC Safety Honor Roll Drivers
On October 11, 2017, TLC honored 420 drivers and 25 businesses for their
impeccable safety records, representing the highest number of honorees in
all four years of the event. One hundred thirty-eight were repeat honorees,
and nine drivers have been honored all four years. Safety Honor Roll drivers
have no crashes involving an injury or fatality, no moving violations, and
no TLC rule violations for at least four years. Safety Honor Roll bases and
fleets have the lowest shares of vehicles involved in serious collisions in their
industry sectors over the past year.
Celebrating Safe Drivers
Honoring DCAS Safe Driving Trainers
The primary instructors for DCAS’ Safe Driving classes are City employees
from DCAS, the Department of Parks & Recreation (DPR), the Department of
Environmental Protection (DEP), the Department of Sanitation (DSNY), and
the New York City Police Department (NYPD). These 55 City employees were
honored for their efforts to train City employees at the fourth annual Vision
Zero Fleets Safety Forum held in November. DCAS Commissioner Lisette
Camilo, Chief Fleet Management Officer Keith Kerman, BIC Commissioner
Dan Brownell, and DSNY Chief Stephen Harbin presented certificates and
awards to the trainers.
Average time Safety Honor Roll drivers have been driving
14 Years
2.41 Million
22,000 trips in just the past three years.
TRIPS COMPLETED BY
HONOREES IN 2017
The honoree with the most trips
drove almost
Bronx
Brooklyn
Manhattan
Outside NYC
Queens
Staten Island
45%
15%
9%
22%
3%
6%
Bronx
Brooklyn
Manhattan
Outside NYC
Queens
Staten Island
45%
15%
9%
22%
3%
6%
Percentage of Safety Honor Roll Drivers from each Borough
VISION ZERO YEAR FOUR REPORT 49
Training for TLC License Applicants
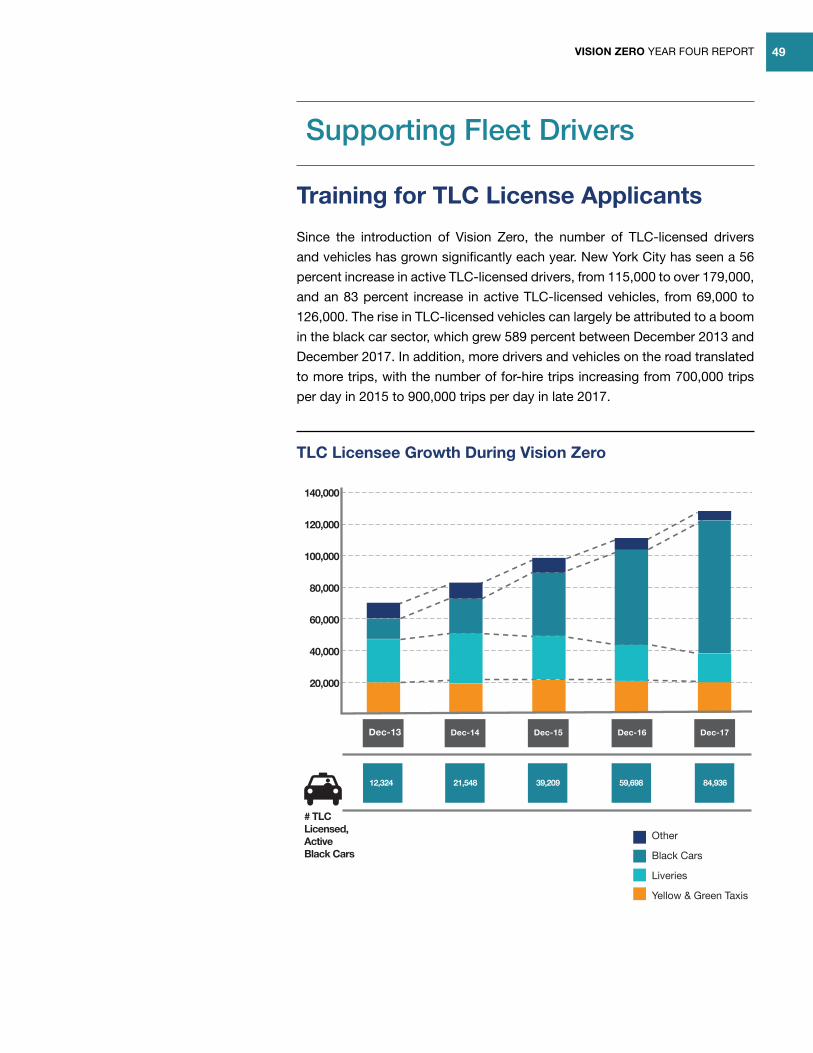
Since the introduction of Vision Zero, the number of TLC-licensed drivers
and vehicles has grown significantly each year. New York City has seen a 56
percent increase in active TLC-licensed drivers, from 115,000 to over 179,000,
and an 83 percent increase in active TLC-licensed vehicles, from 69,000 to
126,000. The rise in TLC-licensed vehicles can largely be attributed to a boom
in the black car sector, which grew 589 percent between December 2013 and
December 2017. In addition, more drivers and vehicles on the road translated
to more trips, with the number of for-hire trips increasing from 700,000 trips
per day in 2015 to 900,000 trips per day in late 2017.
Supporting Fleet Drivers
Dec-13 Dec-14 Dec-15 Dec-16 Dec-17
20,000
40,000
60,000
80,000
100,000
120,000
140,000
Other
Black Cars
Liveries
Yellow & Green Taxis
# TLC Licensed, Active Black Cars
84,93612,324 21,548 39,209 59,698
TLC Licensee Growth During Vision Zero
VISION ZERO YEAR FOUR REPORT50
In 2016, TLC expanded the driver training course requirement to all drivers.
All drivers licensed on or after March 20, 2015 must pass the course to be
licensed by TLC to drive for-hire.
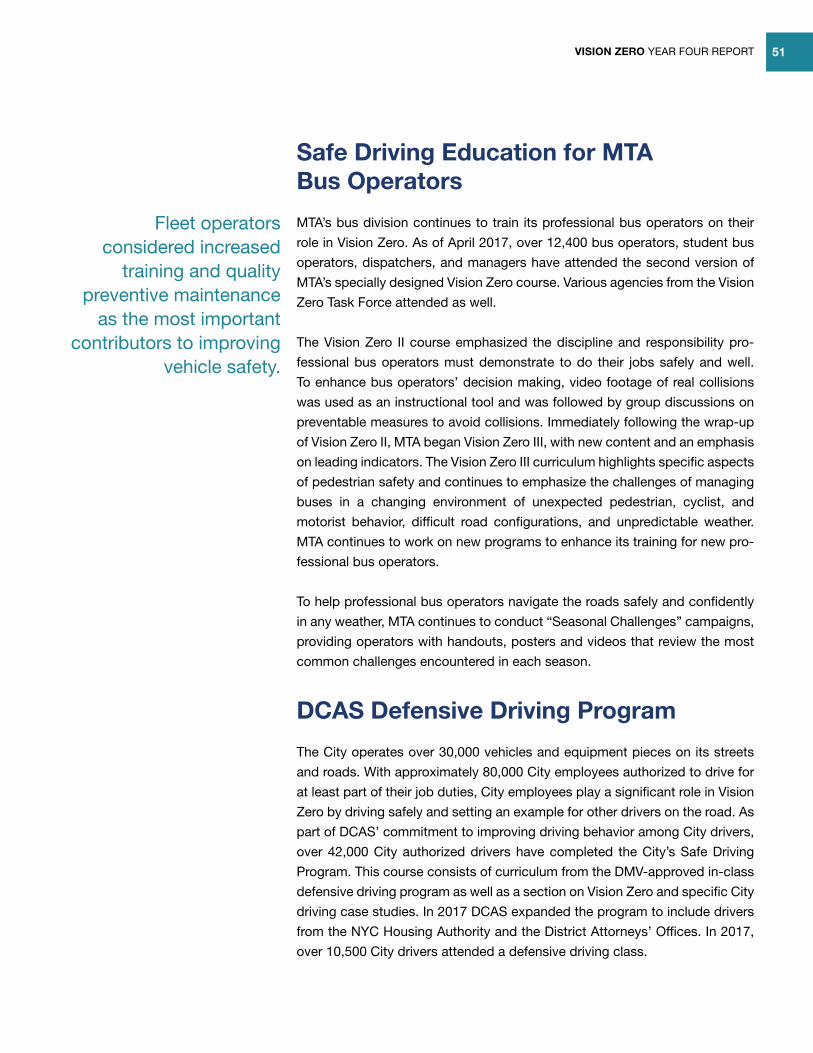
Over 35,000 drivers completed the TLC Driver Education course in 2017.
This course is required for all TLC Driver License applicants before becoming
licensed to drive taxis and FHVs. In early 2017, TLC updated the course’s
Vision Zero curriculum to include an expanded section on fatigued driving
prevention, license penalties related to crashes, and more visual aids to
demonstrate safe driving techniques.
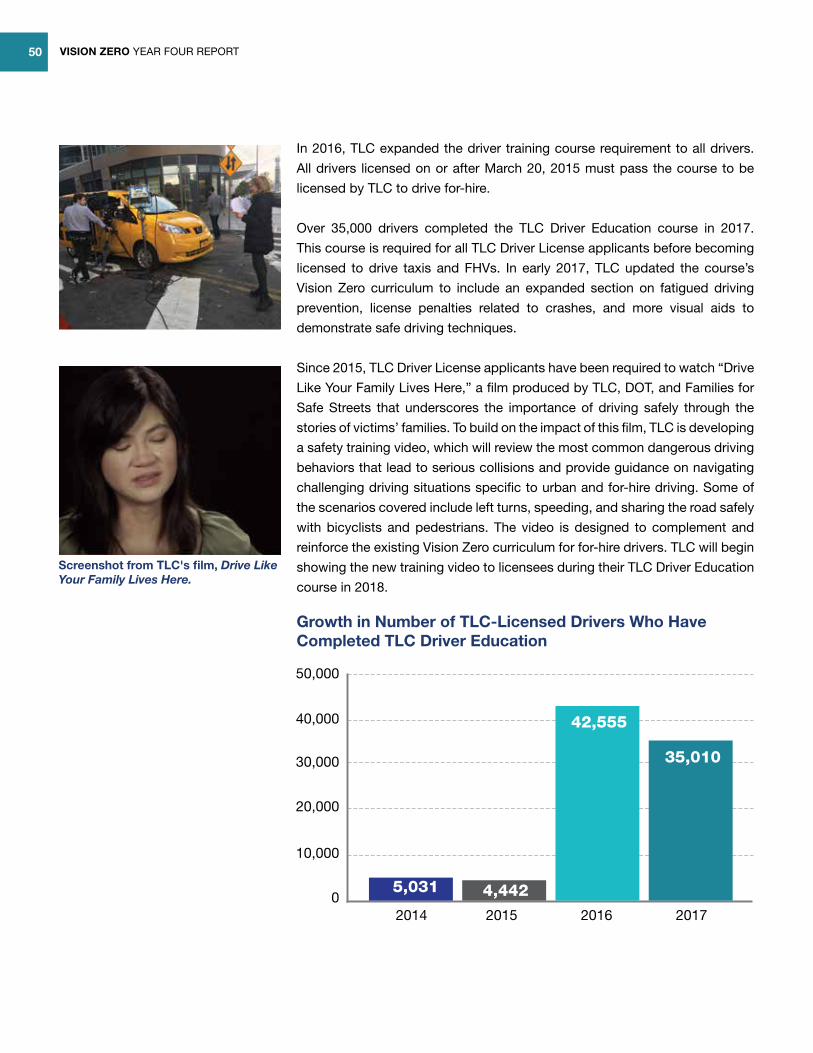
Since 2015, TLC Driver License applicants have been required to watch “Drive
Like Your Family Lives Here,” a film produced by TLC, DOT, and Families for
Safe Streets that underscores the importance of driving safely through the
stories of victims’ families. To build on the impact of this film, TLC is developing
a safety training video, which will review the most common dangerous driving
behaviors that lead to serious collisions and provide guidance on navigating
challenging driving situations specific to urban and for-hire driving. Some of
the scenarios covered include left turns, speeding, and sharing the road safely
with bicyclists and pedestrians. The video is designed to complement and
reinforce the existing Vision Zero curriculum for for-hire drivers. TLC will begin
showing the new training video to licensees during their TLC Driver Education
course in 2018.
Growth in Number of TLC-Licensed Drivers Who Have Completed TLC Driver Education
Screenshot from TLC's film, Drive Like Your Family Lives Here.
2014 2015 2016 20170
10,000
20,000
30,000
40,000
50,000
42,555
35,010
4,4425,031
VISION ZERO YEAR FOUR REPORT 51
Safe Driving Education for MTA Bus Operators
MTA’s bus division continues to train its professional bus operators on their
role in Vision Zero. As of April 2017, over 12,400 bus operators, student bus
operators, dispatchers, and managers have attended the second version of
MTA’s specially designed Vision Zero course. Various agencies from the Vision
Zero Task Force attended as well.
The Vision Zero II course emphasized the discipline and responsibility pro-
fessional bus operators must demonstrate to do their jobs safely and well.
To enhance bus operators’ decision making, video footage of real collisions
was used as an instructional tool and was followed by group discussions on
preventable measures to avoid collisions. Immediately following the wrap-up
of Vision Zero II, MTA began Vision Zero III, with new content and an emphasis
on leading indicators. The Vision Zero III curriculum highlights specific aspects
of pedestrian safety and continues to emphasize the challenges of managing
buses in a changing environment of unexpected pedestrian, cyclist, and
motorist behavior, difficult road configurations, and unpredictable weather.
MTA continues to work on new programs to enhance its training for new pro-
fessional bus operators.
To help professional bus operators navigate the roads safely and confidently
in any weather, MTA continues to conduct “Seasonal Challenges” campaigns,
providing operators with handouts, posters and videos that review the most
common challenges encountered in each season.
DCAS Defensive Driving Program
The City operates over 30,000 vehicles and equipment pieces on its streets
and roads. With approximately 80,000 City employees authorized to drive for
at least part of their job duties, City employees play a significant role in Vision
Zero by driving safely and setting an example for other drivers on the road. As
part of DCAS’ commitment to improving driving behavior among City drivers,
over 42,000 City authorized drivers have completed the City’s Safe Driving
Program. This course consists of curriculum from the DMV-approved in-class
defensive driving program as well as a section on Vision Zero and specific City
driving case studies. In 2017 DCAS expanded the program to include drivers
from the NYC Housing Authority and the District Attorneys’ Offices. In 2017,
over 10,500 City drivers attended a defensive driving class.
Fleet operators considered increased
training and quality preventive maintenance
as the most important contributors to improving
vehicle safety.
VISION ZERO YEAR FOUR REPORT52
The City has also begun administering its first customer survey for City fleet
operators during these classes. Over 20,000 fleet operators have participated
in the fleet customer surveys, which address safety, acquisitions, sustainabil-
ity, and service. The survey asks participants what equipment they consider
most important to improving vehicle safety from a pre-selected list, and
provides open space for their thoughts on the design and equipping of City
vehicles as relates to safety. These surveys helped inform DCAS’ Safe Fleet
Transition Plan (SFTP).
Transitioning to a Safer Municipal Fleet
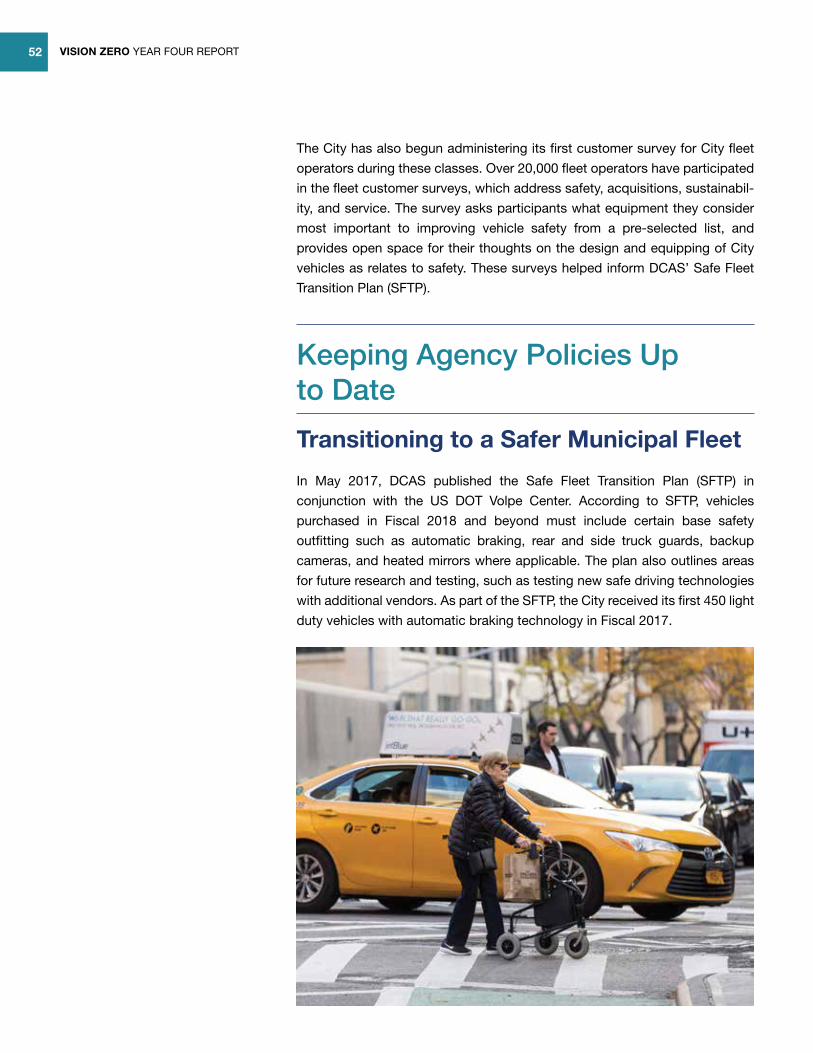
In May 2017, DCAS published the Safe Fleet Transition Plan (SFTP) in
conjunction with the US DOT Volpe Center. According to SFTP, vehicles
purchased in Fiscal 2018 and beyond must include certain base safety
outfitting such as automatic braking, rear and side truck guards, backup
cameras, and heated mirrors where applicable. The plan also outlines areas
for future research and testing, such as testing new safe driving technologies
with additional vendors. As part of the SFTP, the City received its first 450 light
duty vehicles with automatic braking technology in Fiscal 2017.
Keeping Agency Policies Up to Date
VISION ZERO YEAR FOUR REPORT 53
Updated NYC Fleet Management Manual
The NYC Fleet Management Manual was updated in 2017 to codify the Safe
Fleet Transition Plan and refresh Vision Zero material. DCAS posted citywide
fleet safety rules forms online in the City employee portal, where City drivers
can review them, representing the first time the portal has been used for
safety rules compliance. These materials include the driver’s handbook, as
well as a schedule of defensive driving classes and information on Vision Ze-
ro-related rules like the citywide speed limit and ban on hand-free cell phone
use in City-owned vehicles. Agency-specific forms and guidelines will also be
posted for review and acknowledgement.
2 zzz
DRIVE RESTup to 10 hours withpassengers each day.
by taking regular breaksand getting enough sleep.
Taking a break for 8+ hoursrestarts your daily limit.
DRIVEDRIVE
REPEAT these safe habits and drive up to60 hours with passengers each week.
Driving tiredis as dangerousas driving drunk.
DRIVE / REST / REPEAT
Learn more at nyc.gov/taxi
Approved Fatigued Driving Prevention Rules
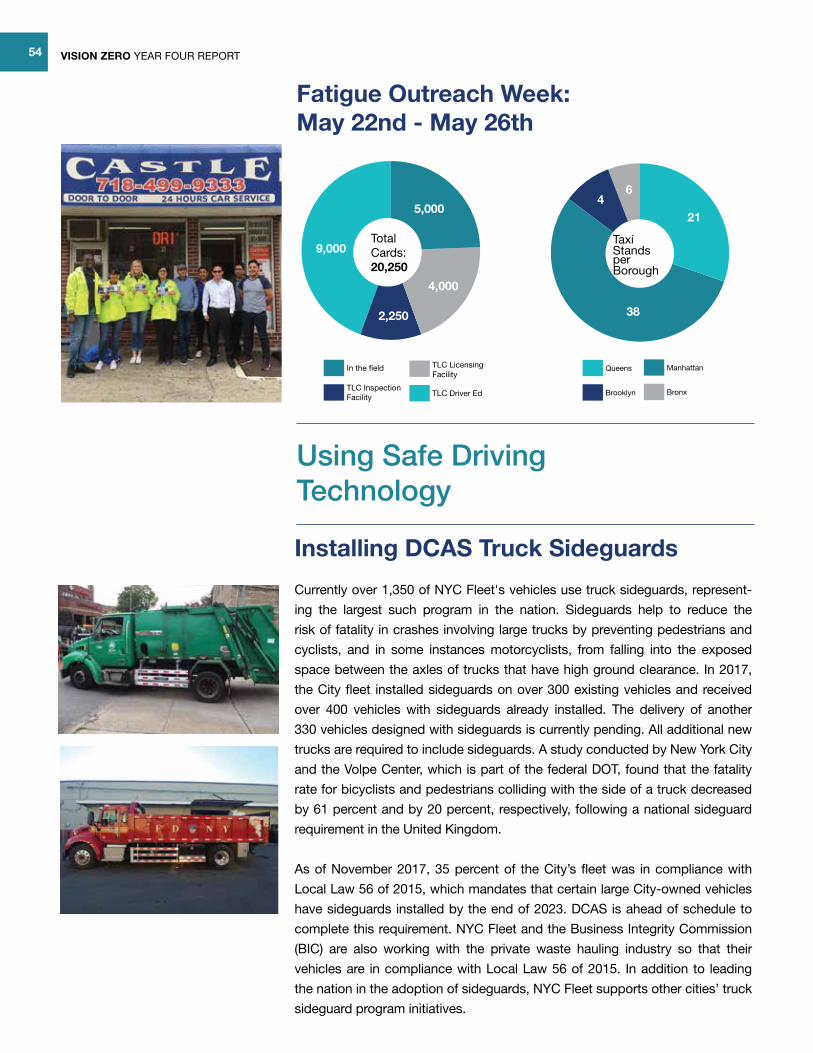
TLC approved the final version of its fatigued driving prevention rules in
February 2017. These rules created daily and weekly driving limits to keep
tired drivers off the road. Fatigued driving is dangerous for drivers, passengers,
cyclists, and pedestrians because fatigue slows down a driver’s ability to react
and results in a higher risk of a crash. Throughout 2017 TLC began imple-
menting the rules by requiring additional trip records from bases and will soon
provide instructional warnings to drivers in violation of the rules.
In May 2017, TLC held Fatigue Outreach Week to educate drivers about the
risks of driving while tired and to raise awareness about the new rules. TLC
staff spoke to drivers and handed out postcards at airport holding lots and 69
taxi stands around the city. In addition, TLC sent emails to its over 179,000
licensed drivers, held meetings with driver groups, and discussed the rules at
community events. TLC also included postcards in license renewal packages
for drivers, totaling about 3,000 cards sent per week since June.
VISION ZERO YEAR FOUR REPORT54
Fatigue Outreach Week: May 22nd - May 26th
Installing DCAS Truck Sideguards
Currently over 1,350 of NYC Fleet's vehicles use truck sideguards, represent-
ing the largest such program in the nation. Sideguards help to reduce the
risk of fatality in crashes involving large trucks by preventing pedestrians and
cyclists, and in some instances motorcyclists, from falling into the exposed
space between the axles of trucks that have high ground clearance. In 2017,
the City fleet installed sideguards on over 300 existing vehicles and received
over 400 vehicles with sideguards already installed. The delivery of another
330 vehicles designed with sideguards is currently pending. All additional new
trucks are required to include sideguards. A study conducted by New York City
and the Volpe Center, which is part of the federal DOT, found that the fatality
rate for bicyclists and pedestrians colliding with the side of a truck decreased
by 61 percent and by 20 percent, respectively, following a national sideguard
requirement in the United Kingdom.
As of November 2017, 35 percent of the City’s fleet was in compliance with
Local Law 56 of 2015, which mandates that certain large City-owned vehicles
have sideguards installed by the end of 2023. DCAS is ahead of schedule to
complete this requirement. NYC Fleet and the Business Integrity Commission
(BIC) are also working with the private waste hauling industry so that their
vehicles are in compliance with Local Law 56 of 2015. In addition to leading
the nation in the adoption of sideguards, NYC Fleet supports other cities’ truck
sideguard program initiatives.
Using Safe Driving Technology
5,000
4,000
2,250
9,000
In the field
TLC Inspection Facility
TLC Licensing Facility
TLC Driver Ed
Total Cards: 20,250
Queens
Brooklyn
Manhattan
Bronx
21
38
46
Taxi Standsper Borough
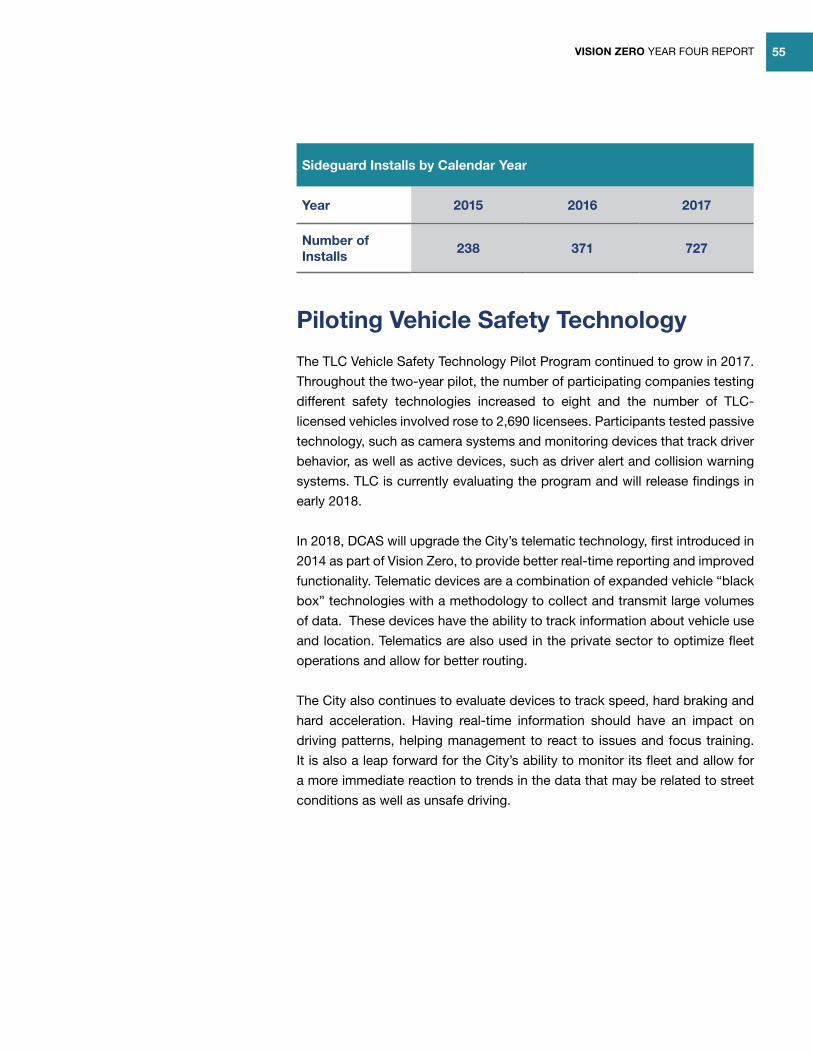
VISION ZERO YEAR FOUR REPORT 55
Piloting Vehicle Safety Technology
The TLC Vehicle Safety Technology Pilot Program continued to grow in 2017.
Throughout the two-year pilot, the number of participating companies testing
different safety technologies increased to eight and the number of TLC-
licensed vehicles involved rose to 2,690 licensees. Participants tested passive
technology, such as camera systems and monitoring devices that track driver
behavior, as well as active devices, such as driver alert and collision warning
systems. TLC is currently evaluating the program and will release findings in
early 2018.
In 2018, DCAS will upgrade the City’s telematic technology, first introduced in
2014 as part of Vision Zero, to provide better real-time reporting and improved
functionality. Telematic devices are a combination of expanded vehicle “black
box” technologies with a methodology to collect and transmit large volumes
of data. These devices have the ability to track information about vehicle use
and location. Telematics are also used in the private sector to optimize fleet
operations and allow for better routing.
The City also continues to evaluate devices to track speed, hard braking and
hard acceleration. Having real-time information should have an impact on
driving patterns, helping management to react to issues and focus training.
It is also a leap forward for the City’s ability to monitor its fleet and allow for
a more immediate reaction to trends in the data that may be related to street
conditions as well as unsafe driving.
Sideguard Installs by Calendar Year
Year 2015 2016 2017
Number of Installs
238 371 727
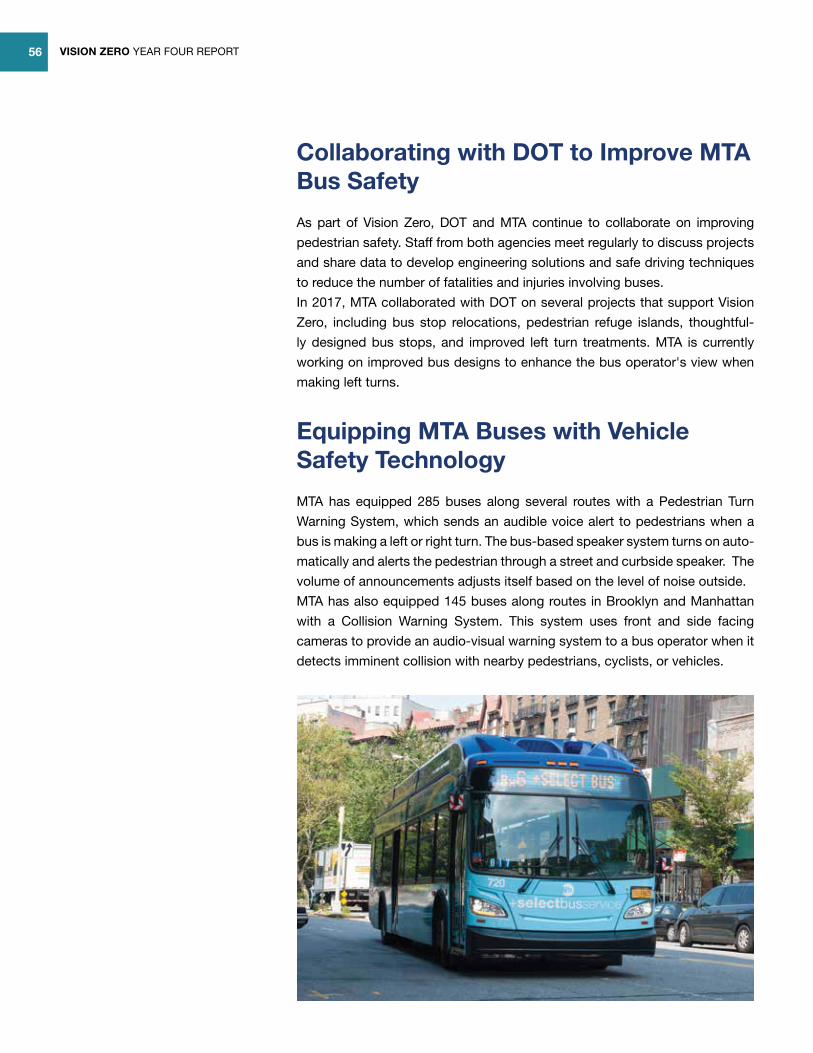
VISION ZERO YEAR FOUR REPORT56
Collaborating with DOT to Improve MTA Bus Safety
As part of Vision Zero, DOT and MTA continue to collaborate on improving
pedestrian safety. Staff from both agencies meet regularly to discuss projects
and share data to develop engineering solutions and safe driving techniques
to reduce the number of fatalities and injuries involving buses.
In 2017, MTA collaborated with DOT on several projects that support Vision
Zero, including bus stop relocations, pedestrian refuge islands, thoughtful-
ly designed bus stops, and improved left turn treatments. MTA is currently
working on improved bus designs to enhance the bus operator's view when
making left turns.
Equipping MTA Buses with Vehicle Safety Technology
MTA has equipped 285 buses along several routes with a Pedestrian Turn
Warning System, which sends an audible voice alert to pedestrians when a
bus is making a left or right turn. The bus-based speaker system turns on auto-
matically and alerts the pedestrian through a street and curbside speaker. The
volume of announcements adjusts itself based on the level of noise outside.
MTA has also equipped 145 buses along routes in Brooklyn and Manhattan
with a Collision Warning System. This system uses front and side facing
cameras to provide an audio-visual warning system to a bus operator when it
detects imminent collision with nearby pedestrians, cyclists, or vehicles.
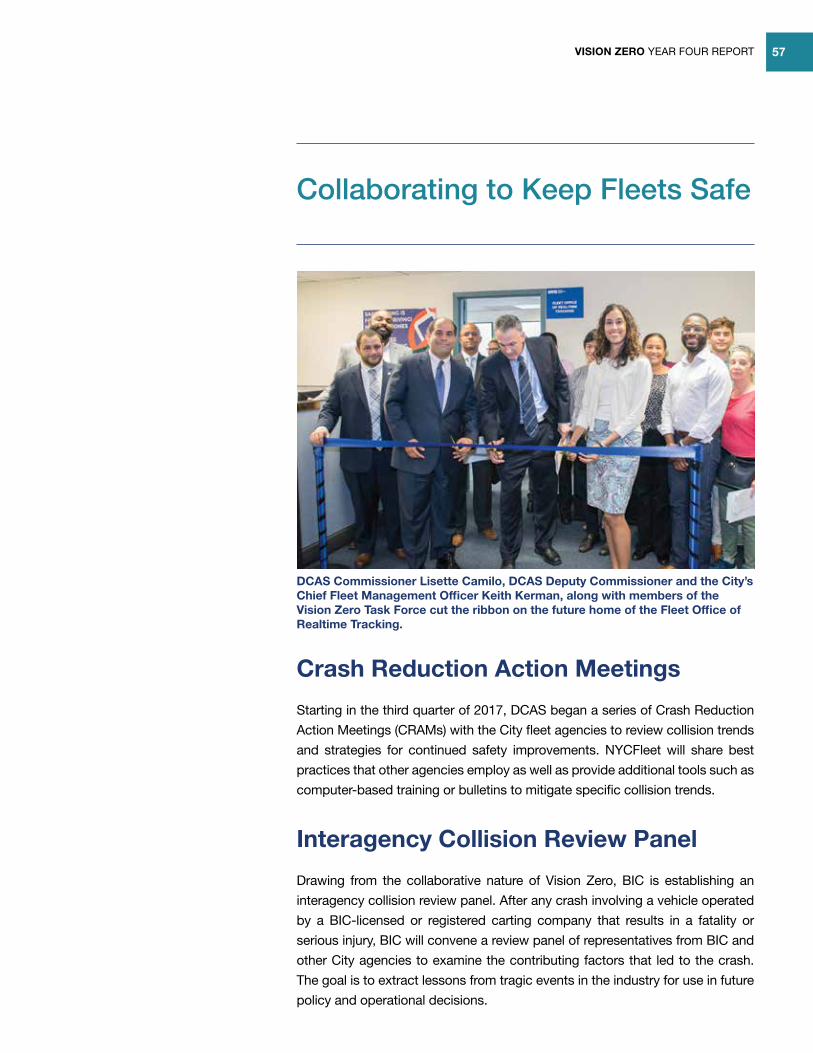
VISION ZERO YEAR FOUR REPORT 57
Crash Reduction Action Meetings
Starting in the third quarter of 2017, DCAS began a series of Crash Reduction
Action Meetings (CRAMs) with the City fleet agencies to review collision trends
and strategies for continued safety improvements. NYCFleet will share best
practices that other agencies employ as well as provide additional tools such as
computer-based training or bulletins to mitigate specific collision trends.
Interagency Collision Review Panel
Drawing from the collaborative nature of Vision Zero, BIC is establishing an
interagency collision review panel. After any crash involving a vehicle operated
by a BIC-licensed or registered carting company that results in a fatality or
serious injury, BIC will convene a review panel of representatives from BIC and
other City agencies to examine the contributing factors that led to the crash.
The goal is to extract lessons from tragic events in the industry for use in future
policy and operational decisions.
Collaborating to Keep Fleets Safe
DCAS Commissioner Lisette Camilo, DCAS Deputy Commissioner and the City’s Chief Fleet Management Officer Keith Kerman, along with members of the Vision Zero Task Force cut the ribbon on the future home of the Fleet Office of Realtime Tracking.
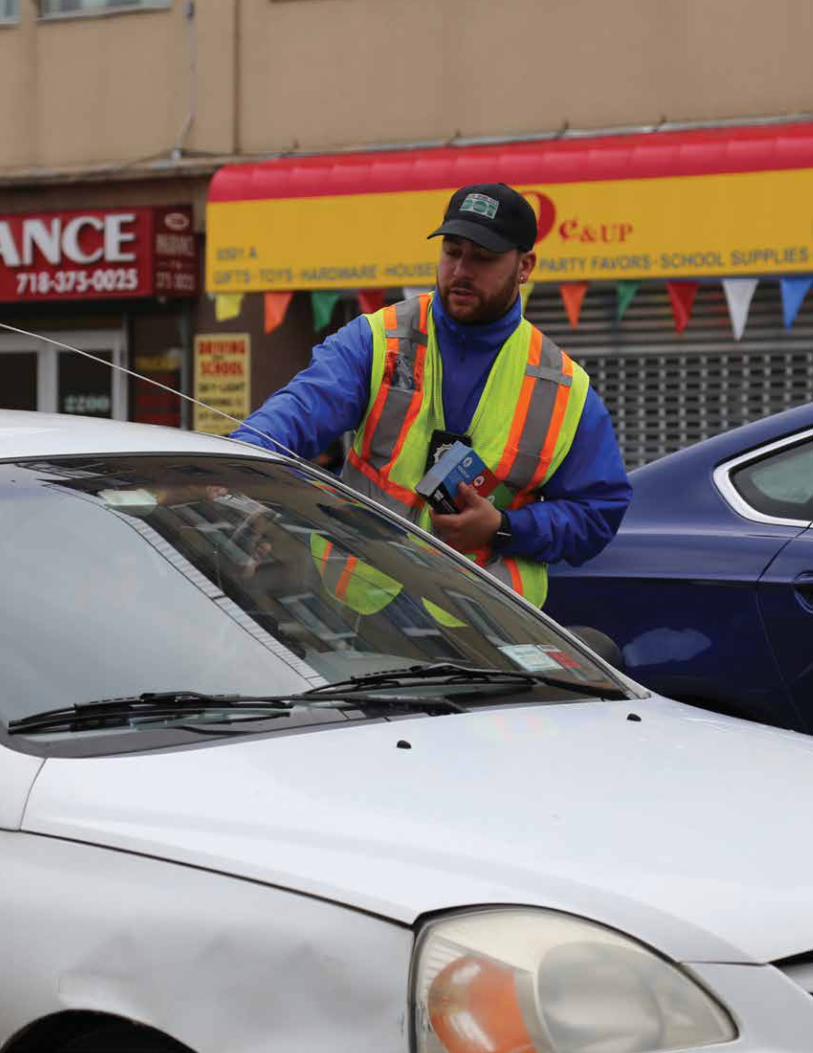
VISION ZERO YEAR FOUR REPORT58
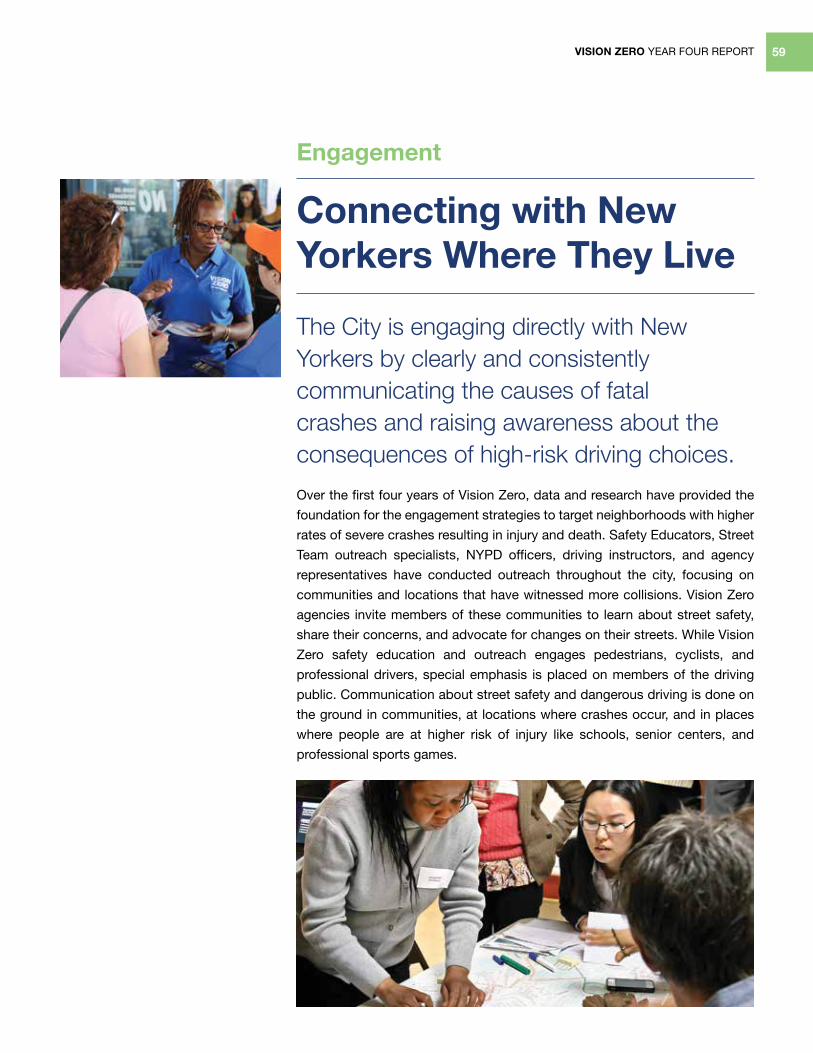
VISION ZERO YEAR FOUR REPORT 59
Engagement
Connecting with New Yorkers Where They Live
The City is engaging directly with New Yorkers by clearly and consistently communicating the causes of fatal crashes and raising awareness about the consequences of high-risk driving choices.
Over the first four years of Vision Zero, data and research have provided the
foundation for the engagement strategies to target neighborhoods with higher
rates of severe crashes resulting in injury and death. Safety Educators, Street
Team outreach specialists, NYPD officers, driving instructors, and agency
representatives have conducted outreach throughout the city, focusing on
communities and locations that have witnessed more collisions. Vision Zero
agencies invite members of these communities to learn about street safety,
share their concerns, and advocate for changes on their streets. While Vision
Zero safety education and outreach engages pedestrians, cyclists, and
professional drivers, special emphasis is placed on members of the driving
public. Communication about street safety and dangerous driving is done on
the ground in communities, at locations where crashes occur, and in places
where people are at higher risk of injury like schools, senior centers, and
professional sports games.
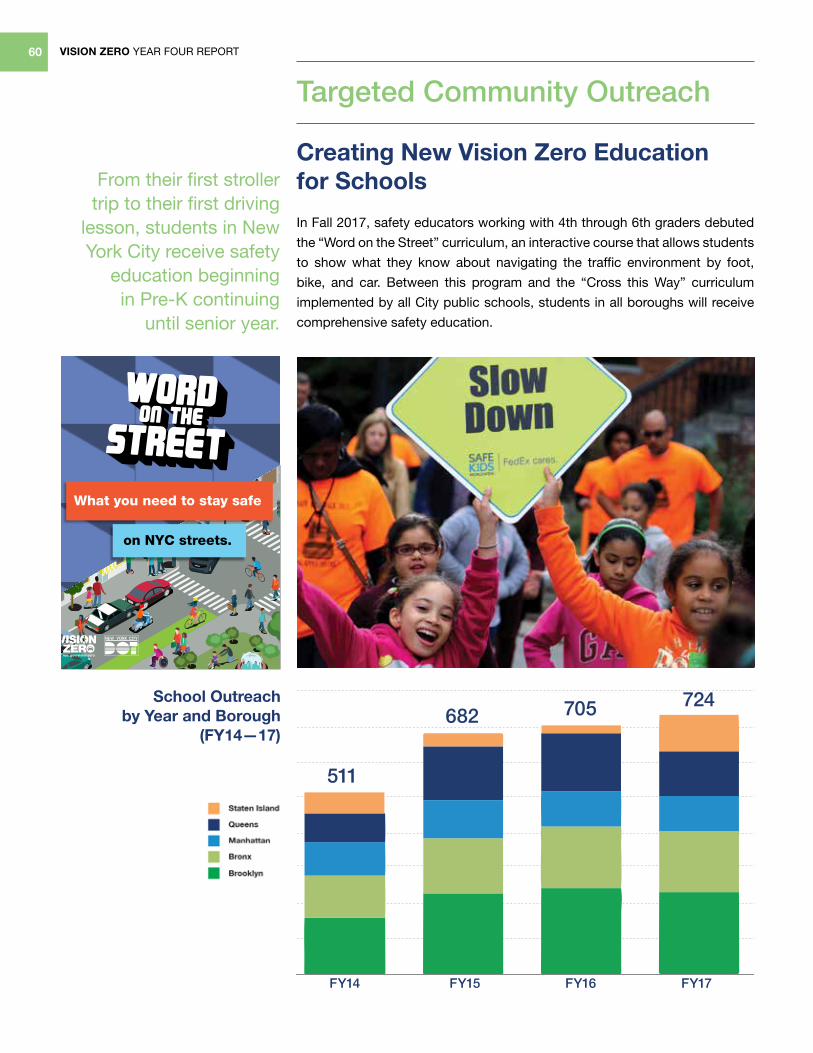
VISION ZERO YEAR FOUR REPORT60
Creating New Vision Zero Education for Schools
In Fall 2017, safety educators working with 4th through 6th graders debuted
the “Word on the Street” curriculum, an interactive course that allows students
to show what they know about navigating the traffic environment by foot,
bike, and car. Between this program and the “Cross this Way” curriculum
implemented by all City public schools, students in all boroughs will receive
comprehensive safety education.
From their first stroller trip to their first driving
lesson, students in New York City receive safety
education beginning in Pre-K continuing
until senior year.
What you need to stay safe
on NYC streets.
Quiz A
nswers: 1) 3, 2) 2, 3) 2, 4) 4, 5) 3, 6) 3, 7) 2, 8) 2, 9) 1
Circle the safe b
ehaviors and p
ut an “X
” on the unsafe behaviors.
School Outreach by Year and Borough
(FY14—17)
Targeted Community Outreach
511
682724705
FY14 FY15 FY16 FY17
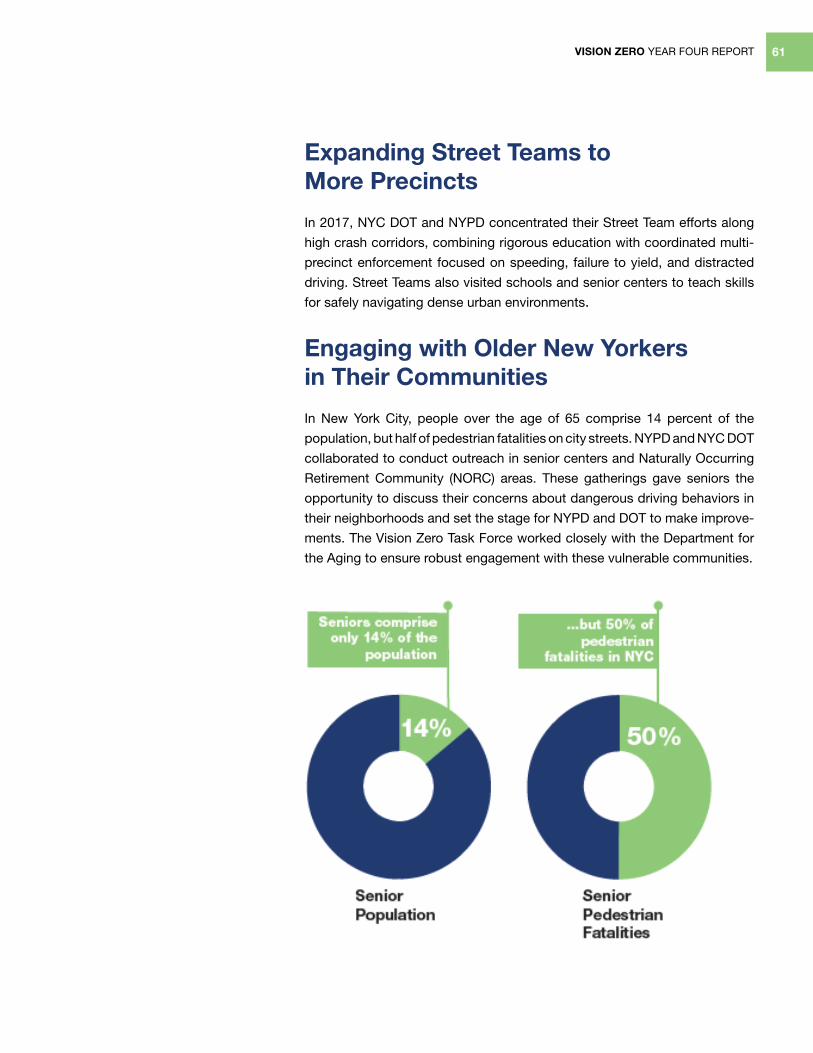
VISION ZERO YEAR FOUR REPORT 61
Engaging with Older New Yorkers in Their Communities
In New York City, people over the age of 65 comprise 14 percent of the
population, but half of pedestrian fatalities on city streets. NYPD and NYC DOT
collaborated to conduct outreach in senior centers and Naturally Occurring
Retirement Community (NORC) areas. These gatherings gave seniors the
opportunity to discuss their concerns about dangerous driving behaviors in
their neighborhoods and set the stage for NYPD and DOT to make improve-
ments. The Vision Zero Task Force worked closely with the Department for
the Aging to ensure robust engagement with these vulnerable communities.
Expanding Street Teams to More Precincts
In 2017, NYC DOT and NYPD concentrated their Street Team efforts along
high crash corridors, combining rigorous education with coordinated multi-
precinct enforcement focused on speeding, failure to yield, and distracted
driving. Street Teams also visited schools and senior centers to teach skills
for safely navigating dense urban environments.
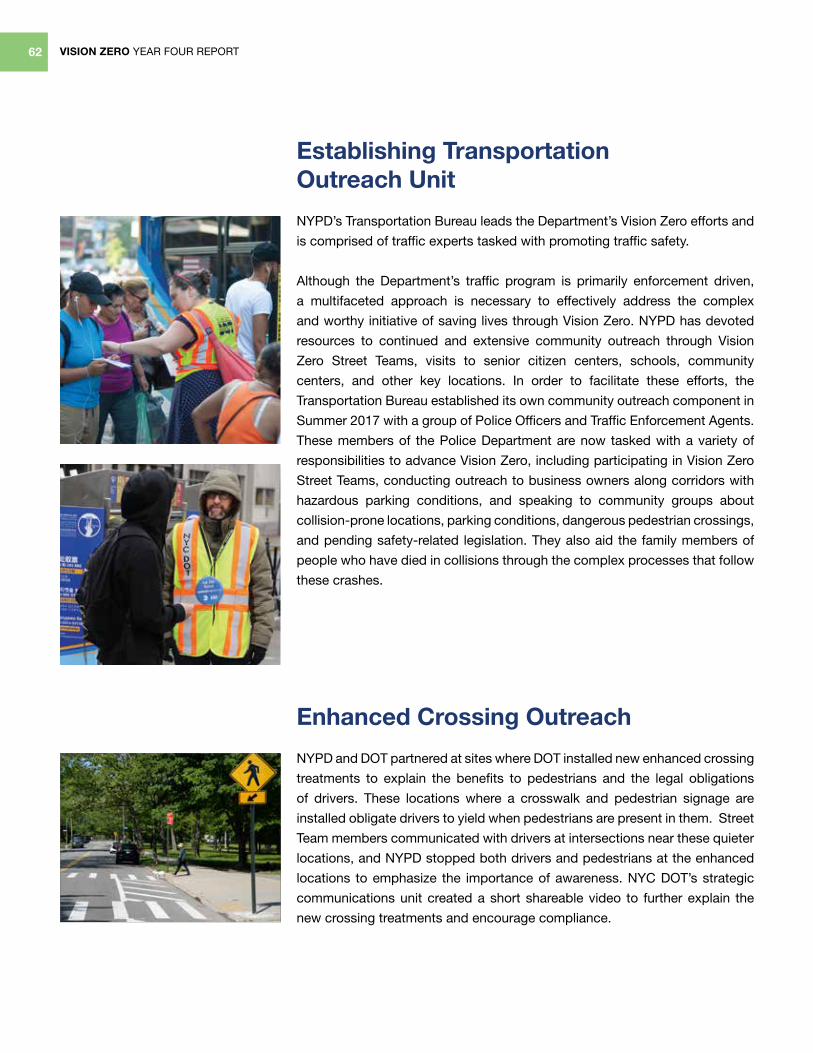
Establishing Transportation Outreach Unit
NYPD’s Transportation Bureau leads the Department’s Vision Zero efforts and
is comprised of traffic experts tasked with promoting traffic safety.
Although the Department’s traffic program is primarily enforcement driven,
a multifaceted approach is necessary to effectively address the complex
and worthy initiative of saving lives through Vision Zero. NYPD has devoted
resources to continued and extensive community outreach through Vision
Zero Street Teams, visits to senior citizen centers, schools, community
centers, and other key locations. In order to facilitate these efforts, the
Transportation Bureau established its own community outreach component in
Summer 2017 with a group of Police Officers and Traffic Enforcement Agents.
These members of the Police Department are now tasked with a variety of
responsibilities to advance Vision Zero, including participating in Vision Zero
Street Teams, conducting outreach to business owners along corridors with
hazardous parking conditions, and speaking to community groups about
collision-prone locations, parking conditions, dangerous pedestrian crossings,
and pending safety-related legislation. They also aid the family members of
people who have died in collisions through the complex processes that follow
these crashes.
Enhanced Crossing Outreach
NYPD and DOT partnered at sites where DOT installed new enhanced crossing
treatments to explain the benefits to pedestrians and the legal obligations
of drivers. These locations where a crosswalk and pedestrian signage are
installed obligate drivers to yield when pedestrians are present in them. Street
Team members communicated with drivers at intersections near these quieter
locations, and NYPD stopped both drivers and pedestrians at the enhanced
locations to emphasize the importance of awareness. NYC DOT’s strategic
communications unit created a short shareable video to further explain the
new crossing treatments and encourage compliance.
VISION ZERO YEAR FOUR REPORT62
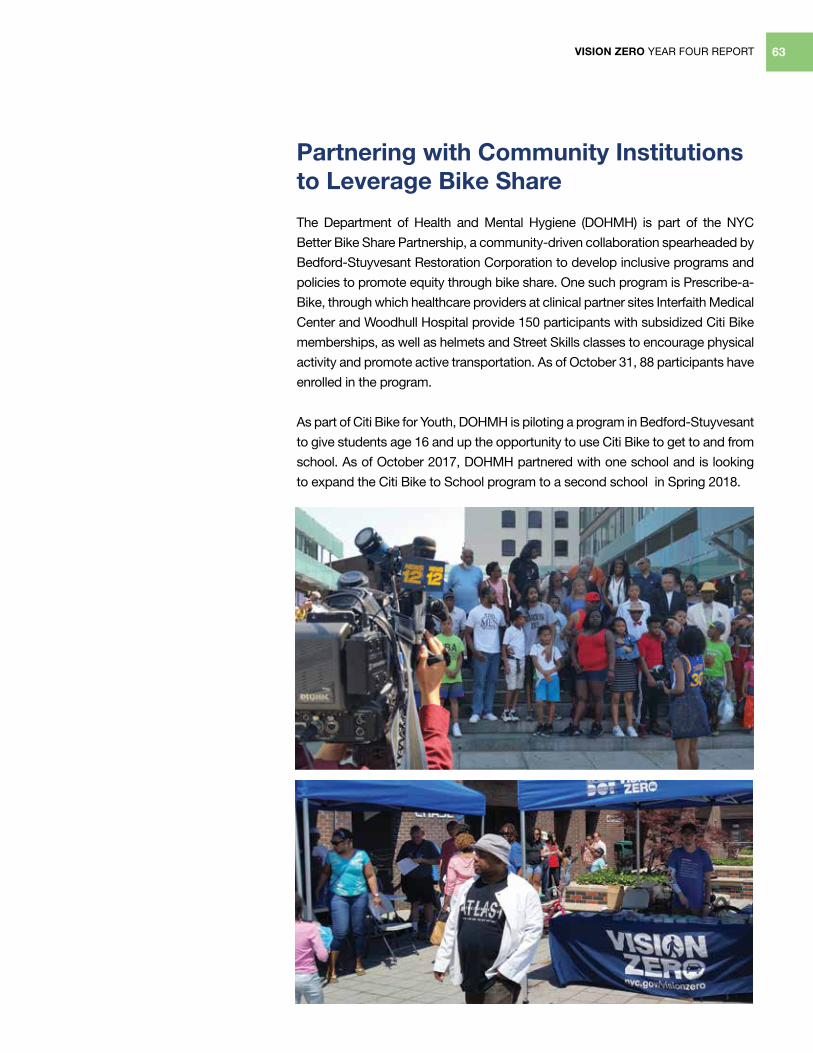
VISION ZERO YEAR FOUR REPORT 63
Partnering with Community Institutions to Leverage Bike Share
The Department of Health and Mental Hygiene (DOHMH) is part of the NYC
Better Bike Share Partnership, a community-driven collaboration spearheaded by
Bedford-Stuyvesant Restoration Corporation to develop inclusive programs and
policies to promote equity through bike share. One such program is Prescribe-a-
Bike, through which healthcare providers at clinical partner sites Interfaith Medical
Center and Woodhull Hospital provide 150 participants with subsidized Citi Bike
memberships, as well as helmets and Street Skills classes to encourage physical
activity and promote active transportation. As of October 31, 88 participants have
enrolled in the program.
As part of Citi Bike for Youth, DOHMH is piloting a program in Bedford-Stuyvesant
to give students age 16 and up the opportunity to use Citi Bike to get to and from
school. As of October 2017, DOHMH partnered with one school and is looking
to expand the Citi Bike to School program to a second school in Spring 2018.
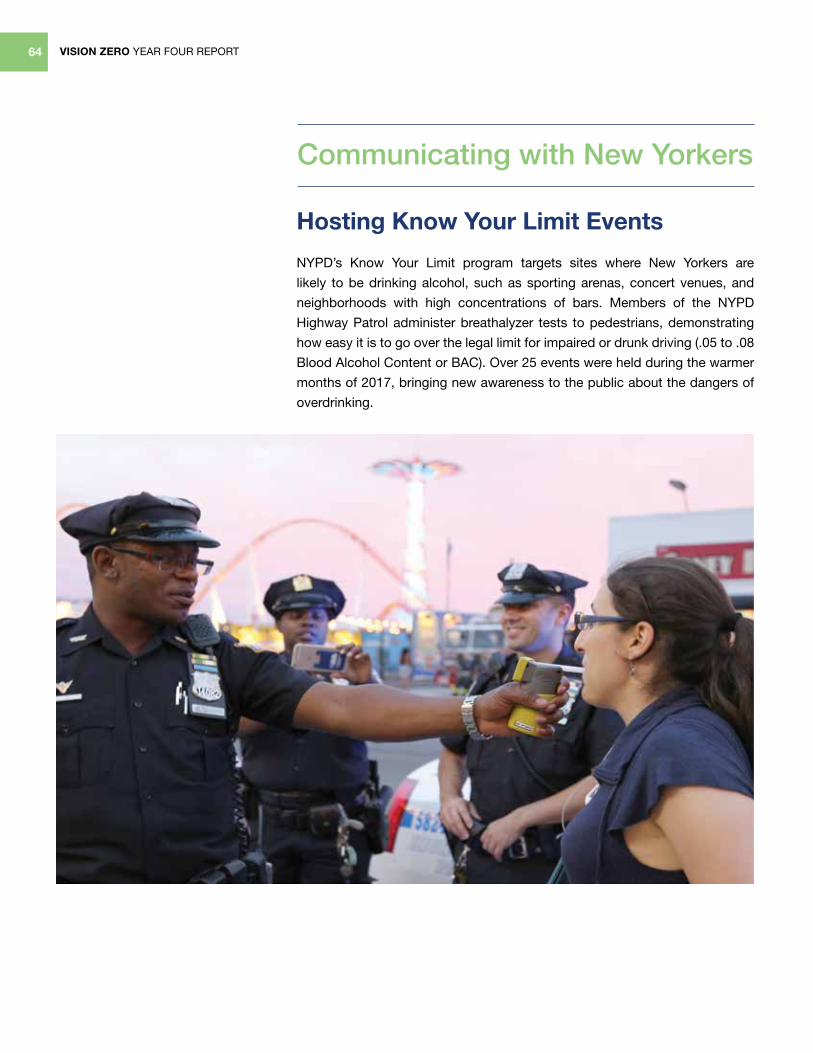
VISION ZERO YEAR FOUR REPORT64
Hosting Know Your Limit Events
NYPD’s Know Your Limit program targets sites where New Yorkers are
likely to be drinking alcohol, such as sporting arenas, concert venues, and
neighborhoods with high concentrations of bars. Members of the NYPD
Highway Patrol administer breathalyzer tests to pedestrians, demonstrating
how easy it is to go over the legal limit for impaired or drunk driving (.05 to .08
Blood Alcohol Content or BAC). Over 25 events were held during the warmer
months of 2017, bringing new awareness to the public about the dangers of
overdrinking.
Communicating with New Yorkers
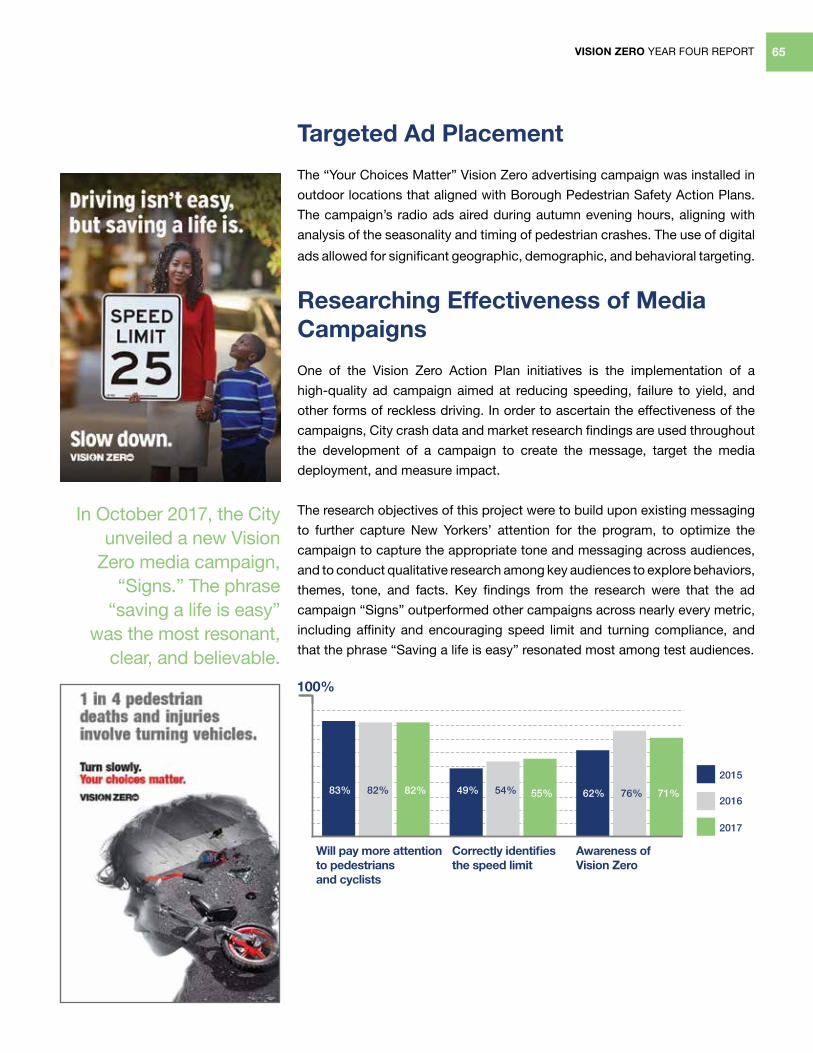
In October 2017, the City unveiled a new Vision
Zero media campaign, “Signs.” The phrase
“saving a life is easy” was the most resonant,
clear, and believable.
VISION ZERO YEAR FOUR REPORT 65
Targeted Ad Placement
The “Your Choices Matter” Vision Zero advertising campaign was installed in
outdoor locations that aligned with Borough Pedestrian Safety Action Plans.
The campaign’s radio ads aired during autumn evening hours, aligning with
analysis of the seasonality and timing of pedestrian crashes. The use of digital
ads allowed for significant geographic, demographic, and behavioral targeting.
Researching Effectiveness of Media Campaigns
One of the Vision Zero Action Plan initiatives is the implementation of a
high-quality ad campaign aimed at reducing speeding, failure to yield, and
other forms of reckless driving. In order to ascertain the effectiveness of the
campaigns, City crash data and market research findings are used throughout
the development of a campaign to create the message, target the media
deployment, and measure impact.
The research objectives of this project were to build upon existing messaging
to further capture New Yorkers’ attention for the program, to optimize the
campaign to capture the appropriate tone and messaging across audiences,
and to conduct qualitative research among key audiences to explore behaviors,
themes, tone, and facts. Key findings from the research were that the ad
campaign “Signs” outperformed other campaigns across nearly every metric,
including affinity and encouraging speed limit and turning compliance, and
that the phrase “Saving a life is easy” resonated most among test audiences.
•
•
•
100%
2015
2016
2017
82%82%83% 49% 62% 76% 71%54% 55%
Will pay more attention to pedestrians & cyclists
Correctly identifiesthe speed limit
Awareness ofVision Zero
Will pay more attention to pedestrians and cyclists
Correctly identifiesthe speed limit
Awareness ofVision Zero
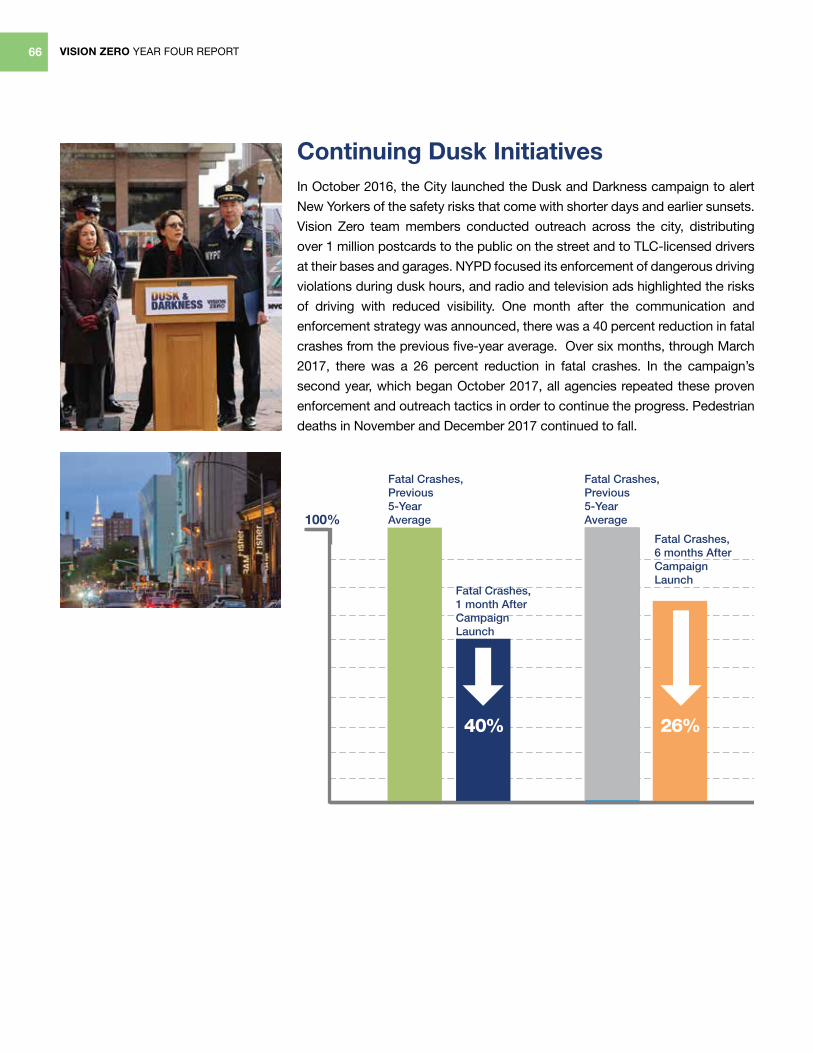
VISION ZERO YEAR FOUR REPORT66
Continuing Dusk InitiativesIn October 2016, the City launched the Dusk and Darkness campaign to alert
New Yorkers of the safety risks that come with shorter days and earlier sunsets.
Vision Zero team members conducted outreach across the city, distributing
over 1 million postcards to the public on the street and to TLC-licensed drivers
at their bases and garages. NYPD focused its enforcement of dangerous driving
violations during dusk hours, and radio and television ads highlighted the risks
of driving with reduced visibility. One month after the communication and
enforcement strategy was announced, there was a 40 percent reduction in fatal
crashes from the previous five-year average. Over six months, through March
2017, there was a 26 percent reduction in fatal crashes. In the campaign’s
second year, which began October 2017, all agencies repeated these proven
enforcement and outreach tactics in order to continue the progress. Pedestrian
deaths in November and December 2017 continued to fall.
100%
Fatal Crashes,1 month AfterCampaign Launch
Fatal Crashes,Previous 5-YearAverage
Fatal Crashes,Previous 5-YearAverage
Fatal Crashes, 6 months AfterCampaignLaunch
26%40%
100%
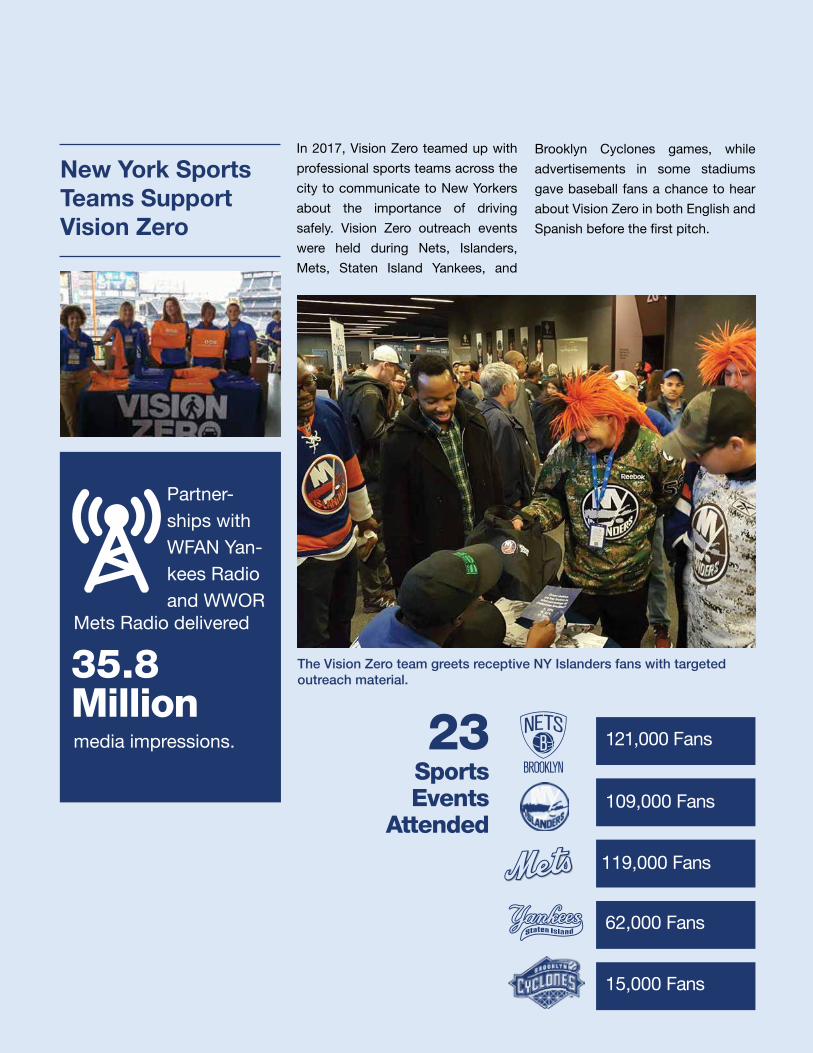
VISION ZERO YEAR FOUR REPORT
67
In 2017, Vision Zero teamed up with
professional sports teams across the
city to communicate to New Yorkers
about the importance of driving
safely. Vision Zero outreach events
were held during Nets, Islanders,
Mets, Staten Island Yankees, and
Brooklyn Cyclones games, while
advertisements in some stadiums
gave baseball fans a chance to hear
about Vision Zero in both English and
Spanish before the first pitch.
The Vision Zero team greets receptive NY Islanders fans with targeted outreach material.
New York Sports Teams Support Vision Zero
121,000 Fans
109,000 Fans
119,000 Fans
62,000 Fans
15,000 Fans
SportsEvents
Attended
23
Partner-ships with WFAN Yan-kees Radio and WWOR
Mets Radio delivered
35.8Millionmedia impressions.
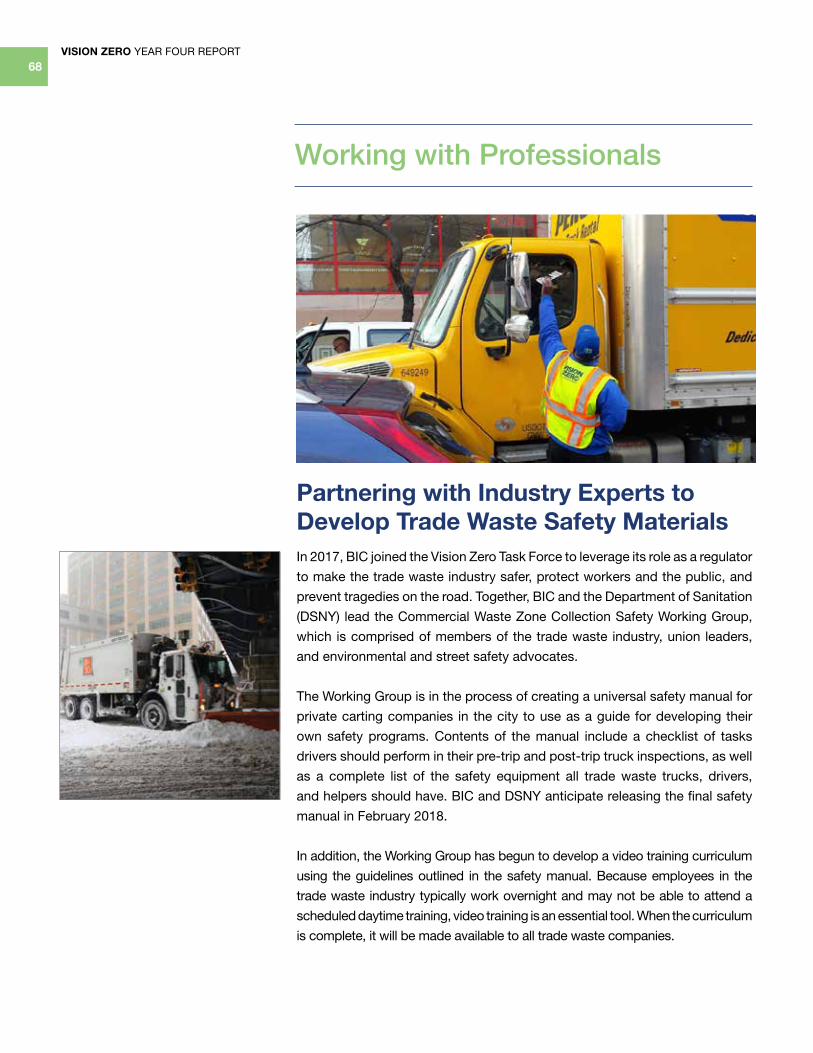
VISION ZERO YEAR FOUR REPORT
68
Partnering with Industry Experts to Develop Trade Waste Safety MaterialsIn 2017, BIC joined the Vision Zero Task Force to leverage its role as a regulator
to make the trade waste industry safer, protect workers and the public, and
prevent tragedies on the road. Together, BIC and the Department of Sanitation
(DSNY) lead the Commercial Waste Zone Collection Safety Working Group,
which is comprised of members of the trade waste industry, union leaders,
and environmental and street safety advocates.
The Working Group is in the process of creating a universal safety manual for
private carting companies in the city to use as a guide for developing their
own safety programs. Contents of the manual include a checklist of tasks
drivers should perform in their pre-trip and post-trip truck inspections, as well
as a complete list of the safety equipment all trade waste trucks, drivers,
and helpers should have. BIC and DSNY anticipate releasing the final safety
manual in February 2018.
In addition, the Working Group has begun to develop a video training curriculum
using the guidelines outlined in the safety manual. Because employees in the
trade waste industry typically work overnight and may not be able to attend a
scheduled daytime training, video training is an essential tool. When the curriculum
is complete, it will be made available to all trade waste companies.
Working with Professionals
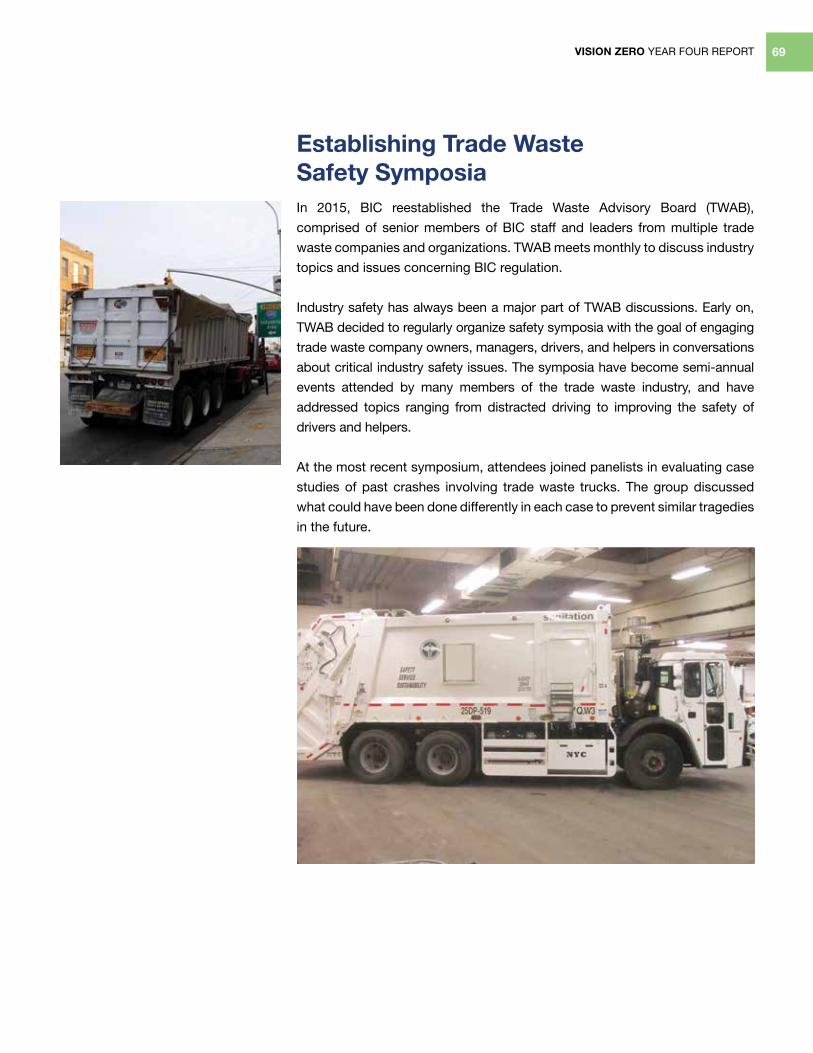
VISION ZERO YEAR FOUR REPORT 69
Establishing Trade Waste Safety Symposia In 2015, BIC reestablished the Trade Waste Advisory Board (TWAB),
comprised of senior members of BIC staff and leaders from multiple trade
waste companies and organizations. TWAB meets monthly to discuss industry
topics and issues concerning BIC regulation.
Industry safety has always been a major part of TWAB discussions. Early on,
TWAB decided to regularly organize safety symposia with the goal of engaging
trade waste company owners, managers, drivers, and helpers in conversations
about critical industry safety issues. The symposia have become semi-annual
events attended by many members of the trade waste industry, and have
addressed topics ranging from distracted driving to improving the safety of
drivers and helpers.
At the most recent symposium, attendees joined panelists in evaluating case
studies of past crashes involving trade waste trucks. The group discussed
what could have been done differently in each case to prevent similar tragedies
in the future.
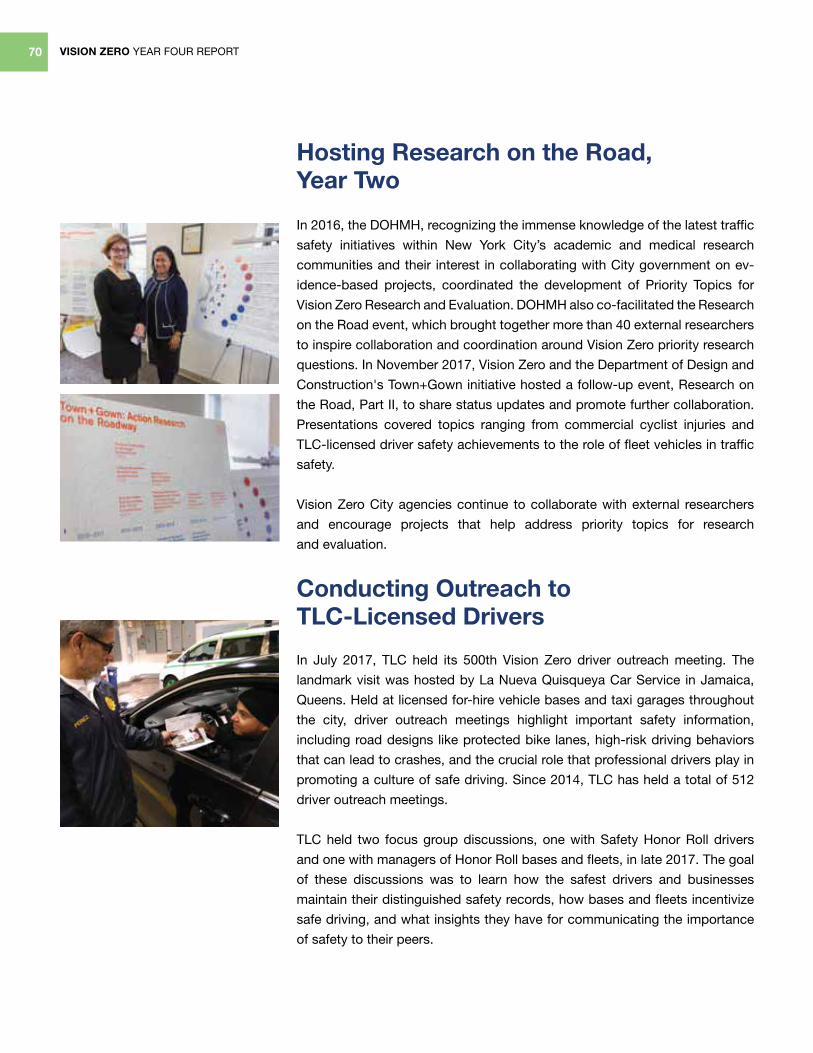
VISION ZERO YEAR FOUR REPORT70
Hosting Research on the Road, Year Two In 2016, the DOHMH, recognizing the immense knowledge of the latest traffic
safety initiatives within New York City’s academic and medical research
communities and their interest in collaborating with City government on ev-
idence-based projects, coordinated the development of Priority Topics for
Vision Zero Research and Evaluation. DOHMH also co-facilitated the Research
on the Road event, which brought together more than 40 external researchers
to inspire collaboration and coordination around Vision Zero priority research
questions. In November 2017, Vision Zero and the Department of Design and
Construction's Town+Gown initiative hosted a follow-up event, Research on
the Road, Part II, to share status updates and promote further collaboration.
Presentations covered topics ranging from commercial cyclist injuries and
TLC-licensed driver safety achievements to the role of fleet vehicles in traffic
safety.
Vision Zero City agencies continue to collaborate with external researchers
and encourage projects that help address priority topics for research
and evaluation.
Conducting Outreach to
TLC-Licensed Drivers
In July 2017, TLC held its 500th Vision Zero driver outreach meeting. The
landmark visit was hosted by La Nueva Quisqueya Car Service in Jamaica,
Queens. Held at licensed for-hire vehicle bases and taxi garages throughout
the city, driver outreach meetings highlight important safety information,
including road designs like protected bike lanes, high-risk driving behaviors
that can lead to crashes, and the crucial role that professional drivers play in
promoting a culture of safe driving. Since 2014, TLC has held a total of 512
driver outreach meetings.
TLC held two focus group discussions, one with Safety Honor Roll drivers
and one with managers of Honor Roll bases and fleets, in late 2017. The goal
of these discussions was to learn how the safest drivers and businesses
maintain their distinguished safety records, how bases and fleets incentivize
safe driving, and what insights they have for communicating the importance
of safety to their peers.
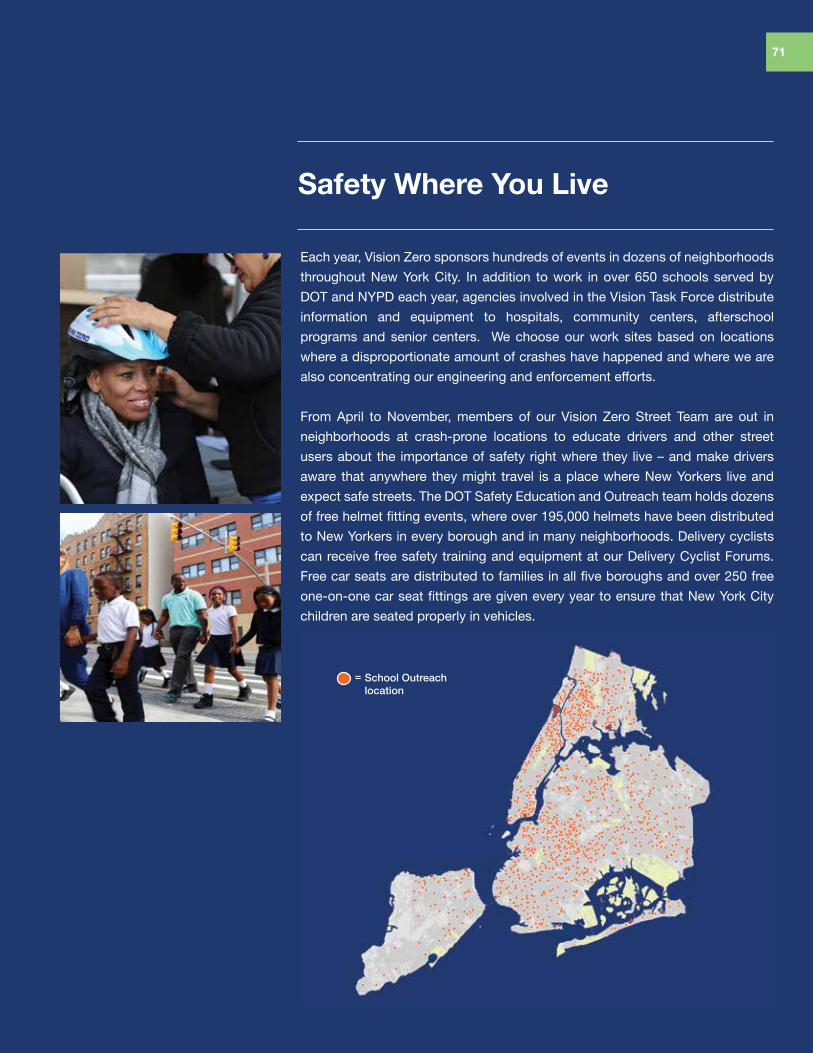
Safety Where You Live
Each year, Vision Zero sponsors hundreds of events in dozens of neighborhoods
throughout New York City. In addition to work in over 650 schools served by
DOT and NYPD each year, agencies involved in the Vision Task Force distribute
information and equipment to hospitals, community centers, afterschool
programs and senior centers. We choose our work sites based on locations
where a disproportionate amount of crashes have happened and where we are
also concentrating our engineering and enforcement efforts.
From April to November, members of our Vision Zero Street Team are out in
neighborhoods at crash-prone locations to educate drivers and other street
users about the importance of safety right where they live – and make drivers
aware that anywhere they might travel is a place where New Yorkers live and
expect safe streets. The DOT Safety Education and Outreach team holds dozens
of free helmet fitting events, where over 195,000 helmets have been distributed
to New Yorkers in every borough and in many neighborhoods. Delivery cyclists
can receive free safety training and equipment at our Delivery Cyclist Forums.
Free car seats are distributed to families in all five boroughs and over 250 free
one-on-one car seat fittings are given every year to ensure that New York City
children are seated properly in vehicles.
71VISION ZERO YEAR FOUR REPORT
School Outreach location
=
Centralize administration of License Event Notification System through DCAS
VISION ZERO YEAR FOUR REPORT72
Department of Transportation
New York Police Department
Department of Citywide Administrative Services
Vision Zero Year 5
New Initiatives
Intensify street safety improvements in areas with high concentrations of senior citizens and senior pedestrian injuries
Implement Bicycle Priority Districts to increase lane-mileage of bike lanes in areas with disproportionate KSIs relative to their infrastructure
Examine locations where pedestrians are killed on or near highways.
» Update Borough Pedestrian Safety Action Plan priority maps based on analysis of recent KSI data
Convene a working group to plan a Vision Zero-focused driver education program for under-25s.
Use data analysis to proactively identify intersections at which new traffic signals are likely warranted.
Expand outreach and enforcement program for intercity buses, charter buses, and commercial trucks
Explore ways to increase the role of the neighborhood policing program into traffic strategy
Evaluate and improve utilization of AC 19-190
Explore using NYPD auxiliary officers to manage pedestrians and effect positive change in driver’s behavior at inter-sections with notable crash/injury histories with the underlying goal of enhancing pedestrian and bicyclist safety
Roll out NYPD Transportation Bureau Community Outreach Unit
Activate a Fleet Office of Real Time Tracking (FORT) to track the safety and utilization of City fleet units
Implement the first formal investments in new safety equipment as part of the Safe Fleet Transition Plan
Start posting stickers on City vehicles that encourage the public to call 311 if they see unsafe or problematic driving
Expand current in-person training initiative under Vision Zero to include online and interactive virtual training.
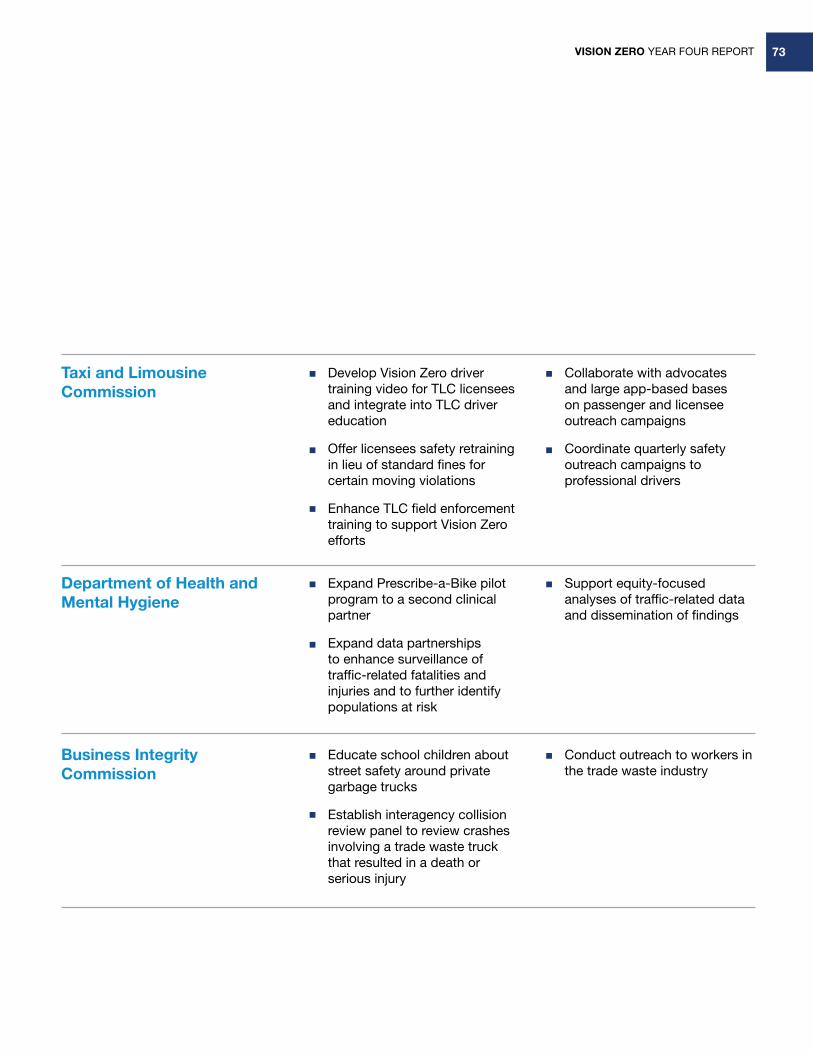
VISION ZERO YEAR FOUR REPORT 73
Business Integrity Commission
Educate school children about street safety around private garbage trucks
Establish interagency collision review panel to review crashes involving a trade waste truck that resulted in a death or serious injury
Conduct outreach to workers in the trade waste industry
Taxi and Limousine Commission
Develop Vision Zero driver training video for TLC licensees and integrate into TLC driver education
Offer licensees safety retraining in lieu of standard fines for certain moving violations
Enhance TLC field enforcement training to support Vision Zero efforts
Collaborate with advocates and large app-based bases on passenger and licensee outreach campaigns
Coordinate quarterly safety outreach campaigns to professional drivers
Department of Health and Mental Hygiene
Expand Prescribe-a-Bike pilot program to a second clinical partner
Expand data partnerships to enhance surveillance of traffic-related fatalities and injuries and to further identify populations at risk
Support equity-focused analyses of traffic-related data and dissemination of findings

VISION ZERO YEAR FOUR REPORT74
Appendix
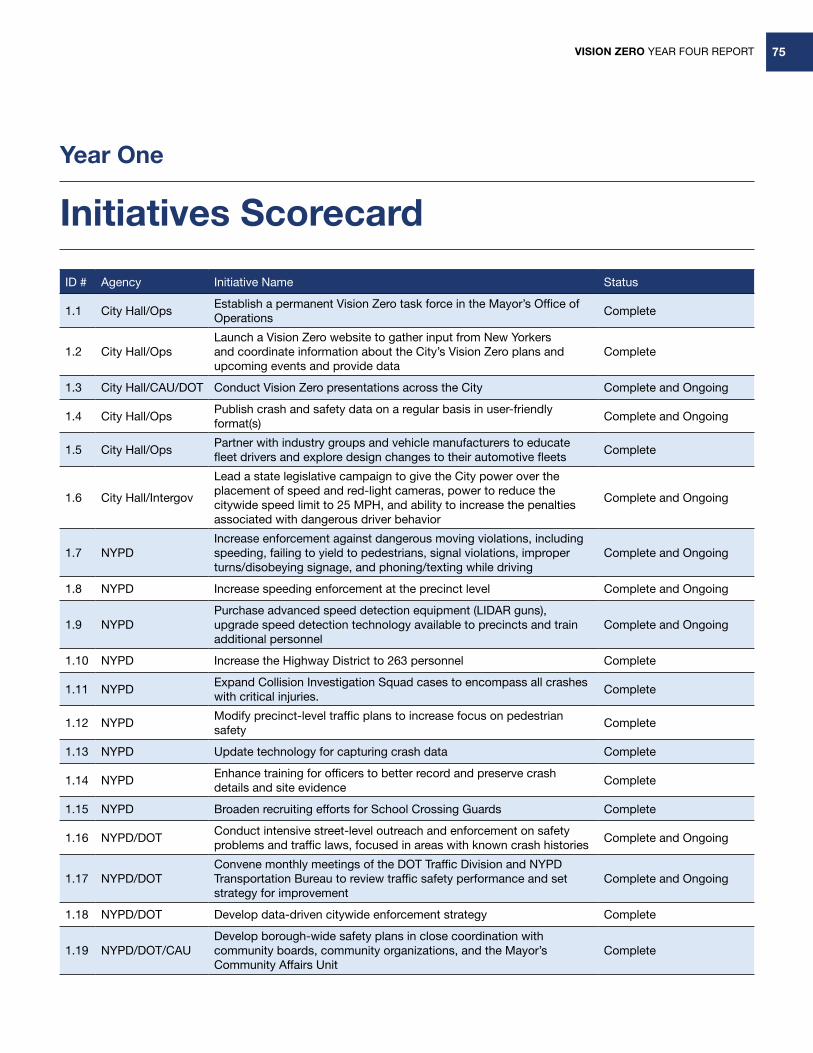
VISION ZERO YEAR FOUR REPORT 75
Year One
Initiatives Scorecard
ID # Agency Initiative Name Status
1.1 City Hall/OpsEstablish a permanent Vision Zero task force in the Mayor’s Office of Operations
Complete
1.2 City Hall/OpsLaunch a Vision Zero website to gather input from New Yorkers and coordinate information about the City’s Vision Zero plans and upcoming events and provide data
Complete
1.3 City Hall/CAU/DOT Conduct Vision Zero presentations across the City Complete and Ongoing
1.4 City Hall/OpsPublish crash and safety data on a regular basis in user-friendly format(s)
Complete and Ongoing
1.5 City Hall/OpsPartner with industry groups and vehicle manufacturers to educate fleet drivers and explore design changes to their automotive fleets
Complete
1.6 City Hall/Intergov
Lead a state legislative campaign to give the City power over the placement of speed and red-light cameras, power to reduce the citywide speed limit to 25 MPH, and ability to increase the penalties associated with dangerous driver behavior
Complete and Ongoing
1.7 NYPDIncrease enforcement against dangerous moving violations, including speeding, failing to yield to pedestrians, signal violations, improper turns/disobeying signage, and phoning/texting while driving
Complete and Ongoing
1.8 NYPD Increase speeding enforcement at the precinct level Complete and Ongoing
1.9 NYPDPurchase advanced speed detection equipment (LIDAR guns), upgrade speed detection technology available to precincts and train additional personnel
Complete and Ongoing
1.10 NYPD Increase the Highway District to 263 personnel Complete
1.11 NYPDExpand Collision Investigation Squad cases to encompass all crashes with critical injuries.
Complete
1.12 NYPDModify precinct-level traffic plans to increase focus on pedestrian safety
Complete
1.13 NYPD Update technology for capturing crash data Complete
1.14 NYPDEnhance training for officers to better record and preserve crash details and site evidence
Complete
1.15 NYPD Broaden recruiting efforts for School Crossing Guards Complete
1.16 NYPD/DOTConduct intensive street-level outreach and enforcement on safety problems and traffic laws, focused in areas with known crash histories
Complete and Ongoing
1.17 NYPD/DOTConvene monthly meetings of the DOT Traffic Division and NYPD Transportation Bureau to review traffic safety performance and set strategy for improvement
Complete and Ongoing
1.18 NYPD/DOT Develop data-driven citywide enforcement strategy Complete
1.19 NYPD/DOT/CAUDevelop borough-wide safety plans in close coordination with community boards, community organizations, and the Mayor’s Community Affairs Unit
Complete
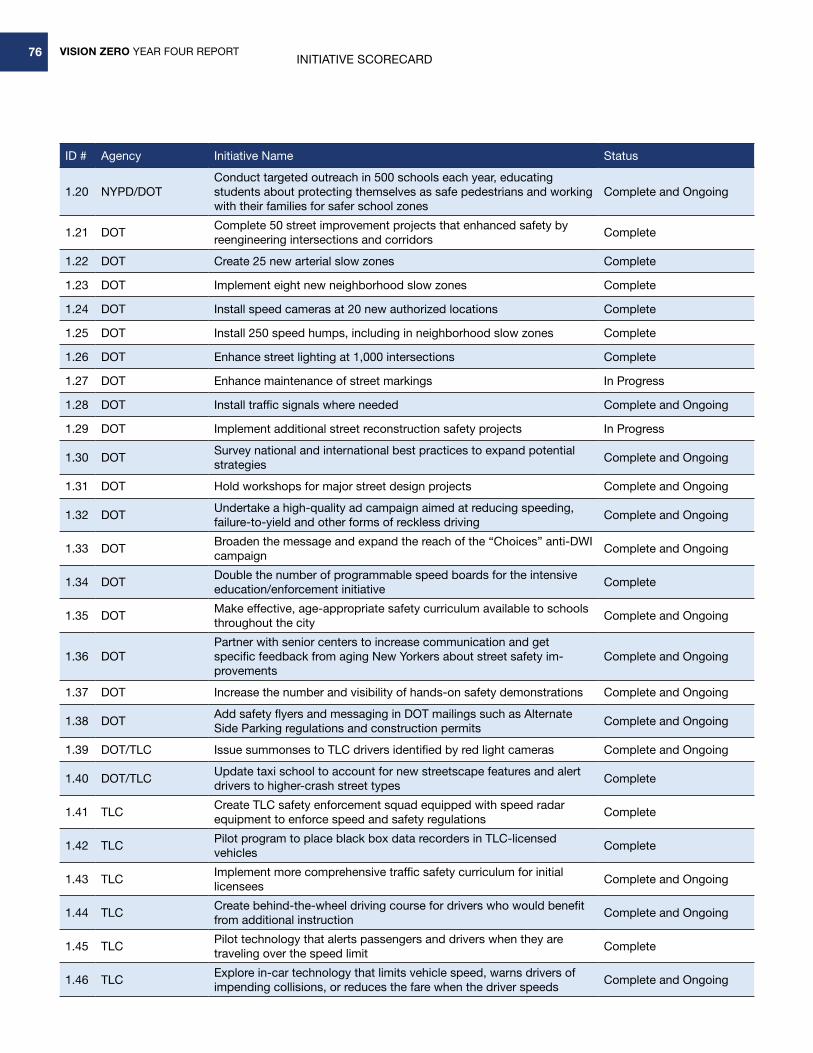
VISION ZERO YEAR FOUR REPORT76
ID # Agency Initiative Name Status
1.20 NYPD/DOTConduct targeted outreach in 500 schools each year, educating students about protecting themselves as safe pedestrians and working with their families for safer school zones
Complete and Ongoing
1.21 DOTComplete 50 street improvement projects that enhanced safety by reengineering intersections and corridors
Complete
1.22 DOT Create 25 new arterial slow zones Complete
1.23 DOT Implement eight new neighborhood slow zones Complete
1.24 DOT Install speed cameras at 20 new authorized locations Complete
1.25 DOT Install 250 speed humps, including in neighborhood slow zones Complete
1.26 DOT Enhance street lighting at 1,000 intersections Complete
1.27 DOT Enhance maintenance of street markings In Progress
1.28 DOT Install traffic signals where needed Complete and Ongoing
1.29 DOT Implement additional street reconstruction safety projects In Progress
1.30 DOTSurvey national and international best practices to expand potential strategies
Complete and Ongoing
1.31 DOT Hold workshops for major street design projects Complete and Ongoing
1.32 DOTUndertake a high-quality ad campaign aimed at reducing speeding, failure-to-yield and other forms of reckless driving
Complete and Ongoing
1.33 DOTBroaden the message and expand the reach of the “Choices” anti-DWI campaign
Complete and Ongoing
1.34 DOTDouble the number of programmable speed boards for the intensive education/enforcement initiative
Complete
1.35 DOTMake effective, age-appropriate safety curriculum available to schools throughout the city
Complete and Ongoing
1.36 DOTPartner with senior centers to increase communication and get specific feedback from aging New Yorkers about street safety im-provements
Complete and Ongoing
1.37 DOT Increase the number and visibility of hands-on safety demonstrations Complete and Ongoing
1.38 DOTAdd safety flyers and messaging in DOT mailings such as Alternate Side Parking regulations and construction permits
Complete and Ongoing
1.39 DOT/TLC Issue summonses to TLC drivers identified by red light cameras Complete and Ongoing
1.40 DOT/TLCUpdate taxi school to account for new streetscape features and alert drivers to higher-crash street types
Complete
1.41 TLCCreate TLC safety enforcement squad equipped with speed radar equipment to enforce speed and safety regulations
Complete
1.42 TLCPilot program to place black box data recorders in TLC-licensed vehicles
Complete
1.43 TLCImplement more comprehensive traffic safety curriculum for initial licensees
Complete and Ongoing
1.44 TLCCreate behind-the-wheel driving course for drivers who would benefit from additional instruction
Complete and Ongoing
1.45 TLCPilot technology that alerts passengers and drivers when they are traveling over the speed limit
Complete
1.46 TLCExplore in-car technology that limits vehicle speed, warns drivers of impending collisions, or reduces the fare when the driver speeds
Complete and Ongoing
INITIATIVE SCORECARD
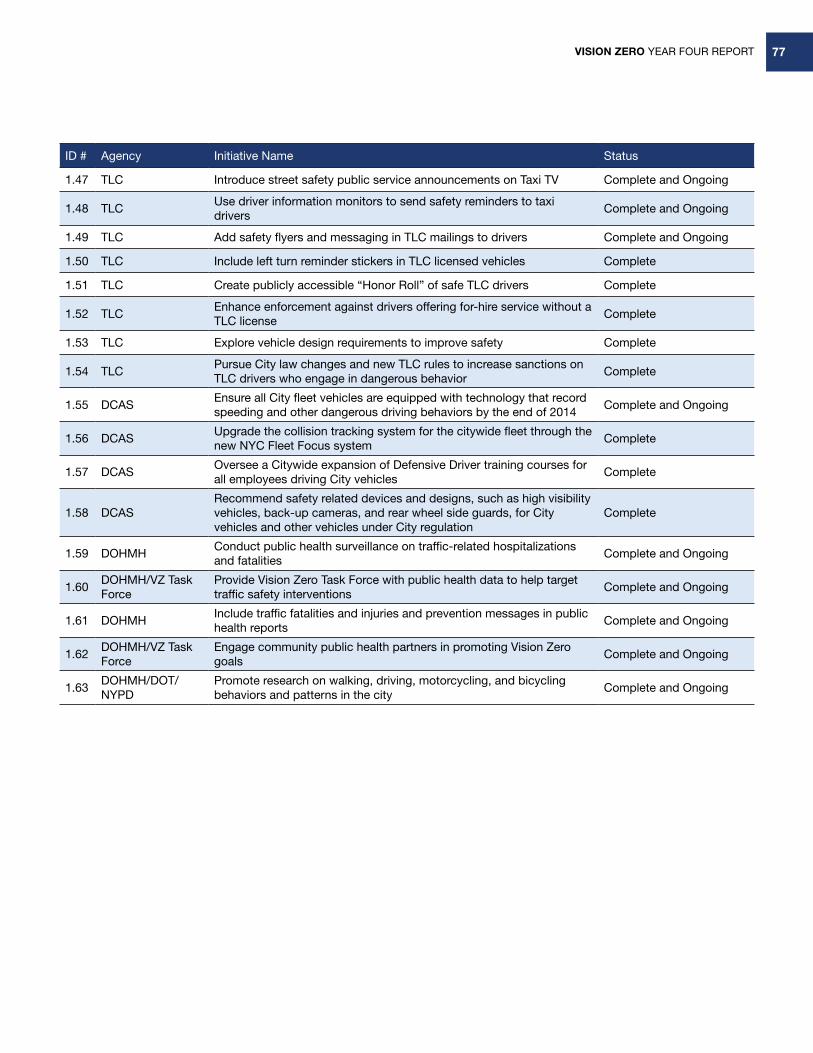
VISION ZERO YEAR FOUR REPORT 77
ID # Agency Initiative Name Status
1.47 TLC Introduce street safety public service announcements on Taxi TV Complete and Ongoing
1.48 TLCUse driver information monitors to send safety reminders to taxi drivers
Complete and Ongoing
1.49 TLC Add safety flyers and messaging in TLC mailings to drivers Complete and Ongoing
1.50 TLC Include left turn reminder stickers in TLC licensed vehicles Complete
1.51 TLC Create publicly accessible “Honor Roll” of safe TLC drivers Complete
1.52 TLCEnhance enforcement against drivers offering for-hire service without a TLC license
Complete
1.53 TLC Explore vehicle design requirements to improve safety Complete
1.54 TLCPursue City law changes and new TLC rules to increase sanctions on TLC drivers who engage in dangerous behavior
Complete
1.55 DCASEnsure all City fleet vehicles are equipped with technology that record speeding and other dangerous driving behaviors by the end of 2014
Complete and Ongoing
1.56 DCASUpgrade the collision tracking system for the citywide fleet through the new NYC Fleet Focus system
Complete
1.57 DCASOversee a Citywide expansion of Defensive Driver training courses for all employees driving City vehicles
Complete
1.58 DCASRecommend safety related devices and designs, such as high visibility vehicles, back-up cameras, and rear wheel side guards, for City vehicles and other vehicles under City regulation
Complete
1.59 DOHMHConduct public health surveillance on traffic-related hospitalizations and fatalities
Complete and Ongoing
1.60DOHMH/VZ Task Force
Provide Vision Zero Task Force with public health data to help target traffic safety interventions
Complete and Ongoing
1.61 DOHMHInclude traffic fatalities and injuries and prevention messages in public health reports
Complete and Ongoing
1.62DOHMH/VZ Task Force
Engage community public health partners in promoting Vision Zero goals
Complete and Ongoing
1.63DOHMH/DOT/NYPD
Promote research on walking, driving, motorcycling, and bicycling behaviors and patterns in the city
Complete and Ongoing
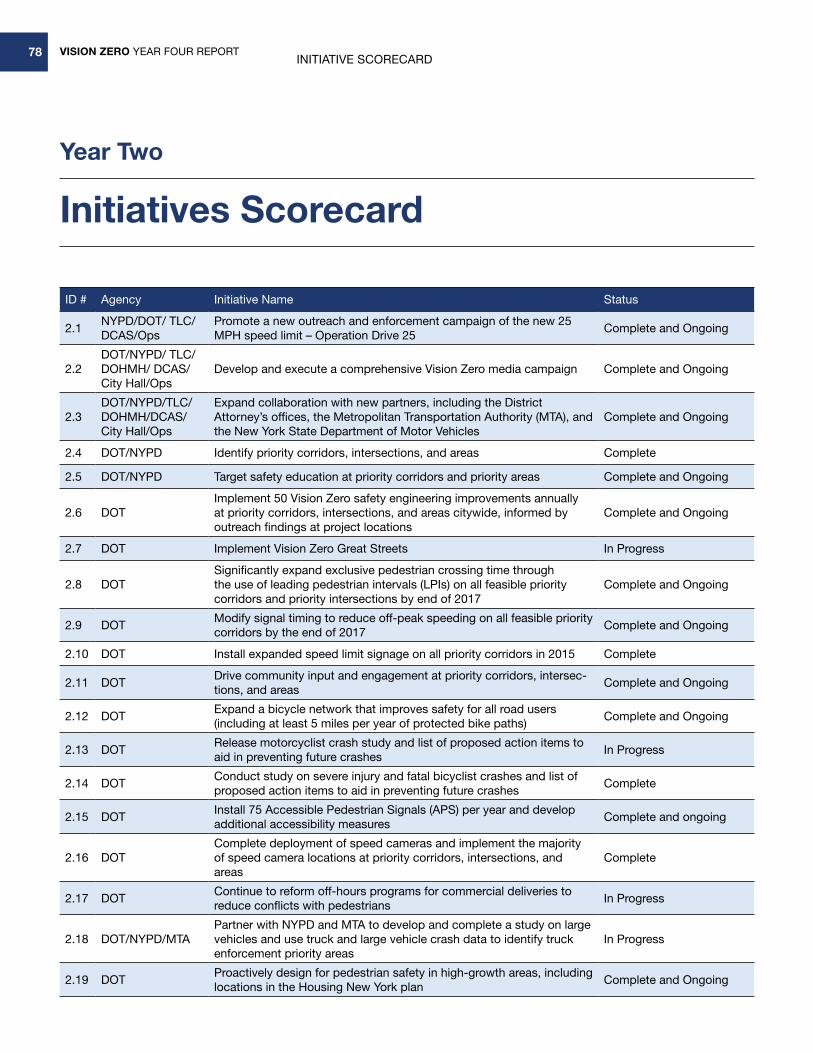
VISION ZERO YEAR FOUR REPORT78INITIATIVE SCORECARD
Year Two
Initiatives Scorecard
ID # Agency Initiative Name Status
2.1NYPD/DOT/ TLC/DCAS/Ops
Promote a new outreach and enforcement campaign of the new 25 MPH speed limit – Operation Drive 25
Complete and Ongoing
2.2DOT/NYPD/ TLC/DOHMH/ DCAS/City Hall/Ops
Develop and execute a comprehensive Vision Zero media campaign Complete and Ongoing
2.3DOT/NYPD/TLC/DOHMH/DCAS/City Hall/Ops
Expand collaboration with new partners, including the District Attorney’s offices, the Metropolitan Transportation Authority (MTA), and the New York State Department of Motor Vehicles
Complete and Ongoing
2.4 DOT/NYPD Identify priority corridors, intersections, and areas Complete
2.5 DOT/NYPD Target safety education at priority corridors and priority areas Complete and Ongoing
2.6 DOTImplement 50 Vision Zero safety engineering improvements annually at priority corridors, intersections, and areas citywide, informed by outreach findings at project locations
Complete and Ongoing
2.7 DOT Implement Vision Zero Great Streets In Progress
2.8 DOTSignificantly expand exclusive pedestrian crossing time through the use of leading pedestrian intervals (LPIs) on all feasible priority corridors and priority intersections by end of 2017
Complete and Ongoing
2.9 DOTModify signal timing to reduce off-peak speeding on all feasible priority corridors by the end of 2017
Complete and Ongoing
2.10 DOT Install expanded speed limit signage on all priority corridors in 2015 Complete
2.11 DOTDrive community input and engagement at priority corridors, intersec-tions, and areas
Complete and Ongoing
2.12 DOTExpand a bicycle network that improves safety for all road users (including at least 5 miles per year of protected bike paths)
Complete and Ongoing
2.13 DOTRelease motorcyclist crash study and list of proposed action items to aid in preventing future crashes
In Progress
2.14 DOTConduct study on severe injury and fatal bicyclist crashes and list of proposed action items to aid in preventing future crashes
Complete
2.15 DOTInstall 75 Accessible Pedestrian Signals (APS) per year and develop additional accessibility measures
Complete and ongoing
2.16 DOTComplete deployment of speed cameras and implement the majority of speed camera locations at priority corridors, intersections, and areas
Complete
2.17 DOTContinue to reform off-hours programs for commercial deliveries to reduce conflicts with pedestrians
In Progress
2.18 DOT/NYPD/MTAPartner with NYPD and MTA to develop and complete a study on large vehicles and use truck and large vehicle crash data to identify truck enforcement priority areas
In Progress
2.19 DOTProactively design for pedestrian safety in high-growth areas, including locations in the Housing New York plan
Complete and Ongoing
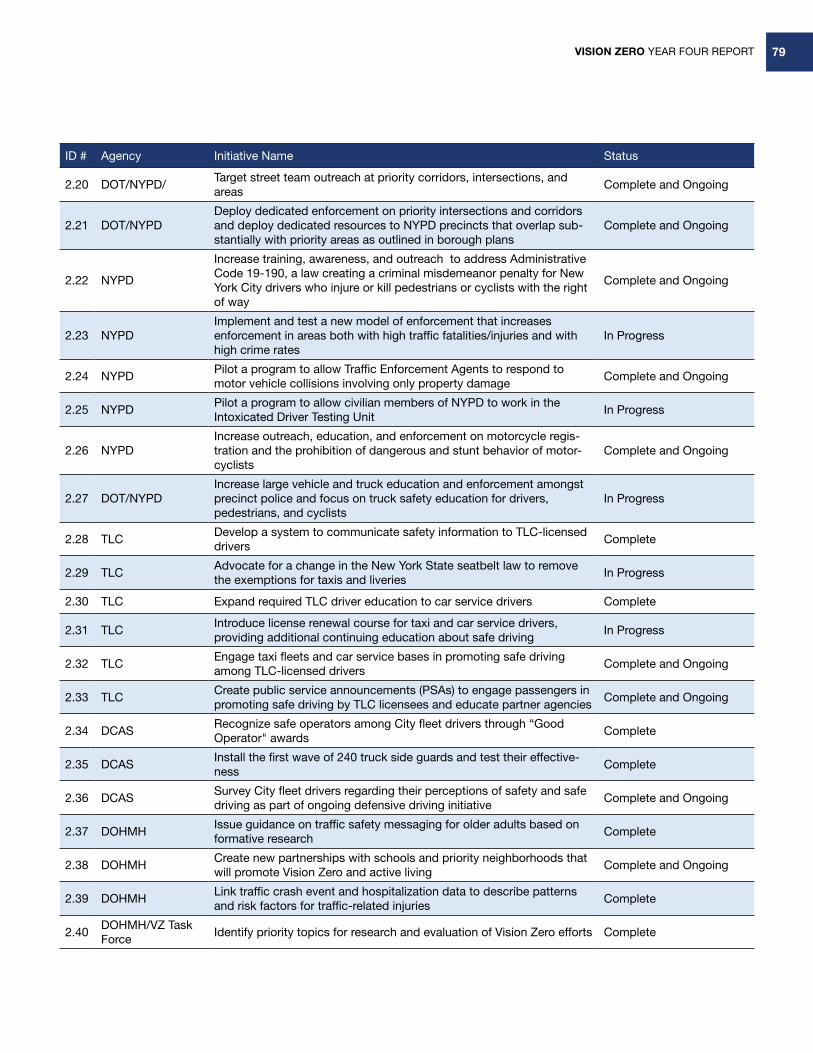
VISION ZERO YEAR FOUR REPORT 79
ID # Agency Initiative Name Status
2.20 DOT/NYPD/Target street team outreach at priority corridors, intersections, and areas
Complete and Ongoing
2.21 DOT/NYPDDeploy dedicated enforcement on priority intersections and corridors and deploy dedicated resources to NYPD precincts that overlap sub-stantially with priority areas as outlined in borough plans
Complete and Ongoing
2.22 NYPD
Increase training, awareness, and outreach to address Administrative Code 19-190, a law creating a criminal misdemeanor penalty for New York City drivers who injure or kill pedestrians or cyclists with the right of way
Complete and Ongoing
2.23 NYPDImplement and test a new model of enforcement that increases enforcement in areas both with high traffic fatalities/injuries and with high crime rates
In Progress
2.24 NYPDPilot a program to allow Traffic Enforcement Agents to respond to motor vehicle collisions involving only property damage
Complete and Ongoing
2.25 NYPDPilot a program to allow civilian members of NYPD to work in the Intoxicated Driver Testing Unit
In Progress
2.26 NYPDIncrease outreach, education, and enforcement on motorcycle regis-tration and the prohibition of dangerous and stunt behavior of motor-cyclists
Complete and Ongoing
2.27 DOT/NYPDIncrease large vehicle and truck education and enforcement amongst precinct police and focus on truck safety education for drivers, pedestrians, and cyclists
In Progress
2.28 TLCDevelop a system to communicate safety information to TLC-licensed drivers
Complete
2.29 TLCAdvocate for a change in the New York State seatbelt law to remove the exemptions for taxis and liveries
In Progress
2.30 TLC Expand required TLC driver education to car service drivers Complete
2.31 TLCIntroduce license renewal course for taxi and car service drivers, providing additional continuing education about safe driving
In Progress
2.32 TLCEngage taxi fleets and car service bases in promoting safe driving among TLC-licensed drivers
Complete and Ongoing
2.33 TLCCreate public service announcements (PSAs) to engage passengers in promoting safe driving by TLC licensees and educate partner agencies
Complete and Ongoing
2.34 DCASRecognize safe operators among City fleet drivers through “Good Operator" awards
Complete
2.35 DCASInstall the first wave of 240 truck side guards and test their effective-ness
Complete
2.36 DCASSurvey City fleet drivers regarding their perceptions of safety and safe driving as part of ongoing defensive driving initiative
Complete and Ongoing
2.37 DOHMHIssue guidance on traffic safety messaging for older adults based on formative research
Complete
2.38 DOHMHCreate new partnerships with schools and priority neighborhoods that will promote Vision Zero and active living
Complete and Ongoing
2.39 DOHMHLink traffic crash event and hospitalization data to describe patterns and risk factors for traffic-related injuries
Complete
2.40DOHMH/VZ Task Force
Identify priority topics for research and evaluation of Vision Zero efforts Complete
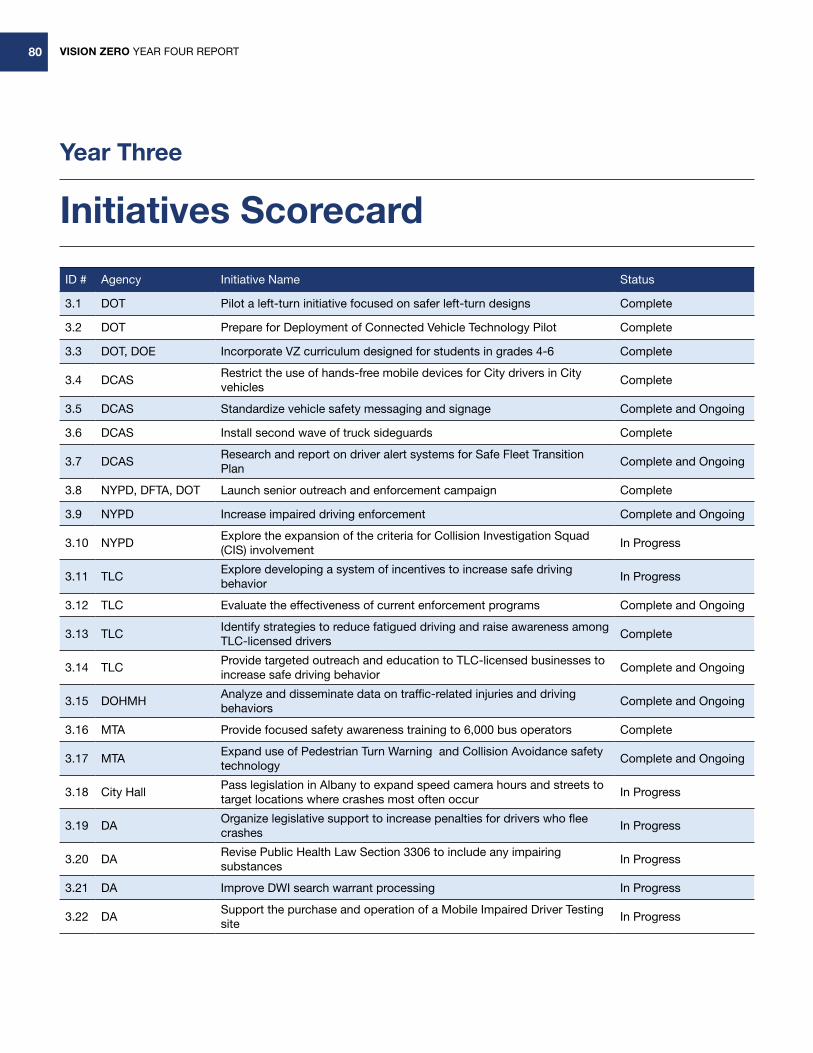
VISION ZERO YEAR FOUR REPORT80
Year Three
Initiatives Scorecard
ID # Agency Initiative Name Status
3.1 DOT Pilot a left-turn initiative focused on safer left-turn designs Complete
3.2 DOT Prepare for Deployment of Connected Vehicle Technology Pilot Complete
3.3 DOT, DOE Incorporate VZ curriculum designed for students in grades 4-6 Complete
3.4 DCASRestrict the use of hands-free mobile devices for City drivers in City vehicles
Complete
3.5 DCAS Standardize vehicle safety messaging and signage Complete and Ongoing
3.6 DCAS Install second wave of truck sideguards Complete
3.7 DCASResearch and report on driver alert systems for Safe Fleet Transition Plan
Complete and Ongoing
3.8 NYPD, DFTA, DOT Launch senior outreach and enforcement campaign Complete
3.9 NYPD Increase impaired driving enforcement Complete and Ongoing
3.10 NYPDExplore the expansion of the criteria for Collision Investigation Squad (CIS) involvement
In Progress
3.11 TLCExplore developing a system of incentives to increase safe driving behavior
In Progress
3.12 TLC Evaluate the effectiveness of current enforcement programs Complete and Ongoing
3.13 TLCIdentify strategies to reduce fatigued driving and raise awareness among TLC-licensed drivers
Complete
3.14 TLCProvide targeted outreach and education to TLC-licensed businesses to increase safe driving behavior
Complete and Ongoing
3.15 DOHMHAnalyze and disseminate data on traffic-related injuries and driving behaviors
Complete and Ongoing
3.16 MTA Provide focused safety awareness training to 6,000 bus operators Complete
3.17 MTAExpand use of Pedestrian Turn Warning and Collision Avoidance safety technology
Complete and Ongoing
3.18 City HallPass legislation in Albany to expand speed camera hours and streets to target locations where crashes most often occur
In Progress
3.19 DAOrganize legislative support to increase penalties for drivers who flee crashes
In Progress
3.20 DARevise Public Health Law Section 3306 to include any impairing substances
In Progress
3.21 DA Improve DWI search warrant processing In Progress
3.22 DASupport the purchase and operation of a Mobile Impaired Driver Testing site
In Progress
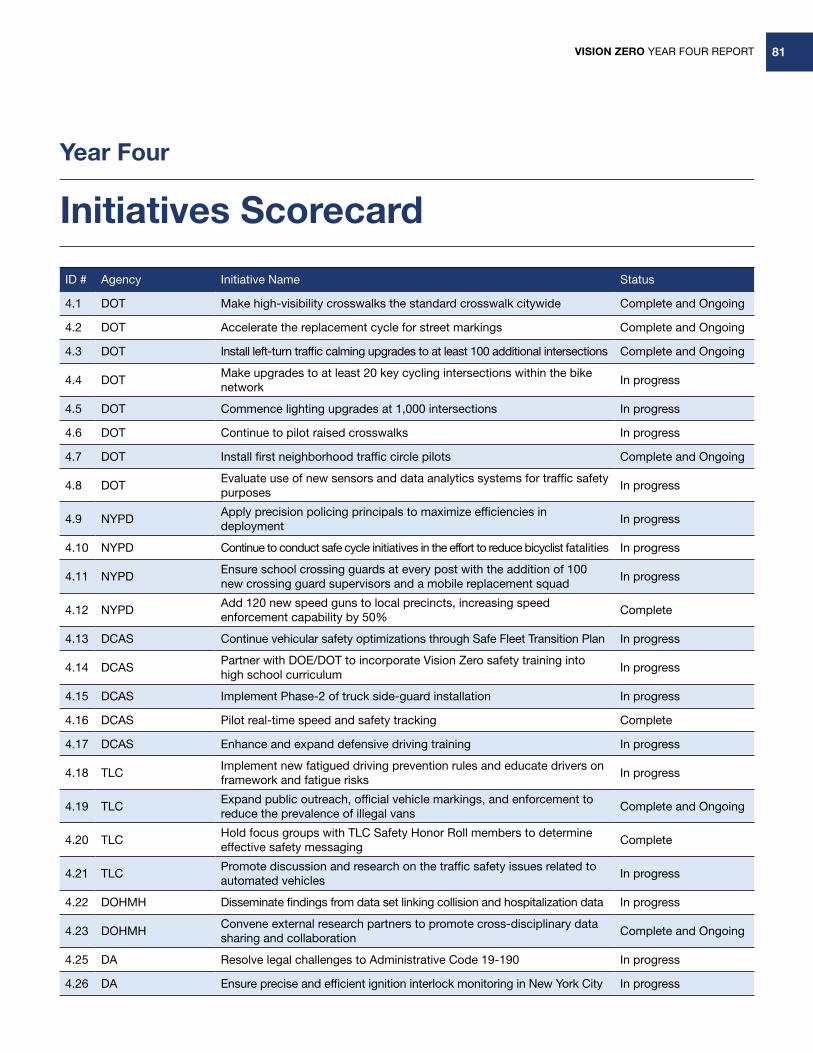
VISION ZERO YEAR FOUR REPORT 81
Year Four
Initiatives Scorecard
ID # Agency Initiative Name Status
4.1 DOT Make high-visibility crosswalks the standard crosswalk citywide Complete and Ongoing
4.2 DOT Accelerate the replacement cycle for street markings Complete and Ongoing
4.3 DOT Install left-turn traffic calming upgrades to at least 100 additional intersections Complete and Ongoing
4.4 DOTMake upgrades to at least 20 key cycling intersections within the bike network
In progress
4.5 DOT Commence lighting upgrades at 1,000 intersections In progress
4.6 DOT Continue to pilot raised crosswalks In progress
4.7 DOT Install first neighborhood traffic circle pilots Complete and Ongoing
4.8 DOTEvaluate use of new sensors and data analytics systems for traffic safety purposes
In progress
4.9 NYPDApply precision policing principals to maximize efficiencies in deployment
In progress
4.10 NYPD Continue to conduct safe cycle initiatives in the effort to reduce bicyclist fatalities In progress
4.11 NYPDEnsure school crossing guards at every post with the addition of 100 new crossing guard supervisors and a mobile replacement squad
In progress
4.12 NYPDAdd 120 new speed guns to local precincts, increasing speed enforcement capability by 50%
Complete
4.13 DCAS Continue vehicular safety optimizations through Safe Fleet Transition Plan In progress
4.14 DCASPartner with DOE/DOT to incorporate Vision Zero safety training into high school curriculum
In progress
4.15 DCAS Implement Phase-2 of truck side-guard installation In progress
4.16 DCAS Pilot real-time speed and safety tracking Complete
4.17 DCAS Enhance and expand defensive driving training In progress
4.18 TLCImplement new fatigued driving prevention rules and educate drivers on framework and fatigue risks
In progress
4.19 TLCExpand public outreach, official vehicle markings, and enforcement to reduce the prevalence of illegal vans
Complete and Ongoing
4.20 TLCHold focus groups with TLC Safety Honor Roll members to determine effective safety messaging
Complete
4.21 TLCPromote discussion and research on the traffic safety issues related to automated vehicles
In progress
4.22 DOHMH Disseminate findings from data set linking collision and hospitalization data In progress
4.23 DOHMHConvene external research partners to promote cross-disciplinary data sharing and collaboration
Complete and Ongoing
4.25 DA Resolve legal challenges to Administrative Code 19-190 In progress
4.26 DA Ensure precise and efficient ignition interlock monitoring in New York City In progress
VISION ZERO YEAR FOUR REPORT82
Glossary19-190
A City Law creating a criminal misdemeanor penalty for New York City drivers who injure or kill pedestrians or cyclists with the right of way. In Fall 2016, the City Council passed an amendment that specified that motorists must yield to all pedestrians who enter the crosswalk during the walking person phase or the flashing red hand phase.
Accessible Pedestrian Signals
Devices which assist pedestrians who are blind or have low vision in crossing at a signalized intersection. APS provide information in non-visual formats, such as audible tones, speech messages and vibrating surfaces to alert pedestrians when the “walk” phase is available at a given intersection.
Arterial
A wide high-volume roadway.
Arterial Slow Zones
A program that uses a combination of a lower speed limit, signal timing changes, distinctive signs, and increased enforcement to improve safety on some of New York City’s highest-crash corridors.
CANceiver
A device mounted in a vehicle that measures the vehicle speed, acceleration, and hard braking events.
CRASH
The New York City vehicle collision and incident management system. All fleet agencies except NYPD are currently using CRASH. It was launched in FY2014.
Curb Extension
Also known as a neckdown. This is an expansion of the curb line into the lane of the roadway adjacent to the curb for a portion of a block either at a corner or mid-block, which creates more pedestrian space.
Enhanced Crossing
A type of marked pedestrian crossing that can be installed in places where traffic controls are not appropriate. An enhanced crossing includes ADA-compliant pedestrian ramps, high-visibility crosswalk markings, and pedestrian warning signs to alert drivers. By New York State law, drivers must yield to pedestrians at these crossings.
For-hire Vehicle (FHV)
Vehicles other than taxis and commuter vans that are licensed by TLC to transport the public. They include community car services (also known as liveries), black cars (which include app-based black cars, such as those dispatched by Uber), and certain luxury limousines.
FORMS (Finest Online Records Management System)
An electronic database that replaced the existing legacy collision system and was deployed by NYPD on March 14, 2016. In addition to replacing the existing department database, it allows officers to do direct entry crash reporting using mobile devices.
Killed or Seriously Injured (KSI)Calculation
A method of analyzing the potential danger of a corridor or intersection by measuring the number of people killed or seriously injured at that location (calculated as a
per mile rate for corridors).
Leading Pedestrian Interval (LPI)
A signal timing strategy designed to reduce turning vehicle/pedestrian conflicts. With an LPI the walk signal is displayed before the parallel movement of traffic gets a green light. This allows pedestrians to start their crossing and establish a presence in the crosswalk before the traffic is released.
LIDAR Gun
A laser device used by the police for speed limit enforcement. LIDAR guns allow a police officer to measure the speed of an individual vehicle within a stream of traffic.
Neighborhood Slow Zone
A community based program that reduces the speed limit to 20 MPH in a select neighborhood area with a combination of markings, signage and speed humps. Slow Zones are selected through a competitive application process, and are meant to reduce speeds and lower the incidence and severity of crashes in New York City’s residential areas.
NORC
An abbreviation for “naturally occurring retirement community,” a term used to describe an area that was not planned as housing for senior citizens, but which has a large proportion of older people living there. In New York City, a NORC must have at least 500 residents aged 60 or older, or at least 250 seniors and 45 percent of housing units containing a head of household who is at least 60 years old. Many NORCs offer programs and support services specifically designed for the needs of older New Yorkers.
VISION ZERO YEAR FOUR REPORT 83
Pedestrian Safety Island
A raised area located at crosswalks that serves as pedestrian refuge separating traffic lanes or directions, particularly on wide roadways.
Precision policing (in Traffic Enforcement)
Focusing targeted, highly visible traffic enforcement on the locations with the greatest number of crashes with injury. Greater use of technology will allow NYPD to identify the specific crash causing violations and evaluate the impact of enforcement efforts in these locations in order to adjust as necessary to reduce crashes.
Priority Corridor
A selection of streets measuring at least one mile in length in each borough, which were ranked on a pedestrian KSI per-mile basis. Corridors were selected from the top of this list until the cumulative number of pedestrian KSI reached half of the borough’s total.
Priority Intersection
A selection of intersections with the highest number of pedestrian KSI that cumulatively account for 15% of the borough’s total pedestrian KSI.
Protected Bike Lane
Designated on-street bicycle lanes that are protected from motorized traffic by parked vehicles, barriers, or bollards.
Raised Center Median
A raised area separating traffic lanes or directions of travel, particularly on wide roadways.
TLC Safety Honor Roll
A list created by TLC of taxi and for-hire vehicle drivers who have, over four years or more, not had a single crash involving injury, a single traffic violation, or a single violation of TLC safety-related rules; and TLC-licensed companies with the lowest shares of vehicles involved in serious collisions in their sector over the past year.
TEAs
Unarmed uniformed civilian members of the Police Department responsible for issuing parking summonses, directing traffic, towing vehicles, enforcing truck laws, and inspecting construction sites.
Trade Waste Industry
Private companies that use trucks to collect garbage and recyclables from commercial businesses, including construction and demolition sites. In New York City, these companies are licensed and regulated by the Business Integrity Commission (BIC).
TrafficStat
Weekly traffic meetings held by NYPD at police headquarters to review motor vehicle, bicyclist, and pedestrian crash data.
Truck Sideguards
Protective panels added to trucks that prevent pedestrians, cyclists, and smaller motor vehicles from rolling or falling underneath the side body of the truck.
Vision Zero View
An interactive map that helps Vision Zero agencies apply a data-driven approach to enforcement, focusing on improvement in the areas that are vulnerable to injuries and crashes. The map aggregates years of fatality and injury data, as well as displays a variety of other metrics, including injuries and fatalities, speed humps, LPIs, slow zones, town hall meetings, and schools with safety outreach.
Volpe
A think tank at the US Department of Transportation that DCAS has partnered with to study truck design, including the installation of truck sideguards.

VISION ZERO YEAR FOUR REPORT84
Vision Zero Helpful Links
Vision Zero Website
http://www.nyc.gov/html/visionzero/
Vision Zero View Map
http://www.nycvzv.info/
DOHMH Environment and Health Data Portal
http://www.nyc.gov/health/tracking
DOHMH Getting to School Report
https://www1.nyc.gov/assets/doh/downloads/pdf/dpho/getting-to-scool.pdf
TLC Safety Honor Roll Website
http://www.nyc.gov/html/tlc/html/industry/tlc_safety_honor_roll.shtml
TLC “Drive Like Your Family Lives Here” Film
https://www.youtube.com/watch?v=OAnSw3nzj0U
TLC Projects, Rules, Materials
http://www.nyc.gov/html/tlc/html/industry/vision_zero_tlc.shtml
TrafficStat
https://trafficstat.nypdonline.org/
NYPD Traffic Summonses Report
http://www.nyc.gov/html/nypd/html/traffic_reports/traffic_summons_reports.shtml
Vision Zero Borough Pedestrian Safety Action Plans
http://www.nyc.gov/html/dot/html/pedestrians/ped-safety-action-plan.shtml
VISION ZERO YEAR FOUR REPORT 85
Vision Zero Task Force
Task Force Members
Shawn Alsop, NYPDSalvador Arrona, BICAnna Caffarelli, DOHMHMarco A. Carrion, Mayor’s Office, Community Affairs UnitRichard Cerezo, MTAChief Thomas Chan, NYPDAnn Marie Doherty, DOTJeffrey Dupee, Mayor’s Office, Community Affairs UnitInspector Dennis Fulton, NYPDLawrence Fung, DOHMHBenjamin Furnas, Office of the MayorLauren Greenawalt, Mayor’s Office of OperationsHarry Goodheart, MTAAli Hamade, DOHMHJill Hoexter, New York County District Attorney’s OfficeGary Johnson, Mayor’s Office of OperationsKeith Kerman, DCASJulia Kite, DOTKara Kirchhoff, OMBMadeline Labadie, TLCRoger Li, NYPDPhebe Macrae, Law DepartmentJacqueline Matos, Mayor’s Office of OperationsStephen Malmberg, OMBJuan Martinez, DOTAlfredo Melian, NYPDDawn Miller, TLCAlexandra Ozols, Mayor's Office of OperationsFiona Peach, Mayor's Office of OperationsNorma Ponce, Mayor’s Office of OperationsEric Richardson, DCASNancy Savasta, Law DepartmentSherif Soliman, Office of the Mayor, State Legislative AffairsCatherine Stayton, DOHMHGeraldine Sweeney, Mayor’s Office of OperationsPierre Vieux, MTAKim Wiley-Schwartz, DOTSusan Wang, Mayor's Office of OperationsCaptain Erik Worobey, NYPDMiao Zhang, OMB
Data Working Group
Shawn Alsop, NYPDChristina Blackston, DOTAnna Caffarelli, DOHMHAnn Marie Doherty, DOTInspector Dennis Fulton, NYPDLawrence Fung, DOHMHSergeant Jamie Gifkins, NYPDLauren Greenawalt, Mayor’s Office of OperationsJulia Kite, DOTRoger Li, NYPDMadeline Labadie, TLCJacqueline Matos, Mayor’s Office of OperationsAlfredo Melian, NYPDJennifer Norton, DOHMHFiona Peach, Mayor’s Office of OperationAzikiwe Rich, DOTEric Richardson, DCASGeraldine Sweeney, Mayor’s Office of OperationsCatherine Stayton, DOHMHRob Viola, DOTSusan Wang, Mayor’s Office of OperationsCaptain Erik Worobey, NYPD
Marketing Working Group
Shawn Alsop, NYPDAnna Caffarelli, DOHMHAnn Marie Doherty, DOTSergeant Jamie Gifkins, NYPDMichelle Kaucic, DOTMadeline Labadie, TLCCaryn Resnick, DFTA
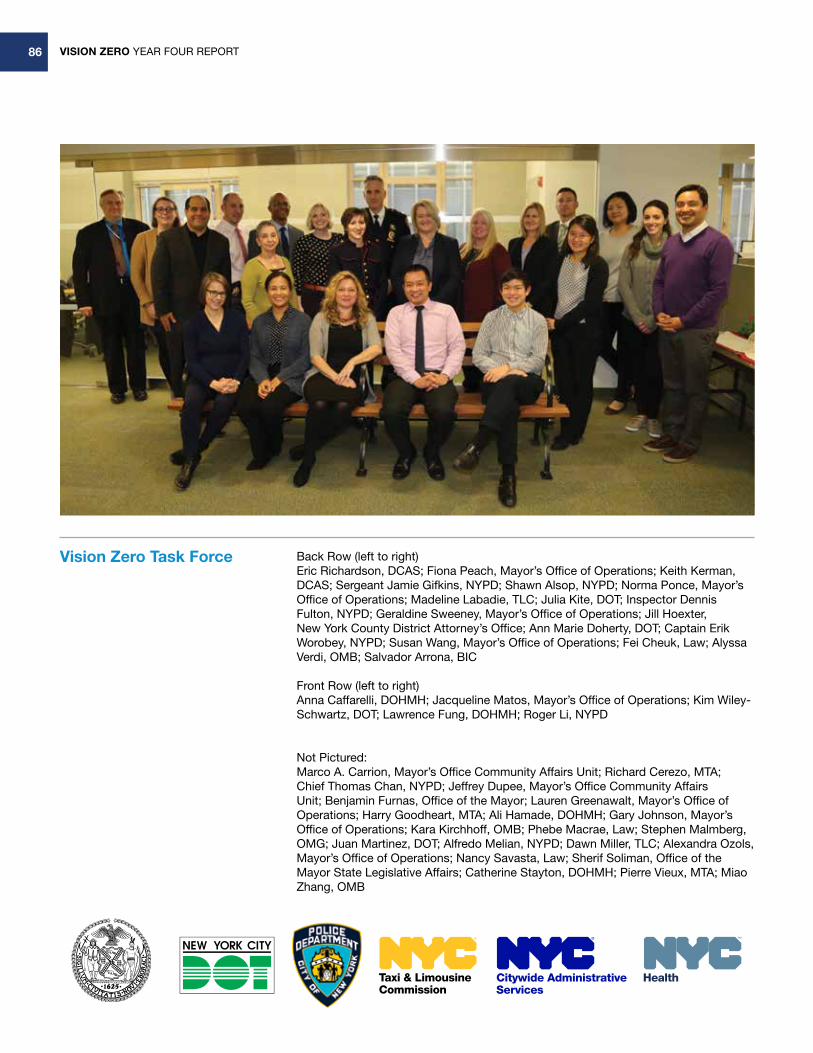
VISION ZERO YEAR FOUR REPORT86
Back Row (left to right)Eric Richardson, DCAS; Fiona Peach, Mayor’s Office of Operations; Keith Kerman, DCAS; Sergeant Jamie Gifkins, NYPD; Shawn Alsop, NYPD; Norma Ponce, Mayor’s Office of Operations; Madeline Labadie, TLC; Julia Kite, DOT; Inspector Dennis Fulton, NYPD; Geraldine Sweeney, Mayor’s Office of Operations; Jill Hoexter, New York County District Attorney’s Office; Ann Marie Doherty, DOT; Captain Erik Worobey, NYPD; Susan Wang, Mayor’s Office of Operations; Fei Cheuk, Law; Alyssa Verdi, OMB; Salvador Arrona, BIC
Front Row (left to right)Anna Caffarelli, DOHMH; Jacqueline Matos, Mayor’s Office of Operations; Kim Wiley-Schwartz, DOT; Lawrence Fung, DOHMH; Roger Li, NYPD
Not Pictured: Marco A. Carrion, Mayor’s Office Community Affairs Unit; Richard Cerezo, MTA; Chief Thomas Chan, NYPD; Jeffrey Dupee, Mayor’s Office Community Affairs Unit; Benjamin Furnas, Office of the Mayor; Lauren Greenawalt, Mayor’s Office of Operations; Harry Goodheart, MTA; Ali Hamade, DOHMH; Gary Johnson, Mayor’s Office of Operations; Kara Kirchhoff, OMB; Phebe Macrae, Law; Stephen Malmberg, OMG; Juan Martinez, DOT; Alfredo Melian, NYPD; Dawn Miller, TLC; Alexandra Ozols, Mayor’s Office of Operations; Nancy Savasta, Law; Sherif Soliman, Office of the Mayor State Legislative Affairs; Catherine Stayton, DOHMH; Pierre Vieux, MTA; Miao Zhang, OMB
Vision Zero Task Force
VISION ZERO YEAR FOUR REPORT 87
Report developed by the New York City Mayor’s Office of Operations
Report layout: NYC DOT
Photos:
Cover: NYC DOT
Page 2: NYC DOT
Page 5: NYC DOT
Page 10: NYC DOT
Page 16: NYC DOT
Page 17: NYC DDC
Page 70: NYC DDC

VISION ZERO YEAR FOUR REPORT88
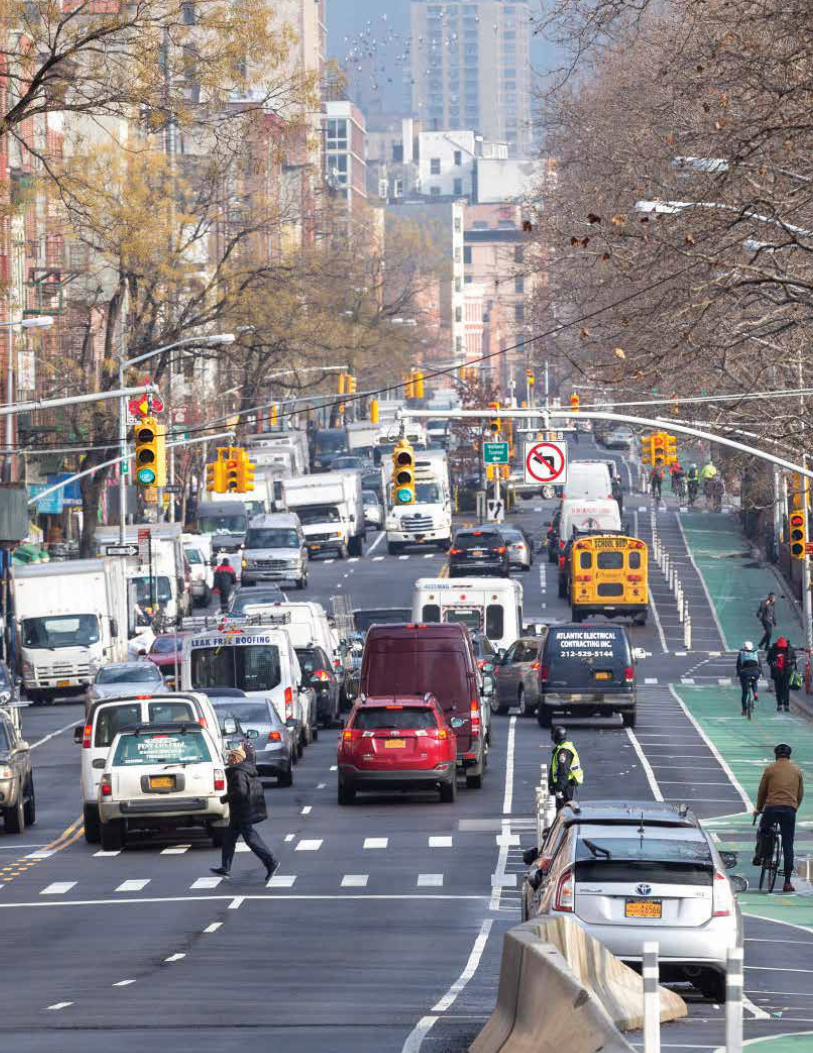
VISION ZERO YEAR FOUR REPORT 89
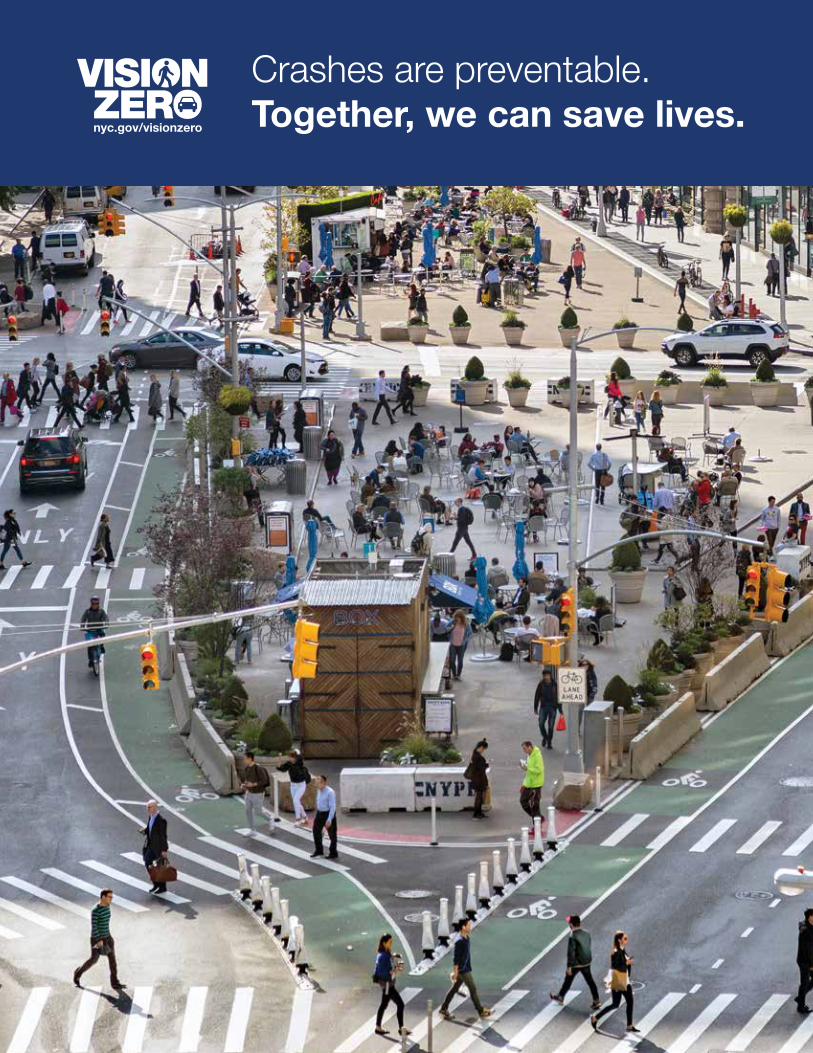
VISION ZERO YEAR FOUR REPORT90
Crashes are preventable. Together, we can save lives.