Embed Size (px)
Citation preview
Vision Project Report, Technical Appendix www.mass.edu/vpreport Page 1
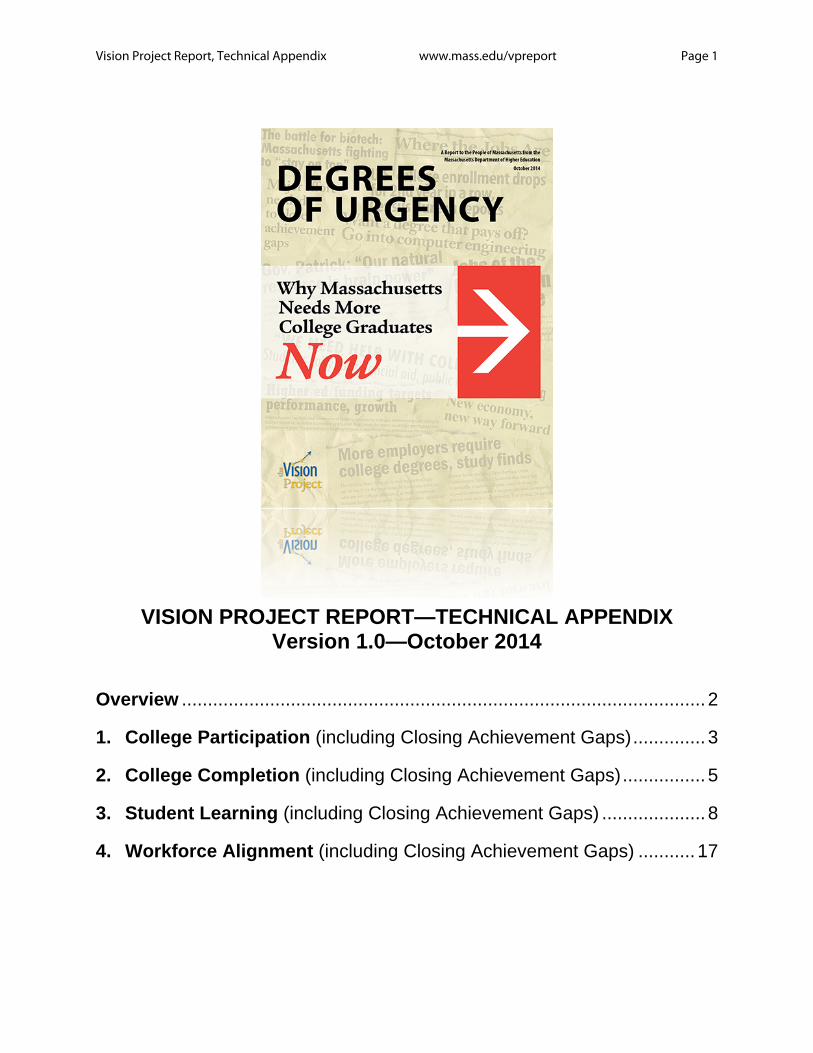
VISION PROJECT REPORT—TECHNICAL APPENDIX
Version 1.0—October 2014
Overview ..................................................................................................... 2
1. College Participation (including Closing Achievement Gaps) .............. 3
2. College Completion (including Closing Achievement Gaps) ................ 5
3. Student Learning (including Closing Achievement Gaps) .................... 8
4. Workforce Alignment (including Closing Achievement Gaps) ........... 17
Vision Project Report, Technical Appendix www.mass.edu/vpreport Page 2
Overview • Board Approval: The initial metrics to be used in the Vision Project were approved by the Board
of Higher Education in May 2010. An extensive period of refinement and review followed, including numerous public presentations of emerging data and methodology, with the Board approving three revisions to the metrics in March 2012.
• Advice from national experts: This review period included consultation with national experts including Cheryl Blanco, Vice President for Special Projects at the Southern Regional Education Board and former senior program director at the Western Interstate Commission for Higher Education; Patrick Callan, President of the National Center for Public Policy and Higher Education; Peter Ewell, Vice President of the National Center for Education Management Systems(NCHEMS); NCHEMS President Dennis Jones; Complete College America President Stan Jones; Bill Mass, Director of the Center for Industrial Competitiveness at UMass Lowell; Navjeet Singh, Vice President of Applied Research and Evaluation, Commonwealth Corporation; Andrew Sum, Director of the Center for Labor Market Studies at Northeastern University; Dawn Terkla, Associate Provost for Institutional Research and Evaluation at Tufts University.
• National comparisons are made with public institutions of similar Carnegie class, where possible. In some cases, fewer than 50 states are included in the comparison due to lack of comparability or data availability.
• Timeliness of Data: Data used are the most recent available. Postsecondary education data typically becomes publicly available a year or more after the point of initial collection.
Vision Project Report, Technical Appendix www.mass.edu/vpreport Page 3
1. College Participation College Readiness Rates
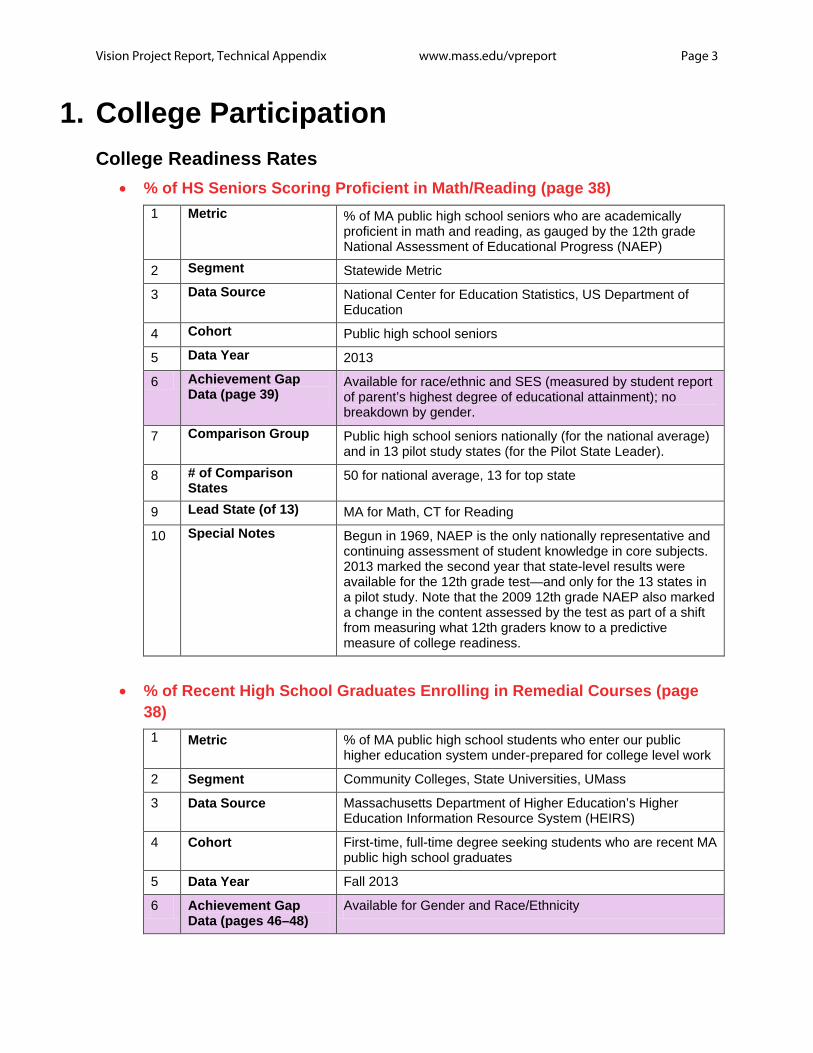
• % of HS Seniors Scoring Proficient in Math/Reading (page 38) 1 Metric % of MA public high school seniors who are academically
proficient in math and reading, as gauged by the 12th grade National Assessment of Educational Progress (NAEP)
2 Segment Statewide Metric
3 Data Source National Center for Education Statistics, US Department of Education
4 Cohort Public high school seniors
5 Data Year 2013
6 Achievement Gap Data (page 39)
Available for race/ethnic and SES (measured by student report of parent’s highest degree of educational attainment); no breakdown by gender.
7 Comparison Group Public high school seniors nationally (for the national average) and in 13 pilot study states (for the Pilot State Leader).
8 # of Comparison States
50 for national average, 13 for top state
9 Lead State (of 13) MA for Math, CT for Reading
10 Special Notes Begun in 1969, NAEP is the only nationally representative and continuing assessment of student knowledge in core subjects. 2013 marked the second year that state-level results were available for the 12th grade test—and only for the 13 states in a pilot study. Note that the 2009 12th grade NAEP also marked a change in the content assessed by the test as part of a shift from measuring what 12th graders know to a predictive measure of college readiness.
• % of Recent High School Graduates Enrolling in Remedial Courses (page
38) 1 Metric % of MA public high school students who enter our public
higher education system under-prepared for college level work
2 Segment Community Colleges, State Universities, UMass
3 Data Source Massachusetts Department of Higher Education’s Higher Education Information Resource System (HEIRS)
4 Cohort First-time, full-time degree seeking students who are recent MA public high school graduates
5 Data Year Fall 2013
6 Achievement Gap Data (pages 46–48)
Available for Gender and Race/Ethnicity
Vision Project Report, Technical Appendix www.mass.edu/vpreport Page 4
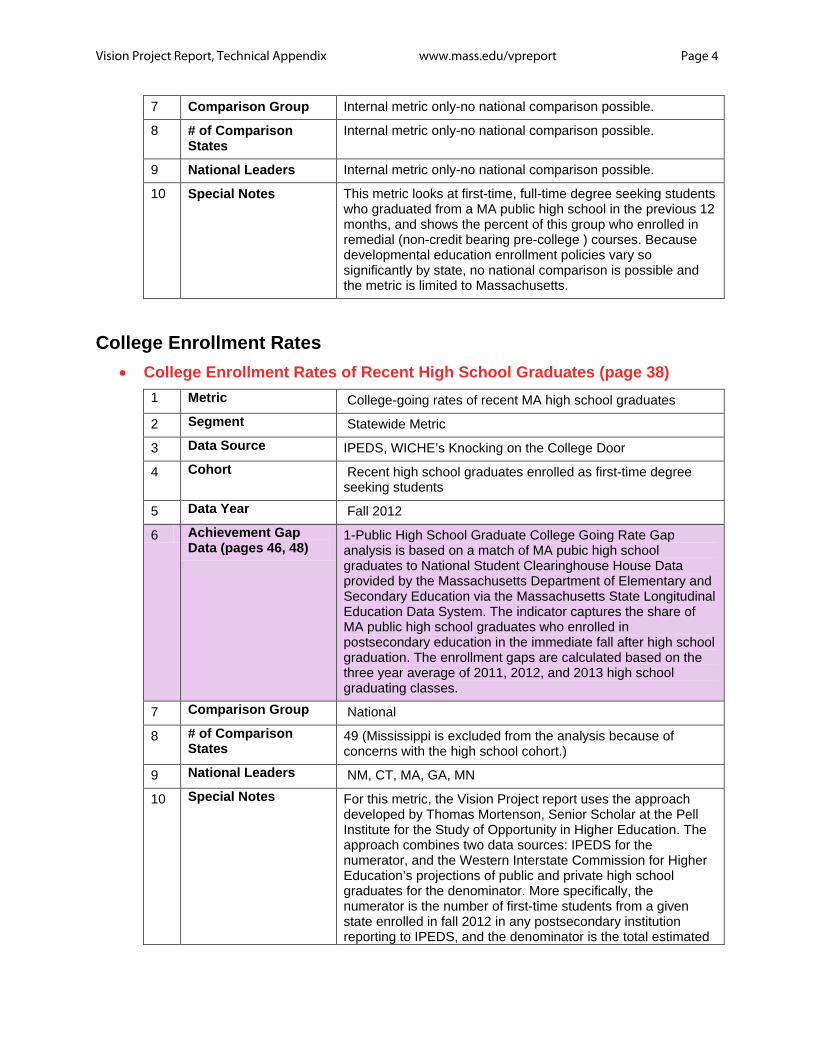
7 Comparison Group Internal metric only-no national comparison possible.
8 # of Comparison States
Internal metric only-no national comparison possible.
9 National Leaders Internal metric only-no national comparison possible.
10 Special Notes This metric looks at first-time, full-time degree seeking students who graduated from a MA public high school in the previous 12 months, and shows the percent of this group who enrolled in remedial (non-credit bearing pre-college ) courses. Because developmental education enrollment policies vary so significantly by state, no national comparison is possible and the metric is limited to Massachusetts.
College Enrollment Rates
• College Enrollment Rates of Recent High School Graduates (page 38) 1 Metric College-going rates of recent MA high school graduates
2 Segment Statewide Metric
3 Data Source IPEDS, WICHE’s Knocking on the College Door
4 Cohort Recent high school graduates enrolled as first-time degree seeking students
5 Data Year Fall 2012
6 Achievement Gap Data (pages 46, 48)
1-Public High School Graduate College Going Rate Gap analysis is based on a match of MA pubic high school graduates to National Student Clearinghouse House Data provided by the Massachusetts Department of Elementary and Secondary Education via the Massachusetts State Longitudinal Education Data System. The indicator captures the share of MA public high school graduates who enrolled in postsecondary education in the immediate fall after high school graduation. The enrollment gaps are calculated based on the three year average of 2011, 2012, and 2013 high school graduating classes.
7 Comparison Group National
8 # of Comparison States
49 (Mississippi is excluded from the analysis because of concerns with the high school cohort.)
9 National Leaders NM, CT, MA, GA, MN
10 Special Notes For this metric, the Vision Project report uses the approach developed by Thomas Mortenson, Senior Scholar at the Pell Institute for the Study of Opportunity in Higher Education. The approach combines two data sources: IPEDS for the numerator, and the Western Interstate Commission for Higher Education’s projections of public and private high school graduates for the denominator. More specifically, the numerator is the number of first-time students from a given state enrolled in fall 2012 in any postsecondary institution reporting to IPEDS, and the denominator is the total estimated
Vision Project Report, Technical Appendix www.mass.edu/vpreport Page 5
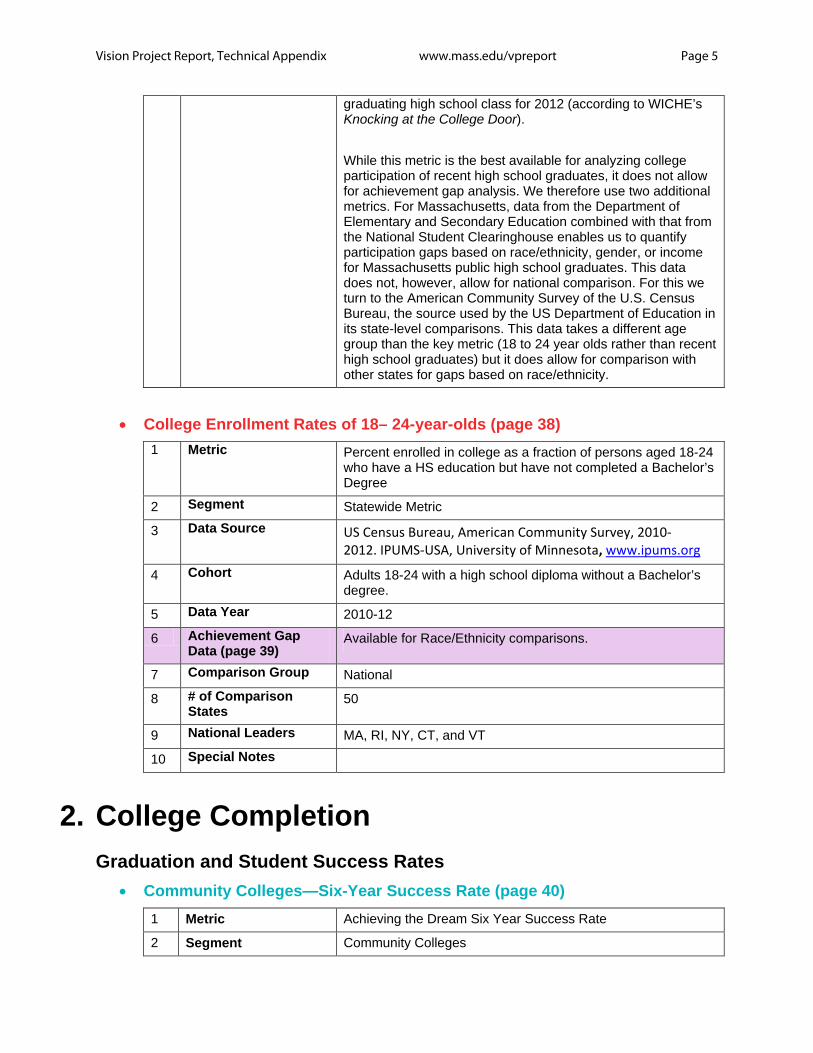
graduating high school class for 2012 (according to WICHE’s Knocking at the College Door). While this metric is the best available for analyzing college participation of recent high school graduates, it does not allow for achievement gap analysis. We therefore use two additional metrics. For Massachusetts, data from the Department of Elementary and Secondary Education combined with that from the National Student Clearinghouse enables us to quantify participation gaps based on race/ethnicity, gender, or income for Massachusetts public high school graduates. This data does not, however, allow for national comparison. For this we turn to the American Community Survey of the U.S. Census Bureau, the source used by the US Department of Education in its state-level comparisons. This data takes a different age group than the key metric (18 to 24 year olds rather than recent high school graduates) but it does allow for comparison with other states for gaps based on race/ethnicity.
• College Enrollment Rates of 18– 24-year-olds (page 38) 1 Metric Percent enrolled in college as a fraction of persons aged 18-24
who have a HS education but have not completed a Bachelor’s Degree
2 Segment Statewide Metric
3 Data Source US Census Bureau, American Community Survey, 2010-2012. IPUMS-USA, University of Minnesota, www.ipums.org
4 Cohort Adults 18-24 with a high school diploma without a Bachelor’s degree.
5 Data Year 2010-12
6 Achievement Gap Data (page 39)
Available for Race/Ethnicity comparisons.
7 Comparison Group National
8 # of Comparison States
50
9 National Leaders MA, RI, NY, CT, and VT
10 Special Notes
2. College Completion Graduation and Student Success Rates
• Community Colleges—Six-Year Success Rate (page 40) 1 Metric Achieving the Dream Six Year Success Rate
2 Segment Community Colleges
Vision Project Report, Technical Appendix www.mass.edu/vpreport Page 6
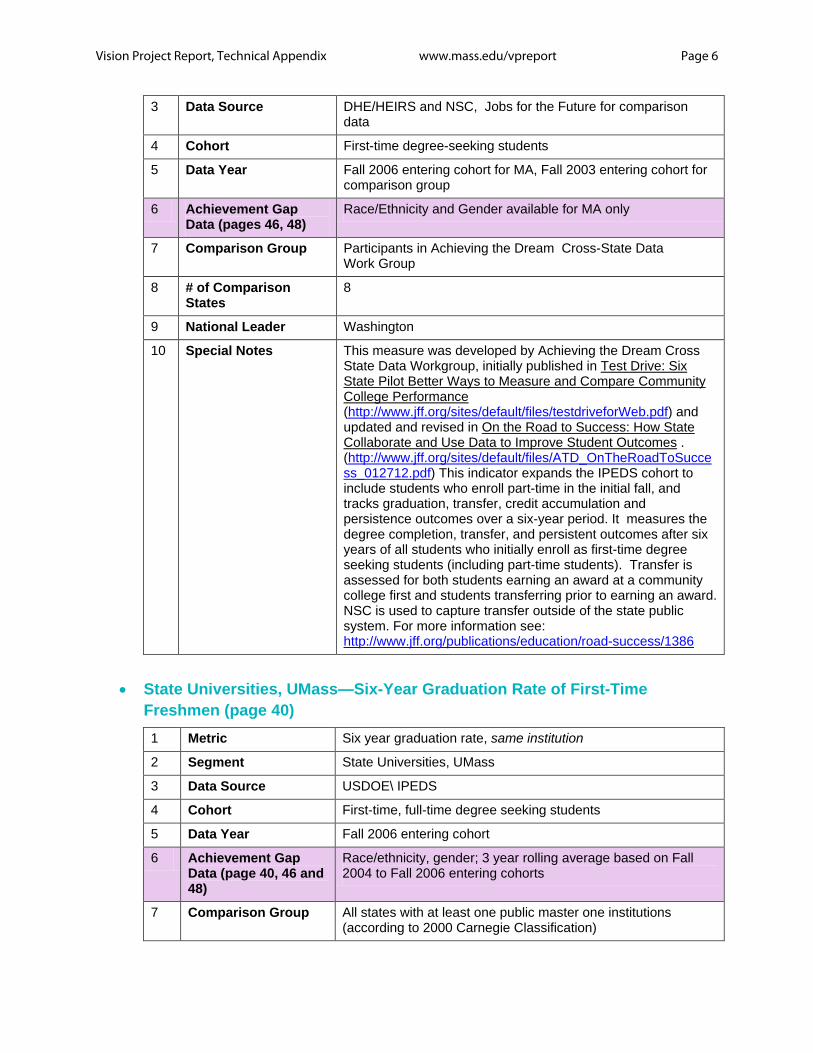
3 Data Source DHE/HEIRS and NSC, Jobs for the Future for comparison data
4 Cohort First-time degree-seeking students
5 Data Year Fall 2006 entering cohort for MA, Fall 2003 entering cohort for comparison group
6 Achievement Gap Data (pages 46, 48)
Race/Ethnicity and Gender available for MA only
7 Comparison Group Participants in Achieving the Dream Cross-State Data Work Group
8 # of Comparison States
8
9 National Leader Washington
10 Special Notes This measure was developed by Achieving the Dream Cross State Data Workgroup, initially published in Test Drive: Six State Pilot Better Ways to Measure and Compare Community College Performance (http://www.jff.org/sites/default/files/testdriveforWeb.pdf) and updated and revised in On the Road to Success: How State Collaborate and Use Data to Improve Student Outcomes . (http://www.jff.org/sites/default/files/ATD_OnTheRoadToSuccess_012712.pdf) This indicator expands the IPEDS cohort to include students who enroll part-time in the initial fall, and tracks graduation, transfer, credit accumulation and persistence outcomes over a six-year period. It measures the degree completion, transfer, and persistent outcomes after six years of all students who initially enroll as first-time degree seeking students (including part-time students). Transfer is assessed for both students earning an award at a community college first and students transferring prior to earning an award. NSC is used to capture transfer outside of the state public system. For more information see: http://www.jff.org/publications/education/road-success/1386
• State Universities, UMass—Six-Year Graduation Rate of First-Time
Freshmen (page 40) 1 Metric Six year graduation rate, same institution
2 Segment State Universities, UMass
3 Data Source USDOE\ IPEDS
4 Cohort First-time, full-time degree seeking students
5 Data Year Fall 2006 entering cohort
6 Achievement Gap Data (page 40, 46 and 48)
Race/ethnicity, gender; 3 year rolling average based on Fall 2004 to Fall 2006 entering cohorts
7 Comparison Group All states with at least one public master one institutions (according to 2000 Carnegie Classification)
Vision Project Report, Technical Appendix www.mass.edu/vpreport Page 7
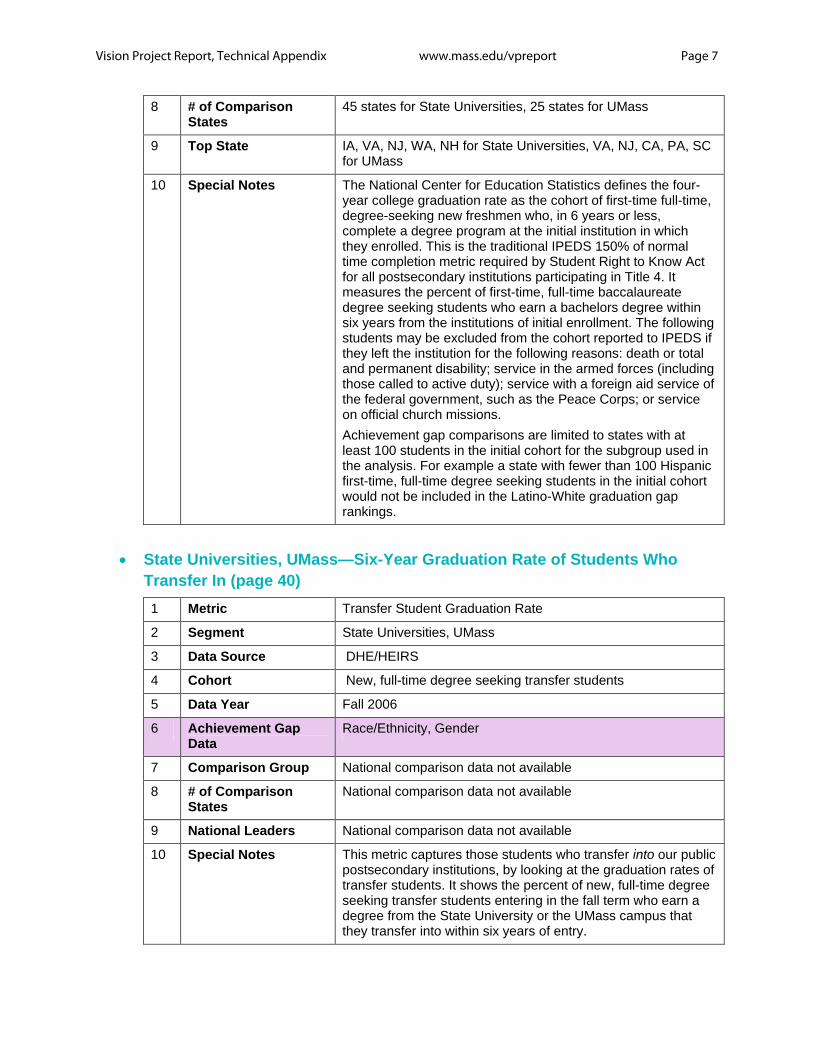
8 # of Comparison States
45 states for State Universities, 25 states for UMass
9 Top State IA, VA, NJ, WA, NH for State Universities, VA, NJ, CA, PA, SC for UMass
10 Special Notes The National Center for Education Statistics defines the four-year college graduation rate as the cohort of first-time full-time, degree-seeking new freshmen who, in 6 years or less, complete a degree program at the initial institution in which they enrolled. This is the traditional IPEDS 150% of normal time completion metric required by Student Right to Know Act for all postsecondary institutions participating in Title 4. It measures the percent of first-time, full-time baccalaureate degree seeking students who earn a bachelors degree within six years from the institutions of initial enrollment. The following students may be excluded from the cohort reported to IPEDS if they left the institution for the following reasons: death or total and permanent disability; service in the armed forces (including those called to active duty); service with a foreign aid service of the federal government, such as the Peace Corps; or service on official church missions. Achievement gap comparisons are limited to states with at least 100 students in the initial cohort for the subgroup used in the analysis. For example a state with fewer than 100 Hispanic first-time, full-time degree seeking students in the initial cohort would not be included in the Latino-White graduation gap rankings.
• State Universities, UMass—Six-Year Graduation Rate of Students Who
Transfer In (page 40) 1 Metric Transfer Student Graduation Rate
2 Segment State Universities, UMass
3 Data Source DHE/HEIRS
4 Cohort New, full-time degree seeking transfer students
5 Data Year Fall 2006
6 Achievement Gap Data
Race/Ethnicity, Gender
7 Comparison Group National comparison data not available
8 # of Comparison States
National comparison data not available
9 National Leaders National comparison data not available
10 Special Notes This metric captures those students who transfer into our public postsecondary institutions, by looking at the graduation rates of transfer students. It shows the percent of new, full-time degree seeking transfer students entering in the fall term who earn a degree from the State University or the UMass campus that they transfer into within six years of entry.
Vision Project Report, Technical Appendix www.mass.edu/vpreport Page 8
• Community Colleges—Three-Year Graduation Rate (page 40—Gaps section
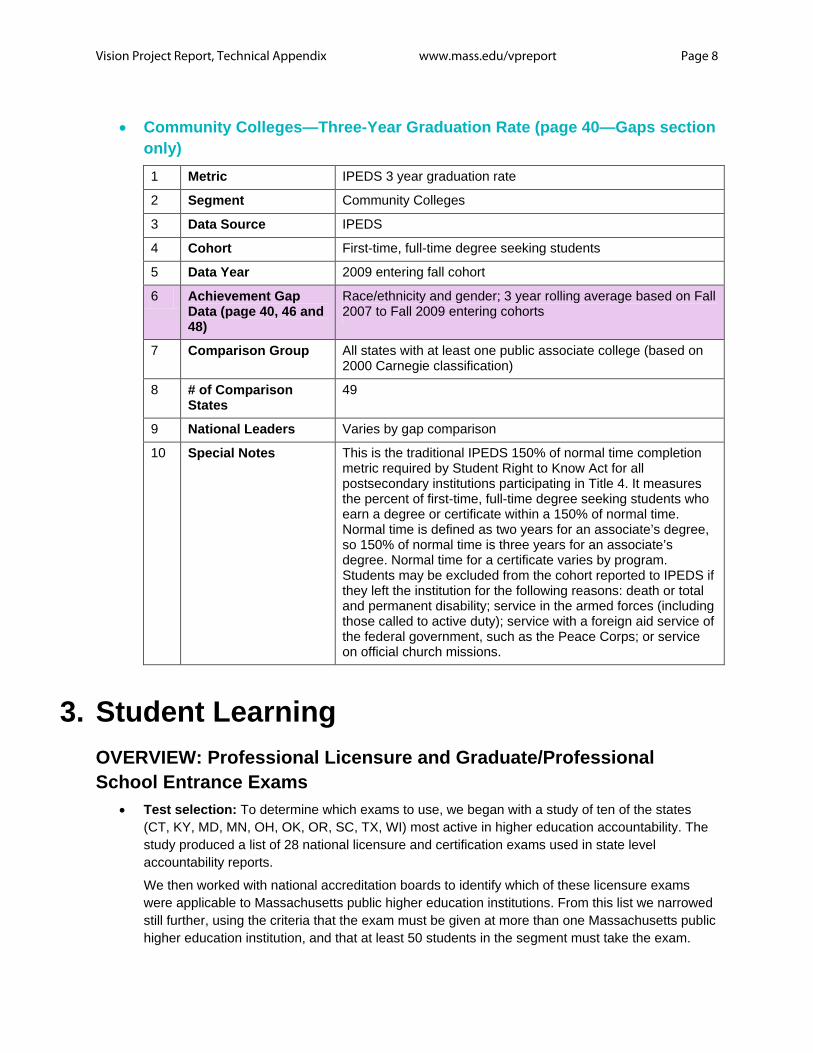
only) 1 Metric IPEDS 3 year graduation rate
2 Segment Community Colleges
3 Data Source IPEDS
4 Cohort First-time, full-time degree seeking students
5 Data Year 2009 entering fall cohort
6 Achievement Gap Data (page 40, 46 and 48)
Race/ethnicity and gender; 3 year rolling average based on Fall 2007 to Fall 2009 entering cohorts
7 Comparison Group All states with at least one public associate college (based on 2000 Carnegie classification)
8 # of Comparison States
49
9 National Leaders Varies by gap comparison
10 Special Notes This is the traditional IPEDS 150% of normal time completion metric required by Student Right to Know Act for all postsecondary institutions participating in Title 4. It measures the percent of first-time, full-time degree seeking students who earn a degree or certificate within a 150% of normal time. Normal time is defined as two years for an associate’s degree, so 150% of normal time is three years for an associate’s degree. Normal time for a certificate varies by program. Students may be excluded from the cohort reported to IPEDS if they left the institution for the following reasons: death or total and permanent disability; service in the armed forces (including those called to active duty); service with a foreign aid service of the federal government, such as the Peace Corps; or service on official church missions.
3. Student Learning OVERVIEW: Professional Licensure and Graduate/Professional School Entrance Exams
• Test selection: To determine which exams to use, we began with a study of ten of the states (CT, KY, MD, MN, OH, OK, OR, SC, TX, WI) most active in higher education accountability. The study produced a list of 28 national licensure and certification exams used in state level accountability reports.
We then worked with national accreditation boards to identify which of these licensure exams were applicable to Massachusetts public higher education institutions. From this list we narrowed still further, using the criteria that the exam must be given at more than one Massachusetts public higher education institution, and that at least 50 students in the segment must take the exam.
Vision Project Report, Technical Appendix www.mass.edu/vpreport Page 9
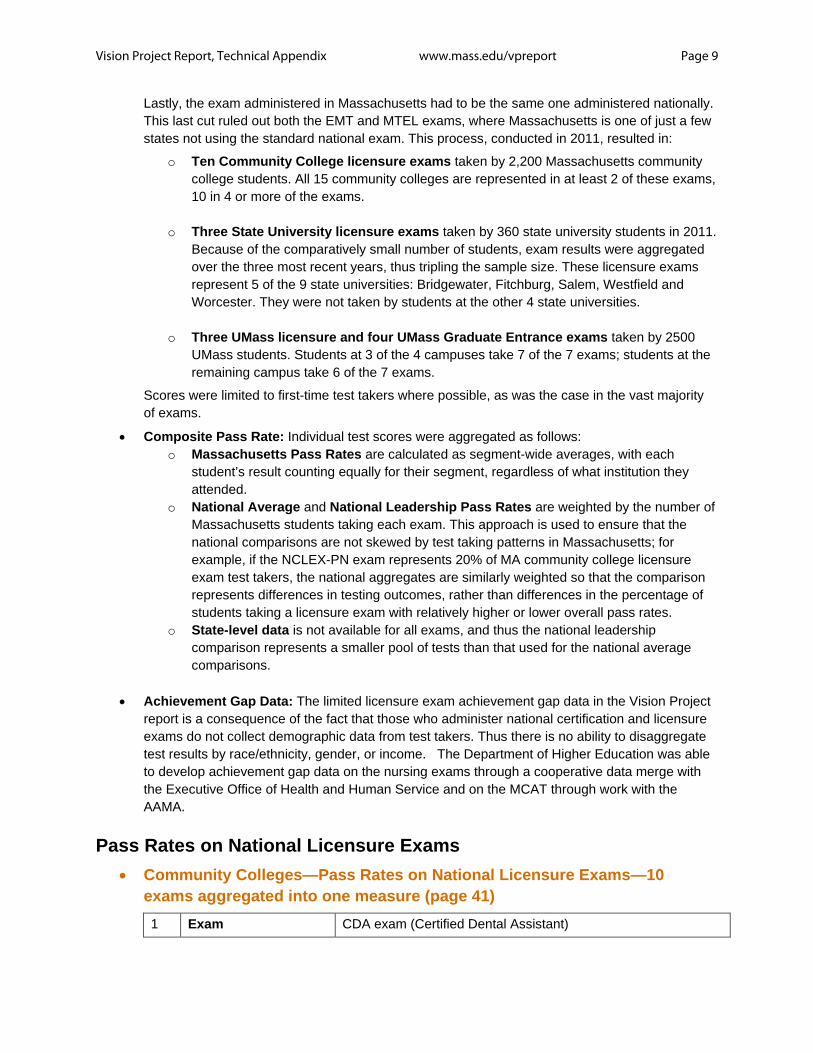
Lastly, the exam administered in Massachusetts had to be the same one administered nationally. This last cut ruled out both the EMT and MTEL exams, where Massachusetts is one of just a few states not using the standard national exam. This process, conducted in 2011, resulted in:
o Ten Community College licensure exams taken by 2,200 Massachusetts community college students. All 15 community colleges are represented in at least 2 of these exams, 10 in 4 or more of the exams.
o Three State University licensure exams taken by 360 state university students in 2011. Because of the comparatively small number of students, exam results were aggregated over the three most recent years, thus tripling the sample size. These licensure exams represent 5 of the 9 state universities: Bridgewater, Fitchburg, Salem, Westfield and Worcester. They were not taken by students at the other 4 state universities.
o Three UMass licensure and four UMass Graduate Entrance exams taken by 2500 UMass students. Students at 3 of the 4 campuses take 7 of the 7 exams; students at the remaining campus take 6 of the 7 exams.
Scores were limited to first-time test takers where possible, as was the case in the vast majority of exams.
• Composite Pass Rate: Individual test scores were aggregated as follows: o Massachusetts Pass Rates are calculated as segment-wide averages, with each
student’s result counting equally for their segment, regardless of what institution they attended.
o National Average and National Leadership Pass Rates are weighted by the number of Massachusetts students taking each exam. This approach is used to ensure that the national comparisons are not skewed by test taking patterns in Massachusetts; for example, if the NCLEX-PN exam represents 20% of MA community college licensure exam test takers, the national aggregates are similarly weighted so that the comparison represents differences in testing outcomes, rather than differences in the percentage of students taking a licensure exam with relatively higher or lower overall pass rates.
o State-level data is not available for all exams, and thus the national leadership comparison represents a smaller pool of tests than that used for the national average comparisons.
• Achievement Gap Data: The limited licensure exam achievement gap data in the Vision Project
report is a consequence of the fact that those who administer national certification and licensure exams do not collect demographic data from test takers. Thus there is no ability to disaggregate test results by race/ethnicity, gender, or income. The Department of Higher Education was able to develop achievement gap data on the nursing exams through a cooperative data merge with the Executive Office of Health and Human Service and on the MCAT through work with the AAMA.
Pass Rates on National Licensure Exams
• Community Colleges—Pass Rates on National Licensure Exams—10 exams aggregated into one measure (page 41) 1 Exam CDA exam (Certified Dental Assistant)
Vision Project Report, Technical Appendix www.mass.edu/vpreport Page 10
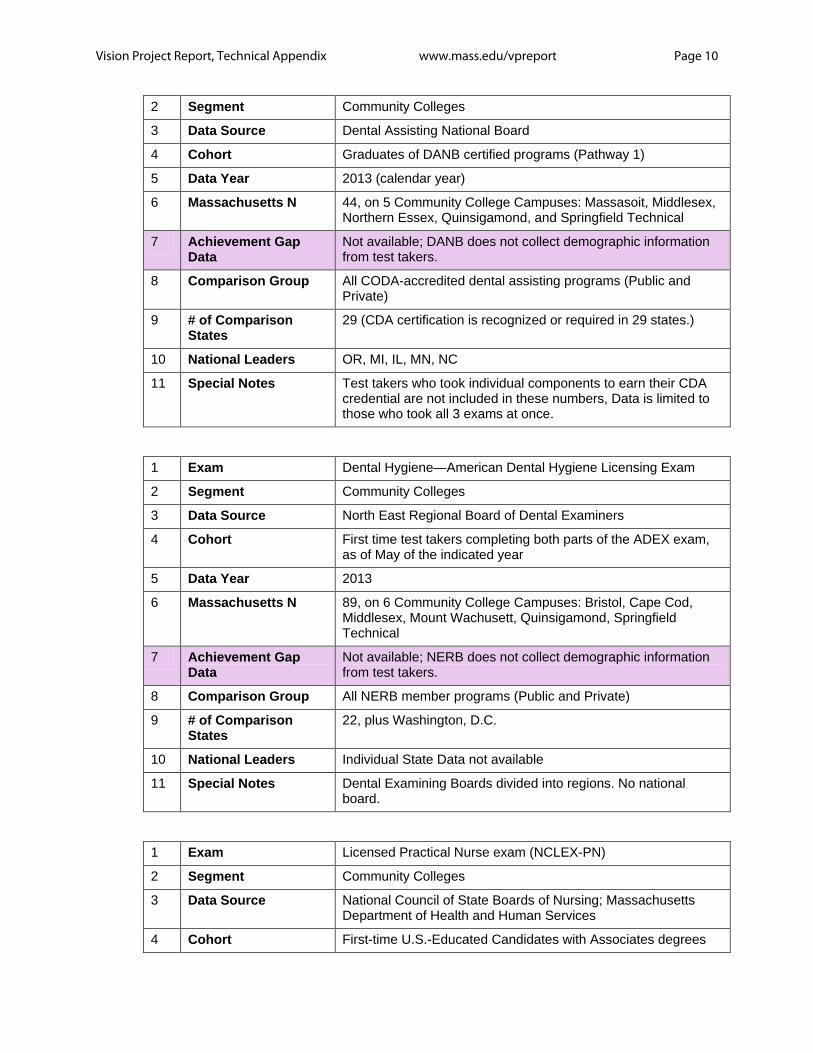
2 Segment Community Colleges
3 Data Source Dental Assisting National Board
4 Cohort Graduates of DANB certified programs (Pathway 1)
5 Data Year 2013 (calendar year)
6 Massachusetts N 44, on 5 Community College Campuses: Massasoit, Middlesex, Northern Essex, Quinsigamond, and Springfield Technical
7 Achievement Gap Data
Not available; DANB does not collect demographic information from test takers.
8 Comparison Group All CODA-accredited dental assisting programs (Public and Private)
9 # of Comparison States
29 (CDA certification is recognized or required in 29 states.)
10 National Leaders OR, MI, IL, MN, NC
11 Special Notes Test takers who took individual components to earn their CDA credential are not included in these numbers, Data is limited to those who took all 3 exams at once.
1 Exam Dental Hygiene—American Dental Hygiene Licensing Exam
2 Segment Community Colleges
3 Data Source North East Regional Board of Dental Examiners
4 Cohort First time test takers completing both parts of the ADEX exam, as of May of the indicated year
5 Data Year 2013
6 Massachusetts N 89, on 6 Community College Campuses: Bristol, Cape Cod, Middlesex, Mount Wachusett, Quinsigamond, Springfield Technical
7 Achievement Gap Data
Not available; NERB does not collect demographic information from test takers.
8 Comparison Group All NERB member programs (Public and Private)
9 # of Comparison States
22, plus Washington, D.C.
10 National Leaders Individual State Data not available
11 Special Notes Dental Examining Boards divided into regions. No national board.
1 Exam Licensed Practical Nurse exam (NCLEX-PN)
2 Segment Community Colleges
3 Data Source National Council of State Boards of Nursing; Massachusetts Department of Health and Human Services
4 Cohort First-time U.S.-Educated Candidates with Associates degrees
Vision Project Report, Technical Appendix www.mass.edu/vpreport Page 11
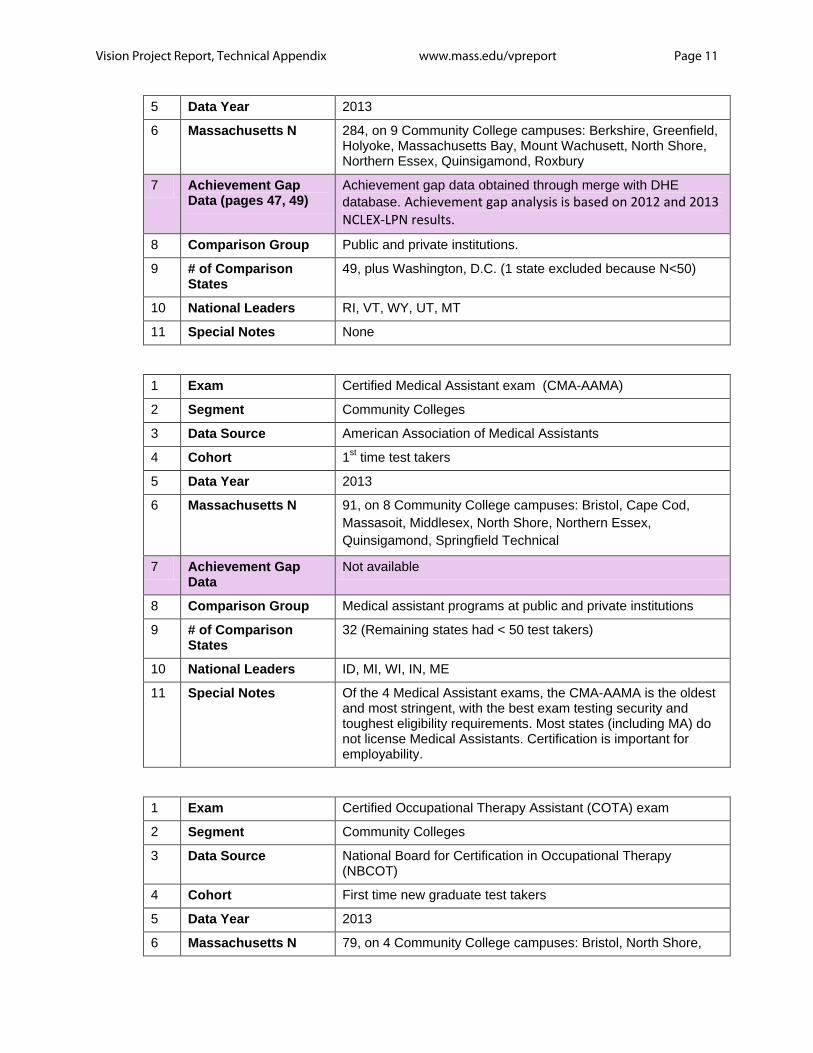
5 Data Year 2013
6 Massachusetts N 284, on 9 Community College campuses: Berkshire, Greenfield, Holyoke, Massachusetts Bay, Mount Wachusett, North Shore, Northern Essex, Quinsigamond, Roxbury
7 Achievement Gap Data (pages 47, 49)
Achievement gap data obtained through merge with DHE database. Achievement gap analysis is based on 2012 and 2013 NCLEX-LPN results.
8 Comparison Group Public and private institutions.
9 # of Comparison States
49, plus Washington, D.C. (1 state excluded because N<50)
10 National Leaders RI, VT, WY, UT, MT
11 Special Notes None
1 Exam Certified Medical Assistant exam (CMA-AAMA)
2 Segment Community Colleges
3 Data Source American Association of Medical Assistants
4 Cohort 1st time test takers
5 Data Year 2013
6 Massachusetts N 91, on 8 Community College campuses: Bristol, Cape Cod, Massasoit, Middlesex, North Shore, Northern Essex, Quinsigamond, Springfield Technical
7 Achievement Gap Data
Not available
8 Comparison Group Medical assistant programs at public and private institutions
9 # of Comparison States
32 (Remaining states had < 50 test takers)
10 National Leaders ID, MI, WI, IN, ME
11 Special Notes Of the 4 Medical Assistant exams, the CMA-AAMA is the oldest and most stringent, with the best exam testing security and toughest eligibility requirements. Most states (including MA) do not license Medical Assistants. Certification is important for employability.
1 Exam Certified Occupational Therapy Assistant (COTA) exam
2 Segment Community Colleges
3 Data Source National Board for Certification in Occupational Therapy (NBCOT)
4 Cohort First time new graduate test takers
5 Data Year 2013
6 Massachusetts N 79, on 4 Community College campuses: Bristol, North Shore,
Vision Project Report, Technical Appendix www.mass.edu/vpreport Page 12
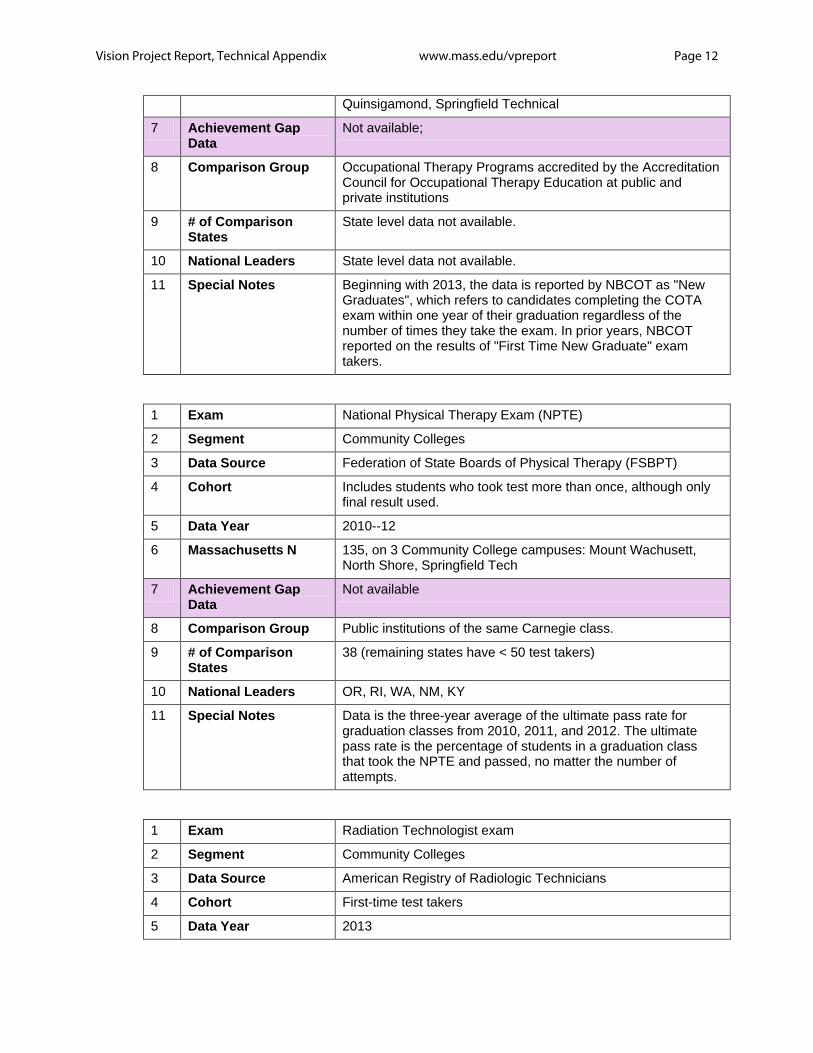
Quinsigamond, Springfield Technical
7 Achievement Gap Data
Not available;
8 Comparison Group Occupational Therapy Programs accredited by the Accreditation Council for Occupational Therapy Education at public and private institutions
9 # of Comparison States
State level data not available.
10 National Leaders State level data not available.
11 Special Notes Beginning with 2013, the data is reported by NBCOT as "New Graduates", which refers to candidates completing the COTA exam within one year of their graduation regardless of the number of times they take the exam. In prior years, NBCOT reported on the results of "First Time New Graduate" exam takers.
1 Exam National Physical Therapy Exam (NPTE)
2 Segment Community Colleges
3 Data Source Federation of State Boards of Physical Therapy (FSBPT)
4 Cohort Includes students who took test more than once, although only final result used.
5 Data Year 2010--12
6 Massachusetts N 135, on 3 Community College campuses: Mount Wachusett, North Shore, Springfield Tech
7 Achievement Gap Data
Not available
8 Comparison Group Public institutions of the same Carnegie class.
9 # of Comparison States
38 (remaining states have < 50 test takers)
10 National Leaders OR, RI, WA, NM, KY
11 Special Notes Data is the three-year average of the ultimate pass rate for graduation classes from 2010, 2011, and 2012. The ultimate pass rate is the percentage of students in a graduation class that took the NPTE and passed, no matter the number of attempts.
1 Exam Radiation Technologist exam
2 Segment Community Colleges
3 Data Source American Registry of Radiologic Technicians
4 Cohort First-time test takers
5 Data Year 2013
Vision Project Report, Technical Appendix www.mass.edu/vpreport Page 13
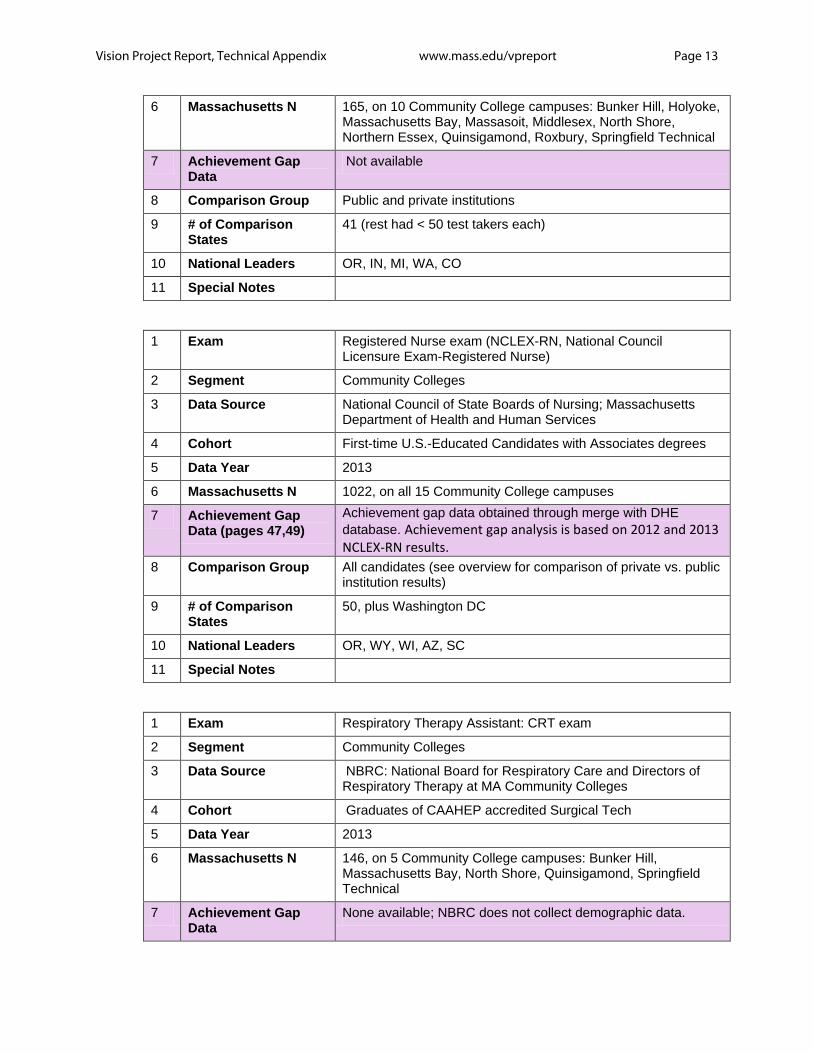
6 Massachusetts N 165, on 10 Community College campuses: Bunker Hill, Holyoke, Massachusetts Bay, Massasoit, Middlesex, North Shore, Northern Essex, Quinsigamond, Roxbury, Springfield Technical
7 Achievement Gap Data
Not available
8 Comparison Group Public and private institutions
9 # of Comparison States
41 (rest had < 50 test takers each)
10 National Leaders OR, IN, MI, WA, CO
11 Special Notes
1 Exam Registered Nurse exam (NCLEX-RN, National Council
Licensure Exam-Registered Nurse)
2 Segment Community Colleges
3 Data Source National Council of State Boards of Nursing; Massachusetts Department of Health and Human Services
4 Cohort First-time U.S.-Educated Candidates with Associates degrees
5 Data Year 2013
6 Massachusetts N 1022, on all 15 Community College campuses
7 Achievement Gap Data (pages 47,49)
Achievement gap data obtained through merge with DHE database. Achievement gap analysis is based on 2012 and 2013 NCLEX-RN results.
8 Comparison Group All candidates (see overview for comparison of private vs. public institution results)
9 # of Comparison States
50, plus Washington DC
10 National Leaders OR, WY, WI, AZ, SC
11 Special Notes
1 Exam Respiratory Therapy Assistant: CRT exam
2 Segment Community Colleges
3 Data Source NBRC: National Board for Respiratory Care and Directors of Respiratory Therapy at MA Community Colleges
4 Cohort Graduates of CAAHEP accredited Surgical Tech
5 Data Year 2013
6 Massachusetts N 146, on 5 Community College campuses: Bunker Hill, Massachusetts Bay, North Shore, Quinsigamond, Springfield Technical
7 Achievement Gap Data
None available; NBRC does not collect demographic data.
Vision Project Report, Technical Appendix www.mass.edu/vpreport Page 14
8 Comparison Group Public and private institutions
9 # of Comparison States
National comparison—state level data not available.
10 National Leaders State level data not available.
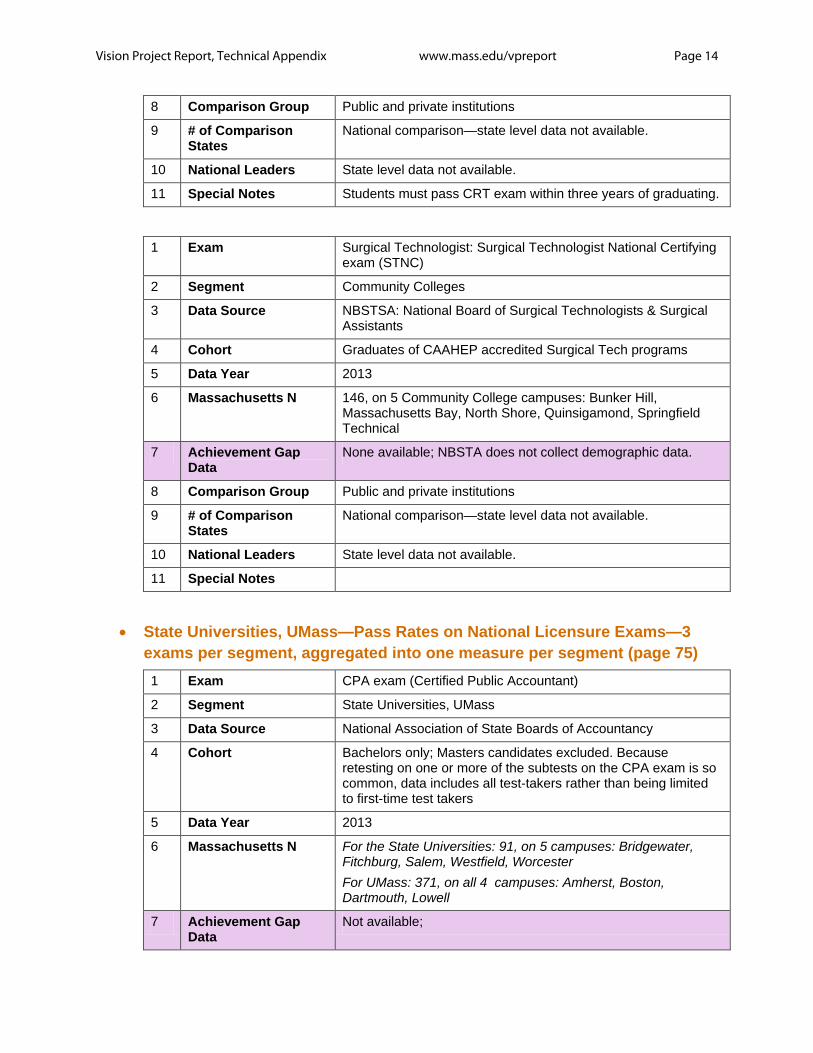
11 Special Notes Students must pass CRT exam within three years of graduating.
1 Exam Surgical Technologist: Surgical Technologist National Certifying
exam (STNC)
2 Segment Community Colleges
3 Data Source NBSTSA: National Board of Surgical Technologists & Surgical Assistants
4 Cohort Graduates of CAAHEP accredited Surgical Tech programs
5 Data Year 2013
6 Massachusetts N 146, on 5 Community College campuses: Bunker Hill, Massachusetts Bay, North Shore, Quinsigamond, Springfield Technical
7 Achievement Gap Data
None available; NBSTA does not collect demographic data.
8 Comparison Group Public and private institutions
9 # of Comparison States
National comparison—state level data not available.
10 National Leaders State level data not available.
11 Special Notes
• State Universities, UMass—Pass Rates on National Licensure Exams—3
exams per segment, aggregated into one measure per segment (page 75) 1 Exam CPA exam (Certified Public Accountant)
2 Segment State Universities, UMass
3 Data Source National Association of State Boards of Accountancy
4 Cohort Bachelors only; Masters candidates excluded. Because retesting on one or more of the subtests on the CPA exam is so common, data includes all test-takers rather than being limited to first-time test takers
5 Data Year 2013
6 Massachusetts N For the State Universities: 91, on 5 campuses: Bridgewater, Fitchburg, Salem, Westfield, Worcester For UMass: 371, on all 4 campuses: Amherst, Boston, Dartmouth, Lowell
7 Achievement Gap Data
Not available;
Vision Project Report, Technical Appendix www.mass.edu/vpreport Page 15
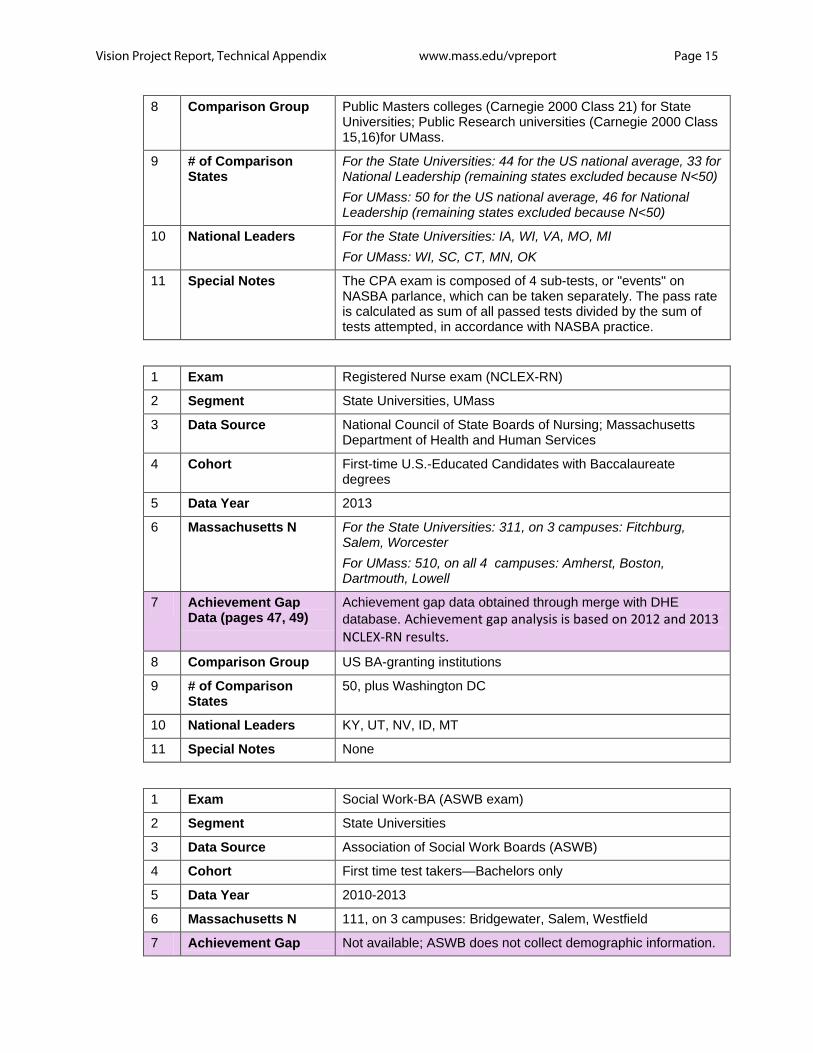
8 Comparison Group Public Masters colleges (Carnegie 2000 Class 21) for State Universities; Public Research universities (Carnegie 2000 Class 15,16)for UMass.
9 # of Comparison States
For the State Universities: 44 for the US national average, 33 for National Leadership (remaining states excluded because N<50) For UMass: 50 for the US national average, 46 for National Leadership (remaining states excluded because N<50)
10 National Leaders For the State Universities: IA, WI, VA, MO, MI For UMass: WI, SC, CT, MN, OK
11 Special Notes The CPA exam is composed of 4 sub-tests, or "events" on NASBA parlance, which can be taken separately. The pass rate is calculated as sum of all passed tests divided by the sum of tests attempted, in accordance with NASBA practice.
1 Exam Registered Nurse exam (NCLEX-RN)
2 Segment State Universities, UMass
3 Data Source National Council of State Boards of Nursing; Massachusetts Department of Health and Human Services
4 Cohort First-time U.S.-Educated Candidates with Baccalaureate degrees
5 Data Year 2013
6 Massachusetts N For the State Universities: 311, on 3 campuses: Fitchburg, Salem, Worcester For UMass: 510, on all 4 campuses: Amherst, Boston, Dartmouth, Lowell
7 Achievement Gap Data (pages 47, 49)
Achievement gap data obtained through merge with DHE database. Achievement gap analysis is based on 2012 and 2013 NCLEX-RN results.
8 Comparison Group US BA-granting institutions
9 # of Comparison States
50, plus Washington DC
10 National Leaders KY, UT, NV, ID, MT
11 Special Notes None
1 Exam Social Work-BA (ASWB exam)
2 Segment State Universities
3 Data Source Association of Social Work Boards (ASWB)
4 Cohort First time test takers—Bachelors only
5 Data Year 2010-2013
6 Massachusetts N 111, on 3 campuses: Bridgewater, Salem, Westfield
7 Achievement Gap Not available; ASWB does not collect demographic information.
Vision Project Report, Technical Appendix www.mass.edu/vpreport Page 16
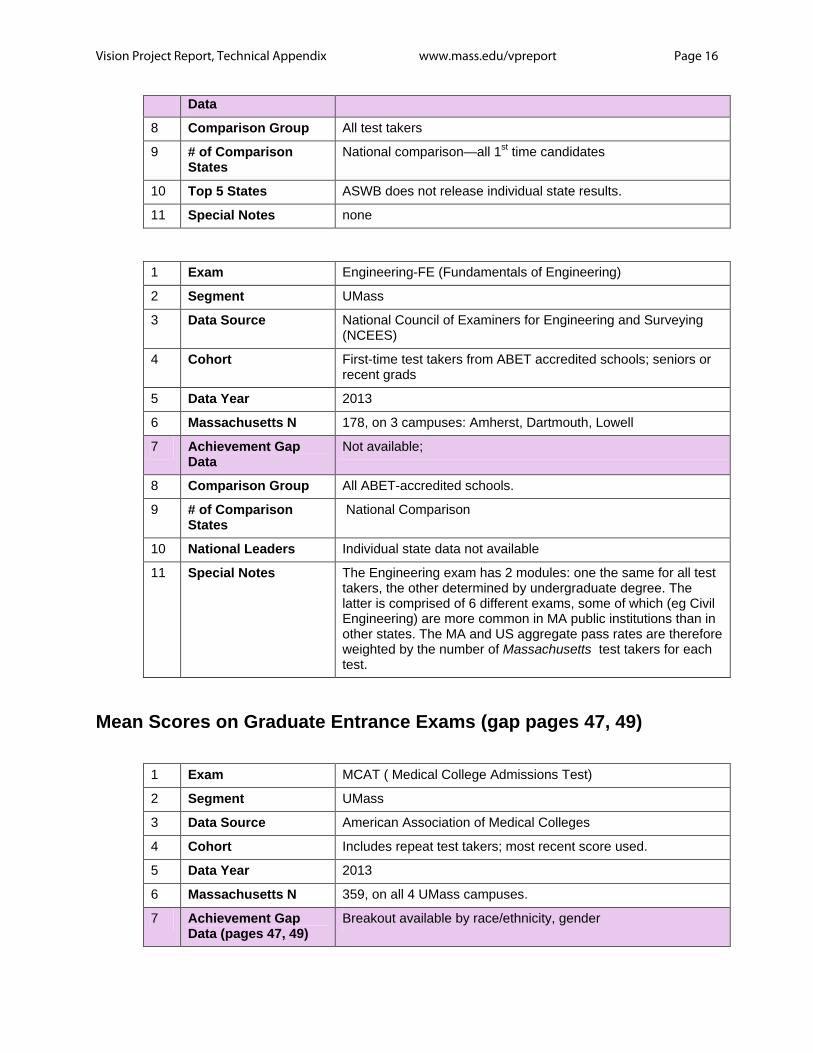
Data
8 Comparison Group All test takers
9 # of Comparison States
National comparison—all 1st time candidates
10 Top 5 States ASWB does not release individual state results.
11 Special Notes none
1 Exam Engineering-FE (Fundamentals of Engineering)
2 Segment UMass
3 Data Source National Council of Examiners for Engineering and Surveying (NCEES)
4 Cohort First-time test takers from ABET accredited schools; seniors or recent grads
5 Data Year 2013
6 Massachusetts N 178, on 3 campuses: Amherst, Dartmouth, Lowell
7 Achievement Gap Data
Not available;
8 Comparison Group All ABET-accredited schools.
9 # of Comparison States
National Comparison
10 National Leaders Individual state data not available
11 Special Notes The Engineering exam has 2 modules: one the same for all test takers, the other determined by undergraduate degree. The latter is comprised of 6 different exams, some of which (eg Civil Engineering) are more common in MA public institutions than in other states. The MA and US aggregate pass rates are therefore weighted by the number of Massachusetts test takers for each test.
Mean Scores on Graduate Entrance Exams (gap pages 47, 49)
1 Exam MCAT ( Medical College Admissions Test)
2 Segment UMass
3 Data Source American Association of Medical Colleges
4 Cohort Includes repeat test takers; most recent score used.
5 Data Year 2013
6 Massachusetts N 359, on all 4 UMass campuses.
7 Achievement Gap Data (pages 47, 49)
Breakout available by race/ethnicity, gender
Vision Project Report, Technical Appendix www.mass.edu/vpreport Page 17
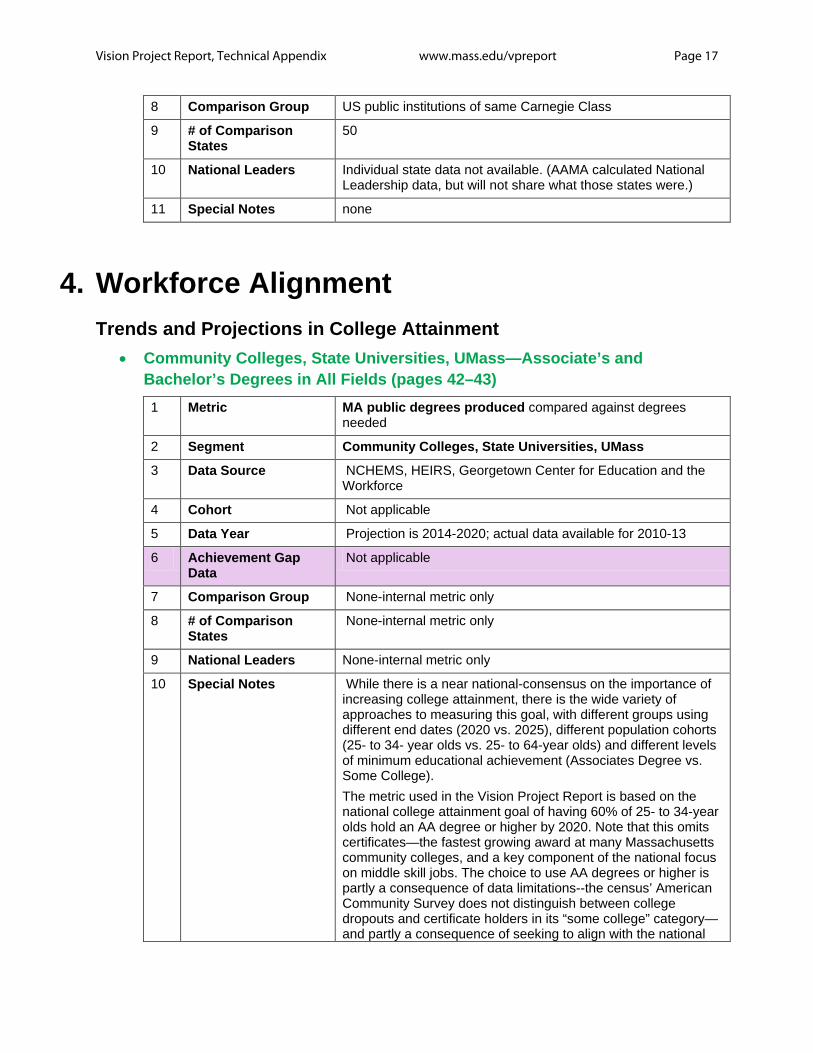
8 Comparison Group US public institutions of same Carnegie Class
9 # of Comparison States
50
10 National Leaders Individual state data not available. (AAMA calculated National Leadership data, but will not share what those states were.)
11 Special Notes none
4. Workforce Alignment Trends and Projections in College Attainment
• Community Colleges, State Universities, UMass—Associate’s and Bachelor’s Degrees in All Fields (pages 42–43) 1 Metric MA public degrees produced compared against degrees
needed
2 Segment Community Colleges, State Universities, UMass
3 Data Source NCHEMS, HEIRS, Georgetown Center for Education and the Workforce
4 Cohort Not applicable
5 Data Year Projection is 2014-2020; actual data available for 2010-13
6 Achievement Gap Data
Not applicable
7 Comparison Group None-internal metric only
8 # of Comparison States
None-internal metric only
9 National Leaders None-internal metric only
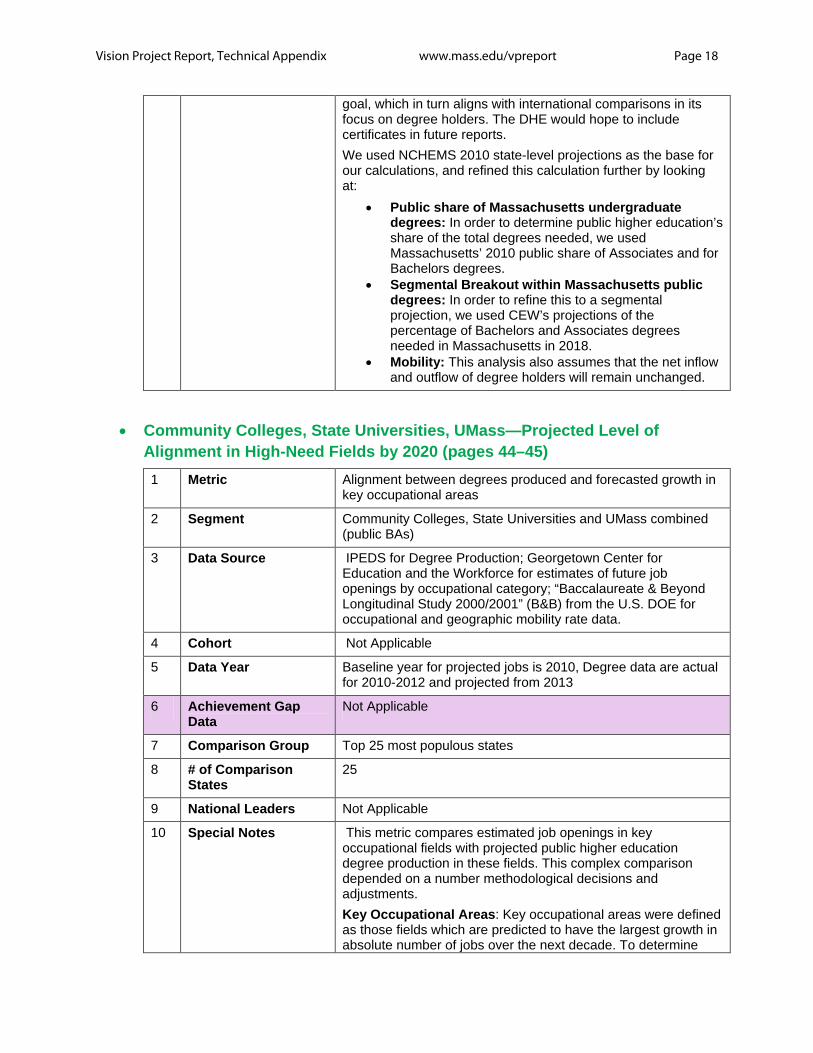
10 Special Notes While there is a near national-consensus on the importance of increasing college attainment, there is the wide variety of approaches to measuring this goal, with different groups using different end dates (2020 vs. 2025), different population cohorts (25- to 34- year olds vs. 25- to 64-year olds) and different levels of minimum educational achievement (Associates Degree vs. Some College). The metric used in the Vision Project Report is based on the national college attainment goal of having 60% of 25- to 34-year olds hold an AA degree or higher by 2020. Note that this omits certificates—the fastest growing award at many Massachusetts community colleges, and a key component of the national focus on middle skill jobs. The choice to use AA degrees or higher is partly a consequence of data limitations--the census’ American Community Survey does not distinguish between college dropouts and certificate holders in its “some college” category—and partly a consequence of seeking to align with the national
Vision Project Report, Technical Appendix www.mass.edu/vpreport Page 18
goal, which in turn aligns with international comparisons in its focus on degree holders. The DHE would hope to include certificates in future reports. We used NCHEMS 2010 state-level projections as the base for our calculations, and refined this calculation further by looking at:
• Public share of Massachusetts undergraduate degrees: In order to determine public higher education’s share of the total degrees needed, we used Massachusetts’ 2010 public share of Associates and for Bachelors degrees.
• Segmental Breakout within Massachusetts public degrees: In order to refine this to a segmental projection, we used CEW’s projections of the percentage of Bachelors and Associates degrees needed in Massachusetts in 2018.
• Mobility: This analysis also assumes that the net inflow and outflow of degree holders will remain unchanged.
• Community Colleges, State Universities, UMass—Projected Level of
Alignment in High-Need Fields by 2020 (pages 44–45) 1 Metric Alignment between degrees produced and forecasted growth in
key occupational areas
2 Segment Community Colleges, State Universities and UMass combined (public BAs)
3 Data Source IPEDS for Degree Production; Georgetown Center for Education and the Workforce for estimates of future job openings by occupational category; “Baccalaureate & Beyond Longitudinal Study 2000/2001” (B&B) from the U.S. DOE for occupational and geographic mobility rate data.
4 Cohort Not Applicable
5 Data Year Baseline year for projected jobs is 2010, Degree data are actual for 2010-2012 and projected from 2013
6 Achievement Gap Data
Not Applicable
7 Comparison Group Top 25 most populous states
8 # of Comparison States
25
9 National Leaders Not Applicable
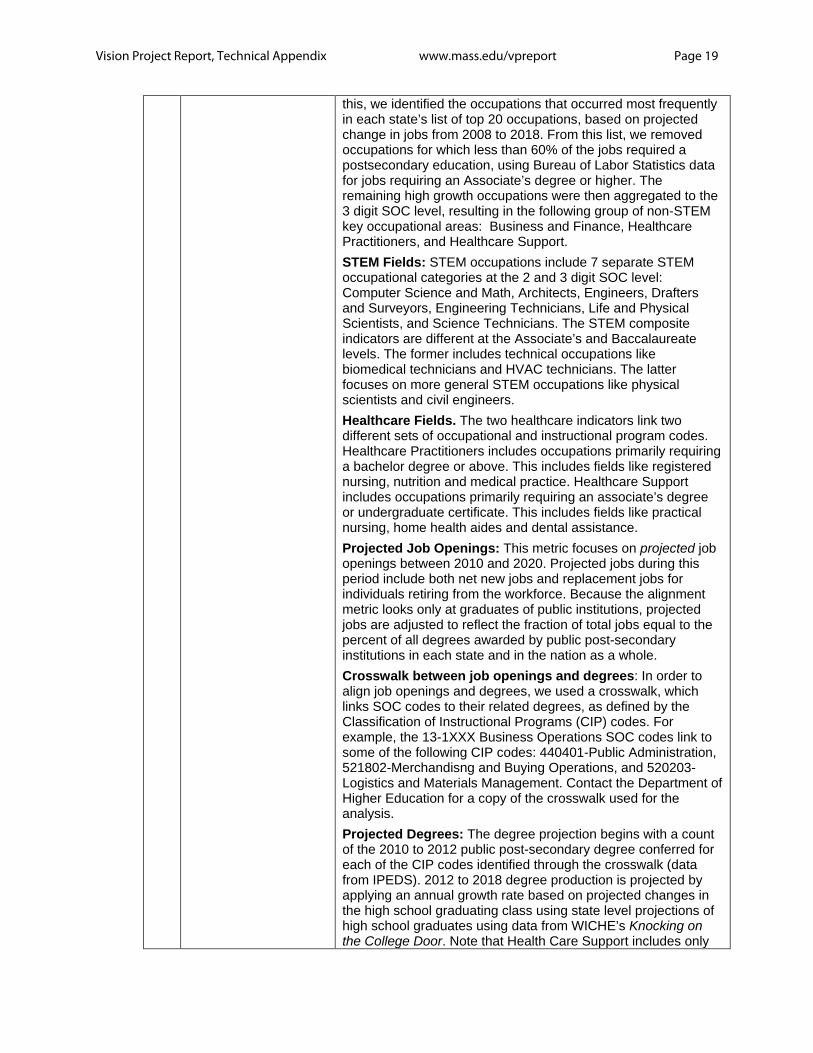
10 Special Notes This metric compares estimated job openings in key occupational fields with projected public higher education degree production in these fields. This complex comparison depended on a number methodological decisions and adjustments. Key Occupational Areas: Key occupational areas were defined as those fields which are predicted to have the largest growth in absolute number of jobs over the next decade. To determine
Vision Project Report, Technical Appendix www.mass.edu/vpreport Page 19
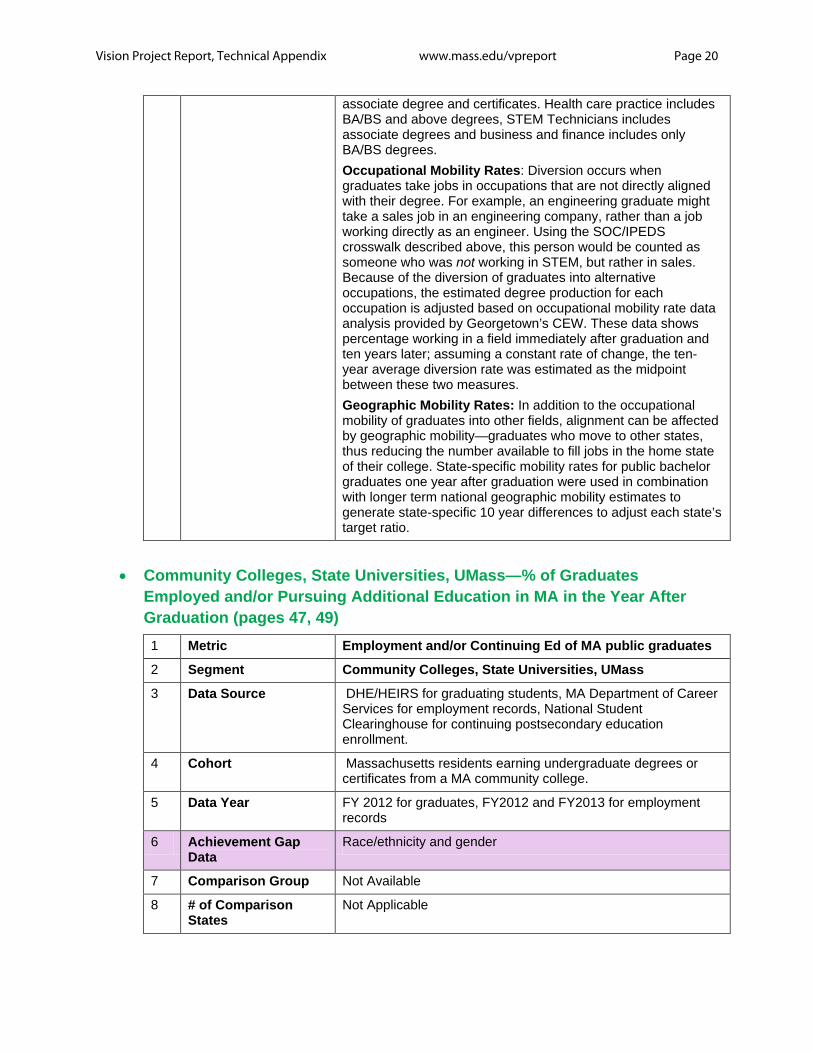
this, we identified the occupations that occurred most frequently in each state’s list of top 20 occupations, based on projected change in jobs from 2008 to 2018. From this list, we removed occupations for which less than 60% of the jobs required a postsecondary education, using Bureau of Labor Statistics data for jobs requiring an Associate’s degree or higher. The remaining high growth occupations were then aggregated to the 3 digit SOC level, resulting in the following group of non-STEM key occupational areas: Business and Finance, Healthcare Practitioners, and Healthcare Support. STEM Fields: STEM occupations include 7 separate STEM occupational categories at the 2 and 3 digit SOC level: Computer Science and Math, Architects, Engineers, Drafters and Surveyors, Engineering Technicians, Life and Physical Scientists, and Science Technicians. The STEM composite indicators are different at the Associate’s and Baccalaureate levels. The former includes technical occupations like biomedical technicians and HVAC technicians. The latter focuses on more general STEM occupations like physical scientists and civil engineers. Healthcare Fields. The two healthcare indicators link two different sets of occupational and instructional program codes. Healthcare Practitioners includes occupations primarily requiring a bachelor degree or above. This includes fields like registered nursing, nutrition and medical practice. Healthcare Support includes occupations primarily requiring an associate’s degree or undergraduate certificate. This includes fields like practical nursing, home health aides and dental assistance. Projected Job Openings: This metric focuses on projected job openings between 2010 and 2020. Projected jobs during this period include both net new jobs and replacement jobs for individuals retiring from the workforce. Because the alignment metric looks only at graduates of public institutions, projected jobs are adjusted to reflect the fraction of total jobs equal to the percent of all degrees awarded by public post-secondary institutions in each state and in the nation as a whole. Crosswalk between job openings and degrees: In order to align job openings and degrees, we used a crosswalk, which links SOC codes to their related degrees, as defined by the Classification of Instructional Programs (CIP) codes. For example, the 13-1XXX Business Operations SOC codes link to some of the following CIP codes: 440401-Public Administration, 521802-Merchandisng and Buying Operations, and 520203-Logistics and Materials Management. Contact the Department of Higher Education for a copy of the crosswalk used for the analysis. Projected Degrees: The degree projection begins with a count of the 2010 to 2012 public post-secondary degree conferred for each of the CIP codes identified through the crosswalk (data from IPEDS). 2012 to 2018 degree production is projected by applying an annual growth rate based on projected changes in the high school graduating class using state level projections of high school graduates using data from WICHE’s Knocking on the College Door. Note that Health Care Support includes only
Vision Project Report, Technical Appendix www.mass.edu/vpreport Page 20
associate degree and certificates. Health care practice includes BA/BS and above degrees, STEM Technicians includes associate degrees and business and finance includes only BA/BS degrees. Occupational Mobility Rates: Diversion occurs when graduates take jobs in occupations that are not directly aligned with their degree. For example, an engineering graduate might take a sales job in an engineering company, rather than a job working directly as an engineer. Using the SOC/IPEDS crosswalk described above, this person would be counted as someone who was not working in STEM, but rather in sales. Because of the diversion of graduates into alternative occupations, the estimated degree production for each occupation is adjusted based on occupational mobility rate data analysis provided by Georgetown’s CEW. These data shows percentage working in a field immediately after graduation and ten years later; assuming a constant rate of change, the ten-year average diversion rate was estimated as the midpoint between these two measures. Geographic Mobility Rates: In addition to the occupational mobility of graduates into other fields, alignment can be affected by geographic mobility—graduates who move to other states, thus reducing the number available to fill jobs in the home state of their college. State-specific mobility rates for public bachelor graduates one year after graduation were used in combination with longer term national geographic mobility estimates to generate state-specific 10 year differences to adjust each state’s target ratio.
• Community Colleges, State Universities, UMass—% of Graduates
Employed and/or Pursuing Additional Education in MA in the Year After Graduation (pages 47, 49) 1 Metric Employment and/or Continuing Ed of MA public graduates
2 Segment Community Colleges, State Universities, UMass
3 Data Source DHE/HEIRS for graduating students, MA Department of Career Services for employment records, National Student Clearinghouse for continuing postsecondary education enrollment.
4 Cohort Massachusetts residents earning undergraduate degrees or certificates from a MA community college.
5 Data Year FY 2012 for graduates, FY2012 and FY2013 for employment records
6 Achievement Gap Data
Race/ethnicity and gender
7 Comparison Group Not Available
8 # of Comparison States
Not Applicable
Vision Project Report, Technical Appendix www.mass.edu/vpreport Page 21
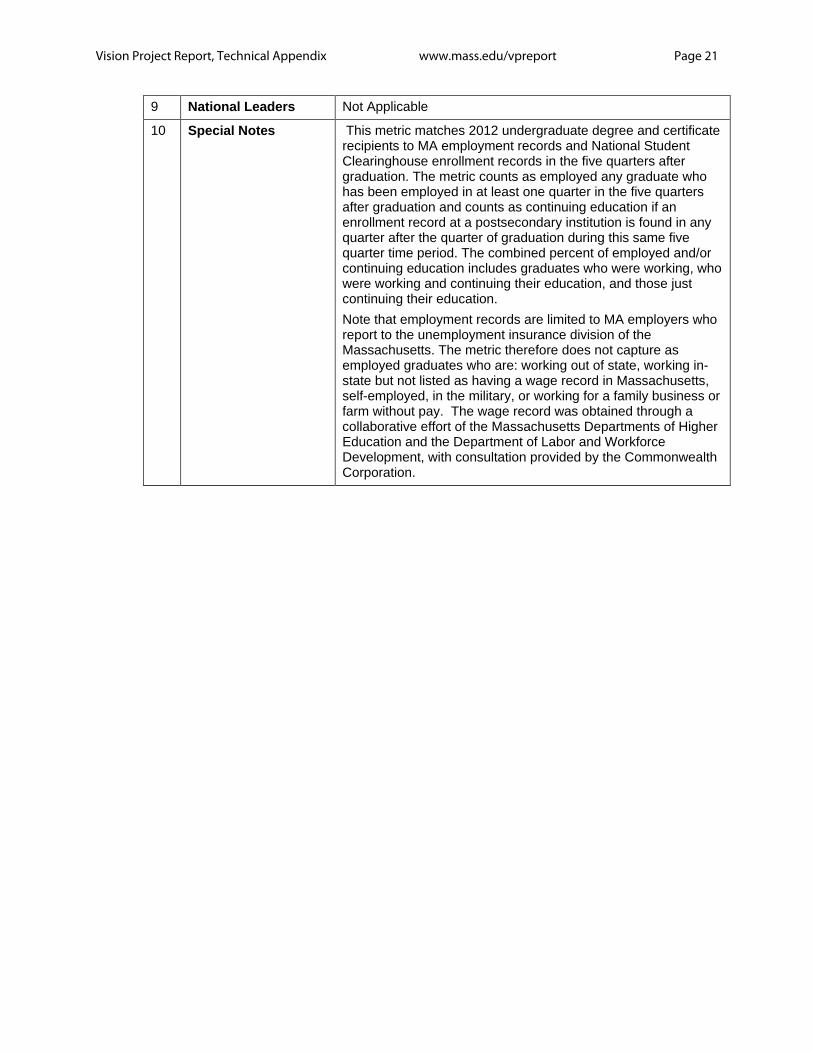
9 National Leaders Not Applicable
10 Special Notes This metric matches 2012 undergraduate degree and certificate recipients to MA employment records and National Student Clearinghouse enrollment records in the five quarters after graduation. The metric counts as employed any graduate who has been employed in at least one quarter in the five quarters after graduation and counts as continuing education if an enrollment record at a postsecondary institution is found in any quarter after the quarter of graduation during this same five quarter time period. The combined percent of employed and/or continuing education includes graduates who were working, who were working and continuing their education, and those just continuing their education. Note that employment records are limited to MA employers who report to the unemployment insurance division of the Massachusetts. The metric therefore does not capture as employed graduates who are: working out of state, working in-state but not listed as having a wage record in Massachusetts, self-employed, in the military, or working for a family business or farm without pay. The wage record was obtained through a collaborative effort of the Massachusetts Departments of Higher Education and the Department of Labor and Workforce Development, with consultation provided by the Commonwealth Corporation.