Embed Size (px)
Citation preview
Int. J. Modelling, Identification and Control, Vol. 1, No. 2, 2006
Copyright © 2006 Inderscience Enterprises Ltd.
84
Vision-based sensing of the welding process: a survey
Gohar Saeed Progressive Systems, Berea, KY 40403, USA E-mail: [email protected]
Abstract: A substantially successful technology that has emerged is the use of electro-optics, which has been expanded into the realm of ‘machine vision’ with the rapid advance in optical sensor technology and computer processing power. The basic principle of the optical sensor has remained unchanged over the years. Charge-Coupled Devices (CCDs), laser diodes and microprocessors form the basis of this type of sensing technique. CCDs have found their use in the observation of weld pool. It is known that the surface of the weld pool contains information that can be used to control the welding process. Researchers have used cameras to observe the weld pool and study the shape of the weld pool. Optical sensors have also been used to measure the arc light to determine the state of the weld pool. This paper summarises limited research done in the field of sensing the weld pool visually or optically and is intended to give the reader a brief overview of what optical technologies and techniques have been used to sense the weld pool state.
Keywords: weld pool surface; vision based sensing; survey; three dimensional analysis; two dimensional analysis; machine vision; weld pool depth; surface reconstruction.
Reference to this paper should be made as follows: Saeed, G. (2006) ‘Vision-based sensing of the welding process: a survey’, Int. J. Modelling, Identification and Control, Vol. 1, No. 2, pp.84–93.
Biographical notes: Gohar Saeed obtained his initial schooling in the United Arab Emirates (UAE). He received his PhD in Electrical Engineering from the University of Kentucky focusing in machine vision applications to welding processes under Professor Yu Ming Zhang for four years in the Center for Robotics and Manufacturing Systems. He also received his MS and BS in Electrical Engineering from the University of Kentucky. His areas of research interests are machine vision, controls, automation, welding and image processing. Currently, he is working for Progressive Systems in Berea, Kentucky as a Project Engineer.
1 Introduction
Vision-based sensors have found their use in many applications ranging from far outer space exploration to microscopy. A few applications have varying degrees of complexity, ranging from something as simple as monitoring the presence of a product on a moving manufacturing line, to something as complex as diagnosing whether a tumour might be cancerous. As far as the manufacturing industry is concerned, imaging sensors form the heart of many vision-based monitoring systems.
The most commonly used industrial vision sensor is the monochrome camera, which acquires visible light intensities from black to white in various shades of grey. Monochrome cameras are used in industrial applications not requiring colour information to perform the required task. Examples include acquiring shape information of finished parts on a production line, verifying correct position of labels on containers and reading their barcodes, etc. If colour information is critical for proper monitoring a colour-imaging sensor such as a Red Green Blue (RGB) three-channel camera can be used. Both monochrome and RGB cameras are commercially available in various configurations, sizes and resolutions to meet the demands of most industrial applications.
The monochrome and colour cameras acquire images based on light intensities in the human visible wavelength spectrum of 400–700 nm. Over the past few decades, several imaging sensors have also been developed that are sensitive to light beyond the visible spectral wavelength range. These ‘spectral’ cameras can acquire images in light wavelengths on either side of the human visible spectrum. Ultraviolet (UV) cameras are sensitive to light in the wavelength range of 100–400 nm. Such cameras have been used in various space exploration and environmental applications. On the other side of the visible spectrum, several Near-Infrared (NIR) and thermal Infrared (IR) imaging cameras have also been realised, which are sensitive to light in the 900–2500 nm and 2500–14000 nm wavelength, respectively. Thermal IR cameras find use in several heat sensing applications such as night vision and ‘hot spot’ detection in electrical equipment. NIR cameras have been used in many industrial applications including semiconductor wafer inspection, forensics, online inspection and sorting of food products for contaminants.
Vision-based sensing is used to determine the state of weld pool. Generally, a human welder uses vision to look at the weld pool and make judgements about the welding process and adjusts the parameters accordingly. Similarly, vision sensors can be used to sense the weld pool state and
Vision-based sensing of the welding process: a survey 85
in conjunction with a control algorithm to adjust the welding parameters. In particular, optical sensors have been used to study the spectrum of arc light to find the relationship of the change in arc light to the welding process. These techniques are discussed in Section 2. Algorithms have been developed for determining the boundary of the weld pool. The Two-Dimensional (2D) shape of the weld pool has also been studied in relation to the current change using special synchronised laser and camera shutter (Hong et al., 2000). The algorithms and research done in studying the 2D shape of the weld pool will be surveyed in Section 3. Programmes have also been developed to measure the Three-Dimensional (3D) depth of the weld pool surface and methods have been experimented with to determine the depth of weld pool experimentally. The 3D shape of the weld pool surface has also been studied using stereovision. Some of the research related to 3D surface reconstruction of weld pool is detailed in Section 4.
2 Optical sensors
Optical sensors have been used to study oscillations of the weld pool (Hartman et al., 1999). To control the weld pool, it is crucial to sense at least one of its critical parameters and use it as the feedback. Generally, arc voltage or arc light has been used. A model of the relationship between the pool’s geometry and its frequency is necessary to extract useful information from the power spectral density and to properly adjust the total heat input into the weldment. The optical sensor is used to detect the pool oscillation, which is accomplished by collecting the specular reflection from the mirror-like surface of the weld pool. Specular reflection of the pool’s surface has been found to provide modal information from the pool’s vibrations, thus enhancing the detection and controllability of the process (Hartman et al., 1999). A schematic of the optical probe relative to the welding torch and workpiece is shown in Figure 1.
Figure 1 Optical sensor (Hartman et al., 1999)
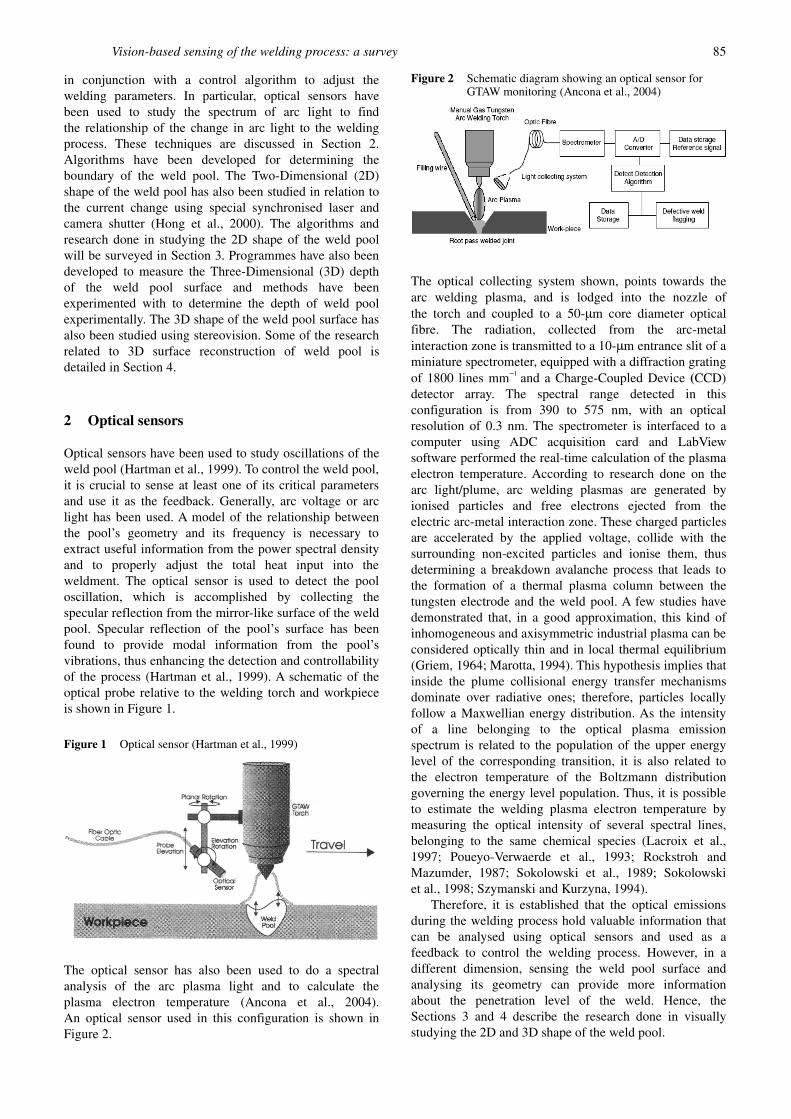
The optical sensor has also been used to do a spectral analysis of the arc plasma light and to calculate the plasma electron temperature (Ancona et al., 2004). An optical sensor used in this configuration is shown in Figure 2.
Figure 2 Schematic diagram showing an optical sensor for GTAW monitoring (Ancona et al., 2004)
The optical collecting system shown, points towards the arc welding plasma, and is lodged into the nozzle of the torch and coupled to a 50-µm core diameter optical fibre. The radiation, collected from the arc-metal interaction zone is transmitted to a 10-µm entrance slit of a miniature spectrometer, equipped with a diffraction grating of 1800 lines mm−1 and a Charge-Coupled Device (CCD) detector array. The spectral range detected in this configuration is from 390 to 575 nm, with an optical resolution of 0.3 nm. The spectrometer is interfaced to a computer using ADC acquisition card and LabView software performed the real-time calculation of the plasma electron temperature. According to research done on the arc light/plume, arc welding plasmas are generated by ionised particles and free electrons ejected from the electric arc-metal interaction zone. These charged particles are accelerated by the applied voltage, collide with the surrounding non-excited particles and ionise them, thus determining a breakdown avalanche process that leads to the formation of a thermal plasma column between the tungsten electrode and the weld pool. A few studies have demonstrated that, in a good approximation, this kind of inhomogeneous and axisymmetric industrial plasma can be considered optically thin and in local thermal equilibrium (Griem, 1964; Marotta, 1994). This hypothesis implies that inside the plume collisional energy transfer mechanisms dominate over radiative ones; therefore, particles locally follow a Maxwellian energy distribution. As the intensity of a line belonging to the optical plasma emission spectrum is related to the population of the upper energy level of the corresponding transition, it is also related to the electron temperature of the Boltzmann distribution governing the energy level population. Thus, it is possible to estimate the welding plasma electron temperature by measuring the optical intensity of several spectral lines, belonging to the same chemical species (Lacroix et al., 1997; Poueyo-Verwaerde et al., 1993; Rockstroh and Mazumder, 1987; Sokolowski et al., 1989; Sokolowski et al., 1998; Szymanski and Kurzyna, 1994).
Therefore, it is established that the optical emissions during the welding process hold valuable information that can be analysed using optical sensors and used as a feedback to control the welding process. However, in a different dimension, sensing the weld pool surface and analysing its geometry can provide more information about the penetration level of the weld. Hence, the Sections 3 and 4 describe the research done in visually studying the 2D and 3D shape of the weld pool.

86 G. Saeed
3 2D analysis of the weld pool
Observation of the weld pool in real time is difficult due to the intense arc light, and splatter of hot metal while welding. A few researchers used different techniques incorporating active light sensing using laser to illuminate the weld pool and using combination of filters to block out the arc light. A few researchers used the arc light itself to illuminate the weld pool but use an arc blocker and position the camera such that the arc light is blocked in the image.
A major technique for a 2D weld pool boundary measurement is to use the laser strobe system. The laser strobe system consists of a pulse laser illumination unit, a camera head and a system controller. The camera is fitted with an optical filter to allow light in the wavelength of 330–340 nm to pass through. The laser wavelength is centred at 337.1 nm. The pulse duration of the laser is 5 ns and the camera is synchronised with the laser pulse. The laser power density during this duration is much higher than the arc emission. An earlier work using this technique was done at the University of Kentucky (Kovacevic et al., 1995) in which the camera observed the weld pool at an angle to the direction of the weld (Figure 3) and the weld pool area was controlled using an adaptive algorithm. A complete weld pool detection and edge extraction in real time was written based on the greyness difference and directional gradient of greyness between the weld pool and the HAZ zone and the base metal. On the basis of the largest directional gradient change at the edge of the weld pool, edges were determined. The pool edge extraction was performed in two steps: locating the pool based on the largest area of low greyness in the illuminated area and then determining the front, side and rear edge. The presence of oxides in the weld pool sometimes caused areas of high grey levels inside the weld pool, which caused difficulty in processing the images for edges. On the basis of the weld pool shape, a robust adaptive controller was used to control the size of the weld pool. To confirm the effectiveness of the control system (combination of the sensor, image processing and control algorithm), various experiments were performed for initial parameters, torch speed variation and head transfer condition change and it was proven that the controller
could maintain the pool size closer to the desired level with the variations in the system.
In a paper by Luo et al. from the Gintic Institute of Manufacturing Technology, the same laser strobe ultrahigh shutter speed vision system was used (Luo et al., 2001). The reflection from the molten metal was used to study the weld pool. Their analysis was done by standard image processing software called VisionBlox. After capturing the image of the weld pool the VisionBlox software was used to do edge detection and blob analysis used to measure the size of the weld pool. The pixel to mm ratio was determined by calibration. After determining the 2D length and width of the weld pool, a neuro-fuzzy logic controller was implemented to control the welding process. Using this technique, the 2D measurements of length and width can be obtained. As a part of their research, they conducted a study to determine the correlation of the welding speed, welding current and the weld pool length and width. Figures 4 and 5 show the results from experimentation (Luo et al., 2001).
During the experiments, the overlap of the torch and weld pool was observed. The weld pool was located and the edge detection performed in a region of interest marked by the area where the weld pool is located in the image. The interference of the arc and shadowing was considered to be negligible and the computation done including the shadowed part of torch tip as shown in Figure 6.
Another major technique for a 2D weld pool boundary measurement is the co-axial viewing of the weld pool, which was first proposed by Richardson et al. (1984) and has been extensively investigated by a number of researchers (Boyer and Penix, 1992; Brzakovic and Khani, 1991; Pietrzak and Packer, 1991; Richardson et al., 1984). In the co-axial viewing, the electrode is used to block the arc.
In another type of research done by Wu et al. from the Institute of Material Joining at Shangdon University, China, more readily available components instead of the specialised pulsed laser were used to observe the weld pool. They used a regular CCD sensor having a resolution of 600 TV lines and 8 shutter speeds. The CCD was fitted with a narrow band filter centred at 610 nm, half-bandwidth 10 nm and transparency of 27%. A study
Figure 3 Experimental set-up and captured image (Kovacevic et al., 1995)
Vision-based sensing of the welding process: a survey 87
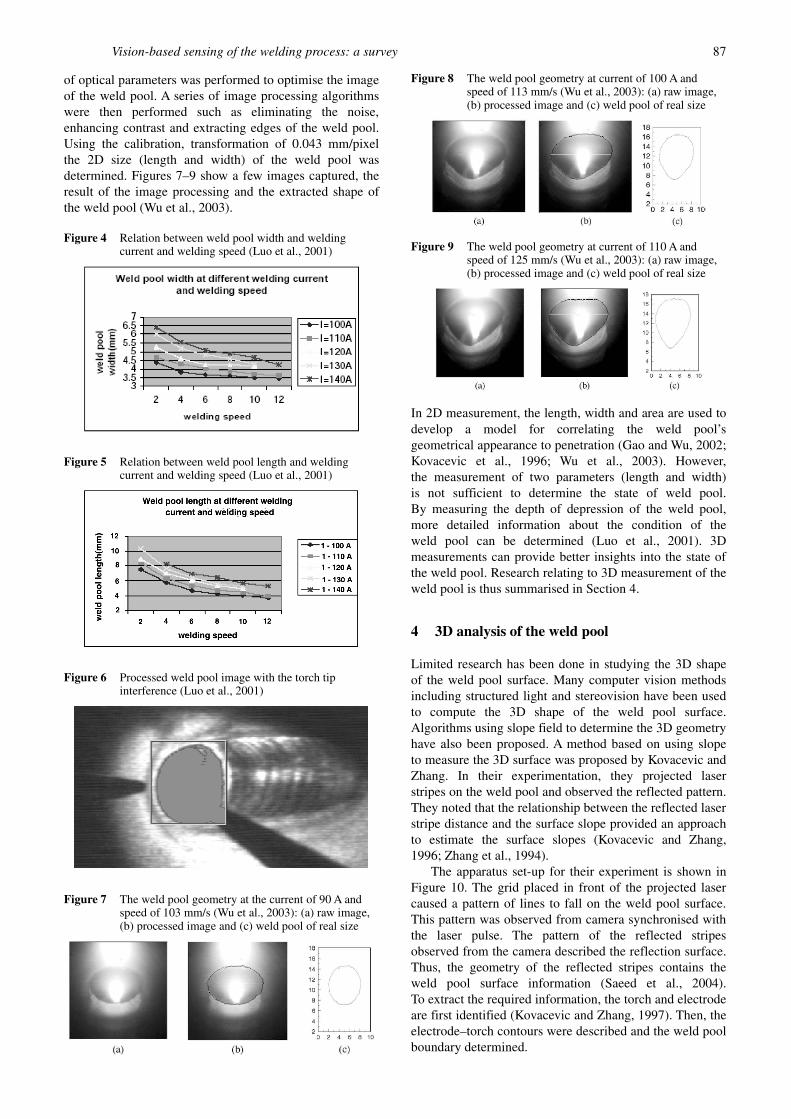
of optical parameters was performed to optimise the image of the weld pool. A series of image processing algorithms were then performed such as eliminating the noise, enhancing contrast and extracting edges of the weld pool. Using the calibration, transformation of 0.043 mm/pixel the 2D size (length and width) of the weld pool was determined. Figures 7–9 show a few images captured, the result of the image processing and the extracted shape of the weld pool (Wu et al., 2003).
Figure 4 Relation between weld pool width and welding current and welding speed (Luo et al., 2001)
Figure 5 Relation between weld pool length and welding current and welding speed (Luo et al., 2001)
Figure 6 Processed weld pool image with the torch tip interference (Luo et al., 2001)
Figure 7 The weld pool geometry at the current of 90 A and speed of 103 mm/s (Wu et al., 2003): (a) raw image, (b) processed image and (c) weld pool of real size
Figure 8 The weld pool geometry at current of 100 A and speed of 113 mm/s (Wu et al., 2003): (a) raw image, (b) processed image and (c) weld pool of real size
Figure 9 The weld pool geometry at current of 110 A and speed of 125 mm/s (Wu et al., 2003): (a) raw image, (b) processed image and (c) weld pool of real size
In 2D measurement, the length, width and area are used to develop a model for correlating the weld pool’s geometrical appearance to penetration (Gao and Wu, 2002; Kovacevic et al., 1996; Wu et al., 2003). However, the measurement of two parameters (length and width) is not sufficient to determine the state of weld pool. By measuring the depth of depression of the weld pool, more detailed information about the condition of the weld pool can be determined (Luo et al., 2001). 3D measurements can provide better insights into the state of the weld pool. Research relating to 3D measurement of the weld pool is thus summarised in Section 4.
4 3D analysis of the weld pool
Limited research has been done in studying the 3D shape of the weld pool surface. Many computer vision methods including structured light and stereovision have been used to compute the 3D shape of the weld pool surface. Algorithms using slope field to determine the 3D geometry have also been proposed. A method based on using slope to measure the 3D surface was proposed by Kovacevic and Zhang. In their experimentation, they projected laser stripes on the weld pool and observed the reflected pattern. They noted that the relationship between the reflected laser stripe distance and the surface slope provided an approach to estimate the surface slopes (Kovacevic and Zhang, 1996; Zhang et al., 1994).
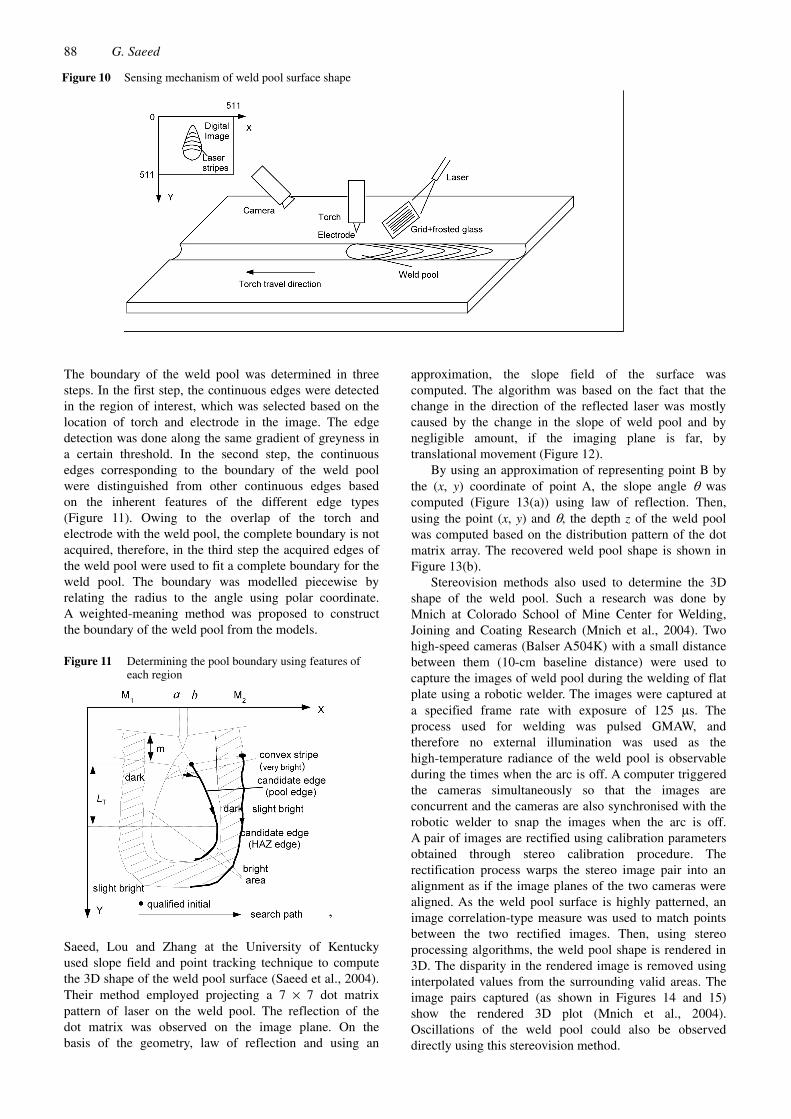
The apparatus set-up for their experiment is shown in Figure 10. The grid placed in front of the projected laser caused a pattern of lines to fall on the weld pool surface. This pattern was observed from camera synchronised with the laser pulse. The pattern of the reflected stripes observed from the camera described the reflection surface. Thus, the geometry of the reflected stripes contains the weld pool surface information (Saeed et al., 2004). To extract the required information, the torch and electrode are first identified (Kovacevic and Zhang, 1997). Then, the electrode–torch contours were described and the weld pool boundary determined.
88 G. Saeed
The boundary of the weld pool was determined in three steps. In the first step, the continuous edges were detected in the region of interest, which was selected based on the location of torch and electrode in the image. The edge detection was done along the same gradient of greyness in a certain threshold. In the second step, the continuous edges corresponding to the boundary of the weld pool were distinguished from other continuous edges based on the inherent features of the different edge types (Figure 11). Owing to the overlap of the torch and electrode with the weld pool, the complete boundary is not acquired, therefore, in the third step the acquired edges of the weld pool were used to fit a complete boundary for the weld pool. The boundary was modelled piecewise by relating the radius to the angle using polar coordinate. A weighted-meaning method was proposed to construct the boundary of the weld pool from the models.
Figure 11 Determining the pool boundary using features of each region
Saeed, Lou and Zhang at the University of Kentucky used slope field and point tracking technique to compute the 3D shape of the weld pool surface (Saeed et al., 2004). Their method employed projecting a 7 × 7 dot matrix pattern of laser on the weld pool. The reflection of the dot matrix was observed on the image plane. On the basis of the geometry, law of reflection and using an
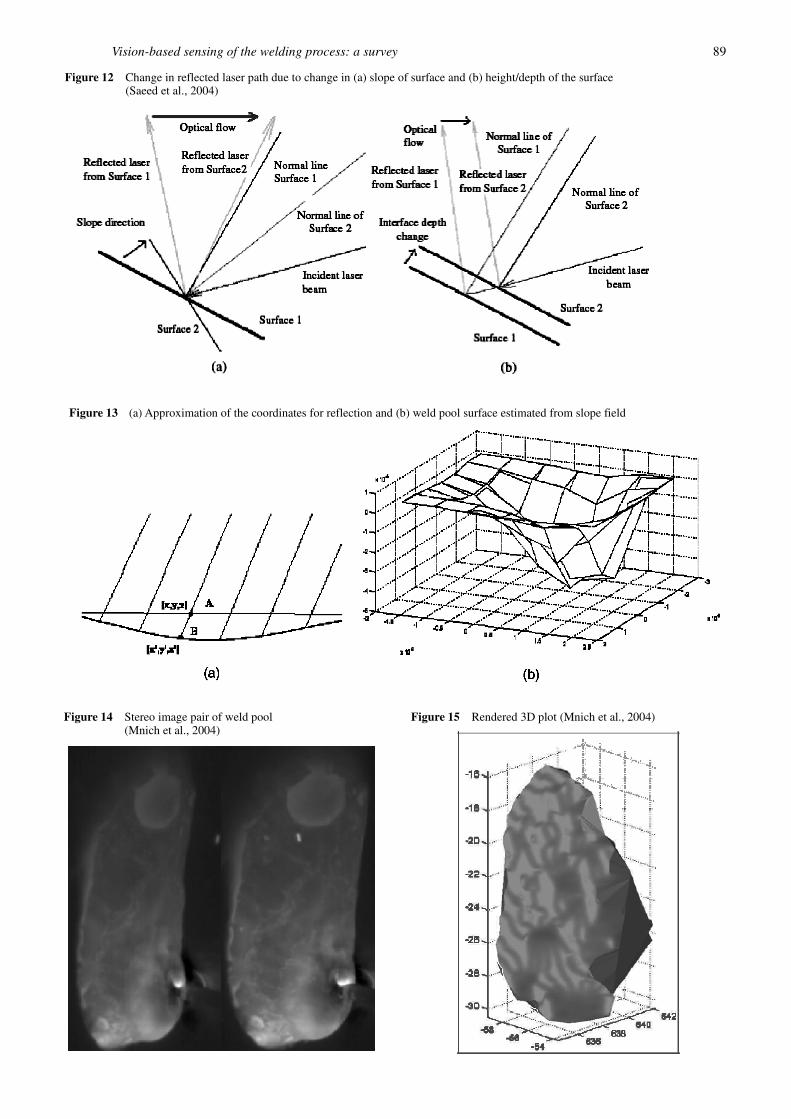
approximation, the slope field of the surface was computed. The algorithm was based on the fact that the change in the direction of the reflected laser was mostly caused by the change in the slope of weld pool and by negligible amount, if the imaging plane is far, by translational movement (Figure 12).
By using an approximation of representing point B by the (x, y) coordinate of point A, the slope angle θ was computed (Figure 13(a)) using law of reflection. Then, using the point (x, y) and θ, the depth z of the weld pool was computed based on the distribution pattern of the dot matrix array. The recovered weld pool shape is shown in Figure 13(b).
Stereovision methods also used to determine the 3D shape of the weld pool. Such a research was done by Mnich at Colorado School of Mine Center for Welding, Joining and Coating Research (Mnich et al., 2004). Two high-speed cameras (Balser A504K) with a small distance between them (10-cm baseline distance) were used to capture the images of weld pool during the welding of flat plate using a robotic welder. The images were captured at a specified frame rate with exposure of 125 µs. The process used for welding was pulsed GMAW, and therefore no external illumination was used as the high-temperature radiance of the weld pool is observable during the times when the arc is off. A computer triggered the cameras simultaneously so that the images are concurrent and the cameras are also synchronised with the robotic welder to snap the images when the arc is off. A pair of images are rectified using calibration parameters obtained through stereo calibration procedure. The rectification process warps the stereo image pair into an alignment as if the image planes of the two cameras were aligned. As the weld pool surface is highly patterned, an image correlation-type measure was used to match points between the two rectified images. Then, using stereo processing algorithms, the weld pool shape is rendered in 3D. The disparity in the rendered image is removed using interpolated values from the surrounding valid areas. The image pairs captured (as shown in Figures 14 and 15) show the rendered 3D plot (Mnich et al., 2004). Oscillations of the weld pool could also be observed directly using this stereovision method.
Figure 10 Sensing mechanism of weld pool surface shape
Vision-based sensing of the welding process: a survey 89
Figure 14 Stereo image pair of weld pool (Mnich et al., 2004)
Figure 15 Rendered 3D plot (Mnich et al., 2004)
Figure 12 Change in reflected laser path due to change in (a) slope of surface and (b) height/depth of the surface (Saeed et al., 2004)
Figure 13 (a) Approximation of the coordinates for reflection and (b) weld pool surface estimated from slope field
90 G. Saeed
Another technique of using biprism with the same concept of stereo imaging was used by Yoo and Lee at Seoul National University (Yoo and Lee, 2004). They employed a stereo system using a single CCD camera with single lens fitted with biprism. Typically, for stereo images acquired by two cameras, the focal lengths and zoom levels of the cameras are often slightly different. Differences in the optical properties of the two cameras cause intensity differences between corresponding points in stereo images. These unwanted geometric and intensity differences should be reduced as much as possible to increase the ability to find correspondences between pixel regions reliably for matching. A biprism stereo camera system also has the advantage that unwanted geometric and intensity differences between the stereo images are reduced. An arbitrary object point in 3D space is transformed into two virtual points by the biprism. The equivalent of a stereo pair of images is formed as the left and right halves of a single CCD image using a biprism. As in the conventional stereo system, the image disparity between the two image points of the two virtual points is directly related to the depth of the object point. Therefore, the system is inexpensive and extremely easy to calibrate as it requires only one CCD camera. An additional advantage of the geometrical set-up is that corresponding features lie on the same scan line automatically. The single camera and biprism have led to a simple stereo system for which correspondence is very easy and which is accurate for nearby objects in a small field of view. As only a single lens is used, calibration of the system is greatly simplified. This is due to the fact that only one focal length and one centre of projection need to be estimated. Figure 16 shows the use of biprism to obtain two virtual images Xl and Xr of a point Xp (Lee and Kweon, 2000).
Figure 16 The geometry of biprism (Lee and Kweon, 2000)
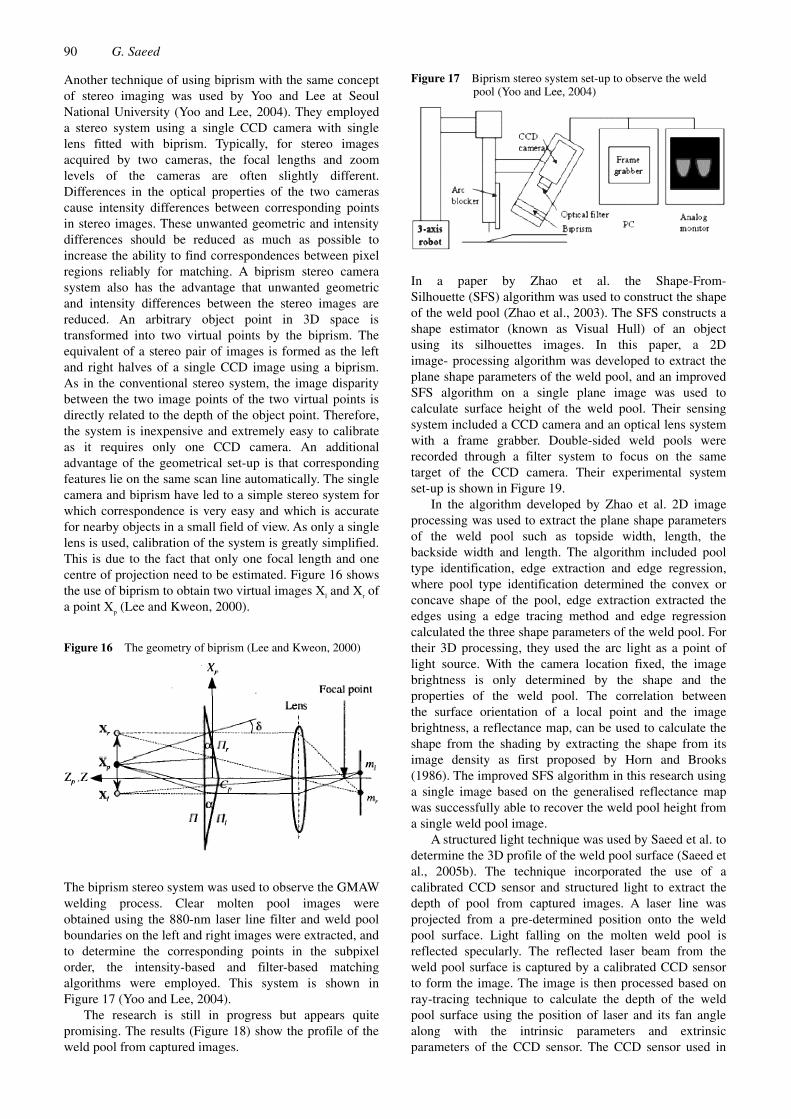
The biprism stereo system was used to observe the GMAW welding process. Clear molten pool images were obtained using the 880-nm laser line filter and weld pool boundaries on the left and right images were extracted, and to determine the corresponding points in the subpixel order, the intensity-based and filter-based matching algorithms were employed. This system is shown in Figure 17 (Yoo and Lee, 2004).
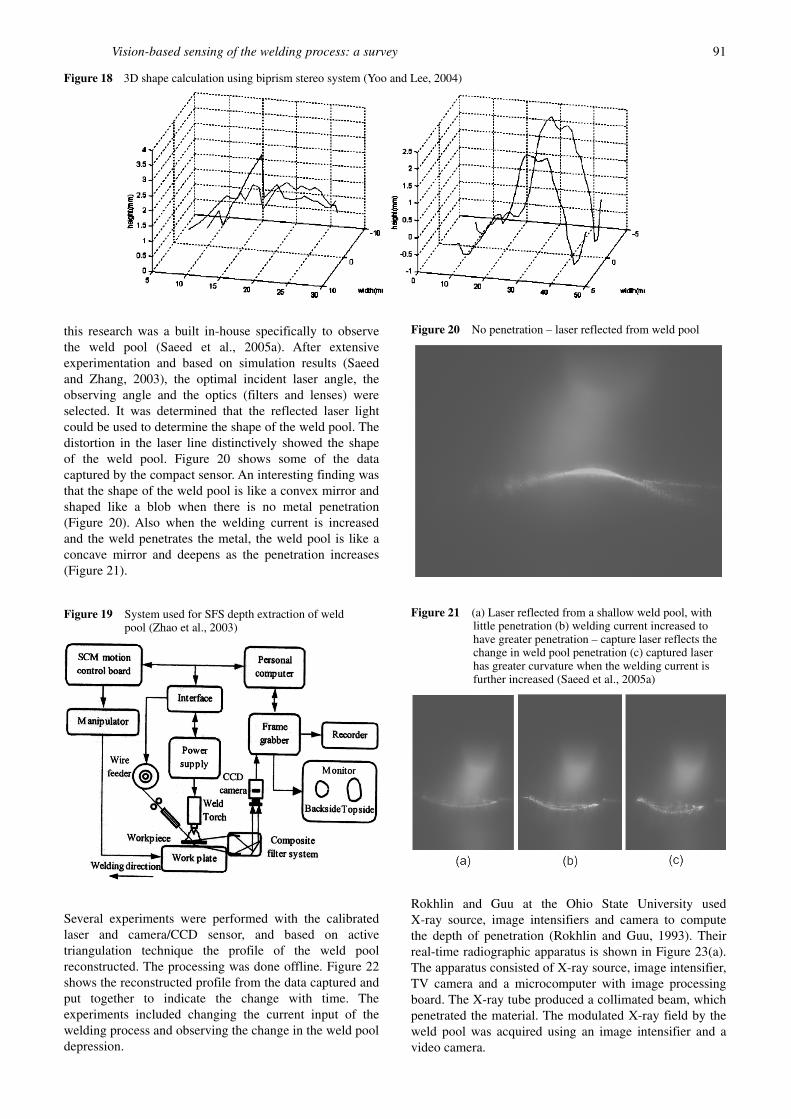
The research is still in progress but appears quite promising. The results (Figure 18) show the profile of the weld pool from captured images.
Figure 17 Biprism stereo system set-up to observe the weld pool (Yoo and Lee, 2004)
In a paper by Zhao et al. the Shape-From- Silhouette (SFS) algorithm was used to construct the shape of the weld pool (Zhao et al., 2003). The SFS constructs a shape estimator (known as Visual Hull) of an object using its silhouettes images. In this paper, a 2D image- processing algorithm was developed to extract the plane shape parameters of the weld pool, and an improved SFS algorithm on a single plane image was used to calculate surface height of the weld pool. Their sensing system included a CCD camera and an optical lens system with a frame grabber. Double-sided weld pools were recorded through a filter system to focus on the same target of the CCD camera. Their experimental system set-up is shown in Figure 19.
In the algorithm developed by Zhao et al. 2D image processing was used to extract the plane shape parameters of the weld pool such as topside width, length, the backside width and length. The algorithm included pool type identification, edge extraction and edge regression, where pool type identification determined the convex or concave shape of the pool, edge extraction extracted the edges using a edge tracing method and edge regression calculated the three shape parameters of the weld pool. For their 3D processing, they used the arc light as a point of light source. With the camera location fixed, the image brightness is only determined by the shape and the properties of the weld pool. The correlation between the surface orientation of a local point and the image brightness, a reflectance map, can be used to calculate the shape from the shading by extracting the shape from its image density as first proposed by Horn and Brooks (1986). The improved SFS algorithm in this research using a single image based on the generalised reflectance map was successfully able to recover the weld pool height from a single weld pool image.
A structured light technique was used by Saeed et al. to determine the 3D profile of the weld pool surface (Saeed et al., 2005b). The technique incorporated the use of a calibrated CCD sensor and structured light to extract the depth of pool from captured images. A laser line was projected from a pre-determined position onto the weld pool surface. Light falling on the molten weld pool is reflected specularly. The reflected laser beam from the weld pool surface is captured by a calibrated CCD sensor to form the image. The image is then processed based on ray-tracing technique to calculate the depth of the weld pool surface using the position of laser and its fan angle along with the intrinsic parameters and extrinsic parameters of the CCD sensor. The CCD sensor used in
Vision-based sensing of the welding process: a survey 91
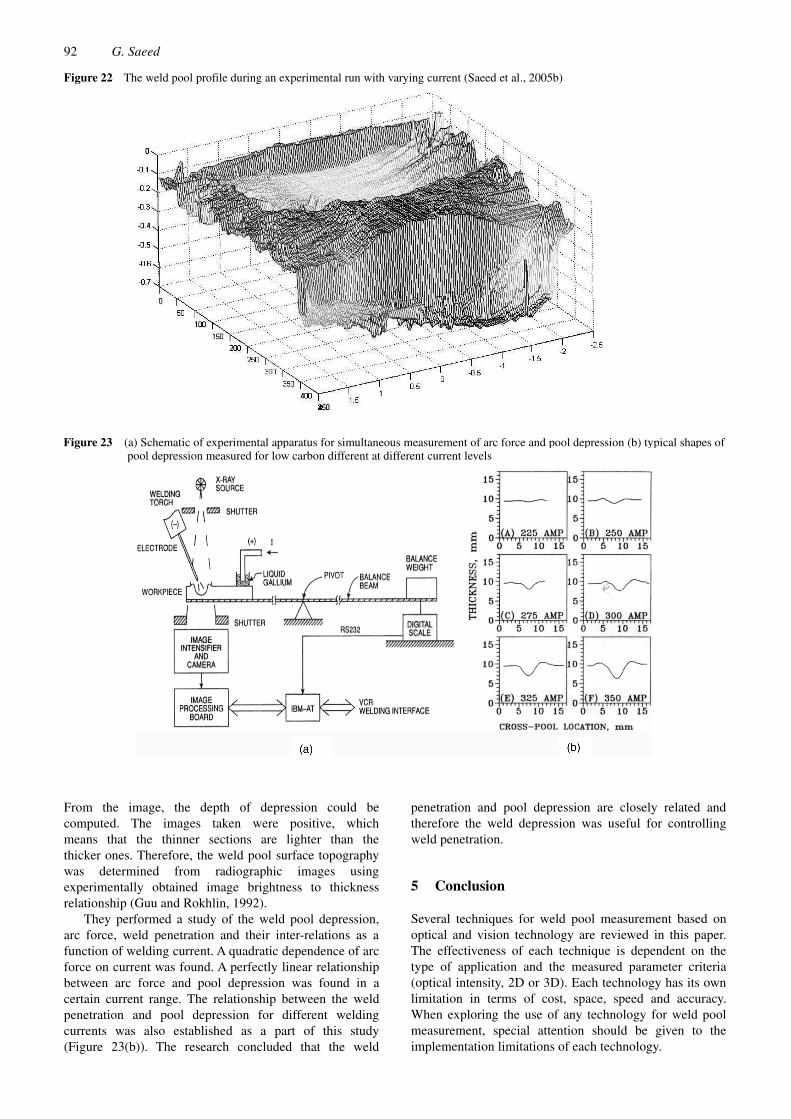
this research was a built in-house specifically to observe the weld pool (Saeed et al., 2005a). After extensive experimentation and based on simulation results (Saeed and Zhang, 2003), the optimal incident laser angle, the observing angle and the optics (filters and lenses) were selected. It was determined that the reflected laser light could be used to determine the shape of the weld pool. The distortion in the laser line distinctively showed the shape of the weld pool. Figure 20 shows some of the data captured by the compact sensor. An interesting finding was that the shape of the weld pool is like a convex mirror and shaped like a blob when there is no metal penetration (Figure 20). Also when the welding current is increased and the weld penetrates the metal, the weld pool is like a concave mirror and deepens as the penetration increases (Figure 21).
Figure 19 System used for SFS depth extraction of weld pool (Zhao et al., 2003)
Several experiments were performed with the calibrated laser and camera/CCD sensor, and based on active triangulation technique the profile of the weld pool reconstructed. The processing was done offline. Figure 22 shows the reconstructed profile from the data captured and put together to indicate the change with time. The experiments included changing the current input of the welding process and observing the change in the weld pool depression.
Figure 20 No penetration – laser reflected from weld pool
Figure 21 (a) Laser reflected from a shallow weld pool, with little penetration (b) welding current increased to have greater penetration – capture laser reflects the change in weld pool penetration (c) captured laser has greater curvature when the welding current is further increased (Saeed et al., 2005a)
Rokhlin and Guu at the Ohio State University used X-ray source, image intensifiers and camera to compute the depth of penetration (Rokhlin and Guu, 1993). Their real-time radiographic apparatus is shown in Figure 23(a). The apparatus consisted of X-ray source, image intensifier, TV camera and a microcomputer with image processing board. The X-ray tube produced a collimated beam, which penetrated the material. The modulated X-ray field by the weld pool was acquired using an image intensifier and a video camera.
Figure 18 3D shape calculation using biprism stereo system (Yoo and Lee, 2004)
92 G. Saeed
From the image, the depth of depression could be computed. The images taken were positive, which means that the thinner sections are lighter than the thicker ones. Therefore, the weld pool surface topography was determined from radiographic images using experimentally obtained image brightness to thickness relationship (Guu and Rokhlin, 1992).
They performed a study of the weld pool depression, arc force, weld penetration and their inter-relations as a function of welding current. A quadratic dependence of arc force on current was found. A perfectly linear relationship between arc force and pool depression was found in a certain current range. The relationship between the weld penetration and pool depression for different welding currents was also established as a part of this study (Figure 23(b)). The research concluded that the weld
penetration and pool depression are closely related and therefore the weld depression was useful for controlling weld penetration.
5 Conclusion
Several techniques for weld pool measurement based on optical and vision technology are reviewed in this paper. The effectiveness of each technique is dependent on the type of application and the measured parameter criteria (optical intensity, 2D or 3D). Each technology has its own limitation in terms of cost, space, speed and accuracy. When exploring the use of any technology for weld pool measurement, special attention should be given to the implementation limitations of each technology.
Figure 23 (a) Schematic of experimental apparatus for simultaneous measurement of arc force and pool depression (b) typical shapes of pool depression measured for low carbon different at different current levels
Figure 22 The weld pool profile during an experimental run with varying current (Saeed et al., 2005b)

Vision-based sensing of the welding process: a survey 93
References
Ancona, A., Lugara, P.M., Ottonelli, F. and Catalano, I.M. (2004) ‘A sensing torch for on-line monitoring of the gas tungsten arc welding process of steel pipes’, Measurement Science and Technology, Vol. 15, pp.2412–2418.
Boyer, K.L. and Penix, W.A. (1992) ‘An image analysis system for coaxially viewed weld scenes’, Machine Vision and Applications, Vol. 5, No. 4, pp.277–293.
Brzakovic, D. and Khani, D.T. (1991) ‘Weld pool edge detection for automated control of welding’, IEEE Transactions on Robotics and Automation, Vol. 7, No. 3, pp.397–403.
Gao, J.Q. and Wu, C.S. (2002) ‘Extracting weld penetration information in tungsten-inert gas arc welding’, Proceedings of the Institution of Mechanical Engineers, Part B: Journal of Engineering Manufacture, Vol. 216, No. B2, pp.207–214.
Griem, H.R. (1964) Plasma Spectroscopy, New York: McGraw-Hill, Chapter 13.
Guu, A.C. and Rokhlin, S.I. (1992) ‘Technique for simultaneous real-time measurements of welding pool surface geometry and arc force’, Welding Journal, Vol. 71, No. 12, pp.473s–482s.
Hartman, D.A., DeLapp, D.R., Cook, G.E. and Barnett, R.J. (1999) ‘Intelligent fusion control throughout varying thermal regions’, Proceedings of the IEEE Industry Applications Conference, Vol. 1, Phoenix, AZ, 3–7 October.
Hong, L., et al. (2000) ‘Vision based GTA weld pool sensing and control using neurofuzzy logic’, SIMTech Technical Report (AT/00/011/AMP), Singapore Institute of Manufacturing Technology.
Horn, B.K.P. and Brooks, M.J. (1986) ‘The variational approach to shape from shading’, Computer Vision Graphics Image Process, Vol. 33, pp.174–208.
Kovacevic, R. and Zhang, Y.M. (1996) ‘Sensing free surface of arc weld pool using specular reflection: principle and analysis’, Proceedings of the Institution of Mechanical Engineers, Part B: Journal of Engineering Manufacturing, Vol. 210, No. 6, pp.553–564.
Kovacevic, R. and Zhang, Y.M. (1997) ‘Real-time image processing for monitoring of free weld pool surface’, ASME Journal of Manufacturing Science and Engineering, Vol. 119, No. 2, pp.161–169.
Kovacevic, R., Zhang, Y.M. and Lin, L. (1996) ‘Monitoring of weld joint penetration based on weld pool geometrical appearance’, Welding Journal, Vol. 75, No. 10, pp.317s–329s.
Kovacevic, R., Zhang, Y.M. and Ruan, S. (1995) ‘Sensing and control of weld pool geometry for automated GTA welding’, ASME Journal of Engineering for Industry, Vol. 117, No. 2, pp.210–222.
Lacroix, D., Jeandel, G. and Boudot, C. (1997) ‘Spectroscopic characterization of laser-induced plasma created during welding with a pulsed Nd:Yag laser’, Journal of Applied Physics, Vol. 81, pp.6599–6606.
Lee, D.H. and Kweon, I. (2000) ‘A novel stereo camera system by a biprism’, IEEE Transactions on Robotics and Automation, Vol. 16, No. 5, pp.528–541.
Luo, H., Devanathan, R., Wang, J., Chen, X. and Sun, Z. (2002) ‘Vision based neurofuzzy logic control of weld pool geometry’, Science and Technology of Welding and Joining, Vol. 7, No. 5, pp.321–325.
Marotta, A. (1994) ‘Determination of axial thermal plasma temperatures without Abel inversion’, Journal of Physics D: Applied Physics, Vol. 27, pp.268–272.
Mnich, C., Al-Bayat, F., Debrunner, C., Steele, J. and Vincent, T. (2004) ‘In situ weld pool measurement using stereovision’, Proceedings of the 2004 JUSFA, 2004 Japan-USA Symposium on Flexible Automation, 19–21 July, ASME.
Pietrzak, K.A. and Packer, S.M. (1991) ‘Coaxially vision based weld pool width control’, E. Kannatey-Asibu Jr., et al. (Eds). Welding and Joining Processes, pp.251–264, ASME.
Poueyo-Verwaerde, A., Fabbro, R., Deshors, G., Frutos, D. and Orza, P. (1993) ‘Experimental study of laser induced plasma in welding conditions with continuous CO2 laser’, Journal of Applied Physics, Vol. 74, pp.5773–5780.
Richardson, R.W. et al. (1984) ‘Coaxial arc weld pool viewing for process monitoring and control’, Welding Journal, Vol. 63, No. 3, pp.43–50.
Rockstroh, T.J. and Mazumder, J. (1987) ‘Spectroscopic studies of plasma during CW laser materials interaction’, Journal of Applied Physics, Vol. 61, pp.917–923.
Rokhlin, S.I. and Guu, A.C. (1993) ‘A study of arc force, pool depression, and weld penetration during gas tungsten arc welding’, Welding Journal, Vol. 72, No. 8, pp.381s–390s.
Saeed, G. and Zhang, Y.M. (2003) ‘Mathematical formulation and simulation of specular reflection based measurement system for gas tungsten arc weld pool surface’, Measurement Science and Technology, Vol. 14, No. 8, pp.1671–1682.
Saeed, G., Cook, S. and Zhang, Y. (2005a) ‘A compact sensor for welding process control’, Trends in Welding Conference, ASM International, Pine Mountain, GA, 16–20 May.
Saeed, G., Lou, M.J. and Zhang, Y.M. (2004) ‘Computation of 3D weld pool surface from the slope field and point tracking of laser beams’, Measurement Science and Technology, Vol. 15, No. 2, pp.389–403.
Saeed, G., et al. (2005b) ‘Weld pool surface monitoring and depth extraction using a calibrated CCD sensor’, Trends in Welding Conference, ASM International, Pine Mountain, GA, 16–20 May.
Sokolowski, W., Herziger, G. and Beyer, E. (1989) ‘Spectroscopic study of laser induced plasma in the welding process of steel and aluminium’, Proceedings of the SPIE, Vol. 1128, pp.328–335.
Sokolowski, W., Herziger, G. and Beyer, E. (1998) ‘Spectral plasma diagnostics in welding with CO2 lasers’, Proceedings of the SPIE, Vol. 1020, pp.96–102.
Szymanski, Z. and Kurzyna, J. (1994) ‘Spectroscopic measurement of laser induced plasma during welding with CO2 laser’, Journal of Applied Physics, Vol. 76, pp.7750–7756.
Wu, C.S., Gao, J.Q., Liu, X.F. and Zhao, Y.H. (2003) ‘Vision-based measurement of weld pool geometry in constant-current gas tungsten arc welding’, Proceedings of the Institution of Mechanical Engineers, Part B: Journal of Engineering Manufacture, Vol. 217.
Yoo, C.D. and Lee, J. (2004) ‘3D measurement of weld pool using biprism stereo vision sensor’, Available at: http:// joining1.kaist.ac.kr/research/vision.htm, Seoul National University.
Zhang, Y.M., Beardsley, H. and Kovacevic, R. (1994) ‘Real-time image processing for 3D measurement of weld pool surface’, Manufacturing Science and Engineering, PED-Vol. 68-1, pp.255–262, ASME.
Zhao, D.B., Yi, J.Q., Chen, S.B., Wu, L. and Chen, Q. (2003) ‘Extraction of three-dimensional parameters for weld pool surface in pulsed GTAW with wire filler’, ASME Journal of Manufacturing Science and Engineering, Vol. 125, pp.493–503.