Embed Size (px)
Citation preview
Vision
Monthly Economicand Financial Monitor
February 2019
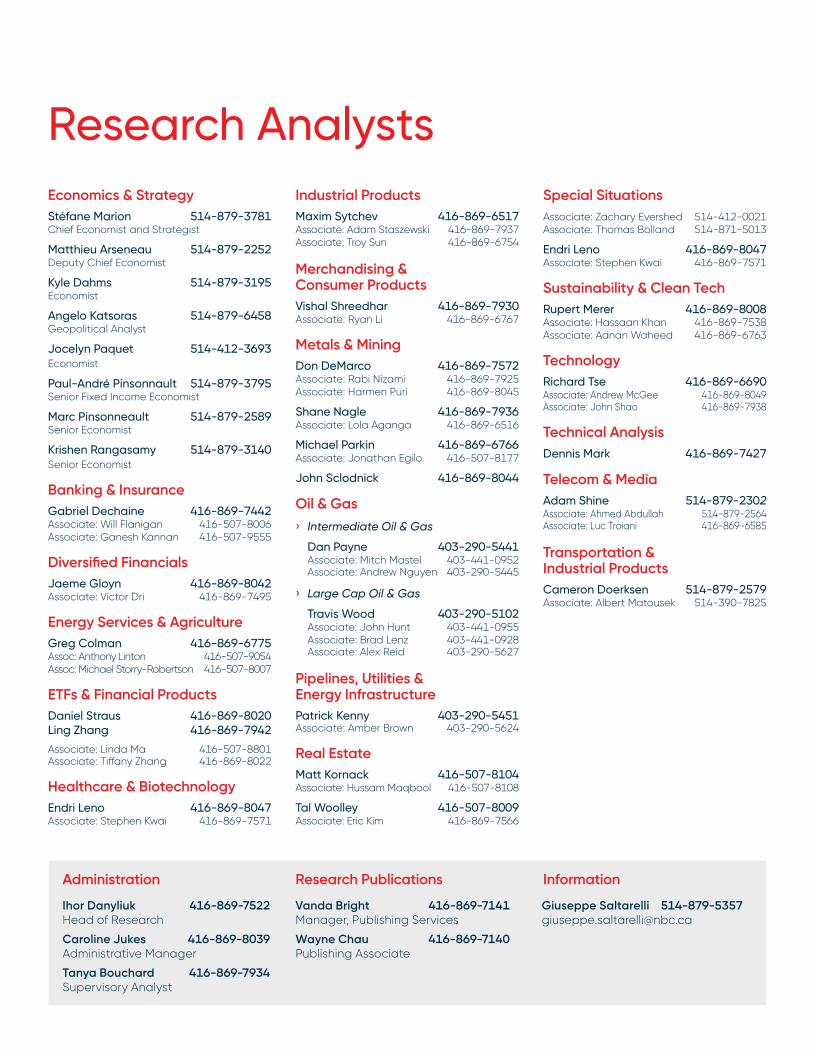
Research Analysts
Administration
Ihor Danyliuk 416-869-7522Head of Research
Caroline Jukes 416-869-8039Administrative Manager
Tanya Bouchard 416-869-7934Supervisory Analyst
Research Publications
Vanda Bright 416-869-7141Manager, Publishing Services
Wayne Chau 416-869-7140Publishing Associate
Information
Giuseppe Saltarelli 514-879-5357 [email protected]
Economics & Strategy Stéfane Marion 514-879-3781Chief Economist and Strategist
Matthieu Arseneau 514-879-2252Deputy Chief Economist
Kyle Dahms 514-879-3195Economist
Angelo Katsoras 514-879-6458Geopolitical Analyst
Jocelyn Paquet 514-412-3693Economist
Paul-André Pinsonnault 514-879-3795Senior Fixed Income Economist
Marc Pinsonneault 514-879-2589Senior Economist
Krishen Rangasamy 514-879-3140Senior Economist
Banking & InsuranceGabriel Dechaine 416-869-7442Associate: Will Flanigan 416-507-8006Associate: Ganesh Kannan 416-507-9555
Diversified FinancialsJaeme Gloyn 416-869-8042Associate: Victor Dri 416-869-7495
Energy Services & AgricultureGreg Colman 416-869-6775Assoc: Anthony Linton 416-507-9054Assoc: Michael Storry-Robertson 416-507-8007
ETFs & Financial Products Daniel Straus 416-869-8020Ling Zhang 416-869-7942
Associate: Linda Ma 416-507-8801Associate: Tiffany Zhang 416-869-8022
Healthcare & BiotechnologyEndri Leno 416-869-8047Associate: Stephen Kwai 416-869-7571
Industrial Products Maxim Sytchev 416-869-6517Associate: Adam Staszewski 416-869-7937Associate: Troy Sun 416-869-6754
Merchandising & Consumer ProductsVishal Shreedhar 416-869-7930Associate: Ryan Li 416-869-6767
Metals & MiningDon DeMarco 416-869-7572Associate: Rabi Nizami 416-869-7925Associate: Harmen Puri 416-869-8045
Shane Nagle 416-869-7936Associate: Lola Aganga 416-869-6516
Michael Parkin 416-869-6766Associate: Jonathan Egilo 416-507-8177
John Sclodnick 416-869-8044
Oil & Gas› Intermediate Oil & Gas
Dan Payne 403-290-5441 Associate: Mitch Mastel 403-441-0952 Associate: Andrew Nguyen 403-290-5445
› Large Cap Oil & Gas
Travis Wood 403-290-5102 Associate: John Hunt 403-441-0955 Associate: Brad Lenz 403-441-0928 Associate: Alex Reid 403-290-5627
Pipelines, Utilities & Energy InfrastructurePatrick Kenny 403-290-5451Associate: Amber Brown 403-290-5624
Real EstateMatt Kornack 416-507-8104Associate: Hussam Maqbool 416-507-8108
Tal Woolley 416-507-8009 Associate: Eric Kim 416-869-7566
Special SituationsAssociate: Zachary Evershed 514-412-0021Associate: Thomas Bolland 514-871-5013
Endri Leno 416-869-8047Associate: Stephen Kwai 416-869-7571
Sustainability & Clean Tech Rupert Merer 416-869-8008Associate: Hassaan Khan 416-869-7538Associate: Adnan Waheed 416-869-6763
Technology Richard Tse 416-869-6690Associate: Andrew McGee 416-869-8049Associate: John Shao 416-869-7938
Technical AnalysisDennis Mark 416-869-7427
Telecom & MediaAdam Shine 514-879-2302Associate: Ahmed Abdullah 514-879-2564Associate: Luc Troiani 416-869-6585
Transportation & Industrial ProductsCameron Doerksen 514-879-2579Associate: Albert Matousek 514-390-7825

Back to Research Analysts Page 03
Table of Contents
Highlights . . . . . . . . . . . . . . . . . . . . . . . . . . . . . . . . . . . . . . . . . . . . . . . . . . . . . . . . . . . . . . 04
The Economy . . . . . . . . . . . . . . . . . . . . . . . . . . . . . . . . . . . . . . . . . . . . . . . . . . . . . . . . . . . 06
Interest Rates and Bond Markets . . . . . . . . . . . . . . . . . . . . . . . . . . . . . . . . . . . . . . . . . 16
Stock Market and Portfolio Strategy . . . . . . . . . . . . . . . . . . . . . . . . . . . . . . . . . . . . . . 21
Technical Analysis . . . . . . . . . . . . . . . . . . . . . . . . . . . . . . . . . . . . . . . . . . . . . . . . . . . . . . . 29
Sector Analysis . . . . . . . . . . . . . . . . . . . . . . . . . . . . . . . . . . . . . . . . . . . . . . . . . . . . . . . . . 36
› NBF Selection List . . . . . . . . . . . . . . . . . . . . . . . . . . . . . . . . . . . . . . . . . . . . . . . . . . . . . . . . 37
› Analysts' Tables Glossary . . . . . . . . . . . . . . . . . . . . . . . . . . . . . . . . . . . . . . . . . . . . . . . . . 38
› Analyst Recommendations . . . . . . . . . . . . . . . . . . . . . . . . . . . . . . . . . . . . . . . . . . . . . . 39
› Alphabetical Listing . . . . . . . . . . . . . . . . . . . . . . . . . . . . . . . . . . . . . . . . . . . . . . . . . . . . . . 61
NBF Disclosures, please visit URL: http://www .nbcn .ca/contactus/disclosures .html
VISION FEBRUARY 2019 Back to Research Analysts Page 04
Economy› With China and the Eurozone seemingly on the ropes, it’s difficult to
be optimistic about the global economy’s performance this year. Fortunately, the persistence of low inflation should allow major central banks to keep monetary policy accommodative while some governments, including China’s, also have room to dispatch fiscal stimulus should downside risks to growth materialize.
› While last month`s government shutdown will temporarily restrain Q1 output, we are leaving our 2019 forecast for U.S. GDP growth unchanged at 2.3% expecting a subsequent rebound. Concerns about a trade war, a slowing housing market and the possibility of an inverted yield curve should keep the Federal Reserve in pause mode for a while.
› Canada’s economy is decelerating in synch with a softening housing market and related fading wealth effects which are curtailing consumption spending, the latter already under pressure from rising interest rates and a low household savings rate. Barring fiscal relief from the federal government in 2019, consumption growth is on track for its worst year in a decade.
Interest rates and currency› In late January Fed chair Jerome Powell basically acknowledged
that unresolved government policy issues, ranging from ongoing trade negotiations and uncertainty about how long the government will avoid another shutdown, meant that he could not have strong conviction about the U.S. economic outlook. Neither can we. Much will depend on how politicians play their cards in coming weeks and months. We are optimistic as we wait for time to tell. In the meantime, we are leaving our interest-rate forecasts unchanged from last month. We continue to see one Fed rate hike in September and the 10-year Treasury yield ending the year around 3.34%. If U.S. economic growth turns out softer – say closer to 1.5% than to our base case scenario of 2.3% – then 10-year Treasuries could easily end the year closer to 2.25% or lower.
› Like the Bank of Canada, we project an acceleration of the Canadian economy after a weak first quarter. Assuming that the spot price of West Texas Intermediate crude ends the year at about US$63 and that trade tensions ease, we continue to see GDP growth of 1.8% in 2019 and headline inflation averaging 1.7% but returning to 2% by late 2019. We accordingly keep our interest-rate forecast unchanged: two BoC hikes and 10-year Canadas trading at 2.67% by year end. As with our U.S. forecast, our conviction about that outlook is less than strong.
› Amid a backdrop of decelerating domestic demand, there’s arguably little need for an aggressive monetary policy stance from the Bank of Canada. That’s not to say the Canadian dollar will necessarily struggle this year. The influence of Canada-U.S. interest rate spreads on the loonie is waning, in sharp contrast with oil which is now reasserting itself as the main driver of the Canadian currency. If we’re right about further increases for WTI oil and unimpeded global trade flows, USDCAD could move closer to our mid-year target of 1.27.
Recommended asset mix and stock market› Global equity markets rebounded smartly in January. The
7.1% jump of the MSCI ACWI was the biggest monthly increase since October 2015. Deteriorating earnings expectations have combined with a stock market rebound to push the MSCI ACWI forward P/E back up to 14 from a December 24 low of 12.4. In other words, the rise of equity indexes in recent weeks is due entirely to P/E expansion. So what’s fuelling the current optimism of equity markets? Dovish central banks and expectations of a trade deal between the U.S. and China.
› U.S. equity markets, after anticipating a major economic slowdown just a few weeks ago, are rebounding on the back of better-than-expected economic data. This is not to say GDP growth won’t slow in 2019 – we expect 1.9% Q4/Q4, down from 3.1% in 2018 – but we don’t see a contraction. With earnings showing signs of stabilizing, companies are less likely to cut back on investment and headcounts. That is key to keeping the economic expansion going. At this writing, the bottom-up consensus of equity analysts expects S&P 500 earnings per share to grow 5.7% in 2019. This estimate is in line with that for sales growth, implying no profit-margin expansion in 2019 (as we have been forecasting for the past few months). We find these expectations to be reasonable, especially in a time of USD depreciation.
› After a dismal performance in 2018, the S&P/TSX surged more than 8% in January, the best beginning of a year in 32 years. As we go to press, the S&P/TSX is trading at about 13.7 times forward earnings, up from less than 12 on December 24, 2018. That’s a 14% increase! In fact it was the largest P/E expansion among global regions so far in 2019.
› The recent surge has left the S&P/TSX closing in on our target and a consensus outlook of EPS growth exceeding ours (9.6% vs. 6%). With upside less compelling, we are scaling back our S&P/TSX position, while keeping it slightly overweight because of our currency forecast of 1.27CAD/USD. We recommend using some of the proceeds from this trade to reduce our underweighting of the S&P 500 (where EPS and sales growth are now better aligned). We are also raising our cash recommendation to slightly overweight as we await confirmation of a U.S.-China trade truce/deal that will avert the imposition of new tariffs on March 1.
Highlights
Stéfane Marion Chief Economist and Strategist 514-879-3781
VISION FEBRUARY 2019 Back to Research Analysts Page 05
Highlights
Benchmark (%)
NBF Recommendation (%)
Change (pp)
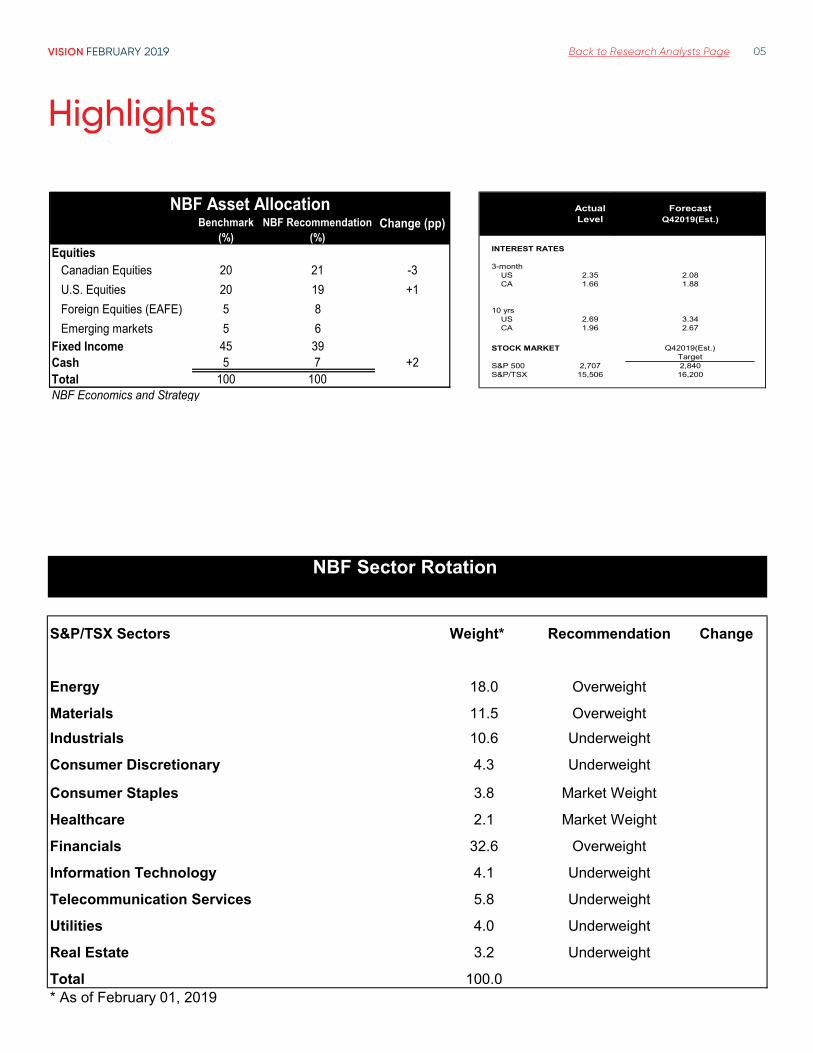
EquitiesCanadian Equities 20 21 -3U.S. Equities 20 19 +1Foreign Equities (EAFE) 5 8Emerging markets 5 6
Fixed Income 45 39Cash 5 7 +2Total 100 100NBF Economics and Strategy
NBF Asset Allocation Actual ForecastLevel Q42019(Est.)
INTEREST RATES
3-month US 2.35 2.08 CA 1.66 1.88
10 yrs US 2.69 3.34 CA 1.96 2.67
STOCK MARKET Q42019(Est.)Target
S&P 500 2,707 2,840S&P/TSX 15,506 16,200
S&P/TSX Sectors Weight* Recommendation Change
Energy 18.0 Overweight
Materials 11.5 OverweightIndustrials 10.6 Underweight
Consumer Discretionary 4.3 Underweight
Consumer Staples 3.8 Market Weight
Healthcare 2.1 Market Weight
Financials 32.6 Overweight
Information Technology 4.1 Underweight
Telecommunication Services 5.8 Underweight
Utilities 4.0 Underweight
Real Estate 3.2 Underweight
Total 100.0* As of February 01, 2019
NBF Sector Rotation
VISION FEBRUARY 2019 Back to Research Analysts Page 06
The Economy
VISION FEBRUARY 2019 Back to Research Analysts Page 07
The Economy
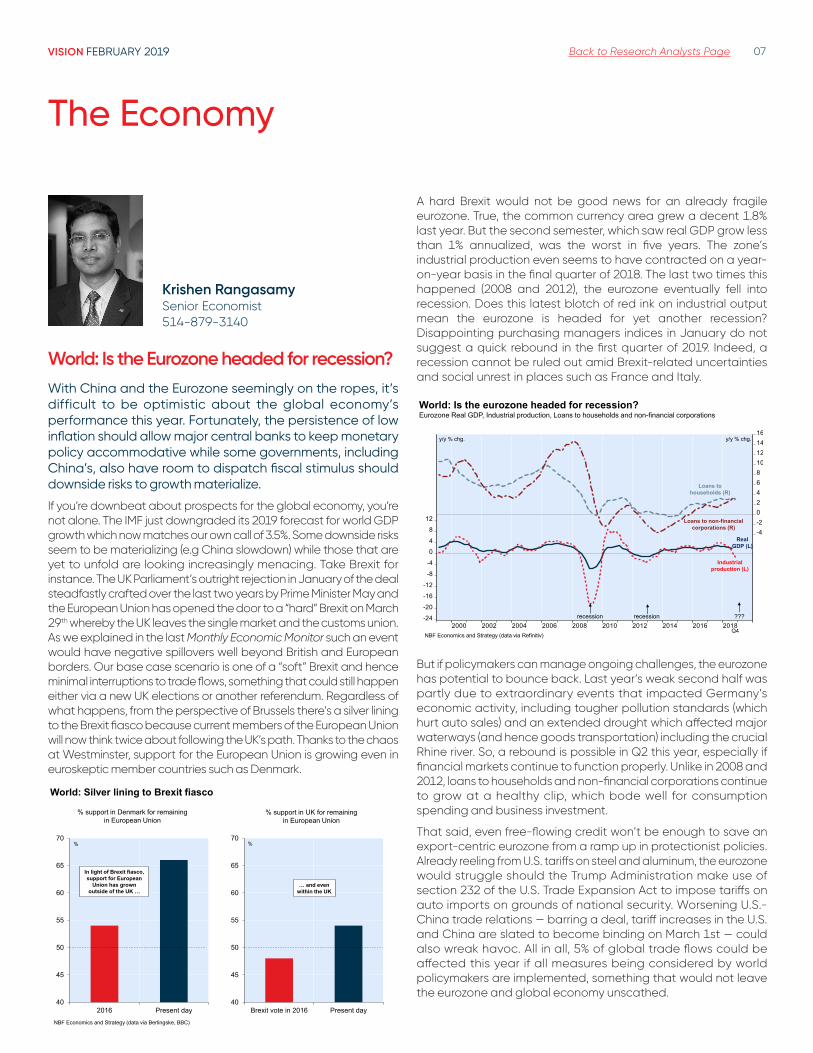
Krishen Rangasamy Senior Economist 514-879-3140
World: Is the Eurozone headed for recession?With China and the Eurozone seemingly on the ropes, it’s difficult to be optimistic about the global economy’s performance this year. Fortunately, the persistence of low inflation should allow major central banks to keep monetary policy accommodative while some governments, including China’s, also have room to dispatch fiscal stimulus should downside risks to growth materialize.
If you’re downbeat about prospects for the global economy, you’re not alone. The IMF just downgraded its 2019 forecast for world GDP growth which now matches our own call of 3.5%. Some downside risks seem to be materializing (e.g China slowdown) while those that are yet to unfold are looking increasingly menacing. Take Brexit for instance. The UK Parliament’s outright rejection in January of the deal steadfastly crafted over the last two years by Prime Minister May and the European Union has opened the door to a “hard” Brexit on March 29th whereby the UK leaves the single market and the customs union. As we explained in the last Monthly Economic Monitor such an event would have negative spillovers well beyond British and European borders. Our base case scenario is one of a “soft” Brexit and hence minimal interruptions to trade flows, something that could still happen either via a new UK elections or another referendum. Regardless of what happens, from the perspective of Brussels there’s a silver lining to the Brexit fiasco because current members of the European Union will now think twice about following the UK’s path. Thanks to the chaos at Westminster, support for the European Union is growing even in euroskeptic member countries such as Denmark.
40
45
50
55
60
65
70
2016 Present day40
45
50
55
60
65
70
Brexit vote in 2016 Present day
World: Silver lining to Brexit fiasco
%
NBF Economics and Strategy (data via Berlingske, BBC)
% support in Denmark for remaining in European Union
% support in UK for remaining in European Union
In light of Brexit fiasco, support for European
Union has grown outside of the UK …
… and even within the UK
%
A hard Brexit would not be good news for an already fragile eurozone. True, the common currency area grew a decent 1.8% last year. But the second semester, which saw real GDP grow less than 1% annualized, was the worst in five years. The zone’s industrial production even seems to have contracted on a year-on-year basis in the final quarter of 2018. The last two times this happened (2008 and 2012), the eurozone eventually fell into recession. Does this latest blotch of red ink on industrial output mean the eurozone is headed for yet another recession? Disappointing purchasing managers indices in January do not suggest a quick rebound in the first quarter of 2019. Indeed, a recession cannot be ruled out amid Brexit-related uncertainties and social unrest in places such as France and Italy.
-24
-20
-16
-12
-8
-4
0
4
8
12
-4-20246810121416
2000 2002 2004 2006 2008 2010 2012 2014 2016 2018NBF Economics and Strategy (data via Refinitiv)
World: Is the eurozone headed for recession?Eurozone Real GDP, Industrial production, Loans to households and non-financial corporations
Real GDP (L)
Industrial production (L)
y/y % chg.
Q4
y/y % chg.
Loans to non-financialcorporations (R)
Loans to households (R)
recession recession ???
But if policymakers can manage ongoing challenges, the eurozone has potential to bounce back. Last year’s weak second half was partly due to extraordinary events that impacted Germany’s economic activity, including tougher pollution standards (which hurt auto sales) and an extended drought which affected major waterways (and hence goods transportation) including the crucial Rhine river. So, a rebound is possible in Q2 this year, especially if financial markets continue to function properly. Unlike in 2008 and 2012, loans to households and non-financial corporations continue to grow at a healthy clip, which bode well for consumption spending and business investment.
That said, even free-flowing credit won’t be enough to save an export-centric eurozone from a ramp up in protectionist policies. Already reeling from U.S. tariffs on steel and aluminum, the eurozone would struggle should the Trump Administration make use of section 232 of the U.S. Trade Expansion Act to impose tariffs on auto imports on grounds of national security. Worsening U.S.-China trade relations — barring a deal, tariff increases in the U.S. and China are slated to become binding on March 1st — could also wreak havoc. All in all, 5% of global trade flows could be affected this year if all measures being considered by world policymakers are implemented, something that would not leave the eurozone and global economy unscathed.
VISION FEBRUARY 2019 Back to Research Analysts Page 08
0.0
0.5
1.0
1.5
2.0
2.5
3.0
3.5
4.0
4.5
5.0
5.5
6.0
2018q1 2018q2 2018q3 2018q4 2019q1 2019q2 2019q3 2019q4NBF Economics and Strategy (data via World Bank)
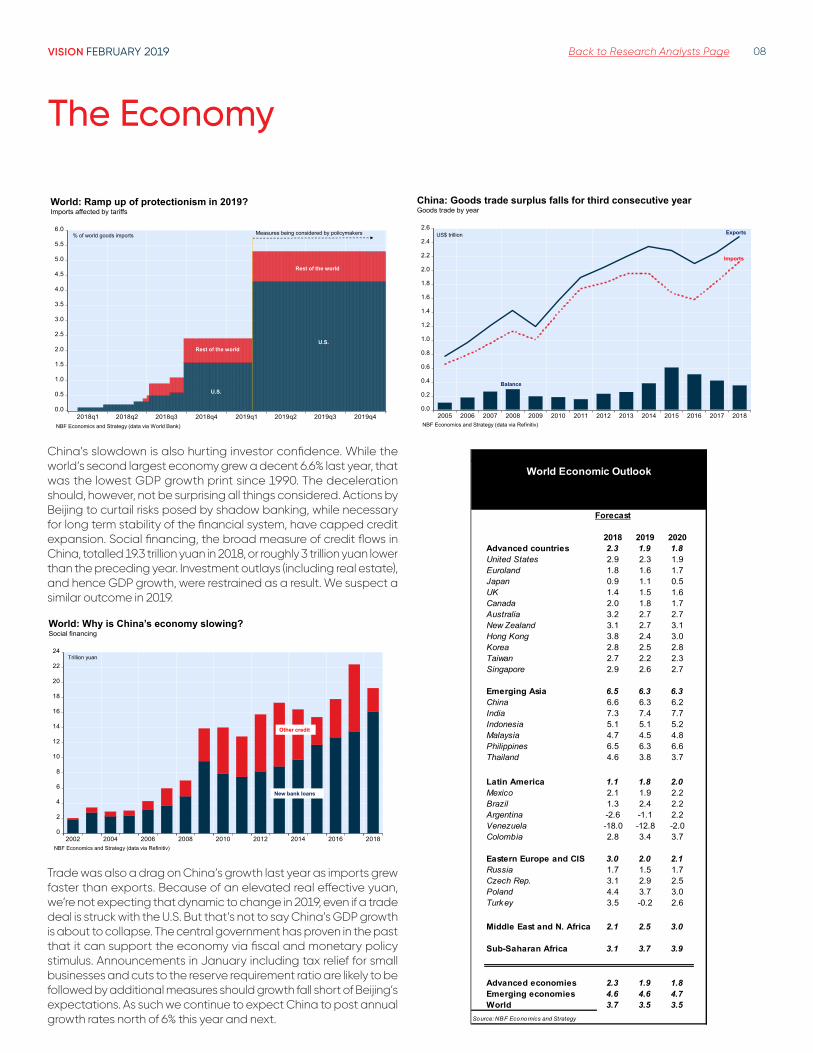
World: Ramp up of protectionism in 2019?Imports affected by tariffs
U.S.
Rest of the world
% of world goods imports Measures being considered by policymakers
Rest of the world
U.S.
China’s slowdown is also hurting investor confidence. While the world’s second largest economy grew a decent 6.6% last year, that was the lowest GDP growth print since 1990. The deceleration should, however, not be surprising all things considered. Actions by Beijing to curtail risks posed by shadow banking, while necessary for long term stability of the financial system, have capped credit expansion. Social financing, the broad measure of credit flows in China, totalled 19.3 trillion yuan in 2018, or roughly 3 trillion yuan lower than the preceding year. Investment outlays (including real estate), and hence GDP growth, were restrained as a result. We suspect a similar outcome in 2019.
0
2
4
6
8
10
12
14
16
18
20
22
24
2002 2004 2006 2008 2010 2012 2014 2016 2018NBF Economics and Strategy (data via Refinitiv)
World: Why is China’s economy slowing?Social financing
New bank loans
Other credit
Trillion yuan
Trade was also a drag on China’s growth last year as imports grew faster than exports. Because of an elevated real effective yuan, we’re not expecting that dynamic to change in 2019, even if a trade deal is struck with the U.S. But that’s not to say China’s GDP growth is about to collapse. The central government has proven in the past that it can support the economy via fiscal and monetary policy stimulus. Announcements in January including tax relief for small businesses and cuts to the reserve requirement ratio are likely to be followed by additional measures should growth fall short of Beijing’s expectations. As such we continue to expect China to post annual growth rates north of 6% this year and next.
0.0
0.2
0.4
0.6
0.8
1.0
1.2
1.4
1.6
1.8
2.0
2.2
2.4
2.6
2005 2006 2007 2008 2009 2010 2011 2012 2013 2014 2015 2016 2017 2018NBF Economics and Strategy (data via Refinitiv)
China: Goods trade surplus falls for third consecutive yearGoods trade by year
Exports
Imports
US$ trillion
Balance
World Economic Outlook
Forecast
2018 2019 2020Advanced countries 2.3 1.9 1.8United States 2.9 2.3 1.9Euroland 1.8 1.6 1.7Japan 0.9 1.1 0.5UK 1.4 1.5 1.6Canada 2.0 1.8 1.7Australia 3.2 2.7 2.7New Zealand 3.1 2.7 3.1Hong Kong 3.8 2.4 3.0Korea 2.8 2.5 2.8Taiwan 2.7 2.2 2.3Singapore 2.9 2.6 2.7
Emerging Asia 6.5 6.3 6.3China 6.6 6.3 6.2India 7.3 7.4 7.7Indonesia 5.1 5.1 5.2Malaysia 4.7 4.5 4.8Philippines 6.5 6.3 6.6Thailand 4.6 3.8 3.7
Latin America 1.1 1.8 2.0Mexico 2.1 1.9 2.2Brazil 1.3 2.4 2.2Argentina -2.6 -1.1 2.2Venezuela -18.0 -12.8 -2.0Colombia 2.8 3.4 3.7
Eastern Europe and CIS 3.0 2.0 2.1Russia 1.7 1.5 1.7Czech Rep. 3.1 2.9 2.5Poland 4.4 3.7 3.0Turkey 3.5 -0.2 2.6
Middle East and N. Africa 2.1 2.5 3.0
Sub-Saharan Africa 3.1 3.7 3.9
Advanced economies 2.3 1.9 1.8Emerging economies 4.6 4.6 4.7World 3.7 3.5 3.5
Source: NBF Economics and Strategy
The Economy
VISION FEBRUARY 2019 Back to Research Analysts Page 09
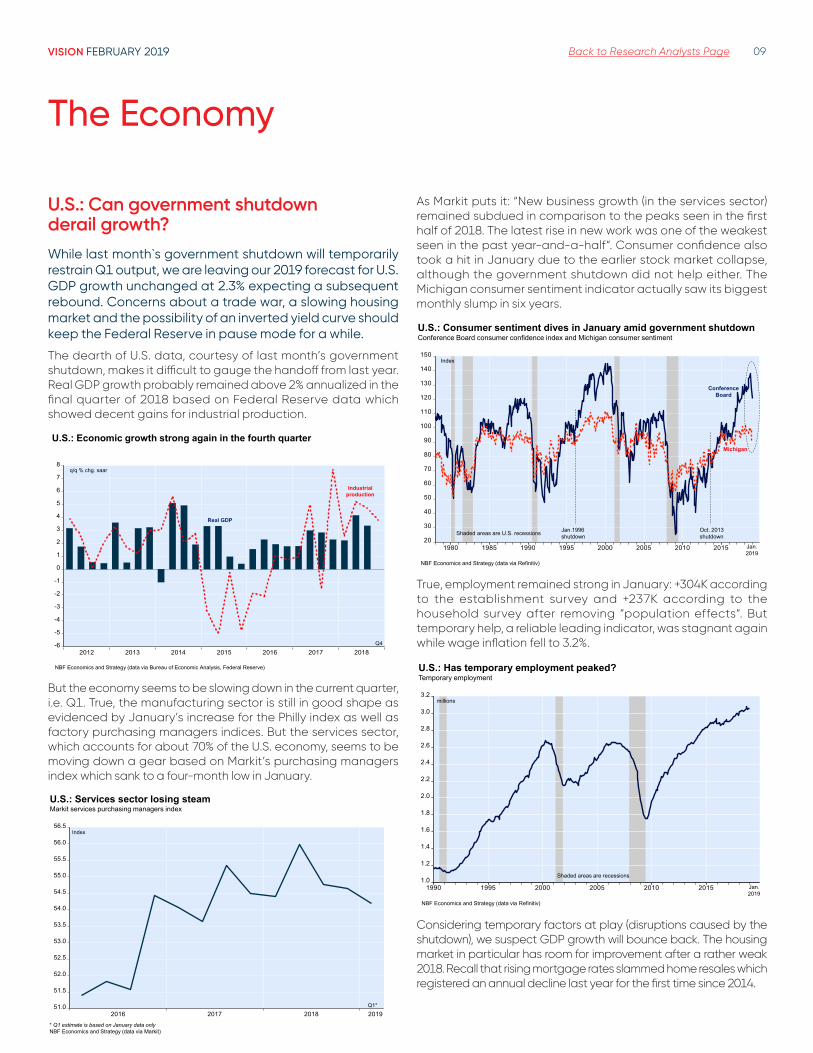
U .S .: Can government shutdown derail growth?While last month`s government shutdown will temporarily restrain Q1 output, we are leaving our 2019 forecast for U.S. GDP growth unchanged at 2.3% expecting a subsequent rebound. Concerns about a trade war, a slowing housing market and the possibility of an inverted yield curve should keep the Federal Reserve in pause mode for a while.
The dearth of U.S. data, courtesy of last month’s government shutdown, makes it difficult to gauge the handoff from last year. Real GDP growth probably remained above 2% annualized in the final quarter of 2018 based on Federal Reserve data which showed decent gains for industrial production.
-6
-5
-4
-3
-2
-1
0
1
2
3
4
5
6
7
8
2012 2013 2014 2015 2016 2017 2018
U.S.: Economic growth strong again in the fourth quarter
NBF Economics and Strategy (data via Bureau of Economic Analysis, Federal Reserve)
q/q % chg. saar
Industrial production
Real GDP
Q4
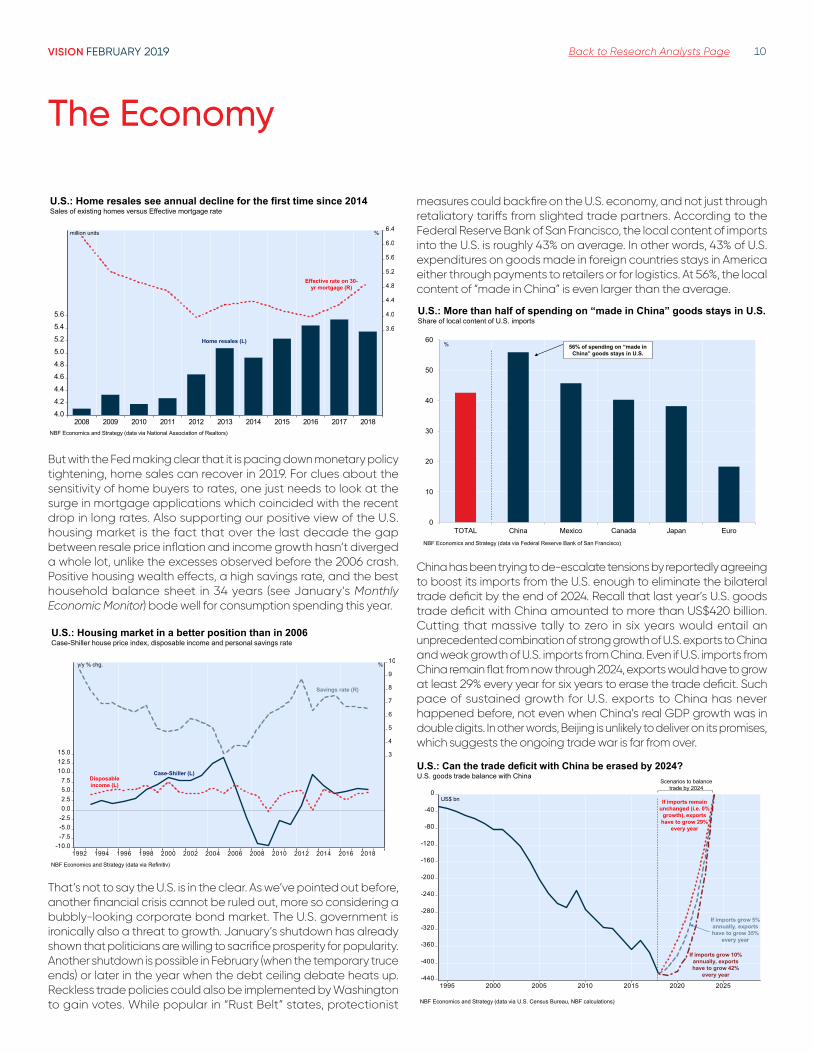
But the economy seems to be slowing down in the current quarter, i.e. Q1. True, the manufacturing sector is still in good shape as evidenced by January’s increase for the Philly index as well as factory purchasing managers indices. But the services sector, which accounts for about 70% of the U.S. economy, seems to be moving down a gear based on Markit’s purchasing managers index which sank to a four-month low in January.
51.0
51.5
52.0
52.5
53.0
53.5
54.0
54.5
55.0
55.5
56.0
56.5
2016 2017 2018 2019
U.S.: Services sector losing steamMarkit services purchasing managers index
* Q1 estimate is based on January data only NBF Economics and Strategy (data via Markit)
Index
Q1*
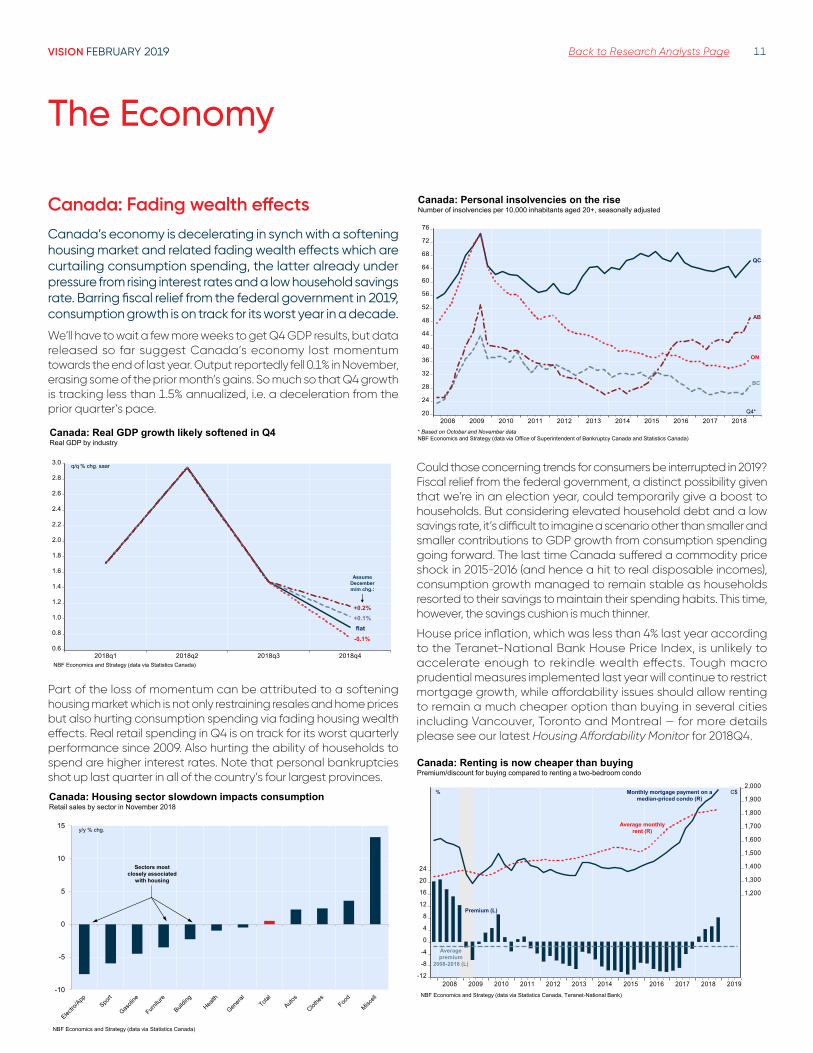
As Markit puts it: “New business growth (in the services sector) remained subdued in comparison to the peaks seen in the first half of 2018. The latest rise in new work was one of the weakest seen in the past year-and-a-half“. Consumer confidence also took a hit in January due to the earlier stock market collapse, although the government shutdown did not help either. The Michigan consumer sentiment indicator actually saw its biggest monthly slump in six years.
20
30
40
50
60
70
80
90
100
110
120
130
140
150
1980 1985 1990 1995 2000 2005 2010 2015
NBF Economics and Strategy (data via Refinitiv)
Index
Jan. 2019
U.S.: Consumer sentiment dives in January amid government shutdown Conference Board consumer confidence index and Michigan consumer sentiment
Shaded areas are U.S. recessions Oct. 2013 shutdown
Jan.1996shutdown
Michigan
Conference Board
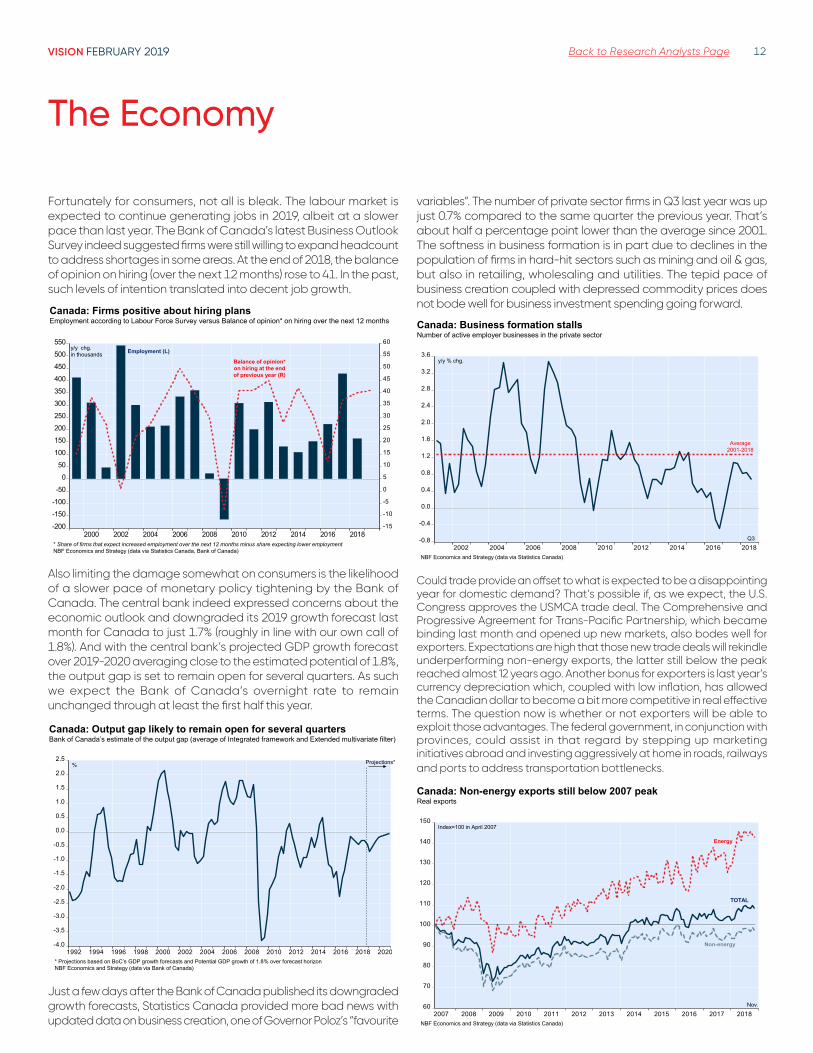
True, employment remained strong in January: +304K according to the establishment survey and +237K according to the household survey after removing “population effects“. But temporary help, a reliable leading indicator, was stagnant again while wage inflation fell to 3.2%.
1.0
1.2
1.4
1.6
1.8
2.0
2.2
2.4
2.6
2.8
3.0
3.2
1990 1995 2000 2005 2010 2015
U.S.: Has temporary employment peaked?Temporary employment
NBF Economics and Strategy (data via Refinitiv)
millions
Shaded areas are recessions
Jan. 2019
Considering temporary factors at play (disruptions caused by the shutdown), we suspect GDP growth will bounce back. The housing market in particular has room for improvement after a rather weak 2018. Recall that rising mortgage rates slammed home resales which registered an annual decline last year for the first time since 2014.
The Economy
VISION FEBRUARY 2019 Back to Research Analysts Page 10
4.04.24.4
4.64.85.0
5.25.45.6
3.6
4.0
4.4
4.8
5.2
5.6
6.0
6.4
2008 2009 2010 2011 2012 2013 2014 2015 2016 2017 2018
U.S.: Home resales see annual decline for the first time since 2014Sales of existing homes versus Effective mortgage rate
Home resales (L)
Effective rate on 30-yr mortgage (R)
NBF Economics and Strategy (data via National Association of Realtors)
million units %
But with the Fed making clear that it is pacing down monetary policy tightening, home sales can recover in 2019. For clues about the sensitivity of home buyers to rates, one just needs to look at the surge in mortgage applications which coincided with the recent drop in long rates. Also supporting our positive view of the U.S. housing market is the fact that over the last decade the gap between resale price inflation and income growth hasn’t diverged a whole lot, unlike the excesses observed before the 2006 crash. Positive housing wealth effects, a high savings rate, and the best household balance sheet in 34 years (see January’s Monthly Economic Monitor) bode well for consumption spending this year.
-10.0-7.5-5.0-2.50.02.55.07.5
10.012.515.0 3
4
5
6
7
8
9
10
1992 1994 1996 1998 2000 2002 2004 2006 2008 2010 2012 2014 2016 2018
U.S.: Housing market in a better position than in 2006 Case-Shiller house price index, disposable income and personal savings rate
Case-Shiller (L)Disposable income (L)
NBF Economics and Strategy (data via Refinitiv)
y/y % chg. %
Savings rate (R)
That’s not to say the U.S. is in the clear. As we’ve pointed out before, another financial crisis cannot be ruled out, more so considering a bubbly-looking corporate bond market. The U.S. government is ironically also a threat to growth. January’s shutdown has already shown that politicians are willing to sacrifice prosperity for popularity. Another shutdown is possible in February (when the temporary truce ends) or later in the year when the debt ceiling debate heats up. Reckless trade policies could also be implemented by Washington to gain votes. While popular in “Rust Belt” states, protectionist
measures could backfire on the U.S. economy, and not just through retaliatory tariffs from slighted trade partners. According to the Federal Reserve Bank of San Francisco, the local content of imports into the U.S. is roughly 43% on average. In other words, 43% of U.S. expenditures on goods made in foreign countries stays in America either through payments to retailers or for logistics. At 56%, the local content of “made in China” is even larger than the average.
0
10
20
30
40
50
60
TOTAL China Mexico Canada Japan Euro
U.S.: More than half of spending on “made in China” goods stays in U.S.Share of local content of U.S. imports
%
NBF Economics and Strategy (data via Federal Reserve Bank of San Francisco)
56% of spending on “made in China” goods stays in U.S.
China has been trying to de-escalate tensions by reportedly agreeing to boost its imports from the U.S. enough to eliminate the bilateral trade deficit by the end of 2024. Recall that last year’s U.S. goods trade deficit with China amounted to more than US$420 billion. Cutting that massive tally to zero in six years would entail an unprecedented combination of strong growth of U.S. exports to China and weak growth of U.S. imports from China. Even if U.S. imports from China remain flat from now through 2024, exports would have to grow at least 29% every year for six years to erase the trade deficit. Such pace of sustained growth for U.S. exports to China has never happened before, not even when China’s real GDP growth was in double digits. In other words, Beijing is unlikely to deliver on its promises, which suggests the ongoing trade war is far from over.
-440
-400
-360
-320
-280
-240
-200
-160
-120
-80
-40
0
1995 2000 2005 2010 2015 2020 2025
U.S.: Can the trade deficit with China be erased by 2024? U.S. goods trade balance with China
NBF Economics and Strategy (data via U.S. Census Bureau, NBF calculations)
US$ bn If imports remain unchanged (i.e. 0%
growth), exports have to grow 29%
every year
If imports grow 10% annually, exports have to grow 42%
every year
Scenarios to balance trade by 2024
If imports grow 5% annually, exports have to grow 35%
every year
The Economy
VISION FEBRUARY 2019 Back to Research Analysts Page 11
Canada: Fading wealth effectsCanada’s economy is decelerating in synch with a softening housing market and related fading wealth effects which are curtailing consumption spending, the latter already under pressure from rising interest rates and a low household savings rate. Barring fiscal relief from the federal government in 2019, consumption growth is on track for its worst year in a decade.
We’ll have to wait a few more weeks to get Q4 GDP results, but data released so far suggest Canada’s economy lost momentum towards the end of last year. Output reportedly fell 0.1% in November, erasing some of the prior month’s gains. So much so that Q4 growth is tracking less than 1.5% annualized, i.e. a deceleration from the prior quarter’s pace.
0.6
0.8
1.0
1.2
1.4
1.6
1.8
2.0
2.2
2.4
2.6
2.8
3.0
2018q1 2018q2 2018q3 2018q4
Canada: Real GDP growth likely softened in Q4Real GDP by industry
q/q % chg. saar
NBF Economics and Strategy (data via Statistics Canada)
-0.1%
+0.1%flat
Assume December m/m chg.:
+0.2%
Part of the loss of momentum can be attributed to a softening housing market which is not only restraining resales and home prices but also hurting consumption spending via fading housing wealth effects. Real retail spending in Q4 is on track for its worst quarterly performance since 2009. Also hurting the ability of households to spend are higher interest rates. Note that personal bankruptcies shot up last quarter in all of the country’s four largest provinces.
-10
-5
0
5
10
15
Canada: Housing sector slowdown impacts consumptionRetail sales by sector in November 2018
y/y % chg.
NBF Economics and Strategy (data via Statistics Canada)
Sectors most closely associated
with housing
20
24
28
32
36
40
44
48
52
56
60
64
68
72
76
2008 2009 2010 2011 2012 2013 2014 2015 2016 2017 2018
Canada: Personal insolvencies on the riseNumber of insolvencies per 10,000 inhabitants aged 20+, seasonally adjusted
QC
ON
Q4*
AB
BC
* Based on October and November data NBF Economics and Strategy (data via Office of Superintendent of Bankruptcy Canada and Statistics Canada)
Could those concerning trends for consumers be interrupted in 2019? Fiscal relief from the federal government, a distinct possibility given that we’re in an election year, could temporarily give a boost to households. But considering elevated household debt and a low savings rate, it’s difficult to imagine a scenario other than smaller and smaller contributions to GDP growth from consumption spending going forward. The last time Canada suffered a commodity price shock in 2015-2016 (and hence a hit to real disposable incomes), consumption growth managed to remain stable as households resorted to their savings to maintain their spending habits. This time, however, the savings cushion is much thinner.
House price inflation, which was less than 4% last year according to the Teranet-National Bank House Price Index, is unlikely to accelerate enough to rekindle wealth effects. Tough macro prudential measures implemented last year will continue to restrict mortgage growth, while affordability issues should allow renting to remain a much cheaper option than buying in several cities including Vancouver, Toronto and Montreal — for more details please see our latest Housing Affordability Monitor for 2018Q4.
-12
-8
-4
0
4
8
12
16
20
24
1,200
1,300
1,400
1,500
1,600
1,700
1,800
1,900
2,000
2008 2009 2010 2011 2012 2013 2014 2015 2016 2017 2018 2019
Canada: Renting is now cheaper than buyingPremium/discount for buying compared to renting a two-bedroom condo
NBF Economics and Strategy (data via Statistics Canada, Teranet-National Bank)
C$Monthly mortgage payment on a median-priced condo (R)
Average monthlyrent (R)
Premium (L)
Averagepremium
2008-2018 (L)
%
The Economy
VISION FEBRUARY 2019 Back to Research Analysts Page 12
Fortunately for consumers, not all is bleak. The labour market is expected to continue generating jobs in 2019, albeit at a slower pace than last year. The Bank of Canada’s latest Business Outlook Survey indeed suggested firms were still willing to expand headcount to address shortages in some areas. At the end of 2018, the balance of opinion on hiring (over the next 12 months) rose to 41. In the past, such levels of intention translated into decent job growth.
-200-150-100-50
050
100150200250300350400450500550
-15
-10
-5
0
5
10
15
20
25
30
35
40
45
50
55
60
2000 2002 2004 2006 2008 2010 2012 2014 2016 2018
Canada: Firms positive about hiring plans Employment according to Labour Force Survey versus Balance of opinion* on hiring over the next 12 months
* Share of firms that expect increased employment over the next 12 months minus share expecting lower employment NBF Economics and Strategy (data via Statistics Canada, Bank of Canada)
y/y chg. in thousands Employment (L)
Balance of opinion* on hiring at the end of previous year (R)
Also limiting the damage somewhat on consumers is the likelihood of a slower pace of monetary policy tightening by the Bank of Canada. The central bank indeed expressed concerns about the economic outlook and downgraded its 2019 growth forecast last month for Canada to just 1.7% (roughly in line with our own call of 1.8%). And with the central bank’s projected GDP growth forecast over 2019-2020 averaging close to the estimated potential of 1.8%, the output gap is set to remain open for several quarters. As such we expect the Bank of Canada’s overnight rate to remain unchanged through at least the first half this year.
-4.0
-3.5
-3.0
-2.5
-2.0
-1.5
-1.0
-0.5
0.0
0.5
1.0
1.5
2.0
2.5
1992 1994 1996 1998 2000 2002 2004 2006 2008 2010 2012 2014 2016 2018 2020
Canada: Output gap likely to remain open for several quarters Bank of Canada’s estimate of the output gap (average of Integrated framework and Extended multivariate filter)
* Projections based on BoC’s GDP growth forecasts and Potential GDP growth of 1.8% over forecast horizon NBF Economics and Strategy (data via Bank of Canada)
% Projections*
Just a few days after the Bank of Canada published its downgraded growth forecasts, Statistics Canada provided more bad news with updated data on business creation, one of Governor Poloz’s “favourite
variables”. The number of private sector firms in Q3 last year was up just 0.7% compared to the same quarter the previous year. That’s about half a percentage point lower than the average since 2001. The softness in business formation is in part due to declines in the population of firms in hard-hit sectors such as mining and oil & gas, but also in retailing, wholesaling and utilities. The tepid pace of business creation coupled with depressed commodity prices does not bode well for business investment spending going forward.
-0.8
-0.4
0.0
0.4
0.8
1.2
1.6
2.0
2.4
2.8
3.2
3.6
2002 2004 2006 2008 2010 2012 2014 2016 2018
Canada: Business formation stalls Number of active employer businesses in the private sector
NBF Economics and Strategy (data via Statistics Canada)
y/y % chg.
Q3
Average2001-2018
Could trade provide an offset to what is expected to be a disappointing year for domestic demand? That’s possible if, as we expect, the U.S. Congress approves the USMCA trade deal. The Comprehensive and Progressive Agreement for Trans-Pacific Partnership, which became binding last month and opened up new markets, also bodes well for exporters. Expectations are high that those new trade deals will rekindle underperforming non-energy exports, the latter still below the peak reached almost 12 years ago. Another bonus for exporters is last year’s currency depreciation which, coupled with low inflation, has allowed the Canadian dollar to become a bit more competitive in real effective terms. The question now is whether or not exporters will be able to exploit those advantages. The federal government, in conjunction with provinces, could assist in that regard by stepping up marketing initiatives abroad and investing aggressively at home in roads, railways and ports to address transportation bottlenecks.
60
70
80
90
100
110
120
130
140
150
2007 2008 2009 2010 2011 2012 2013 2014 2015 2016 2017 2018
Canada: Non-energy exports still below 2007 peak Real exports
NBF Economics and Strategy (data via Statistics Canada)
Index=100 in April 2007
Nov.
Energy
TOTAL
Non-energy
The Economy
VISION FEBRUARY 2019 Back to Research Analysts Page 13
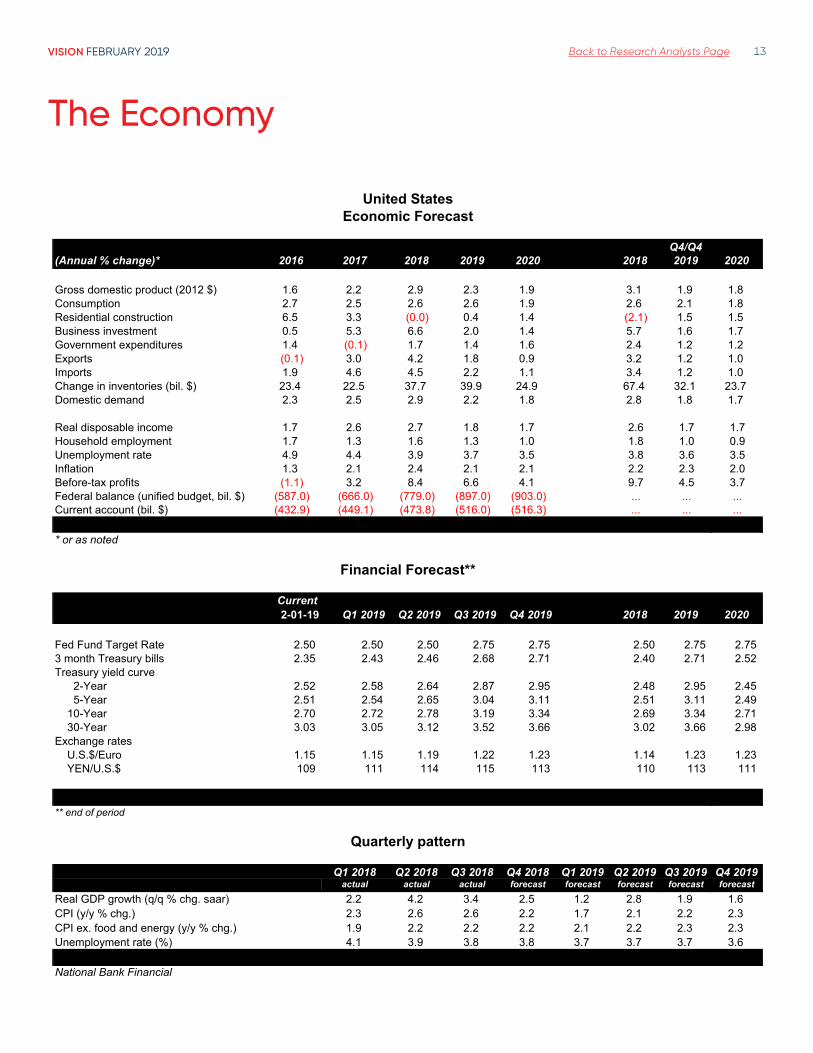
Q4/Q4(Annual % change)* 2016 2017 2018 2019 2020 2006 2018 2019 2020
Gross domestic product (2012 $) 1.6 2.2 2.9 2.3 1.9 3.1 1.9 1.8Consumption 2.7 2.5 2.6 2.6 1.9 2.6 2.1 1.8Residential construction 6.5 3.3 (0.0) 0.4 1.4 (2.1) 1.5 1.5Business investment 0.5 5.3 6.6 2.0 1.4 5.7 1.6 1.7Government expenditures 1.4 (0.1) 1.7 1.4 1.6 2.4 1.2 1.2Exports (0.1) 3.0 4.2 1.8 0.9 3.2 1.2 1.0Imports 1.9 4.6 4.5 2.2 1.1 3.4 1.2 1.0Change in inventories (bil. $) 23.4 22.5 37.7 39.9 24.9 67.4 32.1 23.7Domestic demand 2.3 2.5 2.9 2.2 1.8 2.8 1.8 1.7
Real disposable income 1.7 2.6 2.7 1.8 1.7 2.6 1.7 1.7Household employment 1.7 1.3 1.6 1.3 1.0 1.8 1.0 0.9Unemployment rate 4.9 4.4 3.9 3.7 3.5 3.8 3.6 3.5Inflation 1.3 2.1 2.4 2.1 2.1 2.2 2.3 2.0Before-tax profits (1.1) 3.2 8.4 6.6 4.1 9.7 4.5 3.7Federal balance (unified budget, bil. $) (587.0) (666.0) (779.0) (897.0) (903.0) ... ... ...Current account (bil. $) (432.9) (449.1) (473.8) (516.0) (516.3) ... ... ...
-304* or as noted
Current Q4 2018 Q4 2019 Q4 20202-01-19 Q1 2019 Q2 2019 Q3 2019 Q4 2019 2018 2019 2020
Fed Fund Target Rate 2.50 2.50 2.50 2.75 2.75 2.50 2.75 2.75 3 month Treasury bills 2.35 2.43 2.46 2.68 2.71 2.40 2.71 2.52 Treasury yield curve 2-Year 2.52 2.58 2.64 2.87 2.95 2.48 2.95 2.45 5-Year 2.51 2.54 2.65 3.04 3.11 2.51 3.11 2.49 10-Year 2.70 2.72 2.78 3.19 3.34 2.69 3.34 2.71 30-Year 3.03 3.05 3.12 3.52 3.66 3.02 3.66 2.98 Exchange rates U.S.$/Euro 1.15 1.15 1.19 1.22 1.23 1.14 1.23 1.23 YEN/U.S.$ 109 111 114 115 113 110 113 111
** end of period
Q1 2018 Q2 2018 Q3 2018 Q4 2018 Q1 2019 Q2 2019 Q3 2019 Q4 2019actual actual actual forecast forecast forecast forecast forecast
Real GDP growth (q/q % chg. saar) 2.2 4.2 3.4 2.5 1.2 2.8 1.9 1.6CPI (y/y % chg.) 2.3 2.6 2.6 2.2 1.7 2.1 2.2 2.3CPI ex. food and energy (y/y % chg.) 1.9 2.2 2.2 2.2 2.1 2.2 2.3 2.3Unemployment rate (%) 4.1 3.9 3.8 3.8 3.7 3.7 3.7 3.6
National Bank Financial
Financial Forecast**
Quarterly pattern
United StatesEconomic Forecast
The Economy
VISION FEBRUARY 2019 Back to Research Analysts Page 14
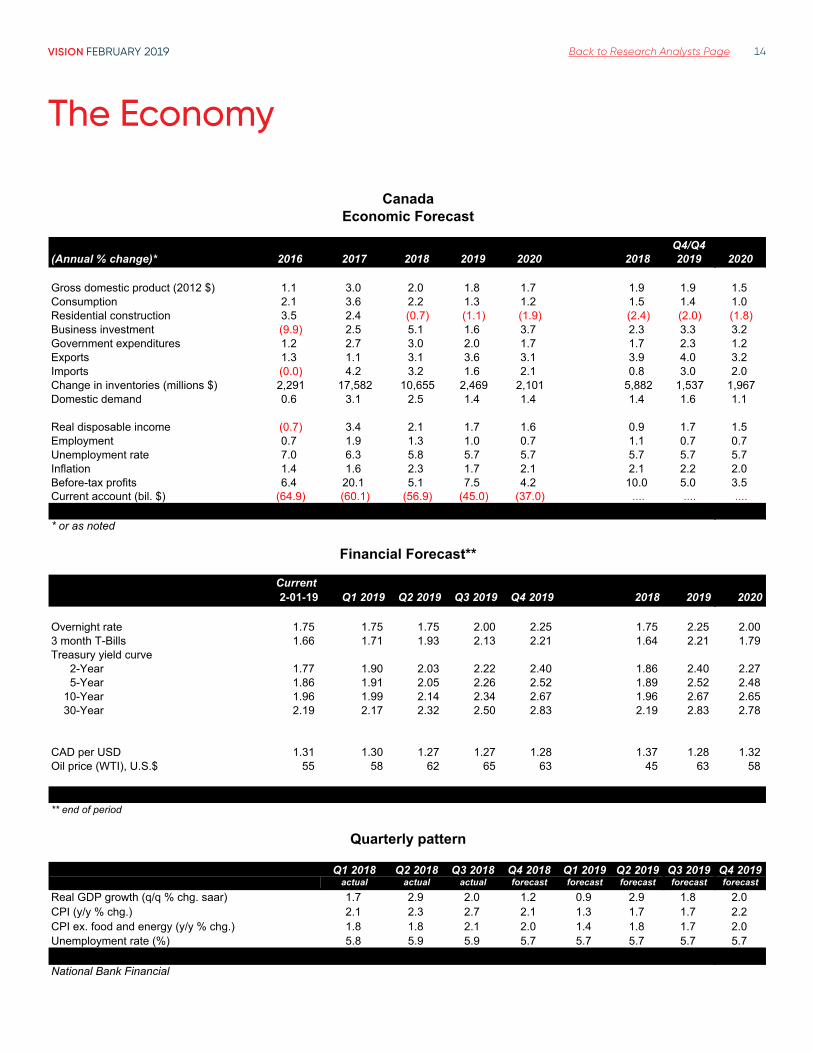
Q4/Q4(Annual % change)* 2016 2017 2018 2019 2020 2018 2019 2020
Gross domestic product (2012 $) 1.1 3.0 2.0 1.8 1.7 1.9 1.9 1.5Consumption 2.1 3.6 2.2 1.3 1.2 1.5 1.4 1.0Residential construction 3.5 2.4 (0.7) (1.1) (1.9) (2.4) (2.0) (1.8)Business investment (9.9) 2.5 5.1 1.6 3.7 2.3 3.3 3.2Government expenditures 1.2 2.7 3.0 2.0 1.7 1.7 2.3 1.2Exports 1.3 1.1 3.1 3.6 3.1 3.9 4.0 3.2Imports (0.0) 4.2 3.2 1.6 2.1 0.8 3.0 2.0Change in inventories (millions $) 2,291 17,582 10,655 2,469 2,101 5,882 1,537 1,967Domestic demand 0.6 3.1 2.5 1.4 1.4 1.4 1.6 1.1
Real disposable income (0.7) 3.4 2.1 1.7 1.6 0.9 1.7 1.5Employment 0.7 1.9 1.3 1.0 0.7 1.1 0.7 0.7Unemployment rate 7.0 6.3 5.8 5.7 5.7 5.7 5.7 5.7Inflation 1.4 1.6 2.3 1.7 2.1 2.1 2.2 2.0Before-tax profits 6.4 20.1 5.1 7.5 4.2 10.0 5.0 3.5Current account (bil. $) (64.9) (60.1) (56.9) (45.0) (37.0) .... .... ....
* or as noted
Current Q4 2018 Q4 2019 Q4 20202-01-19 Q1 2019 Q2 2019 Q3 2019 Q4 2019 2018 2019 2020
Overnight rate 1.75 1.75 1.75 2.00 2.25 1.75 2.25 2.00 3 month T-Bills 1.66 1.71 1.93 2.13 2.21 1.64 2.21 1.79 Treasury yield curve 2-Year 1.77 1.90 2.03 2.22 2.40 1.86 2.40 2.27 5-Year 1.86 1.91 2.05 2.26 2.52 1.89 2.52 2.48 10-Year 1.96 1.99 2.14 2.34 2.67 1.96 2.67 2.65 30-Year 2.19 2.17 2.32 2.50 2.83 2.19 2.83 2.78
CAD per USD 1.31 1.30 1.27 1.27 1.28 1.37 1.28 1.32 Oil price (WTI), U.S.$ 55 58 62 65 63 45 63 58
** end of period
Q1 2018 Q2 2018 Q3 2018 Q4 2018 Q1 2019 Q2 2019 Q3 2019 Q4 2019actual actual actual forecast forecast forecast forecast forecast
Real GDP growth (q/q % chg. saar) 1.7 2.9 2.0 1.2 0.9 2.9 1.8 2.0CPI (y/y % chg.) 2.1 2.3 2.7 2.1 1.3 1.7 1.7 2.2CPI ex. food and energy (y/y % chg.) 1.8 1.8 2.1 2.0 1.4 1.8 1.7 2.0Unemployment rate (%) 5.8 5.9 5.9 5.7 5.7 5.7 5.7 5.7
National Bank Financial
CanadaEconomic Forecast
Financial Forecast**
Quarterly pattern
The Economy
VISION FEBRUARY 2019 Back to Research Analysts Page 15
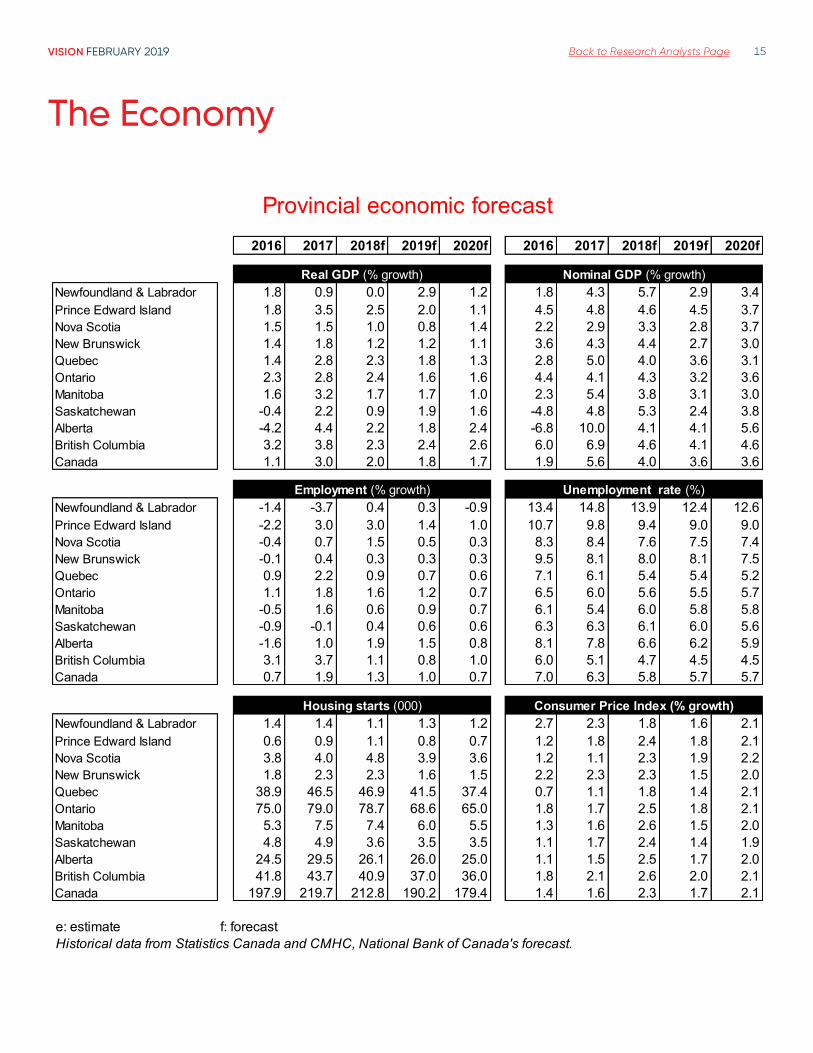
Provincial economic forecast2016 2017 2018f 2019f 2020f 2016 2017 2018f 2019f 2020f
Real GDP (% growth) Nominal GDP (% growth)Newfoundland & Labrador 1.8 0.9 0.0 2.9 1.2 1.8 4.3 5.7 2.9 3.4Prince Edward Island 1.8 3.5 2.5 2.0 1.1 4.5 4.8 4.6 4.5 3.7Nova Scotia 1.5 1.5 1.0 0.8 1.4 2.2 2.9 3.3 2.8 3.7New Brunswick 1.4 1.8 1.2 1.2 1.1 3.6 4.3 4.4 2.7 3.0Quebec 1.4 2.8 2.3 1.8 1.3 2.8 5.0 4.0 3.6 3.1Ontario 2.3 2.8 2.4 1.6 1.6 4.4 4.1 4.3 3.2 3.6Manitoba 1.6 3.2 1.7 1.7 1.0 2.3 5.4 3.8 3.1 3.0Saskatchewan -0.4 2.2 0.9 1.9 1.6 -4.8 4.8 5.3 2.4 3.8Alberta -4.2 4.4 2.2 1.8 2.4 -6.8 10.0 4.1 4.1 5.6British Columbia 3.2 3.8 2.3 2.4 2.6 6.0 6.9 4.6 4.1 4.6Canada 1.1 3.0 2.0 1.8 1.7 1.9 5.6 4.0 3.6 3.6
Employment (% growth) Unemployment rate (%)Newfoundland & Labrador -1.4 -3.7 0.4 0.3 -0.9 13.4 14.8 13.9 12.4 12.6Prince Edward Island -2.2 3.0 3.0 1.4 1.0 10.7 9.8 9.4 9.0 9.0Nova Scotia -0.4 0.7 1.5 0.5 0.3 8.3 8.4 7.6 7.5 7.4New Brunswick -0.1 0.4 0.3 0.3 0.3 9.5 8.1 8.0 8.1 7.5Quebec 0.9 2.2 0.9 0.7 0.6 7.1 6.1 5.4 5.4 5.2Ontario 1.1 1.8 1.6 1.2 0.7 6.5 6.0 5.6 5.5 5.7Manitoba -0.5 1.6 0.6 0.9 0.7 6.1 5.4 6.0 5.8 5.8Saskatchewan -0.9 -0.1 0.4 0.6 0.6 6.3 6.3 6.1 6.0 5.6Alberta -1.6 1.0 1.9 1.5 0.8 8.1 7.8 6.6 6.2 5.9British Columbia 3.1 3.7 1.1 0.8 1.0 6.0 5.1 4.7 4.5 4.5Canada 0.7 1.9 1.3 1.0 0.7 7.0 6.3 5.8 5.7 5.7
Housing starts (000) Consumer Price Index (% growth)Newfoundland & Labrador 1.4 1.4 1.1 1.3 1.2 2.7 2.3 1.8 1.6 2.1Prince Edward Island 0.6 0.9 1.1 0.8 0.7 1.2 1.8 2.4 1.8 2.1Nova Scotia 3.8 4.0 4.8 3.9 3.6 1.2 1.1 2.3 1.9 2.2New Brunswick 1.8 2.3 2.3 1.6 1.5 2.2 2.3 2.3 1.5 2.0Quebec 38.9 46.5 46.9 41.5 37.4 0.7 1.1 1.8 1.4 2.1Ontario 75.0 79.0 78.7 68.6 65.0 1.8 1.7 2.5 1.8 2.1Manitoba 5.3 7.5 7.4 6.0 5.5 1.3 1.6 2.6 1.5 2.0Saskatchewan 4.8 4.9 3.6 3.5 3.5 1.1 1.7 2.4 1.4 1.9Alberta 24.5 29.5 26.1 26.0 25.0 1.1 1.5 2.5 1.7 2.0British Columbia 41.8 43.7 40.9 37.0 36.0 1.8 2.1 2.6 2.0 2.1Canada 197.9 219.7 212.8 190.2 179.4 1.4 1.6 2.3 1.7 2.1
e: estimate f: forecastHistorical data from Statistics Canada and CMHC, National Bank of Canada's forecast.
The Economy
VISION FEBRUARY 2019 Back to Research Analysts Page 16
Interest Ratesand Bond Markets
VISION FEBRUARY 2019 Back to Research Analysts Page 17
Interest Rates and Bond Markets
Paul-André Pinsonnault Senior Fixed Income Economist 514-879-3795
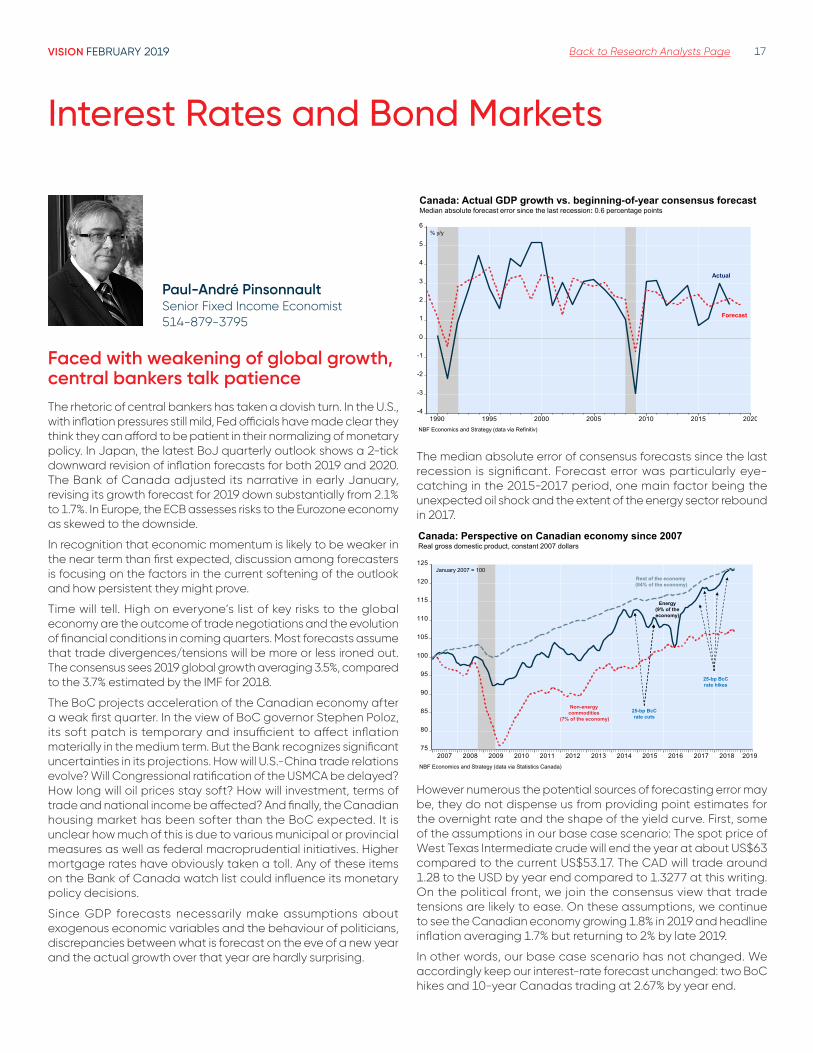
Faced with weakening of global growth, central bankers talk patienceThe rhetoric of central bankers has taken a dovish turn. In the U.S., with inflation pressures still mild, Fed officials have made clear they think they can afford to be patient in their normalizing of monetary policy. In Japan, the latest BoJ quarterly outlook shows a 2-tick downward revision of inflation forecasts for both 2019 and 2020. The Bank of Canada adjusted its narrative in early January, revising its growth forecast for 2019 down substantially from 2.1% to 1.7%. In Europe, the ECB assesses risks to the Eurozone economy as skewed to the downside.
In recognition that economic momentum is likely to be weaker in the near term than first expected, discussion among forecasters is focusing on the factors in the current softening of the outlook and how persistent they might prove.
Time will tell. High on everyone’s list of key risks to the global economy are the outcome of trade negotiations and the evolution of financial conditions in coming quarters. Most forecasts assume that trade divergences/tensions will be more or less ironed out. The consensus sees 2019 global growth averaging 3.5%, compared to the 3.7% estimated by the IMF for 2018.
The BoC projects acceleration of the Canadian economy after a weak first quarter. In the view of BoC governor Stephen Poloz, its soft patch is temporary and insufficient to affect inflation materially in the medium term. But the Bank recognizes significant uncertainties in its projections. How will U.S.-China trade relations evolve? Will Congressional ratification of the USMCA be delayed? How long will oil prices stay soft? How will investment, terms of trade and national income be affected? And finally, the Canadian housing market has been softer than the BoC expected. It is unclear how much of this is due to various municipal or provincial measures as well as federal macroprudential initiatives. Higher mortgage rates have obviously taken a toll. Any of these items on the Bank of Canada watch list could influence its monetary policy decisions.
Since GDP forecasts necessarily make assumptions about exogenous economic variables and the behaviour of politicians, discrepancies between what is forecast on the eve of a new year and the actual growth over that year are hardly surprising.
-4
-3
-2
-1
0
1
2
3
4
5
6
1990 1995 2000 2005 2010 2015 2020
Canada: Actual GDP growth vs. beginning-of-year consensus forecastMedian absolute forecast error since the last recession: 0.6 percentage points
% y/y
NBF Economics and Strategy (data via Refinitiv)
Forecast
Actual
The median absolute error of consensus forecasts since the last recession is significant. Forecast error was particularly eye-catching in the 2015-2017 period, one main factor being the unexpected oil shock and the extent of the energy sector rebound in 2017.
75
80
85
90
95
100
105
110
115
120
125
2007 2008 2009 2010 2011 2012 2013 2014 2015 2016 2017 2018 2019
Canada: Perspective on Canadian economy since 2007Real gross domestic product, constant 2007 dollars
NBF Economics and Strategy (data via Statistics Canada)
Rest of the economy(84% of the economy)
Energy(9% of the economy)
Non-energy commodities
(7% of the economy)25-bp BcCrate cuts
25-bp BcCrate hikes
January 2007 = 100
However numerous the potential sources of forecasting error may be, they do not dispense us from providing point estimates for the overnight rate and the shape of the yield curve. First, some of the assumptions in our base case scenario: The spot price of West Texas Intermediate crude will end the year at about US$63 compared to the current US$53.17. The CAD will trade around 1.28 to the USD by year end compared to 1.3277 at this writing. On the political front, we join the consensus view that trade tensions are likely to ease. On these assumptions, we continue to see the Canadian economy growing 1.8% in 2019 and headline inflation averaging 1.7% but returning to 2% by late 2019.
In other words, our base case scenario has not changed. We accordingly keep our interest-rate forecast unchanged: two BoC hikes and 10-year Canadas trading at 2.67% by year end.
VISION FEBRUARY 2019 Back to Research Analysts Page 18
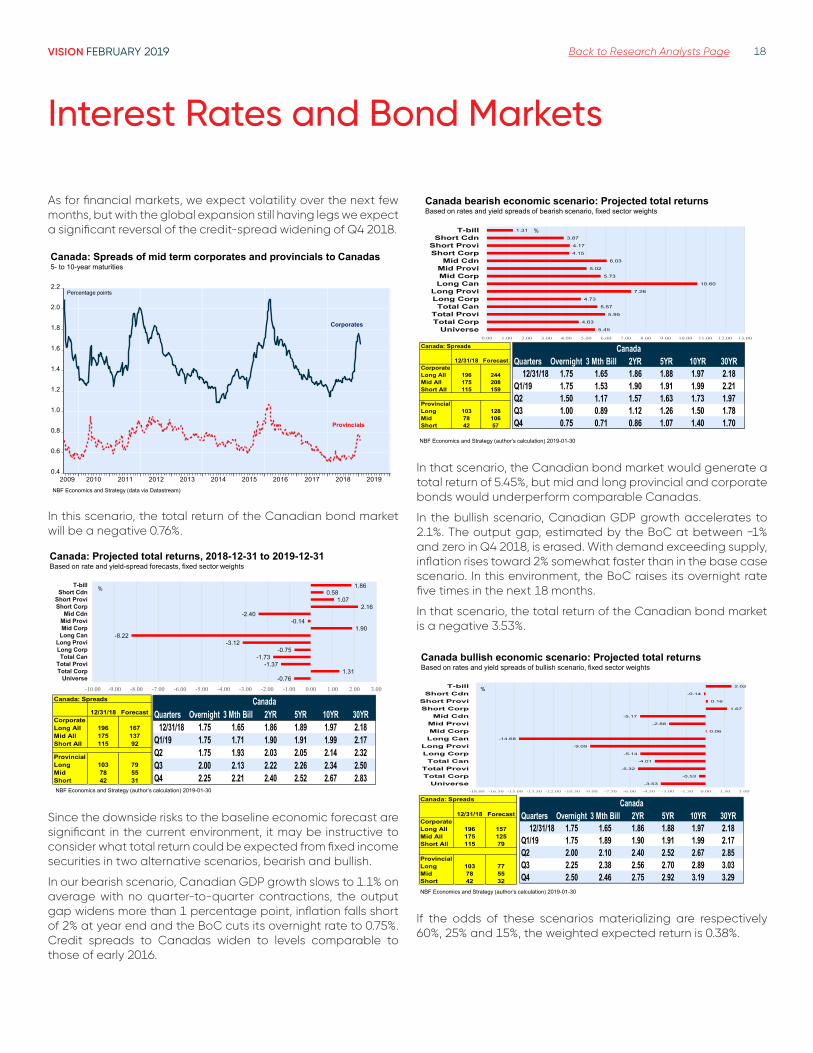
As for financial markets, we expect volatility over the next few months, but with the global expansion still having legs we expect a significant reversal of the credit-spread widening of Q4 2018.
0.4
0.6
0.8
1.0
1.2
1.4
1.6
1.8
2.0
2.2
2009 2010 2011 2012 2013 2014 2015 2016 2017 2018 2019NBF Economics and Strategy (data via Datastream)
Percentage points
Canada: Spreads of mid term corporates and provincials to Canadas5- to 10-year maturities
Corporates
Provincials
In this scenario, the total return of the Canadian bond market will be a negative 0.76%.
%
Canada: Projected total returns, 2018-12-31 to 2019-12-31Based on rate and yield-spread forecasts, fixed sector weights
NBF Economics and Strategy (author’s calculation) 2019-01-30
Canada: Spreads
12/31/18 ForecastCorporateLong All 196 167Mid All 175 137Short All 115 92
ProvincialLong 103 79Mid 78 55Short 42 31
-0.761.31
-1.37-1.73
-0.75-3.12
-8.221.90
-0.14-2.40
2.161.07
0.581.86
-10.00 -9.00 -8.00 -7.00 -6.00 -5.00 -4.00 -3.00 -2.00 -1.00 0.00 1.00 2.00 3.00
UniverseTotal CorpTotal Provi
Total CanLong CorpLong Provi
Long CanMid CorpMid Provi
Mid CdnShort CorpShort Provi
Short CdnT-bill %
Quarters Overnight 3 Mth Bill 2YR 5YR 10YR 30YR12/31/18 1.75 1.65 1.86 1.89 1.97 2.18
Q1/19 1.75 1.71 1.90 1.91 1.99 2.17Q2 1.75 1.93 2.03 2.05 2.14 2.32Q3 2.00 2.13 2.22 2.26 2.34 2.50Q4 2.25 2.21 2.40 2.52 2.67 2.83
Canada
Since the downside risks to the baseline economic forecast are significant in the current environment, it may be instructive to consider what total return could be expected from fixed income securities in two alternative scenarios, bearish and bullish.
In our bearish scenario, Canadian GDP growth slows to 1.1% on average with no quarter-to-quarter contractions, the output gap widens more than 1 percentage point, inflation falls short of 2% at year end and the BoC cuts its overnight rate to 0.75%. Credit spreads to Canadas widen to levels comparable to those of early 2016.
5.45
4.63
5.95
5.57
4.73
7.26
10.60
5.73
5.02
6.03
4.15
4.17
3.87
1.31
0.00 1.00 2.00 3.00 4.00 5.00 6.00 7.00 8.00 9.00 10.00 11.00 12.00 13.00
UniverseTotal CorpTotal Provi
Total CanLong CorpLong Provi
Long CanMid CorpMid Provi
Mid CdnShort CorpShort Provi
Short CdnT-bill %
Canada bearish economic scenario: Projected total returnsBased on rates and yield spreads of bearish scenario, fixed sector weights
NBF Economics and Strategy (author’s calculation) 2019-01-30
Canada: Spreads
12/31/18 ForecastCorporateLong All 196 244Mid All 175 208Short All 115 159
ProvincialLong 103 128Mid 78 106Short 42 57
Quarters Overnight 3 Mth Bill 2YR 5YR 10YR 30YR12/31/18 1.75 1.65 1.86 1.88 1.97 2.18
Q1/19 1.75 1.53 1.90 1.91 1.99 2.21Q2 1.50 1.17 1.57 1.63 1.73 1.97Q3 1.00 0.89 1.12 1.26 1.50 1.78Q4 0.75 0.71 0.86 1.07 1.40 1.70
Canada
In that scenario, the Canadian bond market would generate a total return of 5.45%, but mid and long provincial and corporate bonds would underperform comparable Canadas.
In the bullish scenario, Canadian GDP growth accelerates to 2.1%. The output gap, estimated by the BoC at between −1% and zero in Q4 2018, is erased. With demand exceeding supply, inflation rises toward 2% somewhat faster than in the base case scenario. In this environment, the BoC raises its overnight rate five times in the next 18 months.
In that scenario, the total return of the Canadian bond market is a negative 3.53%.
-3.53
-0.53
-5.32
-4.01
-5.14
-9.09
-14.68
0.06
-2.88
-5.17
1.67
0.16
-0.14
2.02
-18.00 -16.50 -15.00 -13.50 -12.00 -10.50 -9.00 -7.50 -6.00 -4.50 -3.00 -1.50 0.00 1.50 3.00
UniverseTotal CorpTotal Provi
Total CanLong CorpLong Provi
Long CanMid CorpMid Provi
Mid CdnShort CorpShort Provi
Short CdnT-bill
Canada: Spreads
12/31/18 ForecastCorporateLong All 196 157Mid All 175 125Short All 115 79
ProvincialLong 103 77Mid 78 55Short 42 32
Canada bullish economic scenario: Projected total returnsBased on rates and yield spreads of bullish scenario, fixed sector weights
NBF Economics and Strategy (author’s calculation) 2019-01-30
%
Quarters Overnight 3 Mth Bill 2YR 5YR 10YR 30YR12/31/18 1.75 1.65 1.86 1.88 1.97 2.18
Q1/19 1.75 1.89 1.90 1.91 1.99 2.17Q2 2.00 2.10 2.40 2.52 2.67 2.85Q3 2.25 2.38 2.56 2.70 2.89 3.03Q4 2.50 2.46 2.75 2.92 3.19 3.29
Canada
If the odds of these scenarios materializing are respectively 60%, 25% and 15%, the weighted expected return is 0.38%.
Interest Rates and Bond Markets
VISION FEBRUARY 2019 Back to Research Analysts Page 19
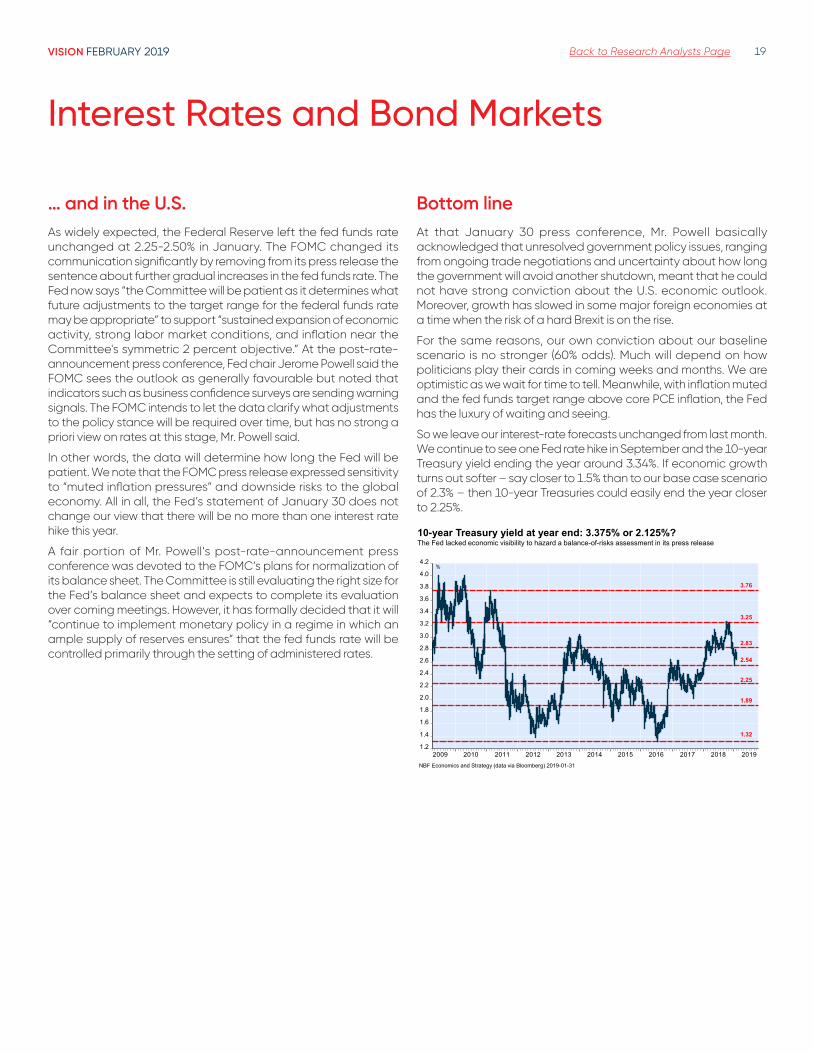
… and in the U .S .As widely expected, the Federal Reserve left the fed funds rate unchanged at 2.25-2.50% in January. The FOMC changed its communication significantly by removing from its press release the sentence about further gradual increases in the fed funds rate. The Fed now says “the Committee will be patient as it determines what future adjustments to the target range for the federal funds rate may be appropriate” to support “sustained expansion of economic activity, strong labor market conditions, and inflation near the Committee's symmetric 2 percent objective.” At the post-rate-announcement press conference, Fed chair Jerome Powell said the FOMC sees the outlook as generally favourable but noted that indicators such as business confidence surveys are sending warning signals. The FOMC intends to let the data clarify what adjustments to the policy stance will be required over time, but has no strong a priori view on rates at this stage, Mr. Powell said.
In other words, the data will determine how long the Fed will be patient. We note that the FOMC press release expressed sensitivity to “muted inflation pressures” and downside risks to the global economy. All in all, the Fed’s statement of January 30 does not change our view that there will be no more than one interest rate hike this year.
A fair portion of Mr. Powell’s post-rate-announcement press conference was devoted to the FOMC’s plans for normalization of its balance sheet. The Committee is still evaluating the right size for the Fed’s balance sheet and expects to complete its evaluation over coming meetings. However, it has formally decided that it will “continue to implement monetary policy in a regime in which an ample supply of reserves ensures” that the fed funds rate will be controlled primarily through the setting of administered rates.
Bottom line At that January 30 press conference, Mr. Powell basically acknowledged that unresolved government policy issues, ranging from ongoing trade negotiations and uncertainty about how long the government will avoid another shutdown, meant that he could not have strong conviction about the U.S. economic outlook. Moreover, growth has slowed in some major foreign economies at a time when the risk of a hard Brexit is on the rise.
For the same reasons, our own conviction about our baseline scenario is no stronger (60% odds). Much will depend on how politicians play their cards in coming weeks and months. We are optimistic as we wait for time to tell. Meanwhile, with inflation muted and the fed funds target range above core PCE inflation, the Fed has the luxury of waiting and seeing.
So we leave our interest-rate forecasts unchanged from last month. We continue to see one Fed rate hike in September and the 10-year Treasury yield ending the year around 3.34%. If economic growth turns out softer – say closer to 1.5% than to our base case scenario of 2.3% – then 10-year Treasuries could easily end the year closer to 2.25%.
1.2
1.4
1.6
1.8
2.0
2.2
2.4
2.6
2.8
3.0
3.2
3.4
3.6
3.8
4.0
4.2
2009 2010 2011 2012 2013 2014 2015 2016 2017 2018 2019NBF Economics and Strategy (data via Bloomberg) 2019-01-31
3.76
3.25
2.83
2.54
2.25
1.89
1.32
%
10-year Treasury yield at year end: 3.375% or 2.125%?The Fed lacked economic visibility to hazard a balance-of-risks assessment in its press release
Interest Rates and Bond Markets
VISION FEBRUARY 2019 Back to Research Analysts Page 20
Interest Rates and Bond Markets
Long33.0%
Short45.0%
Mid22.0%
Federal30.7%
Corporate30.4%
Provinces38.9%Benchmark Allocation
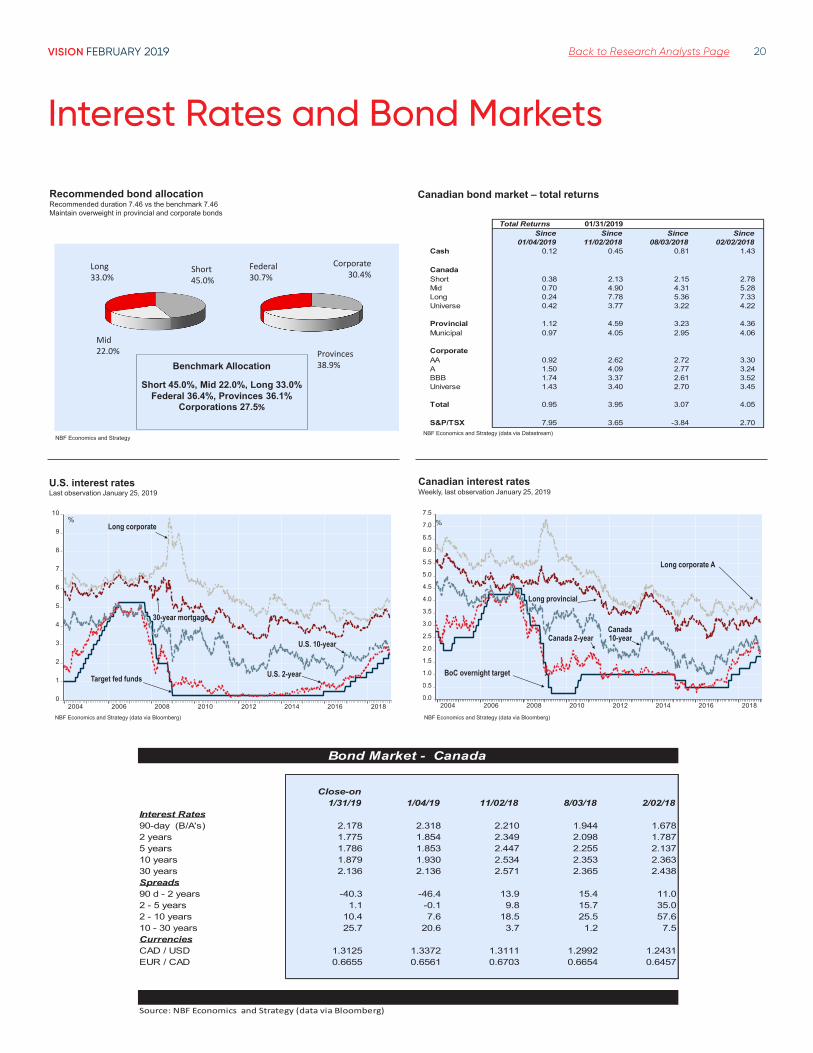
Short 45.0%, Mid 22.0%, Long 33.0%Federal 36.4%, Provinces 36.1%
Corporations 27.5%
Recommended bond allocationRecommended duration 7.46 vs the benchmark 7.46 Maintain overweight in provincial and corporate bonds
NBF Economics and Strategy
0
1
2
3
4
5
6
7
8
9
10
2004 2006 2008 2010 2012 2014 2016 2018
U.S. interest ratesLast observation January 25, 2019
%Long corporate
U.S. 10-year
U.S. 2-yearTarget fed funds
30-year mortgage
NBF Economics and Strategy (data via Bloomberg)
Canadian bond market – total returns
NBF Economics and Strategy (data via Datastream)
Total Returns 01/31/2019 Since Since Since Since
01/04/2019 11/02/2018 08/03/2018 02/02/2018Cash 0.12 0.45 0.81 1.43
CanadaShort 0.38 2.13 2.15 2.78Mid 0.70 4.90 4.31 5.28Long 0.24 7.78 5.36 7.33Universe 0.42 3.77 3.22 4.22
Provincial 1.12 4.59 3.23 4.36Municipal 0.97 4.05 2.95 4.06
CorporateAA 0.92 2.62 2.72 3.30A 1.50 4.09 2.77 3.24BBB 1.74 3.37 2.61 3.52Universe 1.43 3.40 2.70 3.45
Total 0.95 3.95 3.07 4.05
S&P/TSX 7.95 3.65 -3.84 2.70
0.0
0.5
1.0
1.5
2.0
2.5
3.0
3.5
4.0
4.5
5.0
5.5
6.0
6.5
7.0
7.5
2004 2006 2008 2010 2012 2014 2016 2018
Canadian interest ratesWeekly, last observation January 25, 2019
%
Long corporate A
Long provincial
Canada10-yearCanada 2-year
BoC overnight target
NBF Economics and Strategy (data via Bloomberg)
Bond Market - Canada
Close-on1/31/19 1/04/19 11/02/18 8/03/18 2/02/18
Interest Rates90-day (B/A's) 2.178 2.318 2.210 1.944 1.6782 years 1.775 1.854 2.349 2.098 1.7875 years 1.786 1.853 2.447 2.255 2.13710 years 1.879 1.930 2.534 2.353 2.36330 years 2.136 2.136 2.571 2.365 2.438Spreads90 d - 2 years -40.3 -46.4 13.9 15.4 11.02 - 5 years 1.1 -0.1 9.8 15.7 35.02 - 10 years 10.4 7.6 18.5 25.5 57.610 - 30 years 25.7 20.6 3.7 1.2 7.5CurrenciesCAD / USD 1.3125 1.3372 1.3111 1.2992 1.2431EUR / CAD 0.6655 0.6561 0.6703 0.6654 0.6457
Source: NBF Economics and Strategy (data via Bloomberg)
VISION FEBRUARY 2019 Back to Research Analysts Page 21
Stock Market and Portfolio Strategy
VISION FEBRUARY 2019 Back to Research Analysts Page 22
Stock Market and Portfolio Strategy
Stéfane Marion Chief Economist and Strategist 514-879-3781
Matthieu Arseneau Deputy Chief Economist 514-879-2252
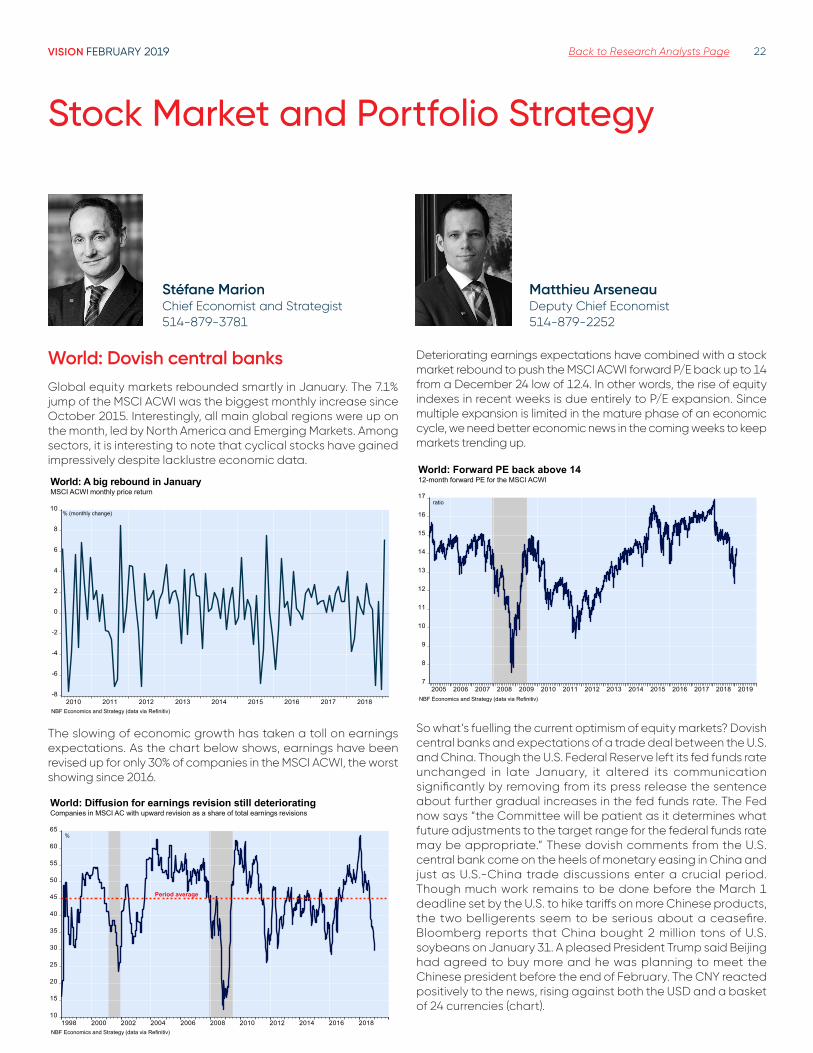
World: Dovish central banksGlobal equity markets rebounded smartly in January. The 7.1% jump of the MSCI ACWI was the biggest monthly increase since October 2015. Interestingly, all main global regions were up on the month, led by North America and Emerging Markets. Among sectors, it is interesting to note that cyclical stocks have gained impressively despite lacklustre economic data.
-8
-6
-4
-2
0
2
4
6
8
10
2010 2011 2012 2013 2014 2015 2016 2017 2018
World: A big rebound in JanuaryMSCI ACWI monthly price return
NBF Economics and Strategy (data via Refinitiv)
% (monthly change)
The slowing of economic growth has taken a toll on earnings expectations. As the chart below shows, earnings have been revised up for only 30% of companies in the MSCI ACWI, the worst showing since 2016.
10
15
20
25
30
35
40
45
50
55
60
65
1998 2000 2002 2004 2006 2008 2010 2012 2014 2016 2018
%
World: Diffusion for earnings revision still deterioratingCompanies in MSCI AC with upward revision as a share of total earnings revisions
NBF Economics and Strategy (data via Refinitiv)
Period average
Deteriorating earnings expectations have combined with a stock market rebound to push the MSCI ACWI forward P/E back up to 14 from a December 24 low of 12.4. In other words, the rise of equity indexes in recent weeks is due entirely to P/E expansion. Since multiple expansion is limited in the mature phase of an economic cycle, we need better economic news in the coming weeks to keep markets trending up.
7
8
9
10
11
12
13
14
15
16
17
2005 2006 2007 2008 2009 2010 2011 2012 2013 2014 2015 2016 2017 2018 2019
ratio
World: Forward PE back above 1412-month forward PE for the MSCI ACWI
NBF Economics and Strategy (data via Refinitiv)
So what’s fuelling the current optimism of equity markets? Dovish central banks and expectations of a trade deal between the U.S. and China. Though the U.S. Federal Reserve left its fed funds rate unchanged in late January, it altered its communication significantly by removing from its press release the sentence about further gradual increases in the fed funds rate. The Fed now says “the Committee will be patient as it determines what future adjustments to the target range for the federal funds rate may be appropriate.” These dovish comments from the U.S. central bank come on the heels of monetary easing in China and just as U.S.-China trade discussions enter a crucial period. Though much work remains to be done before the March 1 deadline set by the U.S. to hike tariffs on more Chinese products, the two belligerents seem to be serious about a ceasefire. Bloomberg reports that China bought 2 million tons of U.S. soybeans on January 31. A pleased President Trump said Beijing had agreed to buy more and he was planning to meet the Chinese president before the end of February. The CNY reacted positively to the news, rising against both the USD and a basket of 24 currencies (chart).
VISION FEBRUARY 2019 Back to Research Analysts Page 23
Stock Market and Portfolio Strategy
88
90
92
94
96
98
100
102
104
106
2015 2016 2017 2018 2019
China: Currency is strengtheningTrade-weighted index of RMB vs. 24 currencies vs. the CNY/USD index
NBF Economics and Strategy (Federal Reserve data via Refinitiv)
Index (Dec. 2014 =100)
CFETS RMB index
CNY/USDindex
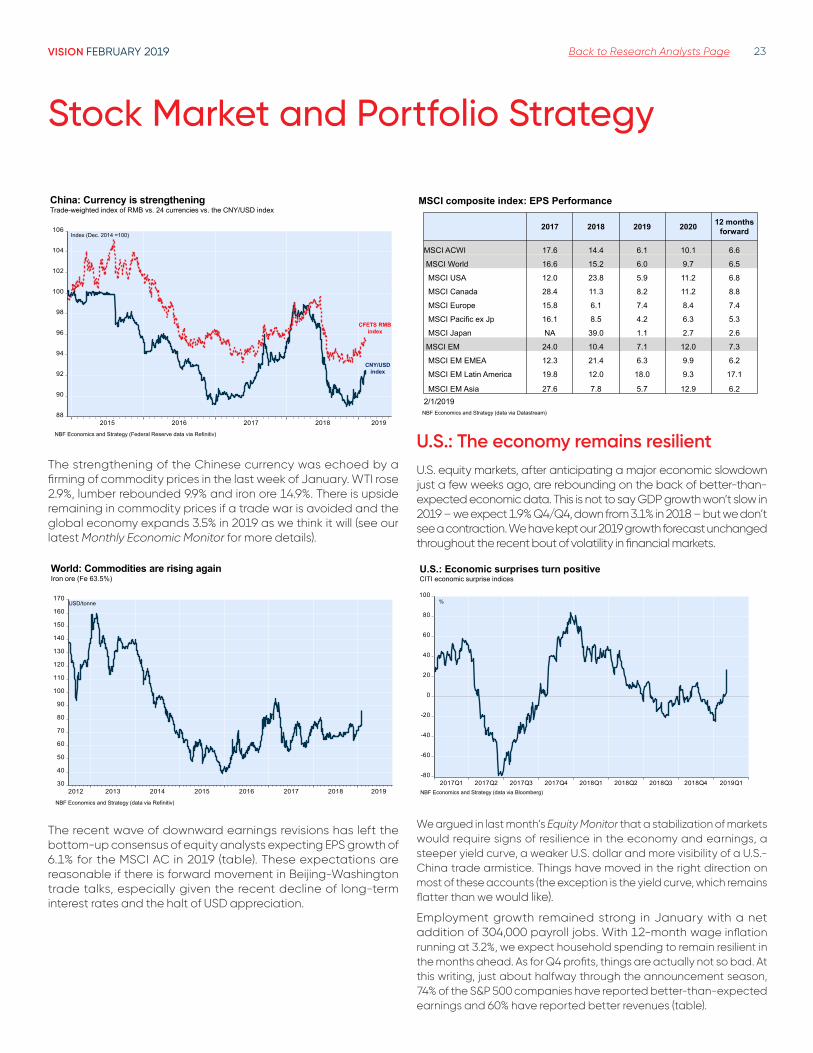
The strengthening of the Chinese currency was echoed by a firming of commodity prices in the last week of January. WTI rose 2.9%, lumber rebounded 9.9% and iron ore 14.9%. There is upside remaining in commodity prices if a trade war is avoided and the global economy expands 3.5% in 2019 as we think it will (see our latest Monthly Economic Monitor for more details).
30
40
50
60
70
80
90
100
110
120
130
140
150
160
170
2012 2013 2014 2015 2016 2017 2018 2019
World: Commodities are rising againIron ore (Fe 63.5%)
NBF Economics and Strategy (data via Refinitiv)
USD/tonne
The recent wave of downward earnings revisions has left the bottom-up consensus of equity analysts expecting EPS growth of 6.1% for the MSCI AC in 2019 (table). These expectations are reasonable if there is forward movement in Beijing-Washington trade talks, especially given the recent decline of long-term interest rates and the halt of USD appreciation.
MSCI composite index: EPS Performance
NBF Economics and Strategy (data via Datastream)
2017 2018 2019 2020 12 months forward
MSCI ACWI 17.6 14.4 6.1 10.1 6.6
MSCI World 16.6 15.2 6.0 9.7 6.5
MSCI USA 12.0 23.8 5.9 11.2 6.8
MSCI Canada 28.4 11.3 8.2 11.2 8.8
MSCI Europe 15.8 6.1 7.4 8.4 7.4
MSCI Pacific ex Jp 16.1 8.5 4.2 6.3 5.3
MSCI Japan NA 39.0 1.1 2.7 2.6
MSCI EM 24.0 10.4 7.1 12.0 7.3
MSCI EM EMEA 12.3 21.4 6.3 9.9 6.2
MSCI EM Latin America 19.8 12.0 18.0 9.3 17.1
MSCI EM Asia 27.6 7.8 5.7 12.9 6.22/1/2019
U .S .: The economy remains resilientU.S. equity markets, after anticipating a major economic slowdown just a few weeks ago, are rebounding on the back of better-than-expected economic data. This is not to say GDP growth won’t slow in 2019 – we expect 1.9% Q4/Q4, down from 3.1% in 2018 – but we don’t see a contraction. We have kept our 2019 growth forecast unchanged throughout the recent bout of volatility in financial markets.
-80
-60
-40
-20
0
20
40
60
80
100
2017Q1 2017Q2 2017Q3 2017Q4 2018Q1 2018Q2 2018Q3 2018Q4 2019Q1
%
U.S.: Economic surprises turn positiveCITI economic surprise indices
NBF Economics and Strategy (data via Bloomberg)
We argued in last month’s Equity Monitor that a stabilization of markets would require signs of resilience in the economy and earnings, a steeper yield curve, a weaker U.S. dollar and more visibility of a U.S.-China trade armistice. Things have moved in the right direction on most of these accounts (the exception is the yield curve, which remains flatter than we would like).
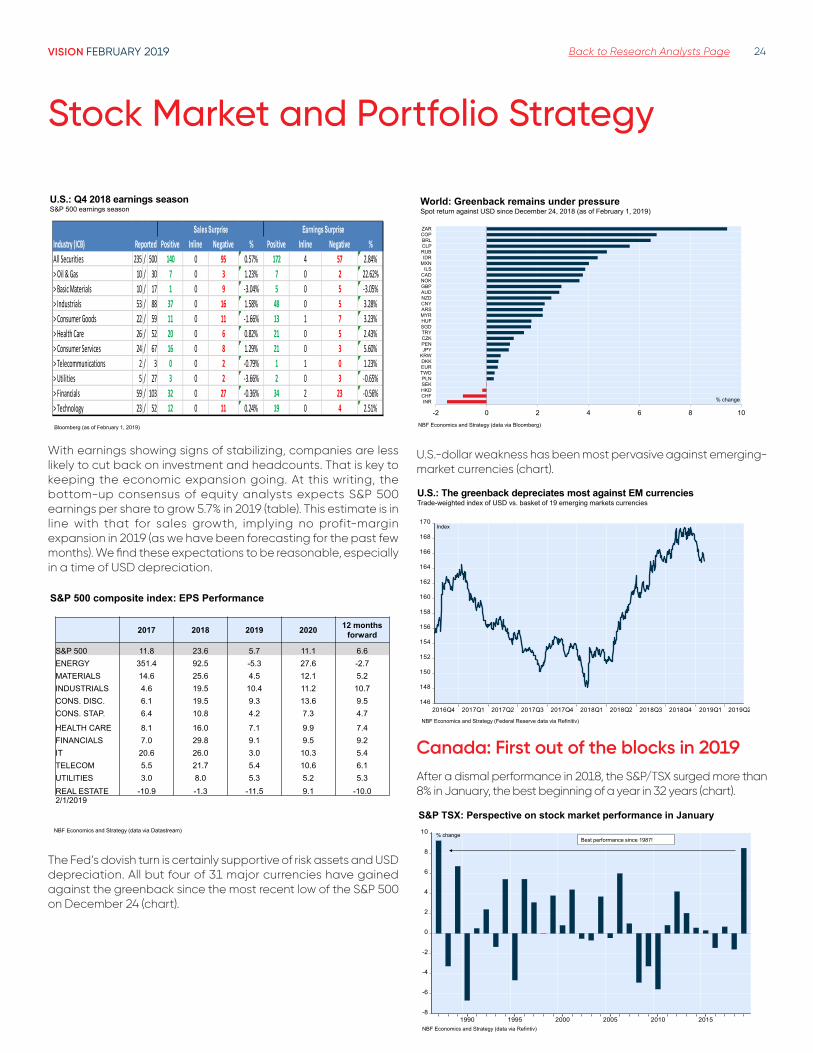
Employment growth remained strong in January with a net addition of 304,000 payroll jobs. With 12-month wage inflation running at 3.2%, we expect household spending to remain resilient in the months ahead. As for Q4 profits, things are actually not so bad. At this writing, just about halfway through the announcement season, 74% of the S&P 500 companies have reported better-than-expected earnings and 60% have reported better revenues (table).
VISION FEBRUARY 2019 Back to Research Analysts Page 24
Industry (ICB) Positive Inline Negative % Positive Inline Negative %All Securities 235 / 500 140 0 95 0.57% 172 4 57 2.84%> Oil & Gas 10 / 30 7 0 3 1.23% 7 0 2 22.62%> Basic Materials 10 / 17 1 0 9 -3.04% 5 0 5 -3.05%> Industrials 53 / 88 37 0 16 1.58% 48 0 5 3.28%> Consumer Goods 22 / 59 11 0 11 -1.66% 13 1 7 3.23%> Health Care 26 / 52 20 0 6 0.82% 21 0 5 2.43%> Consumer Services 24 / 67 16 0 8 1.29% 21 0 3 5.60%> Telecommunications 2 / 3 0 0 2 -0.79% 1 1 0 1.23%> Utilities 5 / 27 3 0 2 -3.66% 2 0 3 -0.65%> Financials 59 / 103 32 0 27 -0.36% 34 2 23 -0.56%> Technology 23 / 52 12 0 11 0.24% 19 0 4 2.51%
Sales Surprise Earnings SurpriseReported
U.S.: Q4 2018 earnings seasonS&P 500 earnings season
Bloomberg (as of February 1, 2019)
With earnings showing signs of stabilizing, companies are less likely to cut back on investment and headcounts. That is key to keeping the economic expansion going. At this writing, the bottom-up consensus of equity analysts expects S&P 500 earnings per share to grow 5.7% in 2019 (table). This estimate is in line with that for sales growth, implying no profit-margin expansion in 2019 (as we have been forecasting for the past few months). We find these expectations to be reasonable, especially in a time of USD depreciation.
S&P 500 composite index: EPS Performance
NBF Economics and Strategy (data via Datastream)
2017 2018 2019 2020 12 months forward
S&P 500 11.8 23.6 5.7 11.1 6.6ENERGY 351.4 92.5 -5.3 27.6 -2.7MATERIALS 14.6 25.6 4.5 12.1 5.2INDUSTRIALS 4.6 19.5 10.4 11.2 10.7CONS. DISC. 6.1 19.5 9.3 13.6 9.5CONS. STAP. 6.4 10.8 4.2 7.3 4.7
HEALTH CARE 8.1 16.0 7.1 9.9 7.4FINANCIALS 7.0 29.8 9.1 9.5 9.2IT 20.6 26.0 3.0 10.3 5.4TELECOM 5.5 21.7 5.4 10.6 6.1UTILITIES 3.0 8.0 5.3 5.2 5.3REAL ESTATE -10.9 -1.3 -11.5 9.1 -10.02/1/2019
The Fed’s dovish turn is certainly supportive of risk assets and USD depreciation. All but four of 31 major currencies have gained against the greenback since the most recent low of the S&P 500 on December 24 (chart).
-2 0 2 4 6 8 10INR
CHFHKDSEKPLN
TWDEURDKK
KRWJPYPENCZKTRYSGDHUFMYRARSCNYNZDAUDGBPNOKCAD
ILSMXNIDR
RUBCLPBRLCOPZAR
World: Greenback remains under pressureSpot return against USD since December 24, 2018 (as of February 1, 2019)
NBF Economics and Strategy (data via Bloomberg)
% change
U.S.-dollar weakness has been most pervasive against emerging-market currencies (chart).
146
148
150
152
154
156
158
160
162
164
166
168
170
2016Q4 2017Q1 2017Q2 2017Q3 2017Q4 2018Q1 2018Q2 2018Q3 2018Q4 2019Q1 2019Q2
U.S.: The greenback depreciates most against EM currenciesTrade-weighted index of USD vs. basket of 19 emerging markets currencies
NBF Economics and Strategy (Federal Reserve data via Refinitiv)
Index
Canada: First out of the blocks in 2019After a dismal performance in 2018, the S&P/TSX surged more than 8% in January, the best beginning of a year in 32 years (chart).
-8
-6
-4
-2
0
2
4
6
8
10
1990 1995 2000 2005 2010 2015
S&P TSX: Perspective on stock market performance in January
% change
NBF Economics and Strategy (data via Refintiv)
Best performance since 1987!
Stock Market and Portfolio Strategy
VISION FEBRUARY 2019 Back to Research Analysts Page 25
Stock Market and Portfolio Strategy
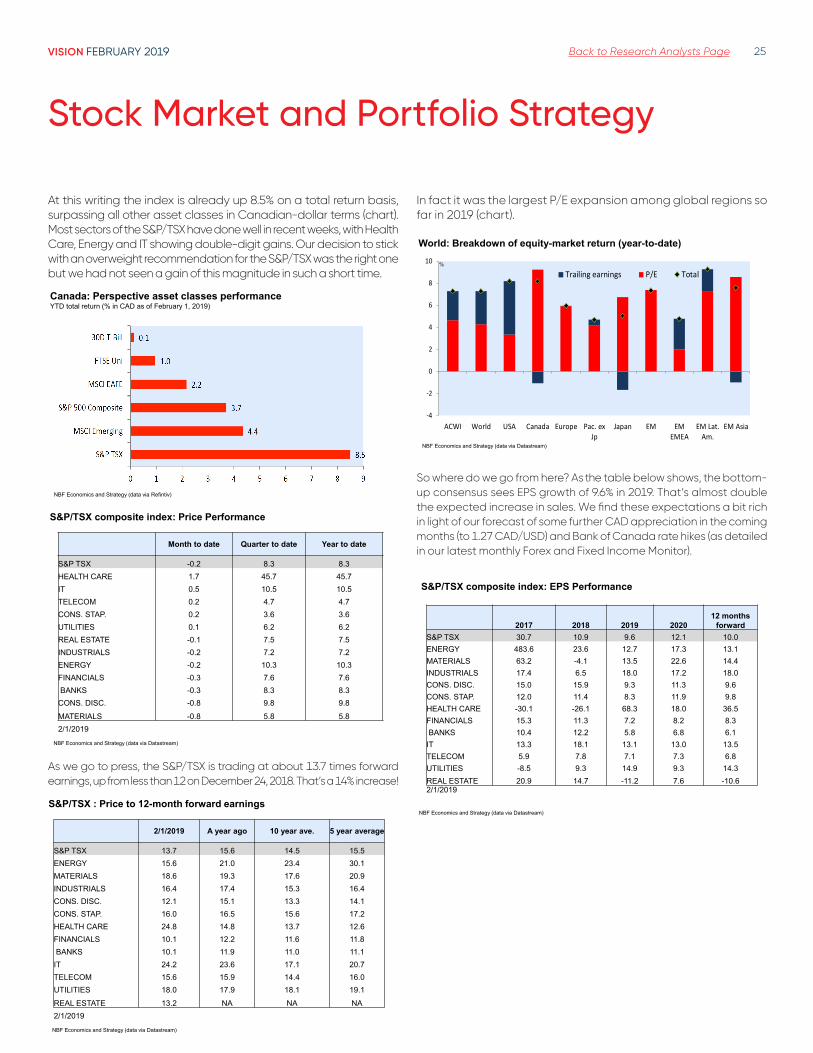
At this writing the index is already up 8.5% on a total return basis, surpassing all other asset classes in Canadian-dollar terms (chart). Most sectors of the S&P/TSX have done well in recent weeks, with Health Care, Energy and IT showing double-digit gains. Our decision to stick with an overweight recommendation for the S&P/TSX was the right one but we had not seen a gain of this magnitude in such a short time.
Canada: Perspective asset classes performanceYTD total return (% in CAD as of February 1, 2019)
NBF Economics and Strategy (data via Refintiv)
S&P/TSX composite index: Price Performance
NBF Economics and Strategy (data via Datastream)
Month to date Quarter to date Year to date
S&P TSX -0.2 8.3 8.3HEALTH CARE 1.7 45.7 45.7IT 0.5 10.5 10.5TELECOM 0.2 4.7 4.7CONS. STAP. 0.2 3.6 3.6UTILITIES 0.1 6.2 6.2REAL ESTATE -0.1 7.5 7.5INDUSTRIALS -0.2 7.2 7.2ENERGY -0.2 10.3 10.3FINANCIALS -0.3 7.6 7.6BANKS -0.3 8.3 8.3
CONS. DISC. -0.8 9.8 9.8MATERIALS -0.8 5.8 5.82/1/2019
As we go to press, the S&P/TSX is trading at about 13.7 times forward earnings, up from less than 12 on December 24, 2018. That’s a 14% increase!
S&P/TSX : Price to 12-month forward earnings
NBF Economics and Strategy (data via Datastream)
2/1/2019 A year ago 10 year ave. 5 year average
S&P TSX 13.7 15.6 14.5 15.5ENERGY 15.6 21.0 23.4 30.1MATERIALS 18.6 19.3 17.6 20.9INDUSTRIALS 16.4 17.4 15.3 16.4CONS. DISC. 12.1 15.1 13.3 14.1CONS. STAP. 16.0 16.5 15.6 17.2HEALTH CARE 24.8 14.8 13.7 12.6FINANCIALS 10.1 12.2 11.6 11.8BANKS 10.1 11.9 11.0 11.1
IT 24.2 23.6 17.1 20.7TELECOM 15.6 15.9 14.4 16.0UTILITIES 18.0 17.9 18.1 19.1REAL ESTATE 13.2 NA NA NA2/1/2019
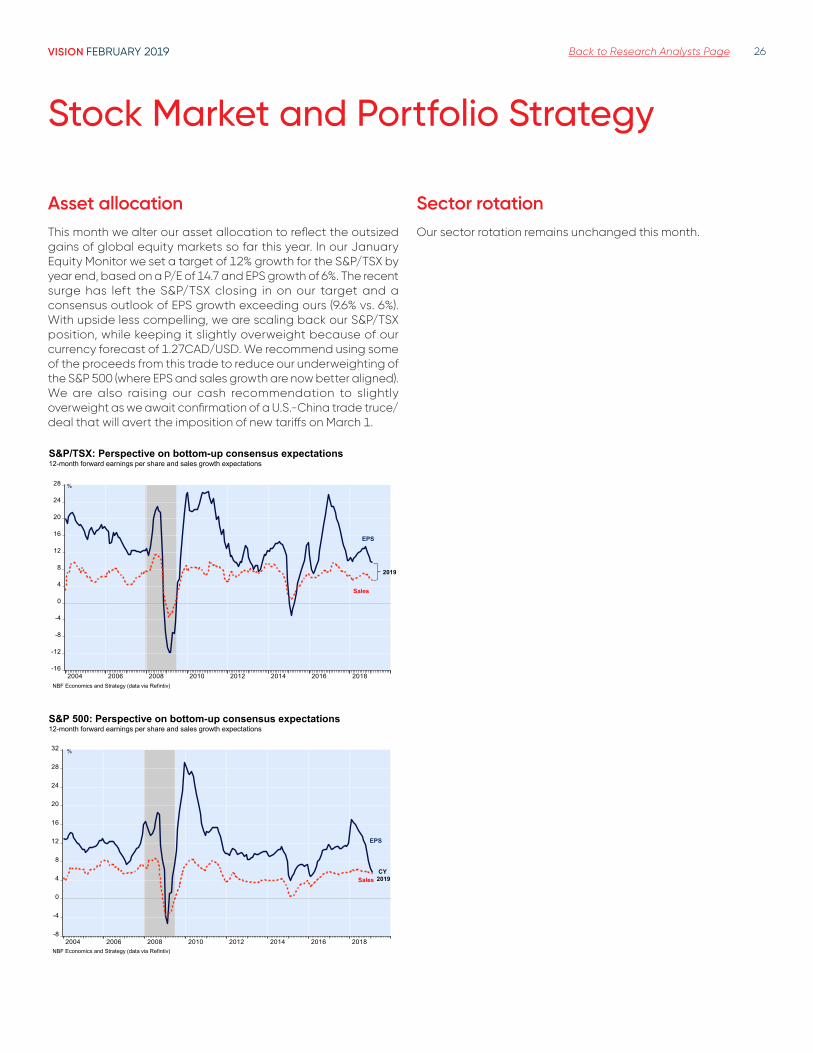
In fact it was the largest P/E expansion among global regions so far in 2019 (chart).
%
-4
-2
0
2
4
6
8
10
ACWI World USA Canada Europe Pac. exJp
Japan EM EMEMEA
EM Lat.Am.
EM Asia
Trailing earnings P/E Total
World: Breakdown of equity-market return (year-to-date)
NBF Economics and Strategy (data via Datastream)
%
So where do we go from here? As the table below shows, the bottom-up consensus sees EPS growth of 9.6% in 2019. That’s almost double the expected increase in sales. We find these expectations a bit rich in light of our forecast of some further CAD appreciation in the coming months (to 1.27 CAD/USD) and Bank of Canada rate hikes (as detailed in our latest monthly Forex and Fixed Income Monitor).
S&P/TSX composite index: EPS Performance
NBF Economics and Strategy (data via Datastream)
2017 2018 2019 202012 months
forwardS&P TSX 30.7 10.9 9.6 12.1 10.0ENERGY 483.6 23.6 12.7 17.3 13.1MATERIALS 63.2 -4.1 13.5 22.6 14.4INDUSTRIALS 17.4 6.5 18.0 17.2 18.0CONS. DISC. 15.0 15.9 9.3 11.3 9.6CONS. STAP. 12.0 11.4 8.3 11.9 9.8HEALTH CARE -30.1 -26.1 68.3 18.0 36.5FINANCIALS 15.3 11.3 7.2 8.2 8.3BANKS 10.4 12.2 5.8 6.8 6.1
IT 13.3 18.1 13.1 13.0 13.5TELECOM 5.9 7.8 7.1 7.3 6.8UTILITIES -8.5 9.3 14.9 9.3 14.3REAL ESTATE 20.9 14.7 -11.2 7.6 -10.62/1/2019
VISION FEBRUARY 2019 Back to Research Analysts Page 26
Asset allocationThis month we alter our asset allocation to reflect the outsized gains of global equity markets so far this year. In our January Equity Monitor we set a target of 12% growth for the S&P/TSX by year end, based on a P/E of 14.7 and EPS growth of 6%. The recent surge has left the S&P/TSX closing in on our target and a consensus outlook of EPS growth exceeding ours (9.6% vs. 6%). With upside less compelling, we are scaling back our S&P/TSX position, while keeping it slightly overweight because of our currency forecast of 1.27CAD/USD. We recommend using some of the proceeds from this trade to reduce our underweighting of the S&P 500 (where EPS and sales growth are now better aligned). We are also raising our cash recommendation to slightly overweight as we await confirmation of a U.S.-China trade truce/deal that will avert the imposition of new tariffs on March 1.
-16
-12
-8
-4
0
4
8
12
16
20
24
28
2004 2006 2008 2010 2012 2014 2016 2018
S&P/TSX: Perspective on bottom-up consensus expectations12-month forward earnings per share and sales growth expectations
%
NBF Economics and Strategy (data via Refintiv)
Sales
EPS
2019
-8
-4
0
4
8
12
16
20
24
28
32
2004 2006 2008 2010 2012 2014 2016 2018
S&P 500: Perspective on bottom-up consensus expectations12-month forward earnings per share and sales growth expectations
%
NBF Economics and Strategy (data via Refintiv)
Sales
EPS
CY2019
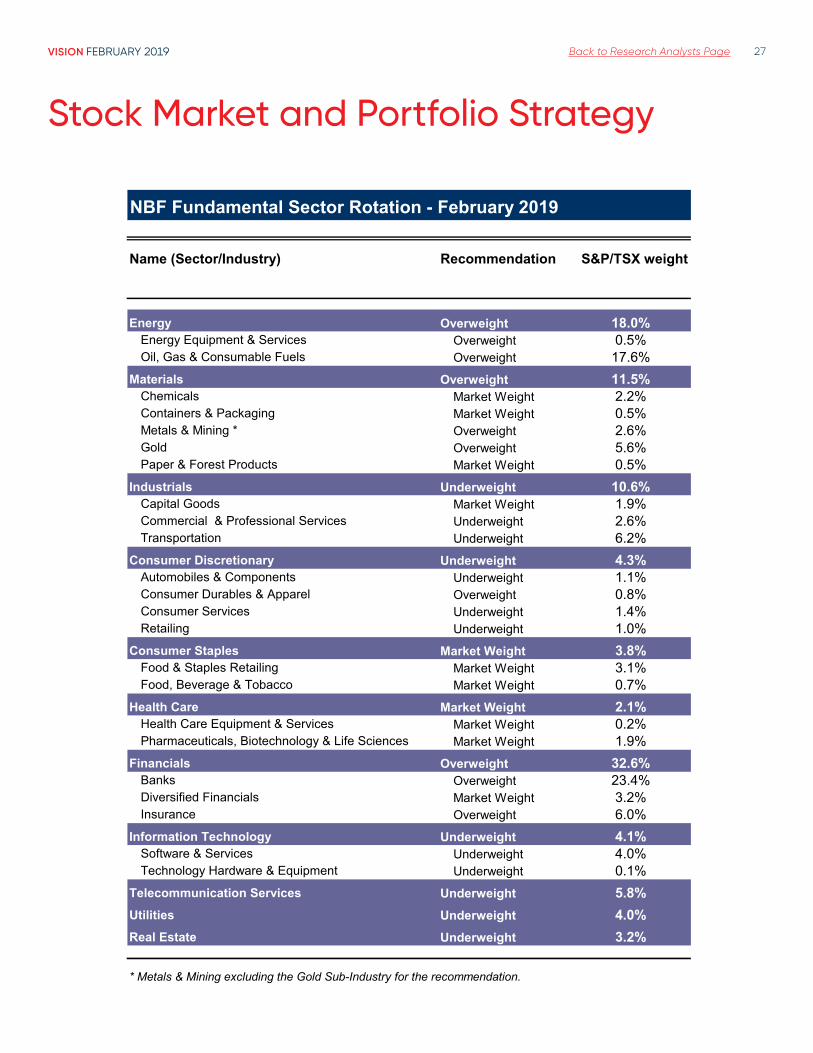
Sector rotationOur sector rotation remains unchanged this month.
Stock Market and Portfolio Strategy
VISION FEBRUARY 2019 Back to Research Analysts Page 27
Stock Market and Portfolio Strategy
NBF Fundamental Sector Rotation - February 2019
Name (Sector/Industry) Recommendation S&P/TSX weight
Energy Overweight 18.0%Energy Equipment & Services Overweight 0.5%Oil, Gas & Consumable Fuels Overweight 17.6%
Materials Overweight 11.5%Chemicals Market Weight 2.2%Containers & Packaging Market Weight 0.5%Metals & Mining * Overweight 2.6%Gold Overweight 5.6%Paper & Forest Products Market Weight 0.5%
Industrials Underweight 10.6%Capital Goods Market Weight 1.9%Commercial & Professional Services Underweight 2.6%Transportation Underweight 6.2%
Consumer Discretionary Underweight 4.3%Automobiles & Components Underweight 1.1%Consumer Durables & Apparel Overweight 0.8%Consumer Services Underweight 1.4%Retailing Underweight 1.0%
Consumer Staples Market Weight 3.8%Food & Staples Retailing Market Weight 3.1%Food, Beverage & Tobacco Market Weight 0.7%
Health Care Market Weight 2.1%Health Care Equipment & Services Market Weight 0.2%Pharmaceuticals, Biotechnology & Life Sciences Market Weight 1.9%
Financials Overweight 32.6%Banks Overweight 23.4%Diversified Financials Market Weight 3.2%Insurance Overweight 6.0%
Information Technology Underweight 4.1%Software & Services Underweight 4.0%Technology Hardware & Equipment Underweight 0.1%
Telecommunication Services Underweight 5.8%Utilities Underweight 4.0%Real Estate Underweight 3.2%
* Metals & Mining excluding the Gold Sub-Industry for the recommendation.
VISION FEBRUARY 2019 Back to Research Analysts Page 28
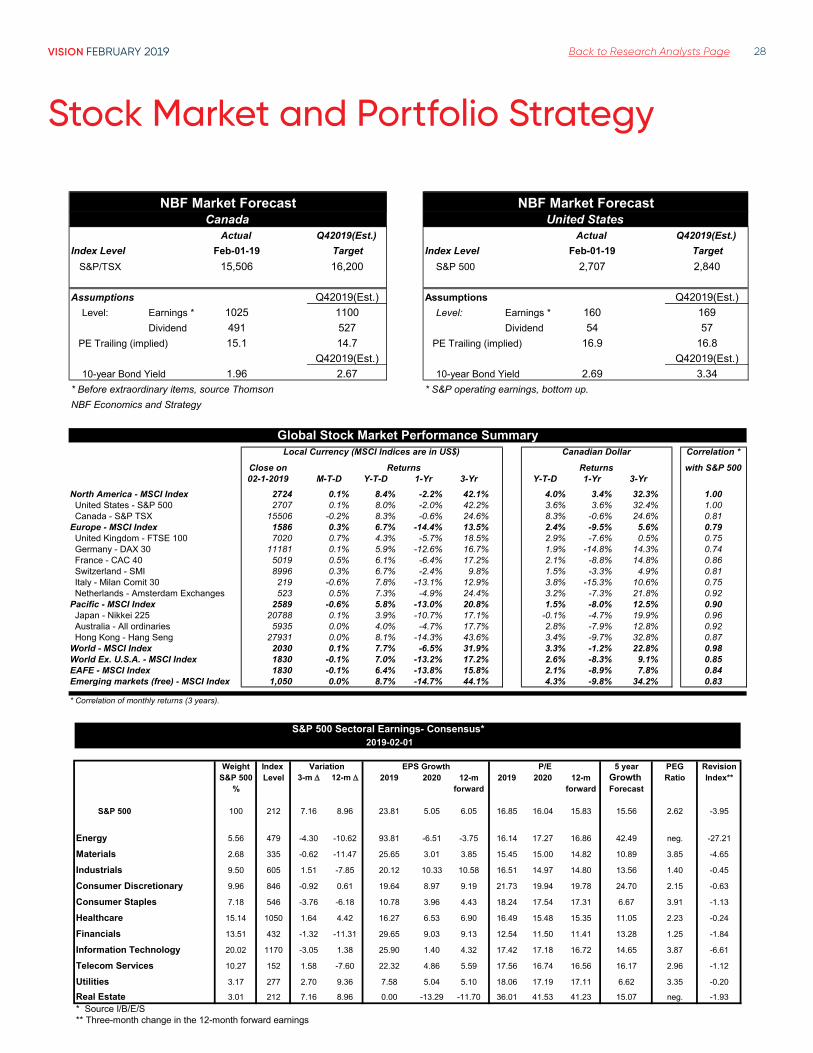
Actual Q42019(Est.) Actual Q42019(Est.)Index Level Feb-01-19 Target Index Level Feb-01-19 Target S&P/TSX 15,506 16,200 S&P 500 2,707 2,840
Assumptions Q42019(Est.) Assumptions Q42019(Est.) Level: Earnings * 1025 1100 Level: Earnings * 160 169
Dividend 491 527 Dividend 54 57PE Trailing (implied) 15.1 14.7 PE Trailing (implied) 16.9 16.8
Q42019(Est.) Q42019(Est.) 10-year Bond Yield 1.96 2.67 10-year Bond Yield 2.69 3.34* Before extraordinary items, source Thomson * S&P operating earnings, bottom up.NBF Economics and Strategy
NBF Market Forecast NBF Market ForecastCanada United States
Stock Market and Portfolio Strategy
Local Currency (MSCI Indices are in US$) Canadian Dollar Correlation *
Close on with S&P 50002-1-2019 M-T-D Y-T-D 1-Yr 3-Yr Y-T-D 1-Yr 3-Yr
North America - MSCI Index 2724 0.1% 8.4% -2.2% 42.1% 4.0% 3.4% 32.3% 1.00 United States - S&P 500 2707 0.1% 8.0% -2.0% 42.2% 3.6% 3.6% 32.4% 1.00 Canada - S&P TSX 15506 -0.2% 8.3% -0.6% 24.6% 8.3% -0.6% 24.6% 0.81Europe - MSCI Index 1586 0.3% 6.7% -14.4% 13.5% 2.4% -9.5% 5.6% 0.79 United Kingdom - FTSE 100 7020 0.7% 4.3% -5.7% 18.5% 2.9% -7.6% 0.5% 0.75 Germany - DAX 30 11181 0.1% 5.9% -12.6% 16.7% 1.9% -14.8% 14.3% 0.74 France - CAC 40 5019 0.5% 6.1% -6.4% 17.2% 2.1% -8.8% 14.8% 0.86 Switzerland - SMI 8996 0.3% 6.7% -2.4% 9.8% 1.5% -3.3% 4.9% 0.81 Italy - Milan Comit 30 219 -0.6% 7.8% -13.1% 12.9% 3.8% -15.3% 10.6% 0.75 Netherlands - Amsterdam Exchanges 523 0.5% 7.3% -4.9% 24.4% 3.2% -7.3% 21.8% 0.92Pacific - MSCI Index 2589 -0.6% 5.8% -13.0% 20.8% 1.5% -8.0% 12.5% 0.90 Japan - Nikkei 225 20788 0.1% 3.9% -10.7% 17.1% -0.1% -4.7% 19.9% 0.96 Australia - All ordinaries 5935 0.0% 4.0% -4.7% 17.7% 2.8% -7.9% 12.8% 0.92 Hong Kong - Hang Seng 27931 0.0% 8.1% -14.3% 43.6% 3.4% -9.7% 32.8% 0.87World - MSCI Index 2030 0.1% 7.7% -6.5% 31.9% 3.3% -1.2% 22.8% 0.98World Ex. U.S.A. - MSCI Index 1830 -0.1% 7.0% -13.2% 17.2% 2.6% -8.3% 9.1% 0.85EAFE - MSCI Index 1830 -0.1% 6.4% -13.8% 15.8% 2.1% -8.9% 7.8% 0.84Emerging markets (free) - MSCI Index 1,050 0.0% 8.7% -14.7% 44.1% 4.3% -9.8% 34.2% 0.83
* Correlation of monthly returns (3 years).
Global Stock Market Performance Summary
Returns Returns
S&P 500 Sectoral Earnings- Consensus*2019-02-01
Weight Index 5 year PEG RevisionS&P 500 Level 3-m D 12-m D 2019 2020 12-m 2019 2020 12-m Growth Ratio Index**
% forward forward Forecast
S&P 500 100 212 7.16 8.96 23.81 5.05 6.05 16.85 16.04 15.83 15.56 2.62 -3.95
Energy 5.56 479 -4.30 -10.62 93.81 -6.51 -3.75 16.14 17.27 16.86 42.49 neg. -27.21
Materials 2.68 335 -0.62 -11.47 25.65 3.01 3.85 15.45 15.00 14.82 10.89 3.85 -4.65
Industrials 9.50 605 1.51 -7.85 20.12 10.33 10.58 16.51 14.97 14.80 13.56 1.40 -0.45
Consumer Discretionary 9.96 846 -0.92 0.61 19.64 8.97 9.19 21.73 19.94 19.78 24.70 2.15 -0.63
Consumer Staples 7.18 546 -3.76 -6.18 10.78 3.96 4.43 18.24 17.54 17.31 6.67 3.91 -1.13
Healthcare 15.14 1050 1.64 4.42 16.27 6.53 6.90 16.49 15.48 15.35 11.05 2.23 -0.24
Financials 13.51 432 -1.32 -11.31 29.65 9.03 9.13 12.54 11.50 11.41 13.28 1.25 -1.84
Information Technology 20.02 1170 -3.05 1.38 25.90 1.40 4.32 17.42 17.18 16.72 14.65 3.87 -6.61
Telecom Services 10.27 152 1.58 -7.60 22.32 4.86 5.59 17.56 16.74 16.56 16.17 2.96 -1.12
Utilities 3.17 277 2.70 9.36 7.58 5.04 5.10 18.06 17.19 17.11 6.62 3.35 -0.20
Real Estate 3.01 212 7.16 8.96 0.00 -13.29 -11.70 36.01 41.53 41.23 15.07 neg. -1.93* Source I/B/E/S** Three-month change in the 12-month forward earnings
Variation EPS Growth P/E
VISION FEBRUARY 2019 Back to Research Analysts Page 29
Technical Analysis
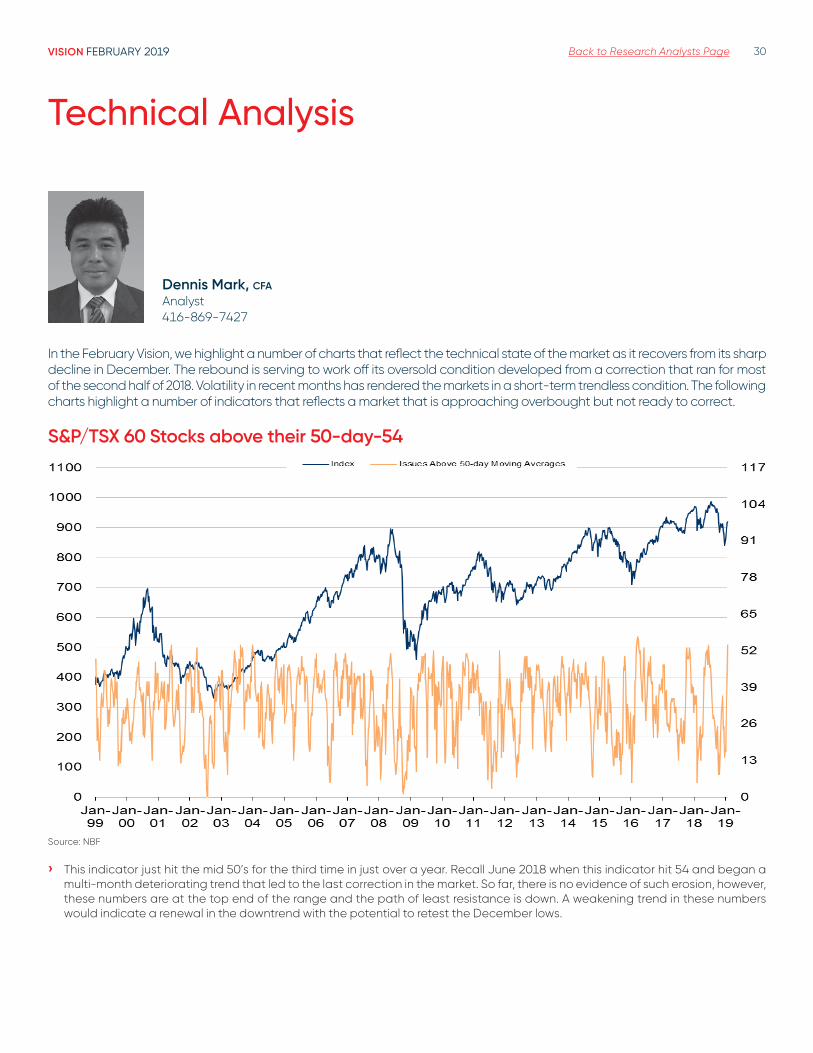
VISION FEBRUARY 2019 Back to Research Analysts Page 30
In the February Vision, we highlight a number of charts that reflect the technical state of the market as it recovers from its sharp decline in December. The rebound is serving to work off its oversold condition developed from a correction that ran for most of the second half of 2018. Volatility in recent months has rendered the markets in a short-term trendless condition. The following charts highlight a number of indicators that reflects a market that is approaching overbought but not ready to correct.
S&P/TSX 60 Stocks above their 50-day-54
Source: NBF › This indicator just hit the mid 50’s for the third time in just over a year. Recall June 2018 when this indicator hit 54 and began a
multi-month deteriorating trend that led to the last correction in the market. So far, there is no evidence of such erosion, however, these numbers are at the top end of the range and the path of least resistance is down. A weakening trend in these numbers would indicate a renewal in the downtrend with the potential to retest the December lows.
Technical Analysis
Dennis Mark, cfa Analyst 416-869-7427
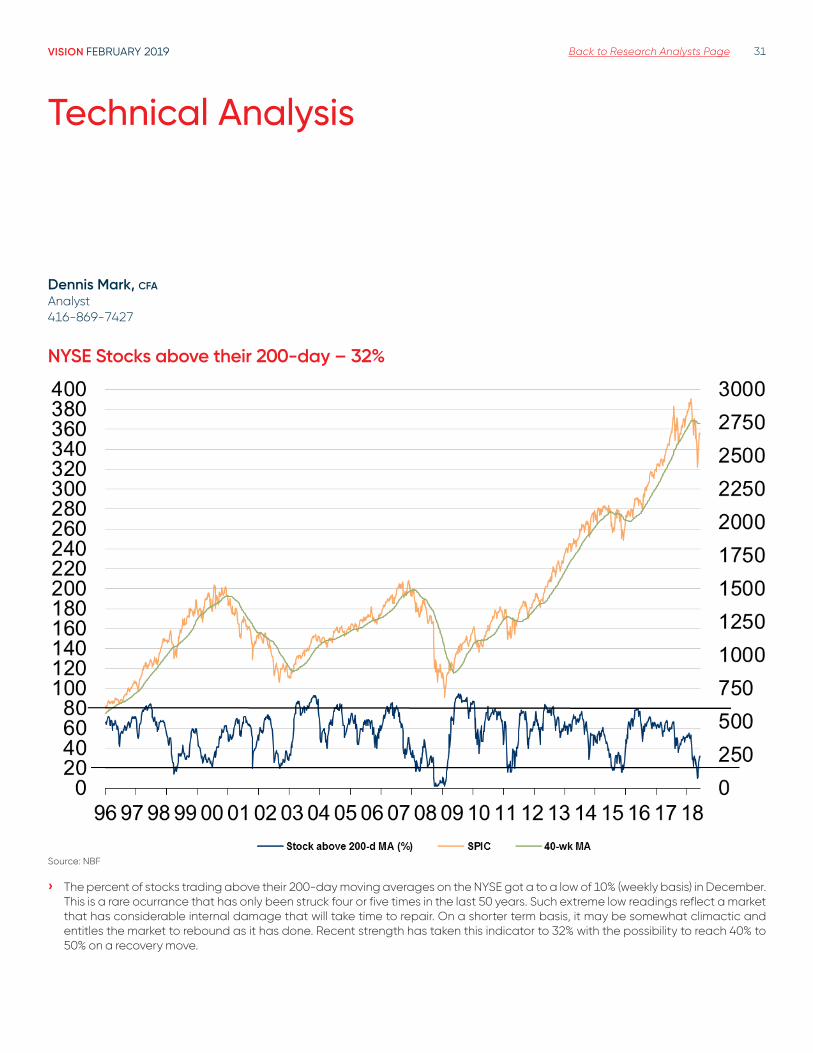
VISION FEBRUARY 2019 Back to Research Analysts Page 31
Dennis Mark, cfa Analyst 416-869-7427
NYSE Stocks above their 200-day – 32%
Source: NBF
› The percent of stocks trading above their 200-day moving averages on the NYSE got a to a low of 10% (weekly basis) in December. This is a rare ocurrance that has only been struck four or five times in the last 50 years. Such extreme low readings reflect a market that has considerable internal damage that will take time to repair. On a shorter term basis, it may be somewhat climactic and entitles the market to rebound as it has done. Recent strength has taken this indicator to 32% with the possibility to reach 40% to 50% on a recovery move.
Technical Analysis
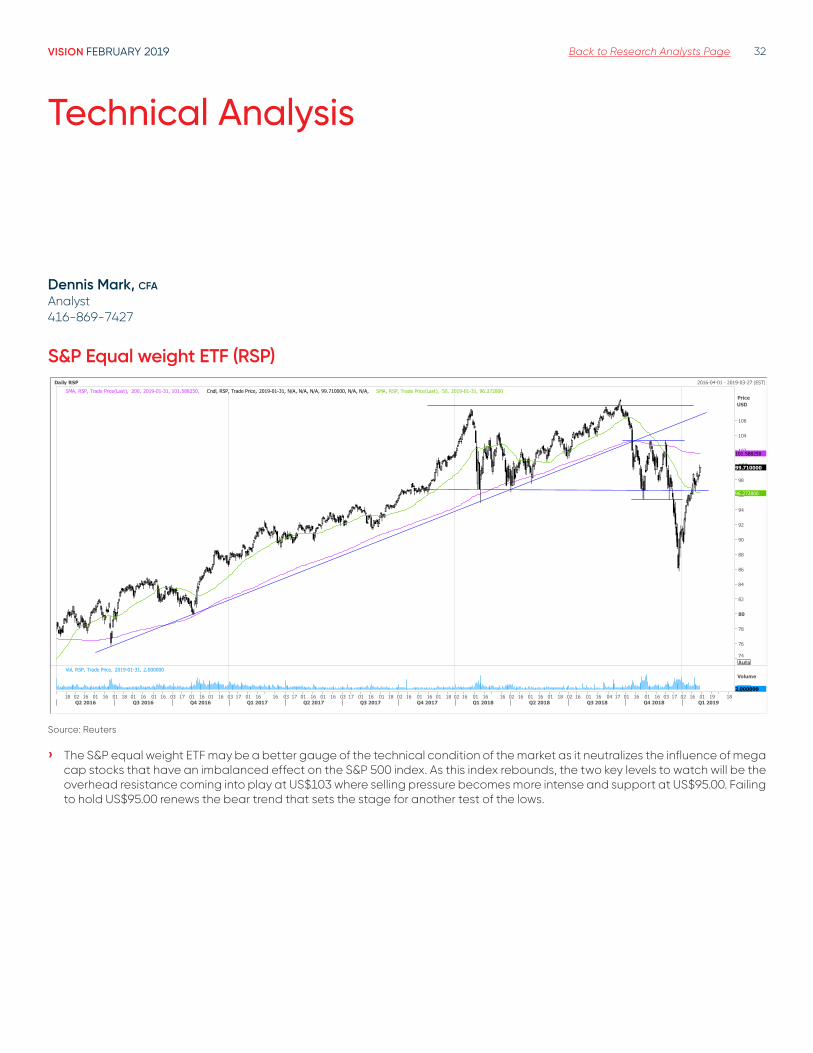
VISION FEBRUARY 2019 Back to Research Analysts Page 32
Technical Analysis
Dennis Mark, cfa Analyst 416-869-7427
S&P Equal weight ETF (RSP)Daily RSP 2016-04-01 - 2019-03-27 (EST)
SMA, RSP, Trade Price(Last), 200, 2019-01-31, 101.588250, Cndl, RSP, Trade Price, 2019-01-31, N/A, N/A, N/A, 99.710000, N/A, N/A, SMA, RSP, Trade Price(Last), 50, 2019-01-31, 96.272800PriceUSD
Auto74
76
78
80
82
84
86
88
90
92
94
96
98
100
102
104
106
101.588250
99.710000
96.272800
Vol, RSP, Trade Price, 2019-01-31, 2.000000Volume
Auto2.000000 18 02 16 01 16 01 18 01 16 01 16 03 17 01 16 01 16 03 17 01 16 16 03 17 01 16 01 16 03 17 01 16 01 18 02 16 01 16 01 18 02 16 01 16 16 02 16 01 16 01 18 02 16 01 16 04 17 01 16 01 16 03 17 02 16 01 19 18
Q2 2016 Q3 2016 Q4 2016 Q1 2017 Q2 2017 Q3 2017 Q4 2017 Q1 2018 Q2 2018 Q3 2018 Q4 2018 Q1 2019 Source: Reuters
› The S&P equal weight ETF may be a better gauge of the technical condition of the market as it neutralizes the influence of mega cap stocks that have an imbalanced effect on the S&P 500 index. As this index rebounds, the two key levels to watch will be the overhead resistance coming into play at US$103 where selling pressure becomes more intense and support at US$95.00. Failing to hold US$95.00 renews the bear trend that sets the stage for another test of the lows.
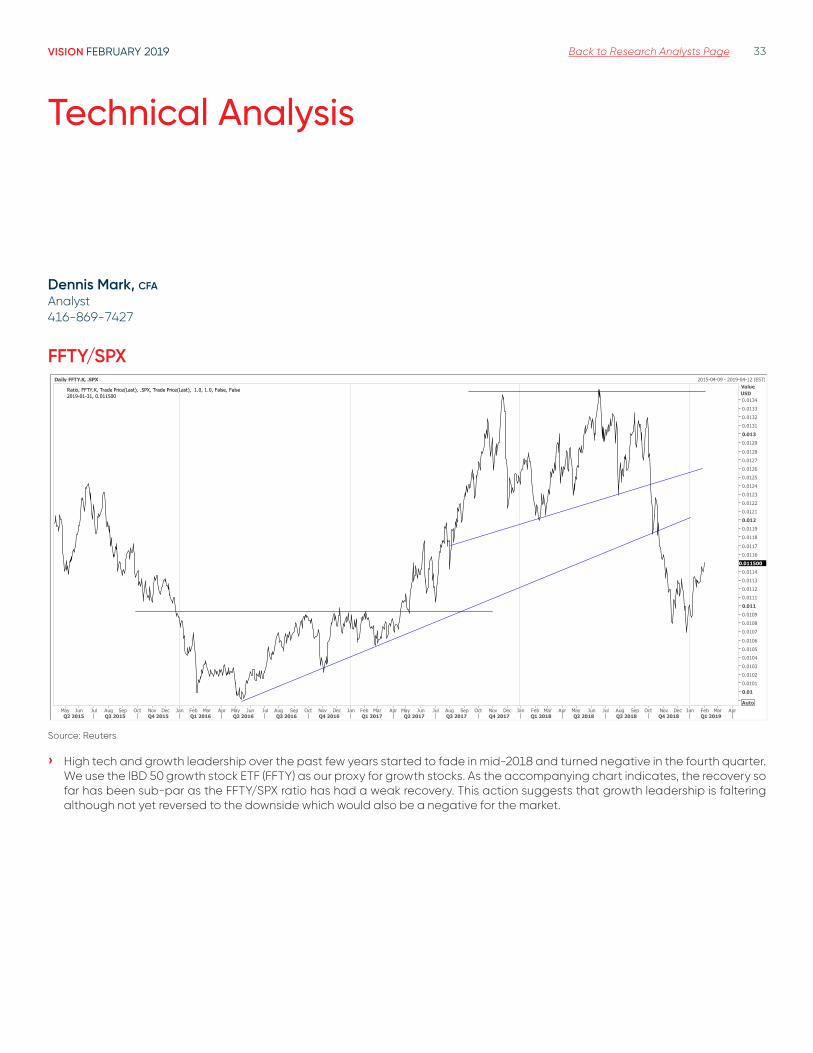
VISION FEBRUARY 2019 Back to Research Analysts Page 33
Technical Analysis
FFTY/SPXDaily FFTY.K, .SPX 2015-04-09 - 2019-04-12 (EST)
Ratio, FFTY.K, Trade Price(Last), .SPX, Trade Price(Last), 1.0, 1.0, False, False2019-01-31, 0.011500
ValueUSD
Auto
0.010.01010.01020.01030.01040.01050.0106
0.01070.01080.01090.0110.01110.01120.01130.01140.01150.01160.0117
0.01180.01190.0120.01210.01220.01230.01240.01250.01260.01270.01280.01290.0130.01310.01320.01330.0134
0.011500
May Jun Jul Aug Sep Oct Nov Dec Jan Feb Mar Apr May Jun Jul Aug Sep Oct Nov Dec Jan Feb Mar Apr May Jun Jul Aug Sep Oct Nov Dec Jan Feb Mar Apr May Jun Jul Aug Sep Oct Nov Dec Jan Feb Mar AprQ2 2015 Q3 2015 Q4 2015 Q1 2016 Q2 2016 Q3 2016 Q4 2016 Q1 2017 Q2 2017 Q3 2017 Q4 2017 Q1 2018 Q2 2018 Q3 2018 Q4 2018 Q1 2019
Source: Reuters
› High tech and growth leadership over the past few years started to fade in mid-2018 and turned negative in the fourth quarter. We use the IBD 50 growth stock ETF (FFTY) as our proxy for growth stocks. As the accompanying chart indicates, the recovery so far has been sub-par as the FFTY/SPX ratio has had a weak recovery. This action suggests that growth leadership is faltering although not yet reversed to the downside which would also be a negative for the market.
Dennis Mark, cfa Analyst 416-869-7427
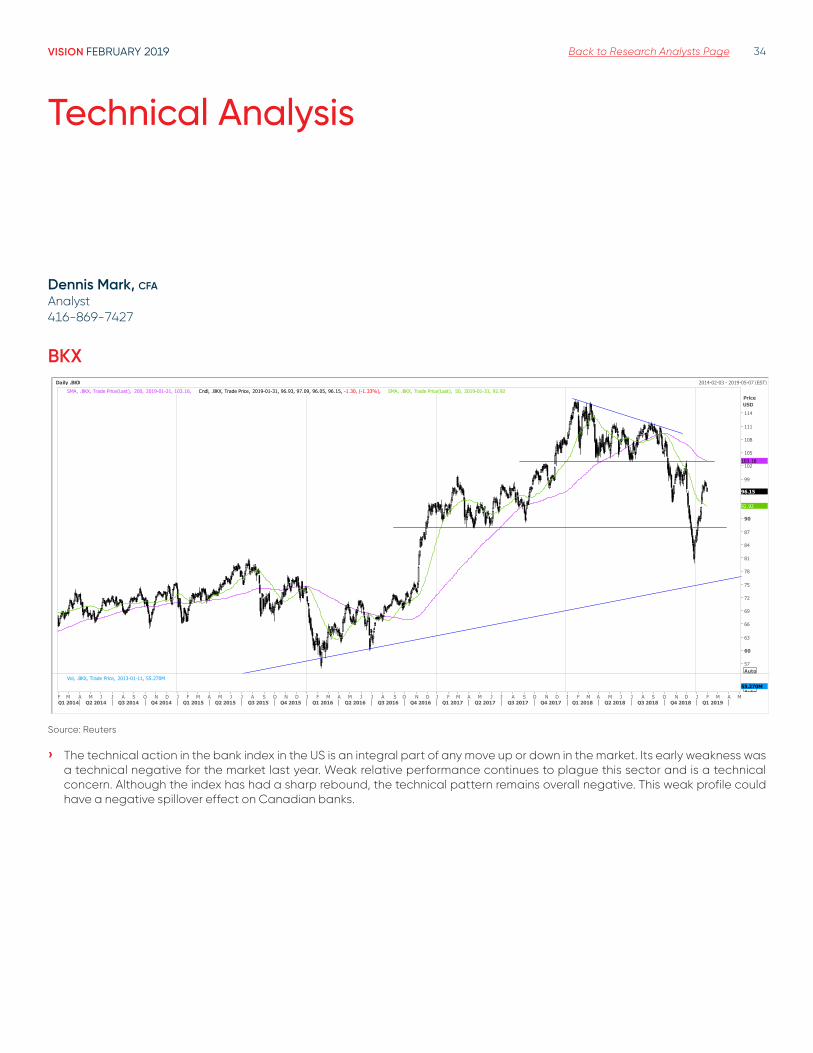
VISION FEBRUARY 2019 Back to Research Analysts Page 34
Technical Analysis
Dennis Mark, cfa Analyst 416-869-7427
BKX Daily .BKX 2014-02-03 - 2019-05-07 (EST)
SMA, .BKX, Trade Price(Last), 200, 2019-01-31, 103.16, Cndl, .BKX, Trade Price, 2019-01-31, 96.93, 97.09, 96.05, 96.15, -1.30, (-1.33%), SMA, .BKX, Trade Price(Last), 50, 2019-01-31, 92.92PriceUSD
Auto57
60
63
66
69
72
75
78
81
84
87
90
93
96
99
102
105
108
111
114
103.16
96.15
92.92
Vol, .BKX, Trade Price, 2013-01-11, 55.270MVolumeAuto
55.270M
F M A M J J A S O N D J F M A M J J A S O N D J F M A M J J A S O N D J F M A M J J A S O N D J F M A M J J A S O N D J F M A MQ1 2014 Q2 2014 Q3 2014 Q4 2014 Q1 2015 Q2 2015 Q3 2015 Q4 2015 Q1 2016 Q2 2016 Q3 2016 Q4 2016 Q1 2017 Q2 2017 Q3 2017 Q4 2017 Q1 2018 Q2 2018 Q3 2018 Q4 2018 Q1 2019
Source: Reuters
› The technical action in the bank index in the US is an integral part of any move up or down in the market. Its early weakness was a technical negative for the market last year. Weak relative performance continues to plague this sector and is a technical concern. Although the index has had a sharp rebound, the technical pattern remains overall negative. This weak profile could have a negative spillover effect on Canadian banks.
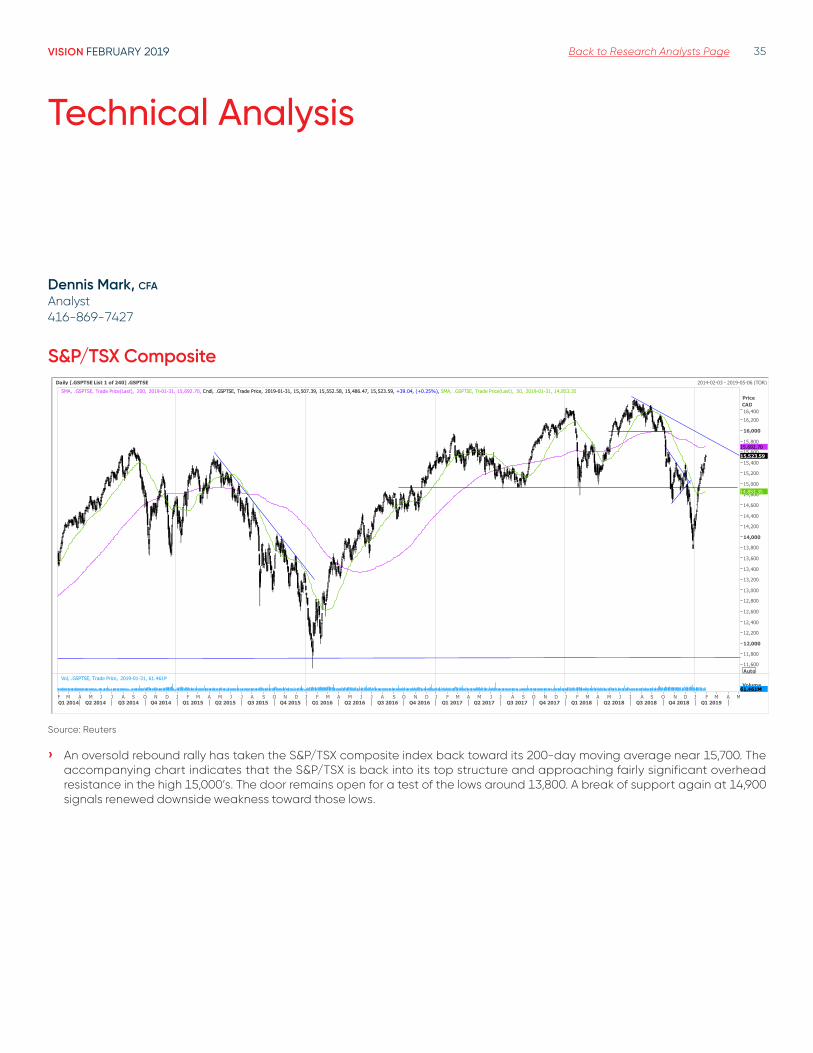
VISION FEBRUARY 2019 Back to Research Analysts Page 35
Technical Analysis
Dennis Mark, cfa Analyst 416-869-7427
S&P/TSX CompositeDaily [.GSPTSE List 1 of 240] .GSPTSE 2014-02-03 - 2019-05-06 (TOR)
SMA, .GSPTSE, Trade Price(Last), 200, 2019-01-31, 15,692.70, Cndl, .GSPTSE, Trade Price, 2019-01-31, 15,507.39, 15,552.58, 15,486.47, 15,523.59, +39.04, (+0.25%), SMA, .GSPTSE, Trade Price(Last), 50, 2019-01-31, 14,853.35PriceCAD
Auto11,600
11,800
12,000
12,200
12,400
12,600
12,800
13,000
13,200
13,400
13,600
13,800
14,000
14,200
14,400
14,600
14,800
15,000
15,200
15,400
15,600
15,800
16,000
16,20016,400
15,692.70
15,523.59
14,853.35
Vol, .GSPTSE, Trade Price, 2019-01-31, 61.461MVolumeAuto61.461M
F M A M J J A S O N D J F M A M J J A S O N D J F M A M J J A S O N D J F M A M J J A S O N D J F M A M J J A S O N D J F M A MQ1 2014 Q2 2014 Q3 2014 Q4 2014 Q1 2015 Q2 2015 Q3 2015 Q4 2015 Q1 2016 Q2 2016 Q3 2016 Q4 2016 Q1 2017 Q2 2017 Q3 2017 Q4 2017 Q1 2018 Q2 2018 Q3 2018 Q4 2018 Q1 2019
Source: Reuters
› An oversold rebound rally has taken the S&P/TSX composite index back toward its 200-day moving average near 15,700. The accompanying chart indicates that the S&P/TSX is back into its top structure and approaching fairly significant overhead resistance in the high 15,000’s. The door remains open for a test of the lows around 13,800. A break of support again at 14,900 signals renewed downside weakness toward those lows.
VISION FEBRUARY 2019 Back to Research Analysts Page 36
In this section, commentaries and stock closing prices are based on the information available up to January 31, 2019. Information in this section is based on NBF analysis and estimates and Thomson Reuters Eikon.
Sector Analysis
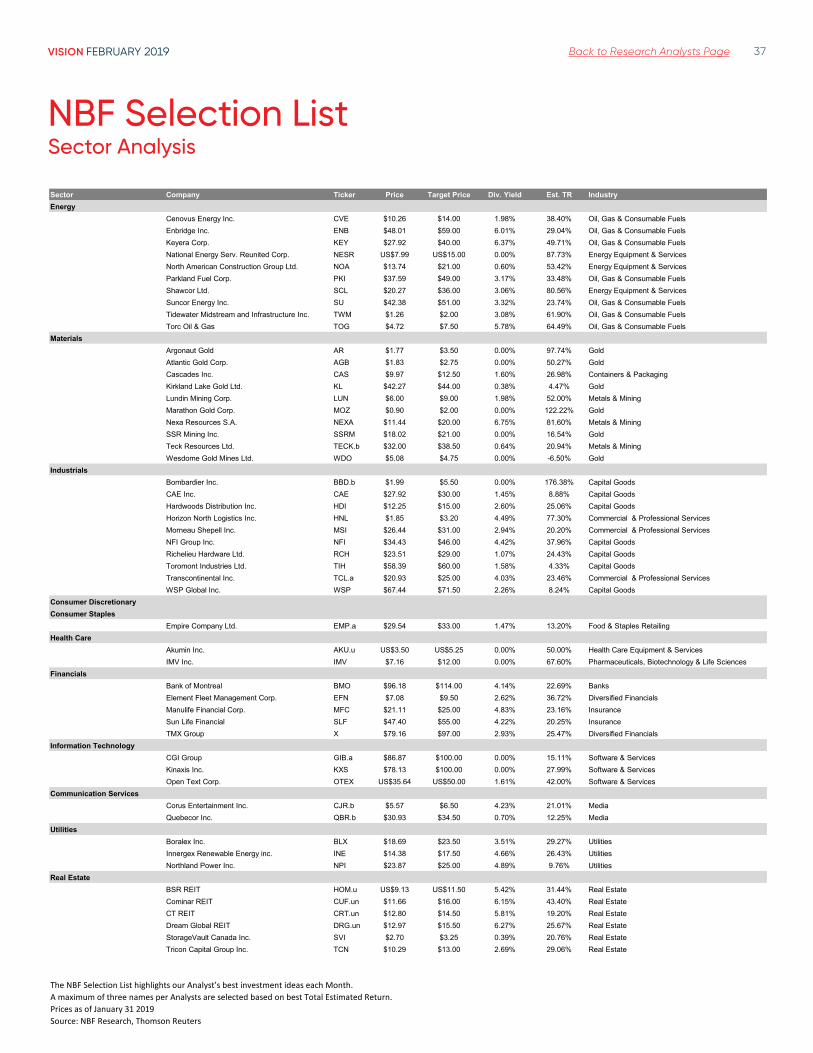
VISION FEBRUARY 2019 Back to Research Analysts Page 37
NBF Selection ListSector Analysis
Sector Company Ticker Price Target Price Div. Yield Est. TR IndustryEnergy
Cenovus Energy Inc. CVE $10.26 $14.00 1.98% 38.40% Oil, Gas & Consumable FuelsEnbridge Inc. ENB $48.01 $59.00 6.01% 29.04% Oil, Gas & Consumable FuelsKeyera Corp. KEY $27.92 $40.00 6.37% 49.71% Oil, Gas & Consumable FuelsNational Energy Serv. Reunited Corp. NESR US$7.99 US$15.00 0.00% 87.73% Energy Equipment & ServicesNorth American Construction Group Ltd. NOA $13.74 $21.00 0.60% 53.42% Energy Equipment & ServicesParkland Fuel Corp. PKI $37.59 $49.00 3.17% 33.48% Oil, Gas & Consumable FuelsShawcor Ltd. SCL $20.27 $36.00 3.06% 80.56% Energy Equipment & ServicesSuncor Energy Inc. SU $42.38 $51.00 3.32% 23.74% Oil, Gas & Consumable FuelsTidewater Midstream and Infrastructure Inc. TWM $1.26 $2.00 3.08% 61.90% Oil, Gas & Consumable FuelsTorc Oil & Gas TOG $4.72 $7.50 5.78% 64.49% Oil, Gas & Consumable Fuels
Materials Argonaut Gold AR $1.77 $3.50 0.00% 97.74% GoldAtlantic Gold Corp. AGB $1.83 $2.75 0.00% 50.27% GoldCascades Inc. CAS $9.97 $12.50 1.60% 26.98% Containers & PackagingKirkland Lake Gold Ltd. KL $42.27 $44.00 0.38% 4.47% GoldLundin Mining Corp. LUN $6.00 $9.00 1.98% 52.00% Metals & MiningMarathon Gold Corp. MOZ $0.90 $2.00 0.00% 122.22% GoldNexa Resources S.A. NEXA $11.44 $20.00 6.75% 81.60% Metals & MiningSSR Mining Inc. SSRM $18.02 $21.00 0.00% 16.54% GoldTeck Resources Ltd. TECK.b $32.00 $38.50 0.64% 20.94% Metals & MiningWesdome Gold Mines Ltd. WDO $5.08 $4.75 0.00% -6.50% Gold
Industrials Bombardier Inc. BBD.b $1.99 $5.50 0.00% 176.38% Capital GoodsCAE Inc. CAE $27.92 $30.00 1.45% 8.88% Capital GoodsHardwoods Distribution Inc. HDI $12.25 $15.00 2.60% 25.06% Capital GoodsHorizon North Logistics Inc. HNL $1.85 $3.20 4.49% 77.30% Commercial & Professional ServicesMorneau Shepell Inc. MSI $26.44 $31.00 2.94% 20.20% Commercial & Professional ServicesNFI Group Inc. NFI $34.43 $46.00 4.42% 37.96% Capital GoodsRichelieu Hardware Ltd. RCH $23.51 $29.00 1.07% 24.43% Capital GoodsToromont Industries Ltd. TIH $58.39 $60.00 1.58% 4.33% Capital GoodsTranscontinental Inc. TCL.a $20.93 $25.00 4.03% 23.46% Commercial & Professional ServicesWSP Global Inc. WSP $67.44 $71.50 2.26% 8.24% Capital Goods
Consumer Discretionary Consumer Staples
Empire Company Ltd. EMP.a $29.54 $33.00 1.47% 13.20% Food & Staples RetailingHealth Care
Akumin Inc. AKU.u US$3.50 US$5.25 0.00% 50.00% Health Care Equipment & ServicesIMV Inc. IMV $7.16 $12.00 0.00% 67.60% Pharmaceuticals, Biotechnology & Life Sciences
Financials Bank of Montreal BMO $96.18 $114.00 4.14% 22.69% BanksElement Fleet Management Corp. EFN $7.08 $9.50 2.62% 36.72% Diversified FinancialsManulife Financial Corp. MFC $21.11 $25.00 4.83% 23.16% InsuranceSun Life Financial SLF $47.40 $55.00 4.22% 20.25% InsuranceTMX Group X $79.16 $97.00 2.93% 25.47% Diversified Financials
Information Technology CGI Group GIB.a $86.87 $100.00 0.00% 15.11% Software & ServicesKinaxis Inc. KXS $78.13 $100.00 0.00% 27.99% Software & ServicesOpen Text Corp. OTEX US$35.64 US$50.00 1.61% 42.00% Software & Services
Communication Services Corus Entertainment Inc. CJR.b $5.57 $6.50 4.23% 21.01% MediaQuebecor Inc. QBR.b $30.93 $34.50 0.70% 12.25% Media
Utilities Boralex Inc. BLX $18.69 $23.50 3.51% 29.27% UtilitiesInnergex Renewable Energy inc. INE $14.38 $17.50 4.66% 26.43% UtilitiesNorthland Power Inc. NPI $23.87 $25.00 4.89% 9.76% Utilities
Real Estate BSR REIT HOM.u US$9.13 US$11.50 5.42% 31.44% Real EstateCominar REIT CUF.un $11.66 $16.00 6.15% 43.40% Real EstateCT REIT CRT.un $12.80 $14.50 5.81% 19.20% Real EstateDream Global REIT DRG.un $12.97 $15.50 6.27% 25.67% Real EstateStorageVault Canada Inc. SVI $2.70 $3.25 0.39% 20.76% Real EstateTricon Capital Group Inc. TCN $10.29 $13.00 2.69% 29.06% Real Estate
The NBF Selection List highlights our Analyst’s best investment ideas each Month.A maximum of three names per Analysts are selected based on best Total Estimated Return.Prices as of January 31 2019Source: NBF Research, Thomson Reuters
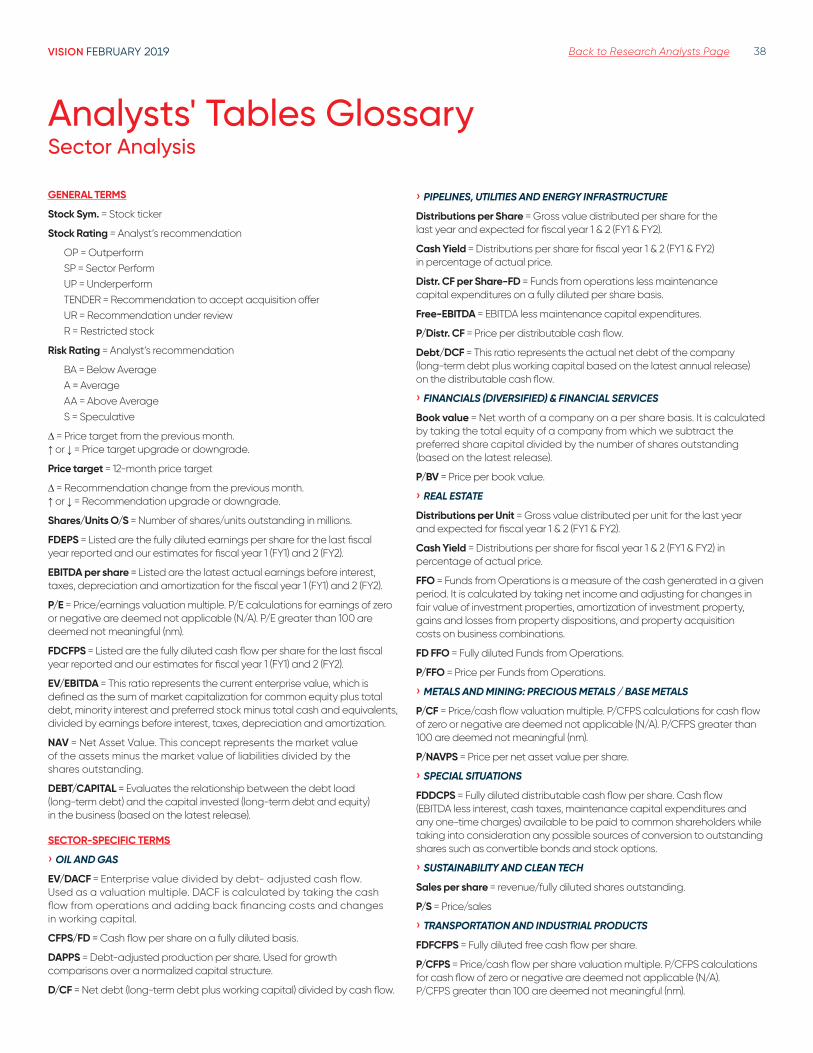
VISION FEBRUARY 2019 Back to Research Analysts Page 38
Analysts' Tables GlossarySector Analysis
GENERAL TERMS
Stock Sym. = Stock ticker
Stock Rating = Analyst’s recommendation
OP = Outperform SP = Sector Perform UP = Underperform TENDER = Recommendation to accept acquisition offer UR = Recommendation under review R = Restricted stock
Risk Rating = Analyst’s recommendation
BA = Below Average A = AverageAA = Above AverageS = Speculative
∆ = Price target from the previous month. ↑ or ↓ = Price target upgrade or downgrade.
Price target = 12-month price target
∆ = Recommendation change from the previous month. ↑ or ↓ = Recommendation upgrade or downgrade.
Shares/Units O/S = Number of shares/units outstanding in millions.
FDEPS = Listed are the fully diluted earnings per share for the last fiscal year reported and our estimates for fiscal year 1 (FY1) and 2 (FY2).
EBITDA per share = Listed are the latest actual earnings before interest, taxes, depreciation and amortization for the fiscal year 1 (FY1) and 2 (FY2).
P/E = Price/earnings valuation multiple. P/E calculations for earnings of zero or negative are deemed not applicable (N/A). P/E greater than 100 are deemed not meaningful (nm).
FDCFPS = Listed are the fully diluted cash flow per share for the last fiscal year reported and our estimates for fiscal year 1 (FY1) and 2 (FY2).
EV/EBITDA = This ratio represents the current enterprise value, which is defined as the sum of market capitalization for common equity plus total debt, minority interest and preferred stock minus total cash and equivalents, divided by earnings before interest, taxes, depreciation and amortization.
NAV = Net Asset Value. This concept represents the market value of the assets minus the market value of liabilities divided by the shares outstanding.
DEBT/CAPITAL = Evaluates the relationship between the debt load (long-term debt) and the capital invested (long-term debt and equity) in the business (based on the latest release).
SECTOR-SPECIFIC TERMS
› OIL AND GAS
EV/DACF = Enterprise value divided by debt- adjusted cash flow. Used as a valuation multiple. DACF is calculated by taking the cash flow from operations and adding back financing costs and changes in working capital.
CFPS/FD = Cash flow per share on a fully diluted basis.
DAPPS = Debt-adjusted production per share. Used for growth comparisons over a normalized capital structure.
D/CF = Net debt (long-term debt plus working capital) divided by cash flow.
› PIPELINES, UTILITIES AND ENERGY INFRASTRUCTURE
Distributions per Share = Gross value distributed per share for the last year and expected for fiscal year 1 & 2 (FY1 & FY2).
Cash Yield = Distributions per share for fiscal year 1 & 2 (FY1 & FY2) in percentage of actual price.
Distr. CF per Share-FD = Funds from operations less maintenance capital expenditures on a fully diluted per share basis.
Free-EBITDA = EBITDA less maintenance capital expenditures.
P/Distr. CF = Price per distributable cash flow.
Debt/DCF = This ratio represents the actual net debt of the company (long-term debt plus working capital based on the latest annual release) on the distributable cash flow.
› FINANCIALS (DIVERSIFIED) & FINANCIAL SERVICES
Book value = Net worth of a company on a per share basis. It is calculated by taking the total equity of a company from which we subtract the preferred share capital divided by the number of shares outstanding (based on the latest release).
P/BV = Price per book value.
› REAL ESTATE
Distributions per Unit = Gross value distributed per unit for the last year and expected for fiscal year 1 & 2 (FY1 & FY2).
Cash Yield = Distributions per share for fiscal year 1 & 2 (FY1 & FY2) in percentage of actual price.
FFO = Funds from Operations is a measure of the cash generated in a given period. It is calculated by taking net income and adjusting for changes in fair value of investment properties, amortization of investment property, gains and losses from property dispositions, and property acquisition costs on business combinations.
FD FFO = Fully diluted Funds from Operations.
P/FFO = Price per Funds from Operations.
› METALS AND MINING: PRECIOUS METALS / BASE METALS
P/CF = Price/cash flow valuation multiple. P/CFPS calculations for cash flow of zero or negative are deemed not applicable (N/A). P/CFPS greater than 100 are deemed not meaningful (nm).
P/NAVPS = Price per net asset value per share.
› SPECIAL SITUATIONS
FDDCPS = Fully diluted distributable cash flow per share. Cash flow (EBITDA less interest, cash taxes, maintenance capital expenditures and any one-time charges) available to be paid to common shareholders while taking into consideration any possible sources of conversion to outstanding shares such as convertible bonds and stock options.
› SUSTAINABILITY AND CLEAN TECH
Sales per share = revenue/fully diluted shares outstanding.
P/S = Price/sales
› TRANSPORTATION AND INDUSTRIAL PRODUCTS
FDFCFPS = Fully diluted free cash flow per share.
P/CFPS = Price/cash flow per share valuation multiple. P/CFPS calculations for cash flow of zero or negative are deemed not applicable (N/A). P/CFPS greater than 100 are deemed not meaningful (nm).

VISION FEBRUARY 2019 Back to Research Analysts Page 39
Banking & InsuranceSector Analysis
Gabriel Dechaine Analyst 416-869-7442 —
Associates: Will Flanigan: 416-507-8006 Ganesh Kannan: 416-507-9555
Canadian Banks & Lifecos
› Banks 2019 Outlook - It was the best of times, it was the worst of times: The key 2019 investment themes include: (1) the ongoing slowdown in the mortgage/housing market; (2) the credit outlook; (3) efficiency improvement in a decelerating revenue growth environment; (4) "late cycle" excess capital deployment; and (5) the validity of the "long U.S. exposure" theme. Against this cautionary backdrop, bank stocks are trading at levels not touched since the Financial Crisis, which argues for a contrarian stance. However, we believe investors should be patient, at least in the near-term, for signs a recession can be avoided (and the credit cycle won't turn). In the meantime, we maintain our positive ratings on BMO, RY and TD, primarily for their defensive characteristics.
› Lifecos 2019 Outlook:Lifecos begin Q4/18 reporting on February 7th. We expect a relatively noisy quarter with core EPS outpacing reported EPS, largely reflecting the significant decline in equity markets in Q4/18. In terms of our 2019 outlook, the group offers attractive (arguably opportunistic) valuation levels and strong balance sheet flexibility that is being deployed into buybacks. That said, after negative 2018 experience, we believe investor conviction levels are low and a steeper yield curve could be the ultimate catalyst to revive interest. In the interim, we maintain our Outperform ratings on MFC and SLF while we are downgrading GWO to Sector Perform.
Selections› Manulife Financial› Sun Life Financial› Royal Bank of Canada› Bank of Montreal› Toronto Dominion Bank
Market Shares Stock Last FDEPS Book Value per Share 12-MthStock Stock Cap O/S Price Year Last est. est. P/E Last est. est. P/BV Div. PriceSym. Rating (Mln) (Mln) 1/31 Reported FY FY1 FY2 FY1 FY2 Quarter FY1 FY2 FY1 FY2 % Target
BankingBank of Montreal BMO OP 62,482 639 97.73 10/2018 8.99 9.52 10.07 10.3 9.7 64.74 69.68 74.84 1.4 1.3 4.1% 114.00Bank of Nova Scotia BNS SP 91,378 1,227 74.47 10/2018 7.00 7.33 7.78 10.2 9.6 49.75 46.25 49.75 1.6 1.5 4.6% 80.00CIBC CM SP 49,280 443 111.21 10/2018 12.21 12.47 13.25 8.9 8.4 73.83 80.65 87.34 1.4 1.3 4.9% 122.00National Bank NA NR 20,701 336 61.65 10/2018 5.99 6.25 6.61 9.9 9.3 34.40 37.89 41.74 1.6 1.5 4.2% NRRoyal Bank of Canada RY OP 143,601 1,436 100.03 10/2018 8.66 8.98 9.59 11.1 10.4 51.12 43.32 46.41 2.3 2.2 3.9% 110.00Toronto-Dominion Bank TD OP 135,362 1,836 73.73 10/2018 6.48 6.95 7.39 10.6 10.0 40.58 37.76 40.50 2.0 1.8 3.6% 85.00Canadian Western Bank CWB SP 2,632 88 29.85 10/2018 3.01 3.21 3.44 9.3 8.7 26.09 27.91 29.86 1.1 1.0 3.5% 32.00Laurentian Bank LB SP 1,864 42 44.30 10/2018 5.51 5.09 5.41 8.7 8.2 53.72 55.18 56.81 0.8 0.8 5.9% R 41.00InsuranceGreat-West Lifeco GWO SP 27,874 988 28.22 12/2018 2.67 3.04 3.15 9.3 9.0 21.25 16.80 20.06 1.7 1.4 5.5% 31.00 Industrial Alliance IAG SP 5,364 109 49.40 12/2018 4.87 5.86 6.22 8.4 7.9 47.18 33.83 36.76 1.5 1.3 3.4% 55.00 Manulife Financial MFC OP 41,830 1,987 21.05 12/2018 2.22 2.85 3.02 7.4 7.0 20.23 16.42 19.51 1.3 1.1 4.2% 25.00 Sun Life Financial SLF OP 28,728 603 47.62 12/2018 4.14 4.95 5.34 9.6 8.9 34.11 26.87 31.02 1.8 1.5 4.2% 55.00
Rating System: OP = Outperform; SP = Sector Perform; UP = Underperform; T = Tender; UR = Under Review; R = Restricted; NR = Not Rated
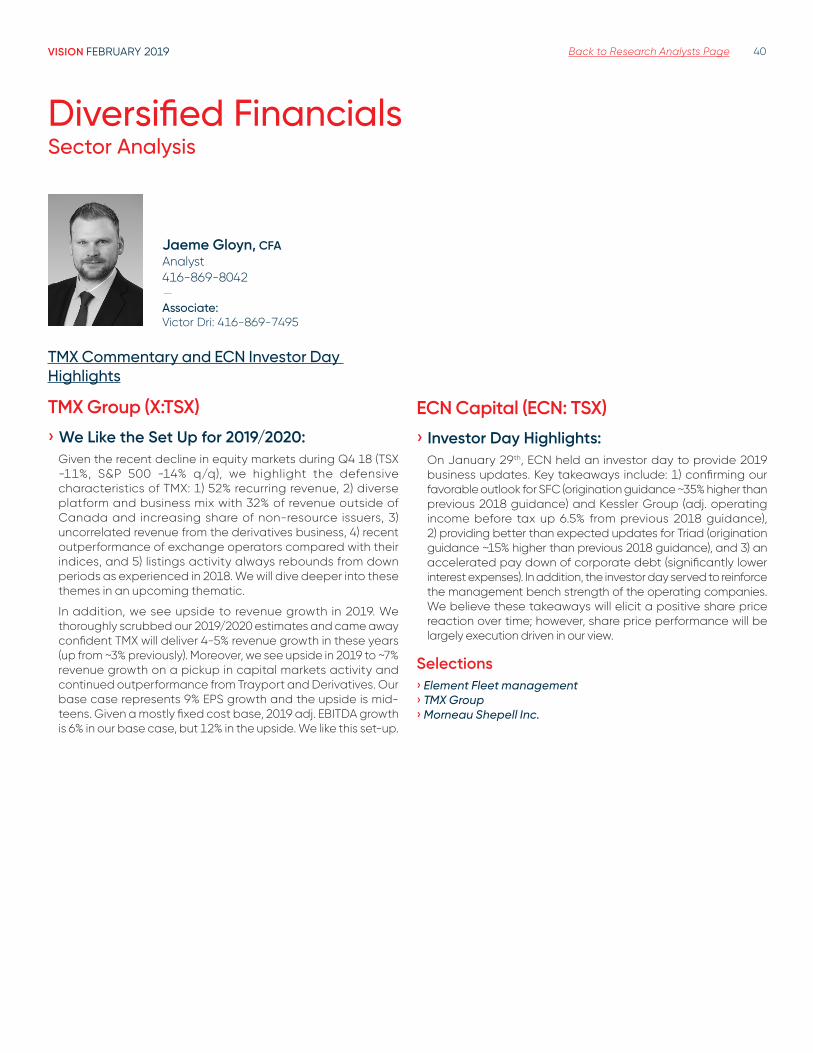
VISION FEBRUARY 2019 Back to Research Analysts Page 40
Diversified FinancialsSector Analysis
Jaeme Gloyn, CFA Analyst 416-869-8042 —
Associate: Victor Dri: 416-869-7495
TMX Commentary and ECN Investor Day Highlights
TMX Group (X:TSX)
› We Like the Set Up for 2019/2020:Given the recent decline in equity markets during Q4 18 (TSX -11%, S&P 500 -14% q/q), we highlight the defensive characteristics of TMX: 1) 52% recurring revenue, 2) diverse platform and business mix with 32% of revenue outside of Canada and increasing share of non-resource issuers, 3) uncorrelated revenue from the derivatives business, 4) recent outperformance of exchange operators compared with their indices, and 5) listings activity always rebounds from down periods as experienced in 2018. We will dive deeper into these themes in an upcoming thematic.
In addition, we see upside to revenue growth in 2019. We thoroughly scrubbed our 2019/2020 estimates and came away confident TMX will deliver 4-5% revenue growth in these years (up from ~3% previously). Moreover, we see upside in 2019 to ~7% revenue growth on a pickup in capital markets activity and continued outperformance from Trayport and Derivatives. Our base case represents 9% EPS growth and the upside is mid-teens. Given a mostly fixed cost base, 2019 adj. EBITDA growth is 6% in our base case, but 12% in the upside. We like this set-up.
ECN Capital (ECN: TSX)
› Investor Day Highlights:On January 29th, ECN held an investor day to provide 2019 business updates. Key takeaways include: 1) confirming our favorable outlook for SFC (origination guidance ~35% higher than previous 2018 guidance) and Kessler Group (adj. operating income before tax up 6.5% from previous 2018 guidance), 2) providing better than expected updates for Triad (origination guidance ~15% higher than previous 2018 guidance), and 3) an accelerated pay down of corporate debt (significantly lower interest expenses). In addition, the investor day served to reinforce the management bench strength of the operating companies. We believe these takeaways will elicit a positive share price reaction over time; however, share price performance will be largely execution driven in our view.
Selections› Element Fleet management› TMX Group› Morneau Shepell Inc.
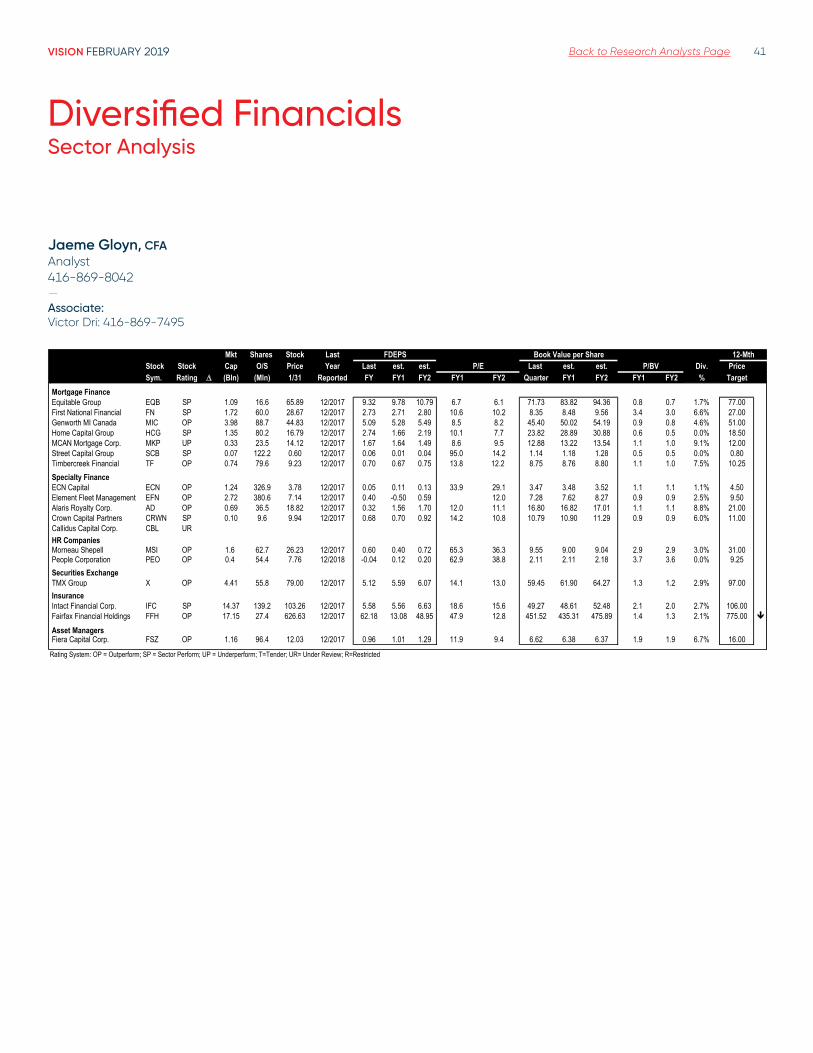
VISION FEBRUARY 2019 Back to Research Analysts Page 41
Diversified FinancialsSector Analysis
Jaeme Gloyn, CFA Analyst 416-869-8042 —Associate: Victor Dri: 416-869-7495
Mkt Shares Stock Last FDEPS Book Value per Share 12-MthStock Stock Cap O/S Price Year Last est. est. P/E Last est. est. P/BV Div. PriceSym. Rating (Bln) (Mln) 1/31 Reported FY FY1 FY2 FY1 FY2 Quarter FY1 FY2 FY1 FY2 % Target
Mortgage FinanceEquitable Group EQB SP 1.09 16.6 65.89 12/2017 9.32 9.78 10.79 6.7 6.1 71.73 83.82 94.36 0.8 0.7 1.7% 77.00First National Financial FN SP 1.72 60.0 28.67 12/2017 2.73 2.71 2.80 10.6 10.2 8.35 8.48 9.56 3.4 3.0 6.6% 27.00Genworth MI Canada MIC OP 3.98 88.7 44.83 12/2017 5.09 5.28 5.49 8.5 8.2 45.40 50.02 54.19 0.9 0.8 4.6% 51.00Home Capital Group HCG SP 1.35 80.2 16.79 12/2017 2.74 1.66 2.19 10.1 7.7 23.82 28.89 30.88 0.6 0.5 0.0% 18.50MCAN Mortgage Corp. MKP UP 0.33 23.5 14.12 12/2017 1.67 1.64 1.49 8.6 9.5 12.88 13.22 13.54 1.1 1.0 9.1% 12.00Street Capital Group SCB SP 0.07 122.2 0.60 12/2017 0.06 0.01 0.04 95.0 14.2 1.14 1.18 1.28 0.5 0.5 0.0% 0.80Timbercreek Financial TF OP 0.74 79.6 9.23 12/2017 0.70 0.67 0.75 13.8 12.2 8.75 8.76 8.80 1.1 1.0 7.5% 10.25Specialty FinanceECN Capital ECN OP 1.24 326.9 3.78 12/2017 0.05 0.11 0.13 33.9 29.1 3.47 3.48 3.52 1.1 1.1 1.1% 4.50Element Fleet Management EFN OP 2.72 380.6 7.14 12/2017 0.40 -0.50 0.59 12.0 7.28 7.62 8.27 0.9 0.9 2.5% 9.50Alaris Royalty Corp. AD OP 0.69 36.5 18.82 12/2017 0.32 1.56 1.70 12.0 11.1 16.80 16.82 17.01 1.1 1.1 8.8% 21.00Crown Capital Partners CRWN SP 0.10 9.6 9.94 12/2017 0.68 0.70 0.92 14.2 10.8 10.79 10.90 11.29 0.9 0.9 6.0% 11.00Callidus Capital Corp. CBL UR 12/2015HR CompaniesMorneau Shepell MSI OP 1.6 62.7 26.23 12/2017 0.60 0.40 0.72 65.3 36.3 9.55 9.00 9.04 2.9 2.9 3.0% 31.00People Corporation PEO OP 0.4 54.4 7.76 12/2018 -0.04 0.12 0.20 62.9 38.8 2.11 2.11 2.18 3.7 3.6 0.0% 9.25Securities ExchangeTMX Group X OP 4.41 55.8 79.00 12/2017 5.12 5.59 6.07 14.1 13.0 59.45 61.90 64.27 1.3 1.2 2.9% 97.0012/2015InsuranceIntact Financial Corp. IFC SP 14.37 139.2 103.26 12/2017 5.58 5.56 6.63 18.6 15.6 49.27 48.61 52.48 2.1 2.0 2.7% 106.00Fairfax Financial Holdings FFH OP 17.15 27.4 626.63 12/2017 62.18 13.08 48.95 47.9 12.8 451.52 435.31 475.89 1.4 1.3 2.1% 775.00
Asset ManagersFiera Capital Corp. FSZ OP 1.16 96.4 12.03 12/2017 0.96 1.01 1.29 11.9 9.4 6.62 6.38 6.37 1.9 1.9 6.7% 16.00
Rating System: OP = Outperform; SP = Sector Perform; UP = Underperform; T=Tender; UR= Under Review; R=Restricted

VISION FEBRUARY 2019 Back to Research Analysts Page 42
Greg Colman Analyst 416-869-6775 —
Associates: Anthony Linton: 416-507-9054
Michael Storry-Robertson: 416-507-8007
Energy ServicesWith 2019 shaping up to be a challenging year for the Canadian OFS space with E&P forecasted to decrease from 2018, we highlight our top picks which are companies which remain defensively positioned and with more exposure to the U.S. and ROTW.
We see 2019 shaping up to be a difficult year for the Canadian Oilfield Service space, as our strip-driven study points to a 20% y/y reduction in spending with WTI and Edmonton par both down 15+% relative to 2018, AECO approximately flat (+1%), and US$9+ differentials roughly double the post-2008 average. While our E&P budget tracker currently points to “only” a 16% y/y/ decrease, we suspect this could trend lower as guidance comes in from management amid a murky outlook. Our E&P counterparts model a less dramatic 2% decline y/y, however we note this is total capex vs. drilling and completion spending (to which our OFS coverage has a higher sensitivity) as well as having exposure to integrated companies and those with a focus outside of Canada (like EnCana). We therefore remain biased towards defensively positioned companies, and those that are less exposed to Canadian E&P capex levels in 2019. Our top picks in this environment are Enerflex (EFX: TSX, $20 .50 Target, Outperform) owing to expectations of increased growth in U.S. gas infrastructure in 2019, Horizon North (HNL: TSX, $3 .20 Target,
Outperform) as the opportunities related to the LNG Canada project and the Modular Solutions segment represent upside potential beyond the scope of E&P capex, and Shawcor (SCL: TSX, $36 .00 Target, Outperform) as its recently announced bid to acquire ZCL Composites Inc. (ZCL: TSX, Restricted) could add to the base business while we await major contract awards which we believe are in the near term driven by the recovery in the offshore market. For EFX, HNL, and SCL, we reiterate our Outperform rating and $20.50, $3.00, and $36.00 targets, respectively, driven by 5.9x 2020 EV/EBITDA, 6.7x 2020 EV/EBITDA, and 9.3x 2020e EV/EBITDA, respectively.
Selections› Enerflex Ltd. › Horizon North Logistics › Shawcor › National Energy Services Reunited
Market Shares StockStock Stock Cap O/S PriceSym. Rating (Mln) (Mln) 1/31 2018e 2019e 2020e 2018e 2019e 2020e 2019e Target Return
Black Diamond Group Ltd. BDI SP 109.34 54.9 1.99 27.9 29.2 30.7 4.9 3.9 3.2 1.4 3.00 51% Calfrac Well Services Ltd. CFW OP 405.92 144.5 2.81 180.1 306.0 266.0 4.6 5.0 4.0 3.5 4.85 73%CES Energy Solutions Corp. CEU OP 890.16 268.1 3.32 153.5 161.9 169.6 8.6 7.6 6.2 1.8 6.50 96%Enerflex Ltd. EFX OP 1546 89.1 17.36 210.3 219.9 276.7 7.6 5.6 4.8 0.1 20.50 18%High Arctic Energy Services Inc. HWO SP 193.96 51.2 3.79 58.3 52.9 40.5 4.5 3.4 2.7 0.0 4.50 19%Horizon North Logistics Inc. HNL OP 303.9 164.3 1.85 30.0 36.6 58.6 9.2 6.1 4.2 0.7 3.20 73%Mullen Group Ltd. MTL OP 1262.1 104.8 12.04 173.3 189.8 211.3 8.9 7.8 6.7 1.8 16.50 37% National Energy Services Reunited NESR OP 683.65 85.6 7.99 159.7 169.3 197.5 5.8 4.5 3.4 1.0 15.00 88%Pason Systems Corp. PSI SP 1764.8 85.4 20.67 98.2 144.1 143.4 11.3 11.3 10.2 nmf 24.00 16%Precision Drilling Corp. PD OP 848.91 293.7 2.89 333.0 373.0 429.2 7.1 6.0 4.8 3.7 4.00 38%Secure Energy Services Inc. SES OP 1315 161.9 8.12 157.2 187.4 215.9 9.0 7.5 7.1 1.4 12.50 54%Shawcor Ltd. SCL OP 1422.9 70.2 20.27 226.2 137.9 160.9 9.9 8.3 4.9 0.0 36.00 78%STEP Energy Services Ltd. STEP SP 139.69 67.2 2.08 123.6 119.0 105.2 3.8 4.2 2.2 3.0 5.50 164%Tervita Corp TEV OP 827.6 117.6 7.04 156.0 198.2 248.2 7.9 6.3 5.4 3.0 11.40 62%Trican Well Services TCW OP 425.44 319.9 1.33 180.0 85.1 57.7 4.1 6.0 2.2 0.2 2.75 107%Trinidad Drilling Ltd. TDG T 459.41 273.5 1.68 129.4 162.5 197.4 5.9 4.2 nmf 1.8 1.68 0%
Rating System: OP = Outperform; SP = Sector Perform; UP = Underperform; T = Tender; UR = Under Review; R = Restricted
EBITDA (mlm) EV/EBITDA 12-Mth PriceNet Debt/EBITDA
Energy Services & AgricultureSector Analysis

VISION FEBRUARY 2019 Back to Research Analysts Page 43
Greg Colman Analyst 416-869-6775 —
Associates: Anthony Linton: 416-507-9054
Michael Storry-Robertson: 416-507-8007
AgricultureWith macro signals not yet pointing to a wide-spread rally in the Agriculture sector, we highlight our top pick for 2019 Ag Growth International (AFN: TSX, $71.00 target, Outperform) as we see continued investment into agricultural infrastructure.
We begin 2019 with mixed signals from farmer and agribusiness on spending from an operational and capital standpoint for year as confidence levels in the present situation for both have rebounded sharply from the lows of 2017 but diverge on the outlook with farmer confidence near all-time highs, while agribusiness is increasingly pessimistic. We continue to see the Canadian farmer enjoying a more favourable environment compared to their U.S. counterparts as crop prices into 2019 continue to favour the Canadian crop mix, which is more heavily weighted toward wheat and canola. With higher incomes, we suspect Canadian farmers will be looking to spend on new equipment, particularly as our strategy and economics team expects FX to provide a tailwind in 2019. While we see the trendline moving up in our agriculture space, we do not yet believe we will see a sustained rally in soft commodities due to the near-record high soft commodity levels globally, driven by record high ending soybean stocks as a result of the U.S.-China trade war. In this environment we highlight our top pick Ag Growth International, as we expect AFN to exhibit broad-based expansion in 2019 as it looks to build on and work through the record commercial backlog at the end of Q3/18. With continued growth in global grain volumes, AFN’s main driver, we look for AFN to continue to expand both organically and through M&A as we suspect it will look to partially deploy the $182 mln available in dry powder. We reiterate our Outperform rating and $71.00 target driven by 9.4x 2020e EV/EBITDA.
Selections› Ag Growth › Cervus Equipment Corp.
Market Shares Stock Last Net Y1 Net 12-MthStock Stock Cap O/S Price Year (A) est. est. (A) est. est. Debt Debt/ PriceSym. Rating (Mln) (Mln) 1/31 Reported Last FY FY1 FY2 FY1 FY2 Last FY FY1 FY2 FY1 FY2 (mln) EBITDA Target
Ag Growth International Inc. AFN OP 923.94$ 18.4 50.34$ Dec-17 2.12$ 3.33$ 3.62$ 14.9x 13.7x 145.85$ 170.54$ 181.71$ 7.9x 7.3x 441.40$ 2.6x 71.00$ AGT Food and Ingredients Inc. AGT T 396.99$ 24.2 16.38$ Dec-17 (1.53)$ (1.64)$ 0.04$ -10.2x 420.1x 64.87$ 67.86$ 83.08$ 15.1x 11.7x 547.54$ 8.1x 18.00$ Cervus Equipment Corporation CERV OP 218.34$ 16.5 13.24$ Dec-17 1.59$ 1.56$ 1.91$ 8.7x 7.2x 59.11$ 64.60$ 72.82$ 3.5x 2.7x 46.46$ 0.7x 17.50$ Rocky Mountain Dealerships Inc. RME SP 174.42$ 19.9 8.77$ Dec-17 0.90$ 0.94$ 1.14$ 9.2x 7.6x 36.43$ 40.37$ 46.80$ 5.0x 4.0x 29.85$ 0.7x 12.50$
Rating System: OP = Outperform; SP = Sector Perform; UP = Underperform; T = Tender; UR = Under Review; R = Restricted
P/E EV/EBITDAFDEPS EBITDA (mln)
Energy Services & AgricultureSector Analysis
VISION FEBRUARY 2019 Back to Research Analysts Page 44
Healthcare, Biotech & Special SituationsSector Analysis
Highlights as of January 2018
Healthcare/Biotech 2019 Outlook The year ahead outlook for the healthcare/biotech sector is favourable, as its non-cyclical nature makes the sector a natural defensive pick, particularly in mature phases of economic cycles and recessions. On average, the sector has outperformed both the market and every other sector in the last 3 recessions and 4 mature cycles (including the current one). During these parts of the cycle, the S&P 500 Healthcare Index has achieved period and annualized average returns of 29% and 20%, respectively vs the S&P 500 at 7%/-1.2% and the closest industry peers at 21%/14%.
Industry specific themes also highlight positive tailwinds with one in particular being the FDA’s drive to streamline and expedite clinical trials and drug approvals through expedited development/review programs like Breakthrough Designation and Accelerated Approvals. The former providing benefits including, 1) more frequent FDA meetings, 2) submitting portions of results, 3) FDA input on trial design, and 4) priority review and possible accelerated approval, while the latter can shorten clinical trial times.
We highlight the relevance of expedited programs for IMV (IMV, OP, $12.00 tgt), as it currently tries to receive Breakthrough Designation/Accelerated Approval. If received it will be an inflection point for the company by significantly improving the chance for approval, as drugs with Breakthrough also have had an approval rate of ~44% vs ~8-10% for non Breakthrough. We maintain a positive bias on IMV as it remains well capitalized into Q4/19 ($20 mln cash at Q3/2018 & $4-$4.5 mln quarterly burn)
and well-positioned to meet its goals in 2019. We maintain our Outperform rating and $12.00 target, which we derive via DCF analysis assuming a 20% discount rate, terminal growth of 2% and 12x EV/EBITDA terminal multiple.
Turning to healthcare, as policy changes by insurance companies to lower costs continue, we highlight UnitedHealth Group (the largest health insurance company in the US) introducing a policy that may deny reimbursement for imaging procedures performed in hospital-associated centres when the same non-emergency procedure can be performed in less expensive freestanding centres. The policy is similar to one introduced by Anthem in July 2017, which should help insurance companies and policy holders save on costs. We expect this to benefit Akumin (AKU.u, OP, US$5.25 tgt) as higher procedural volumes shift to freestanding centres. Based on these changes and alongside other tailwinds including 1) payor/patient supported shift to lower cost imaging centres, 2) stabilized reimbursement rates on high-ticket imaging procedures, and 3) attractive demographics in key markets, we highlight AKU as one of our preferred names for 2019. Akumin currently trades at 6.7x 2019e EV/EBITDA and 12.9x 2019e P/E while its closest peer, RadNet Inc. (NASDAQ: RDNT, Not Rated) trades at 8x 2019e EV/EBITDA and 30.1x 2019e P/E).
Selections› Akumin › IMV Inc.
Market Shares Stock Last FDDCPS EBITDA (mln) Net Y1 Net 12-MthStock Stock Capitalization O/S Price Quarter Current (A) est. est. P/DCPS (A) est. est. EV/EBITDA Debt Debt/ PriceSym. Rating (Mln) (Mln) 1/31 Reported Yield Last FY FY1 FY2 FY1 FY2 Last FY FY1 FY2 FY1 FY2 (Mln) EBITDA Target
Healthcare and BiotechnologyAkumin AKU.u OP 215.48 61.6 3.50u 3/2018 0.0% (0.00)u 0.21u 0.27u 16.989 12.9 14.9u 33.0u 46.5u 9.3 6.7 81.6u 1.8 5.25uCRH Medical CRH OP 304.04 72.6 4.19 3/2018 0.0% 0.30u 0.36u 0.41u 8.9 7.9 34.3u 34.4u 40.6u 8.3 7.1 61.9u 1.5 5.75IMV Inc. IMV OP 322.07 45.0 7.16 3/2018 0.0% (0.21) (0.35) (0.20) nmf nmf (9.4) (15.9) (9.2) nmf nmf 0.0 nmf 12.00Jamieson Wellness JWEL OP 799.81 38.1 20.98 3/2018 1.7% 0.73 0.86 1.05 19.9 16.4 60.7 67.5 76.4 13.8 11.7 168.2 2.2 27.00Knight Therapeutics GUD OP 1,125.37 142.8 7.88 3/2018 0.0% 0.12 0.19 0.19 38.8 39.3 (7.3) (4.2) (1.4) nmf nmf - - 9.50Medical Facilities Corp. DR SP 535.75 31.0 17.28 3/2018 6.5% 1.29u 1.19u 1.15u 11.2 11.6 51.1u 55.4u 51.6u 9.2 9.9 125.3u 2.4 15.50
ProMetic Life Sciences PLI SP 211.85 718.1 0.30 3/2018 0.0% (0.18) (0.16) (0.12) nmf nmf (110.1) (98.9) (72.0) nmf nmf 182.0 nmf 0.45Theratechnologies TH OP 623.23 76.7 8.13 3/2018 0.0% (0.16) 0.03 0.39 nmf 20.9 (6.9) 5.6 34.2 nmf 18.1 - - 14.25
Special SituationsCrius Energy Trust KWH.UN OP 298.31 56.6 5.27 3/2018 16.3% 0.87u 0.57u 0.92u 7.0 4.3 64.9u 66.2u 93.2u 5.2 3.4 118.8u 1.3 7.50
K-Bro Linen KBL OP 386.35 10.5 36.90 3/2018 0.0% 2.42 2.22 2.95 16.2 12.2 26.9 31.8 42.9 13.3 9.8 64.1 1.5 40.00Just Energy Group JE SP 721.10 149.3 4.83 2/f2019 10.4% 0.62 0.80 0.84 6.0 5.8 174.4 193.5 227.9 7.3 6.5 644.1 2.8 5.00Rogers Sugar RSI SP 608.00 105.0 5.79 1/f2019 6.2% 0.39 0.48 0.50 12.0 11.6 99.9 101.3 106.2 9.5 9.1 329.6 3.4 5.75Chemtrade Logistics Income Fund CHE.UN OP 981.52 92.6 10.60 3/2018 11.3% 1.23 1.80 1.93 5.9 5.5 283.2 314.5 352.3 7.3 6.1 1161.0 3.3 16.50
Rating System: OP = Outperform; SP = Sector Perform; UP = Underperform; T = Tender; UR = Under Review; R = Restricted u = US Dollars
Endri Leno Analyst 416-869-8047
— Associate: Stephen Kwai: 416-869-7571
VISION FEBRUARY 2019 Back to Research Analysts Page 45
Industrial ProductsSector Analysis
WSP Global
› Strategic plan more numeric in nature; higher EBITDA margin expectations:WSP unveiled its Global Strategic Plan, setting the stage for the next three years of growth. The updated strategy will focus on WSP’s four foundational pillars: 1) Client - various initiatives to maintain WSP’s positioning in being the partner-of-choice, hence in turn drive net revenue growth to the $8 - $9 billion range by 2021, implying ~12% annual growth rate attributable to both organic growth and acquisitions; 2) People & Culture - aiming to bring total headcount to 65,000 from the current 48,000 (implying a 35% increase and in line with our previous expectation) while keeping the voluntary turnover rate below 12%; 3) Operational Excellence: WSP is on track to achieve the 11% EBITDA margin set out in the previous strategic plan; the new ambition is to generate 11.5% to 12.5% adjusted EBITDA margins (by extension, absolute EBITDA number will increase by 50% given the top-line expansion) with improvements in both operating margins and corporate costs; and lastly, 4) Expertise: building on its global leadership position in Transportation & Infra, while diversifying the business in sectors such as Environment, Water, Power, Industry and Resources (including Mining); recall that the current split is 50% / 29% / 11% /10% on net revenue basis for Transport / Property / Environment / Industry, respectively. Expansion of strategic advisory services capabilities should also further help balance the platform. In terms of geographies, please refer to where WSP wants to be in 2021E vs. now (note that Latam implies Chile and Peru while Brazil and Ecuador are excluded from the target territories).
› Valuation & recommendation:The strategic plan was more numeric in nature that we thought the company would be ready to commit to. As discussed in our anticipated strategy note, we modeled a 65,000-headcount target for WSP. Depending on whether the deals came as one or two large-scale or incremental acquisitions, we were arriving at $81.30 and $77.50 forward NAVs for 2021E. The biggest positive surprise for us is the EBITDA margin target as 12% mid-point implies a lift of $85 million to EBITDA vs. a modeled 11% margin by 2021E. At 11x EV/EBITDA, that translates into incremental value per share of $8.01, implying an $87.41 share price (where we add $8.01 to mid-point of $79.40 as the modeled scenario in our previous publication).
We suspect the majority of the discussion on the conference call will centre around initiatives / type of assets that WSP contemplates to acquire that would lead to 100 bps margin improvement vs. the prior plan. Recall that management in the past stated that cooperative macro is needed for margin expansion. With WSP continuing its steady growth trajectory (and now having become the most valuable E&C company in Canada given the share price compression on the part of SNC), the shares are bound to garner an increased following from investors. We rate WSP shares Outperform, $71.50 price target, using a 10.0x multiple on 2020E EBITDA and a probability weighted valuation methodology (30% stand-alone, 70% M&A).
Selections› WSP› Toromont› North American Construction Group
12-mth Stock LastStock Stock ∆ Price ∆ price Year (A) est. est. P/E (A) est. est. Div. Net debt/Symbol Rating Target 1/31 Cap ($mln) Reported Last FY FY1E FY2E FY1 FY2 Last FY FY1 FY2 FY1 FY2 Yield FY1 EBITDA
Aecon Group ARE OP $21.00 $17.40 $1,041 12 / 2017 $0.69 $0.98 $1.16 19.3x 17.8x $158 $204 $204 4.8x 4.9x 2.9% net cash
Bird Construction Inc. BDT OP $10.00 $6.39 $272 12 / 2017 $0.27 $0.56 $0.57 11.4x 11.2x $27 $48 $49 4.7x 4.6x 6.1% net cashFinning International Inc. FTT OP $30.00 $25.19 $4,237 12 / 2017 $1.31 $2.07 $2.27 12.2x 11.1x $583 $752 $792 7.4x 7.0x 3.2% 1.8xIBI Group Inc. IBG OP $7.50 $8.50 $161 12 / 2017 $0.38 $0.45 $0.47 9.5x 9.0x $40 $39 $40 6.8x 6.6x 0.0% 2.5x (incl. converts)North American Construction Group Ltd.NOA OP $21.00 $12.95 $408 12 / 2017 $0.20 $1.50 $1.67 8.7x 7.7x $62 $93 $158 4.1x 3.6x 0.6% 2.1xRitchie Bros. Auctioneers RBA SP U$37.00 u$35.94 u$3,756 12 / 2017 u$0.78 u$1.46 u$1.54 23.7x 22.5x u$204 u$294 u$306 14.7x 14.1x 2.0% 1.8xSNC-Lavalin SNC OP $54.00 $36.87 $6,473 12 / 2017 $2.33 $2.71 $3.04 1.5x 1.4x $819 $998 $1,078 3.9x 3.6x 2.9% 2.0xStantec Inc. STN SP $34.00 $30.77 $3,504 12 / 2017 $1.67 $2.25 $2.44 13.7x 12.6x $378 $451 $482 9.4x 8.7x 1.8% 1.6xStuart Olson SOX SP $6.00 $4.86 $134 12 / 2017 $0.35 $0.50 $0.48 9.8x 10.1x $36 $45 $45 4.4x 4.1x 9.9% 1.95x (incl. converts)Toromont Industries Ltd. TIH OP $60.00 $58.67 $4,775 12 / 2017 $2.20 $3.48 $3.73 16.9x 15.7x $339 $545 $574 9.6x 9.1x 1.6% 0.8xWSP Global WSP OP $71.50 $58.79 $6,118 12 / 2017 $1.97 $3.76 $3.89 15.6x 15.1x $646 $780 $859 9.3x 8.4x 2.6% 1.4xAutoCanada ACQ SP $12.50 $10.87 $298 12 / 2017 $1.53 $0.93 $1.56 11.6x 7.0x $95 $60 $91 9.5x 6.3x 0.5% 2.9xStelco STLC OP $26.00 $14.75 $1,310 12 / 2017 $0.50 $3.23 $1.43 4.6x 10.3x $215 $380 $227 2.5x 4.2x 2.7% net cashATS Automation ATA SP $20.00 $16.88 $1,587 12 / 2017 $0.76 $0.86 $0.95 19.7x 17.8x $154 $166 $188 10.1x 8.9x Yield 1.0x (pro-forma)Median 11.9x 11.2x 7.1x 6.4x 2.6%Note: u = USD; Stock Rating: OP = Outperform; SP = Sector Perform; UP = Underperform; T=Tender; UR= Under Review; R=Restricted
EPS EBITDA (mln)Market EV/EBITDA
Maxim Sytchev Analyst 416-869-6517
— Associates: Adam Staszewski: 416-869-7937
Troy Sun: 416-869-6754
VISION FEBRUARY 2019 Back to Research Analysts Page 46
Merchandising & Consumer ProductsSector Analysis
Vishal Shreedhar Analyst 416-869-7930 —
Associate: Ryan Li: 416-869-6767
Company Update
Parkland Fuel Corporation (PKI: TSX)Reviewing a potential acquisition of select Husky Energy assets
› Husky Energy indicated to sell certain assets:Husky Energy Inc. (HSE: TSX; Not Rated) is launching a strategic review that could result in the sale of certain Canadian assets including retail and commercial operations (approximately 558 sites, inclusive of 240 independent retailer sites) in addition to a small refinery in Prince George B.C. (12,000 barrels per day).
› Timing for a new deal isn’t ideal given significant ongoing integration activity; however, we believe that PKI will investigate this opportunity:We believe that PKI will review this opportunity and we consider an acquisition to be a possibility in 2019, if valuation is suitable. Other potential suitors may be private equity companies, large integrated oil majors or c-store operators like Alimentation Couche-Tard (we see ATD only being interested in a subset of assets, which is oftentimes less desirable for the seller). Among the suitors listed, we believe that the strategic fit for PKI is strong.
For PKI, the timing for a sizable deal isn’t ideal given a slightly elevated balance sheet and ongoing integration activities following the sizable SOL deal and other recent large deals (CST, Chevron); however, we don’t think this will negate a potential negotiation.
› Reviewing potential deal metrics:We estimate EBITDA potential of the Husky assets $90-$120 million (refinery about $20-$30 million) and a purchase price of $700-$900 million. We estimate that pro forma balance sheet metrics could increase to ~3.2-3.4x (net debt to EBITDA; Q1/19) following a potential deal. Our estimated net debt to EBITDA is within PKI’s stated target range of 2.0-3.5x.
› Maintaining our view:Our positive view on PKI is predicated on the expectation of good EBITDA growth, supported by organic growth, acquisition integration and synergy capture. In general, we believe that PKI has a good track record of execution and acquisition integration. We view the share pullback to be an opportunity; PKI remains a preferred name in our coverage universe.
› Maintain Outperform rating; price target is $49:We value PKI at 9.5x our 2019/20 EBITDA (excl. non-controlling interest in SOL).
Selection› Empire Company› Parkland Fuel Corporation
Market Shares Stock Last FDEPS EBITDA Debt/ 12-MthStock Stock Cap. O/S Price Year (A) est. est. P/E (A) est. est. EV/EBITDA Book Total PriceSym. Rating (Mln) (Mln) 1/31 Reported Last FY FY1 FY2 FY1 FY2 Last FY FY1 FY2 FY1 FY2 Value Capital Target
General MerchandiseCanadian Tire CTC.a OP 9,667 64.7 149.45 12/2017 10.67 11.91 12.69 12.6 11.8 1,694 1,744 1,821 8.8 8.5 66.50 0.57 180.00Dollarama DOL SP 11,633 328.9 35.37 01/2018 1.52 1.66 1.82 21.3 19.5 826 874 908 15.4 14.8 -0.66 1.13 39.00
Specialty StoresCouche Tard ATD.b OP 40,331 565.0 71.38 04/2018 2.60 3.25 3.40 16.7 16.0 2,980 3,493 3,591 10.3 10.0 15.17 0.44 79.00Parkland Fuel Corporation PKI OP 5,114 136.0 37.59 12/2017 0.70 1.48 2.04 25.4 18.4 418 813 1,063 8.9 6.8 12.57 0.56 49.00
ApparelGildan GIL SP 9,257 208.2 44.47 12/2017 1.72 1.87 2.08 18.1 16.3 586 601 633 12.8 12.1 9.35 0.30 46.00Roots Corporation ROOT OP 164 42.5 3.85 01/2018 0.69 0.46 0.56 8.3 6.8 53 41 50 7.2 6.0 4.62 0.40 6.00
GrocersEmpire Company EMP.a OP 8,041 272.2 29.54 05/2018 1.27 1.59 2.21 18.6 13.4 1,015 1,124 1,369 8.0 6.6 14.14 0.20 33.00Loblaw L SP 23,944 376.3 63.63 12/2017 4.54 4.62 4.43 13.8 14.4 4,096 4,135 3,613 9.1 10.4 33.48 0.52 62.00Metro MRU SP 12,282 257.1 47.77 09/2018 2.41 2.87 3.17 16.6 15.1 970 1,005 1,032 14.8 14.4 22.44 0.31 50.00
Food ManufacturerSaputo SAP SP 15,087 391.7 38.52 03/2018 1.80 1.70 2.12 22.6 18.1 1,265 1,292 1,509 13.6 11.6 12.44 0.33 43.00
Department StoresHudson's Bay Company HBC SP 1,921 236.0 8.14 01/2018 (1.49) (1.32) (0.91) NA NA 261 383 457 15.1 12.7 7.26 0.69 12.00
Mattress RetailingSleep Country Canada ZZZ SP 776 37.4 20.72 12/2017 1.64 1.74 1.87 11.9 11.1 100 106 109 8.0 7.8 7.92 0.20 27.00
Beauty and Personal CareMAV Beauty Brands MAV SP 338 40.7 8.30 12/2017 0.09 0.13 0.62 64.8 13.4 16 27 42 16.2 10.5 5.25 0.33 15.00
Rating System: OP = Outperform; SP = Sector Perform; UP = Underperform; T = Tender; UR = Under Review; R = Restricted u=US dollarsRisk Rating: BA = Below Average; A = Average; AA = Above Average; S = Speculative

VISION FEBRUARY 2019 Back to Research Analysts Page 47
Price Volatility to Persist Through 2019Copper prices have remained volatile in recent weeks as less-than-stellar market data out of China has been offset by modest supply disruptions to date in 2019, although the threat of tariffs continue to remain a concern for several investors.
Our positive long-term bias for base metals remains unchanged driven by a lack of an advanced stage project pipeline and the building of a structural deficit in the coming years for several commodities (namely: copper). Electric vehicles are emerging as the dominant story for long-term copper demand, expected to partially offset the reduced production of internal combustion engine vehicles.
› Top picks: Teck Resources Ltd . (TECK .B: TSX) – With the successful QB2 sanctioning and minority sale to Sumitomo in December 2018, we expect more focus will be brought on the company’s copper growth profile in addition to a number of catalysts delivered throughout 2019/2020. These include a bankable feasibility study (BFS) on Zafranel by Q1/19, prefeasibility study (PFS) on San Nicolas in H2/19 and BFS on its NuevaUnion project (50/50 JV with Goldcorp Inc. (G: TSX)) also in H2/19. The company’s longer-term copper growth profile is taking shape with advancement of QB2 leading to a 15% CAGR in copper production over the next five years, while overall copper operating costs are expected to decline by 5% over the same period (on a consolidated basis).
Lundin Mining Corp . (LUN: TSX) – Lundin is anticipating a ~60% reduction in power costs due to increased solar/hydro capacity in the country with power costs expected to lead to a ~5% cost savings in overall costs by 2023. Additionally, with a new mine fleet and mill optimizations mostly operational by mid-2019, operating cost guidance is expected to improve over the next five-year guidance range. LUN continues to trade at an attractive valuation of 4.1x 2019E CF compared with intermediate copper peers at 4.8x.
Nexa Resources S .A . (NEXA: TSX) – Nexa is one name in our coverage universe with predictable operational results and organic growth given the company’s strong operating base, strong balance sheet and a willingness to return capital to shareholders as seen in the implementation of the US$30 mln share buyback in November 2018 which we expect to offer additional support for the shares. Our Outperform rating is based on the company’s strong operating base, significant exploration potential, near-term growth objectives and strong balance sheet to execute its current growth objectives.
Selections› Teck Resources› Lundin Mining› Nexa Resources
Metals & Mining: Base MetalsSector Analysis
Don DeMarco Analyst 416-869-7572 —
Associates: Rabi Nizami: 416-869-7925 Harmen Puri: 416-869-8045
Shane Nagle, CFA Analyst 416-869-7936 —
Associate: Lola Aganga: 416-869-6516
Market Shares Stock 12-Month EPS CFPS NetStock Stock Cap O/S Price Price FY0 FY1 FY2 P/E FY0 FY1 FY2 P/CF Asset
Symbol Rating ∆ (Mln) (Mln) 1/31 Target ∆ Analyst FY1 FY2 FY1 FY2 Value P/NAVProducers
Capstone Mining CS SP 232 399.4 0.58 0.80 ↓ Nagle (0.02)u 0.06u (0.00)u 7.2x n/a 0.34u 0.26u 0.18u 1.7x 2.5x 1.14 0.5xCopper Mountain Mining CMMC OP 166 188.1 0.88 1.60 ↓ DeMarco 0.48c 0.05c 0.10c 19.5x 9.1x 0.63c 0.37c 0.43c 2.4x 2.1x 2.94 0.3xFirst Quantum Minerals FM SP 10,486 689.4 15.21 14.00 ↓ Nagle (0.16)u 0.77u 0.91u 15.3x 16.8x 1.35u 2.33u 2.46u 5.1x 4.8x 20.89 0.7xHudbay Minerals HBM SP 2,056 261.3 7.87 9.00 Nagle 0.59u 0.34u 0.41u 17.8x 19.2x 2.18u 1.81u 1.60u 3.4x 3.8x 9.32 0.8xLundin Mining LUN OP 4,401 733.5 6.00 9.00 ↑ Nagle 0.59u 0.24u 0.21u 19.3x 28.7x 1.22u 0.69u 0.78u 6.7x 5.9x 10.87 0.6xNexa Resources NEXA OP 1,525 133.3 11.44 20.00 ↓ Nagle 1.43u 0.85u 0.21u 10.4x 53.9x 3.98u 2.55u 2.26u 3.5x 3.9x 34.36 0.3xSherritt International S SP ↓ 181 397.3 0.46 0.75 ↓ DeMarco (0.87)c (0.14)c (0.20)c - - (0.05)c (0.16)c (0.03)c - - 0.71 0.6xTaseko Mines TKO OP 173 227.6 0.76 1.85 DeMarco 0.19c 0.00c 0.11c 368.2x 6.7x 0.67c 0.38c 0.42c 2.0x 1.8x 2.89 0.3xTeck Resources TECKb OP 17,966 561.4 32.00 38.50 ↓ Nagle 4.45c 4.61c 4.14c 6.9x 7.7x 8.58c 8.65c 7.62c 3.7x 4.2x 48.40 0.7xTitan Mining TI SP ↓ 102 102.0 1.00 1.30 ↓ Nagle (0.15)c (0.15)c 0.01c n/a 77.7x (0.12)c (0.11)c 0.12c n/a 6.2x 1.28 0.8xTrevali Mining TV OP 302 828.5 0.37 0.60 ↓ Nagle 0.08c 0.06c 0.03c 4.4x 13.6x 0.18c 0.17c 0.11c 1.7x 2.5x 0.64 0.6x
DevelopersNevada Copper NCU OP 304 661.9 0.46 0.85 ↓ Nagle (0.11)c (0.02)c (0.02)c n/a n/a (0.05)c (0.02)c (0.01)c n/a n/a 1.15 0.4xSolGold SOLG OP 1,126 1,815.8 0.62 1.15 ↑ Nagle n/a n/a n/a n/a n/a n/a n/a n/a n/a n/a 1.44 0.4x
Rating System: OP = Outperform; SP = Sector Perform; UP = Underperform; R = Restricted; T = Tender; UR = Under Review u = US dollars; c = Canadian dollars

VISION FEBRUARY 2019 Back to Research Analysts Page 48
Gold could see modest gains in 2019
› In 2019 we expect that gold will show modest gains Y/Y:We view the outlook for the spot gold price as modestly positive on a Y/Y annual average basis based on several economic factors tied to the United States. Our view is based on the recent rollover in the USDX with consensus calling for a further decline over the course of 2019, which should prove modestly positive for the gold price. We see potential for the U.S. real rate to stay relatively flat at current levels with consensus calling for at most one rate hike from the U.S. Fed in 2019 and consensus calling for inflation to rise throughout the year, offsetting the potential rate hike.
› Lower oil prices could help companies in 2019:Heading into the new year, companies have been benefiting from lower oil prices, and if this remains unchanged, companies could see lower costs than in 2018. This would be partially offset by stabilization of certain FX currencies such as the Turkish lira and Argentine peso, which have begun to normalize heading into 2019.
› Top Picks offer dependable results, strong balance sheets, low capex plans and numerous catalysts:We believe the companies that are most likely to outperform are those with: (1) management teams with solid track records of executing on guidance, (2) strong balance sheets, (3) encouraging Y/Y guidance with growth in production and/or declining costs, (4) exiting heavy capital spending programs, and (5) a catalyst-packed calendar. On an EV/EBITDA valuation basis we see some names trading at very attractive multiples and with those that have a history of achieving guidance and showing potential for delivering positive catalysts, we believe these names offer good investment opportunities.
Selections
Gold Producers:
› Argonaut Gold Inc. (AR: TSX; $3.50 target)
› Atlantic Gold Corp. (AGB: TSX.V; $2.75 target)
› Kirkland Lake Gold Ltd. (KL: TSX; $44.00 target)
› SSR Mining Inc. (SSRM: TSX; $21.00 target)
› Wesdome Gold Mines Ltd. (WDO: TSX; $4.75 target)
Gold Developers:
› Marathon Gold Corp. (MOZ: TSX; $2.00 target)
Royalties:
› Sandstorm Gold Ltd. (SSL: TSX; $8.00 target)
Metals & Mining: Precious MetalsSector Analysis
Don DeMarco Analyst 416-869-7572 —
Associates: Rabi Nizami: 416-869-7925 Harmen Puri: 416-869-8045
Michael Parkin Analyst 416-869-6766 —
Associate: Jonathan Egilo: 416-507-8177
John Sclodnick Analyst 416-869-8044
Shane Nagle, CFA Analyst 416-869-7936 —
Associate: Lola Aganga: 416-869-6516
VISION FEBRUARY 2019 Back to Research Analysts Page 49
Metals & Mining: Precious MetalsSector Analysis
Market Shares Stock 12-Month EPS CFPS NetStock Stock Cap O/S Price Price FY0 FY1 FY2 P/E FY0 FY1 FY2 P/CF Asset
Symbol Rating ∆ (Mln) (Mln) 1/31 Target ∆ Analyst FY1 FY2 FY1 FY2 Value P/NAVSenior Producers (>1 Moz production)
Agnico-Eagle Mines Ltd AEM OP 13,405 234.55 57.15 66.00 ↑ Parkin 1.01u 0.17u 0.35u 257.3x 123.6x 3.61u 2.75u 3.23u 15.8x 13.5x 27.99 2.0xGoldcorp Inc G T 12,774 869.00 14.70 13.84 ↓ Parkin 0.39u 0.08u 0.28u 139.1x 40.1x 1.23u 1.11u 1.65u 10.1x 6.8x 15.43 1.0xKinross Gold Corp K OP 5,489 1,250.23 4.39 5.75 ↑ Parkin 0.14u 0.09u 0.14u 36.7x 24.0x 0.73u 0.66u 0.79u 5.0x 4.2x 5.97 0.7xYamana Gold Inc YRI OP 3,512 949.30 3.70 5.25 Parkin 0.09u 0.10u 0.02u 29.4x 136.4x 0.42u 0.56u 0.53u 5.1x 5.3x 3.49 1.1x
Royalty CompaniesFranco-Nevada Corp FNV SP 18,952 185.9 101.93 97.50 ↑ Nagle 1.08u 1.18u 1.22u 67.0x 83.5x 2.72u 2.55u 2.90u 31.0x 27.2x 57.85 1.8xMaverix Metals Inc MMX.V OP 361 155.8 2.32 3.40 ↑ Nagle 0.02u 0.00u (0.00)u 580.0x n/a 0.10u 0.14u 0.16u 16.8x 14.3x 2.48 0.9xOsisko Gold Royalties Ltd OR OP 1,998 155.4 12.86 14.25 ↑ Nagle 0.19c 0.15c 0.22c 87.5x 59.0x 0.40c 0.59c 0.81c 21.8x 15.9x 10.54 1.2xRoyal Gold Inc RGLD.O SP 5,700 65.2 87.37u 90.00u ↑ Nagle 1.54u 1.46u 1.64u 59.8x 53.3x 4.08u 4.04u 4.24u 16.8x 16.0x 53.59 1.6xSandstorm Gold Ltd SSL OP 1,259 182.7 6.89 8.00 ↑ Nagle 0.05u 0.08u 0.10u 66.8x 68.9x 0.27u 0.26u 0.29u 20.5x 18.4x 6.76 1.0xWheaton Precious Metals Corp WPM OP 12,289 444.0 27.68 34.00 ↑ Nagle 0.63u 0.44u 0.55u 48.8x 50.3x 1.23u 1.05u 1.15u 20.4x 18.7x 22.06 1.3x
Intermediate Producers (>250 Koz production)Alamos Gold Inc AGI OP 2,188 374.06 5.85 7.25 ↓ Parkin 0.09u 0.06u 0.10u 74.8x 44.7x 0.59u 0.53u 0.56u 8.4x 8.0x 9.67 0.6xB2Gold BTO OP 4,023 967.0 4.16 6.75 ↑ DeMarco 0.10u 0.19u 0.17u 21.5x 24.5x 0.23u 0.48u 0.48u 8.7x 8.7x 2.73 1.5xCenterra Gold Inc CG SP 1,944 291.94 6.66 7.00 ↓ Parkin 0.96u 0.34u 0.38u 14.8x 13.4x 1.75u 1.16u 1.11u 4.4x 4.6x 11.70 0.6xDetour Gold Corp DGC OP 2,307 175.30 13.16 17.25 ↑ Parkin 0.63u 0.36u 0.36u 28.2x 27.8x 1.61u 1.58u 1.63u 6.4x 6.2x 20.07 0.7xEldorado Gold Corp ELD SP ↓ 781 158.80 4.92 4.75 ↓ Parkin 0.01u (0.04)u (0.25)u n/a n/a 0.08u 0.08u 0.47u 49.3x 8.1x 14.32 0.3xEquinox Gold Corp EQX OP 606 551.36 1.10 1.90 ↓ Sclodnick (0.11)u (0.10)u 0.00u n/a n/a (0.18)u (0.02)u 0.18u n/a 6.1x 1.86 0.6xEndeavour Mining EDV SP 2,439 107.7 22.64 29.00 ↑ DeMarco 0.62u 0.55u 0.99u 40.9x 22.8x 1.83u 2.52u 2.82u 9.0x 8.0x 24.26 0.9xFirst Majestic Silver Corp FR SP 1,557 193.7 8.04 8.50 ↓ DeMarco 0.08u (0.19)u 0.15u - 53.4x 0.56u 0.38u 0.64u 21.3x 12.6x 7.74 1.0xFortuna Silver Mines Inc FVI SP 846 159.9 5.29 8.00 ↑ DeMarco 0.31u 0.21u 0.29u 25.7x 18.1x 0.56u 0.48u 0.61u 11.0x 8.7x 5.83 0.9xIAMGOLD Corp IMG OP 2,296 466.60 4.92 6.75 ↓ Parkin 0.06u 0.10u 0.10u 37.0x 37.4x 0.63u 0.66u 1.11u 5.7x 3.4x 9.31 0.5xKirkland Lake Gold Corp KL OP 8,862 209.66 42.27 44.00 ↑ Parkin 0.67u 1.23u 1.44u 26.2x 22.4x 1.40u 2.34u 2.76u 13.8x 11.7x 20.89 2.0xNew Gold Inc NGD SP 862 578.75 1.49 1.80 ↑ Parkin 0.11u (0.01)u 0.06u n/a 24.7x 0.40u 0.55u 0.57u 2.1x 2.0x 2.79 0.5xOceanaGold Corp OGC SP 2,900 618.40 4.69 5.25 ↑ Parkin 0.31u 0.20u 0.10u 23.6x 45.9x 0.62u 0.56u 0.39u 6.3x 9.1x 3.59 1.3xSSR Mining Inc SSRM OP 2,161 119.94 18.02 21.00 ↑ Parkin 0.34u 0.23u 0.38u 59.1x 36.3x 1.24u 0.84u 1.34u 16.4x 10.3x 16.65 1.1xTahoe Resources Inc THO T 1,560 313.31 4.98 4.49 Parkin 0.27u (0.13)u 0.02u -28.5x 182.7x 0.72u 0.37u 0.59u 10.3x 6.4x 6.50 0.8x
Junior Producers (<250 Koz production)Alacer Gold Corp ASR OP ↑ 890 293.8 3.03 4.75 ↑ DeMarco 0.31u 0.09u 0.36u 35.3x 8.5x 0.20u 0.22u 0.64u 13.7x 4.7x 4.34 0.7xArgonaut Gold Inc. AR OP 315 177.80 1.77 3.50 Sclodnick 0.15u 0.10u 0.13u 17.0x 13.7x 0.25u 0.37u 0.45u 4.8x 3.9x 3.82 0.5xAtlantic Gold Corp AGB.V OP 433 236.8 1.83 2.75 DeMarco (0.03)u 0.13u 0.14u 14.5x 13.4x (0.03)u 0.26u 0.26u 7.1x 7.0x 2.58 0.7xGolden Star Resources GSC OP 382 76.2 5.02 7.50 DeMarco 0.52u 0.16u 0.51u 31.6x 9.9x 0.53u 0.33u 0.73u 15.3x 6.9x 7.25 0.7xLeagold Mining LMC SP ↓ 626 284.7 2.20 3.50 DeMarco (0.12)u 0.09u 0.38u 23.8x 5.8x 0.26u 0.32u 0.67u 7.0x 3.3x 2.89 0.8xSemafo Inc. SMF OP 967 325.6 2.97 5.00 DeMarco 0.01u 0.07u 0.35u 43.7x 8.4x 0.33u 0.35u 0.74u 8.6x 4.0x 3.94 0.8xTMAC Resources TMR OP 630 92.0 6.85 8.50 ↑ DeMarco (0.34)u (0.28)u 0.57u - 12.1x (0.02)u 0.28u 1.23u 24.8x 5.6x 9.27 0.7xWesdome Corp. WDO OP 686 134.9 5.08 4.75 DeMarco 0.07u 0.12u 0.19u 43.7x 27.1x 0.20u 0.33u 0.33u 15.3x 15.5x 4.72 1.1x
DevelopersAlmaden Minerals Ltd AMM OP 200 193.8 1.03 1.40 Nagle n/a n/a n/a n/a n/a n/a n/a n/a n/a n/a 1.66 0.6xBarsele Minerals Corp. BME OP 66 126.32 0.52 1.25 Sclodnick n/a n/a n/a n/a n/a n/a n/a n/a n/a n/a 1.18 0.4xBluestone Resources Inc. BSR OP 94 63.84 1.47 2.40 Sclodnick n/a n/a n/a n/a n/a n/a n/a n/a n/a n/a 2.83 0.5xFalco Resources Ltd. FPC OP 62 189.19 0.33 1.10 ↓ Sclodnick n/a n/a n/a n/a n/a n/a n/a n/a n/a n/a 1.48 0.2xLiberty Gold Corp LGD OP 84 206.03 0.41 0.70 Sclodnick n/a n/a n/a n/a n/a n/a n/a n/a n/a n/a 0.75 0.5xMAG Silver Corp MAG OP 1,009 85.5 11.80 20.00 DeMarco (0.08)u (0.03)u (0.05)u - - (0.08)u (0.03)u (0.04)u - - 16.09 0.7xMarathon Gold Corp. MOZ OP 156 173.09 0.90 2.00 Sclodnick n/a n/a n/a n/a n/a n/a n/a n/a n/a n/a 2.13 0.4xOsisko Mining OSK OP R 257.2 2.71 4.10 DeMarco (1.42)u (0.04)u (0.05)u - - (0.02)u (0.00)u (0.03)u - - 3.82 0.7xSabina Gold and Silver Corp. SBB OP 385 287.20 1.34 2.80 Sclodnick n/a n/a n/a n/a n/a n/a n/a n/a n/a n/a 2.90 0.5xSilverCrest Metals Inc. SIL.V OP 357 73.6 4.86 5.25 DeMarco (0.12)u (0.08)u (0.06)u - - (0.05)u (0.05)u (0.03)u - - 5.35 0.9xTroilus Gold Corp. TLG OP 39 52.5 0.75 2.10 ↓ Sclodnick n/a n/a n/a n/a n/a n/a n/a n/a n/a n/a 2.76 0.3x
Rating System: OP = Outperform; SP = Sector Perform; UP = Underperform; R = Restricted; T = Tender; UR = Under Review u = US dollars; c = Canadian dollars
Michael Parkin Analyst 416-869-6766 —Associate: Jonathan Egilo 416-507-8177
John Sclodnick Analyst 416-869-8044 —Associates: Jonathan Egilo: 416-507-8177 John Sclodnick: 416-869-8044
Don DeMarco Analyst 416-869-7572 —Associates: Rabi Nizami: 416-869-7925Harmen Puri: 416-869-8045
Shane Nagle, CFA Analyst 416-869-7936 —Associate: Lola Aganga 416-869-6516

VISION FEBRUARY 2019 Back to Research Analysts Page 50
› Crude Oil and Natural Gas Outlook:Crude oil started the year off strong, with WTI prices rising nearly US$10/bbl from the end of December to hit US$55/bbl in late January. The increase is largely attributed to Saudi Arabia’s commitment to cut production, reportedly reducing volumes by 900 mbbl/d from November levels, providing support for the 1.2 mmbbl/d of combined output cuts announced by OPEC and Russia in December. U.S. sanctions on Venezuela were also a catalyst to push prices higher in late January as the new restrictions look to put more pressure on Venezuelan supply, preventing its oil from reaching key U.S. markets. Following the significant oil price volatility to close out 2018, we continue to believe global oil prices will remain range bound between US$50-US$65/bbl.
Within Canada, we believe WCSB fundamentals will continue to tighten, accelerated by the Alberta government’s mandatory production cuts. We expect the physical market will continue to improve throughout the year, helped by disciplined capital spending (leaving uneconomic volumes out of the system), incremental pipeline flows (namely Enbridge’s Line 3 Replacement) and incremental crude by rail volumes. Given our bottom-up supply and demand forecast, we believe that Canadian crude oil inventory should continue to draw throughout the year (in aggregate). Together, the supply and demand equation should support a more normalized differential market and underpins our bias towards oil-weighted producers in 2019.
Natural gas prices normalized across major North American benchmarks through January with the NYMEX monthly settlements averaging US$3.10/MMBtu, pulling back from strong November and December prices which exceeded US$4.00/MMBtu on account of cold weather. Provided there is not meaningful degradation in productive capacity, or issues with market access for U.S. natural gas production, we believe Henry Hub pricing will continue to be range bound around US$3.00/mcf. In Western Canada, AECO prices improved modestly through January, with spot settlements averaging C$1.83/GJ for the month. As WCSB gas production continues to face a constrained NGTL system, we see AECO pricing as more of the same, characterized by generally weak pricing with seasonally volatile price swings.
› Top picks: Suncor Energy Inc . (SU: TSX/NYSE) – Underpinned by its integrated portfolio of assets, Suncor offers a sustainable business model characterized by a strong balance sheet, low decline rate and attractive FCF profile that provides optionality to return capital to investors through increased dividends or continued share repurchases.
Cenovus Energy Inc . (CVE: TSX/NYSE) – As Canadian heavy oil fundamentals improve following record-wide discounts, we highlight Cenovus as an alpha opportunity idea for 2019, underpinned by its solid balance sheet, sustainable business and FCF profile that can weather the commodity cycle and provide torque to the upside as global oil prices improve.
TORC Oil & Gas Ltd . (TOG: TSX) – One of the best positioned light oil names, TORC enters 2019 with a conservative budget that reflects the extreme defensibility of the business, where maintenance provides flexibility through free cash flow in a challenged environment. The company continues to benefit from selling crude into preferred benchmarks in SE Sask, where pricing is stronger than other Western Canadian references. We see TOG positioned for 83% total return (vs. peers 76%) on a total payout of 76% (vs. peers 81%) and leverage of 1.2x D/CF (vs. peers 1.9x), while it trades at 4.2x 2019e EV/DACF (vs. peers 4.0x). Certainly one of the best positioned names in the group.
Selections› Suncor› Cenovus› TORC
Oil & GasSector Analysis
Large Cap Oil & GasIntermediate Oil & Gas
Dan Payne Analyst 403-290-5441 —
Associates: Mitch Mastel: 403-441-0952 Andrew Nguyen: 403-290-5445
Travis Wood Analyst 403-290-5102 —
Associates: John Hunt: 403-441-0955
Brad Lenz: 403-441-0928 Alex Reid: 403-290-5627
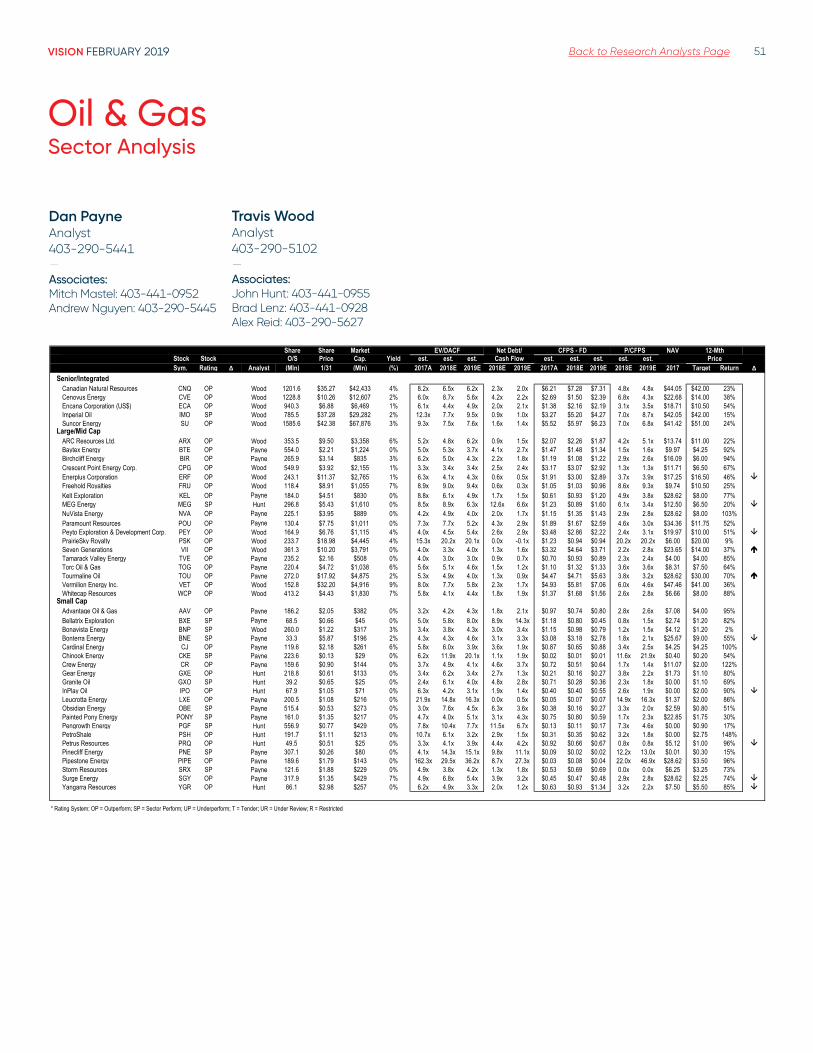
VISION FEBRUARY 2019 Back to Research Analysts Page 51
Oil & GasSector Analysis
Share Share Market NAVStock Stock O/S Price Cap. Yield est. est. est. est. est. est. est. est.Sym. Rating ∆ Analyst (Mln) 1/31 (Mln) (%) 2017A 2018E 2019E 2018E 2019E 2017A 2018E 2019E 2018E 2019E 2017 Target Return ∆
Senior/Integrated HARDCODECanadian Natural Resources CNQ OP Wood 1201.6 $35.27 $42,433 4% 8.2x 6.5x 6.2x 2.3x 2.0x $6.21 $7.28 $7.31 4.8x 4.8x $44.05 $42.00 23%Cenovus Energy CVE OP Wood 1228.8 $10.26 $12,607 2% 6.0x 8.7x 5.6x 4.2x 2.2x $2.69 $1.50 $2.39 6.8x 4.3x $22.68 $14.00 38%Encana Corporation (US$) ECA OP Wood 940.3 $6.88 $6,469 1% 6.1x 4.4x 4.9x 2.0x 2.1x $1.38 $2.16 $2.19 3.1x 3.5x $18.71 $10.50 54%Imperial Oil IMO SP Wood 785.5 $37.28 $29,282 2% 12.3x 7.7x 9.5x 0.9x 1.0x $3.27 $5.20 $4.27 7.0x 8.7x $42.05 $42.00 15%Suncor Energy SU OP Wood 1585.6 $42.38 $67,876 3% 9.3x 7.5x 7.6x 1.6x 1.4x $5.52 $5.97 $6.23 7.0x 6.8x $41.42 $51.00 24%
Large/Mid CapARC Resources Ltd. ARX OP Wood 353.5 $9.50 $3,358 6% 5.2x 4.8x 6.2x 0.9x 1.5x $2.07 $2.26 $1.87 4.2x 5.1x $13.74 $11.00 22%Baytex Energy BTE OP Payne 554.0 $2.21 $1,224 0% 5.0x 5.3x 3.7x 4.1x 2.7x $1.47 $1.48 $1.34 1.5x 1.6x $9.97 $4.25 92%Birchcliff Energy BIR OP Payne 265.9 $3.14 $835 3% 6.2x 5.0x 4.3x 2.2x 1.8x $1.19 $1.08 $1.22 2.9x 2.6x $16.09 $6.00 94%Crescent Point Energy Corp. CPG OP Wood 549.9 $3.92 $2,155 1% 3.3x 3.4x 3.4x 2.5x 2.4x $3.17 $3.07 $2.92 1.3x 1.3x $11.71 $6.50 67%Enerplus Corporation ERF OP Wood 243.1 $11.37 $2,765 1% 6.3x 4.1x 4.3x 0.6x 0.5x $1.91 $3.00 $2.89 3.7x 3.9x $17.25 $16.50 46% Freehold Royalties FRU OP Wood 118.4 $8.91 $1,055 7% 8.9x 9.0x 9.4x 0.6x 0.3x $1.05 $1.03 $0.96 8.6x 9.3x $9.74 $10.50 25%Kelt Exploration KEL OP Payne 184.0 $4.51 $830 0% 8.8x 6.1x 4.9x 1.7x 1.5x $0.61 $0.93 $1.20 4.9x 3.8x $28.62 $8.00 77%MEG Energy MEG SP Hunt 296.8 $5.43 $1,610 0% 8.5x 8.9x 6.3x 12.6x 6.6x $1.23 $0.89 $1.60 6.1x 3.4x $12.50 $6.50 20% NuVista Energy NVA OP Payne 225.1 $3.95 $889 0% 4.2x 4.9x 4.0x 2.0x 1.7x $1.15 $1.35 $1.43 2.9x 2.8x $28.62 $8.00 103%Paramount Resources POU OP Payne 130.4 $7.75 $1,011 0% 7.3x 7.7x 5.2x 4.3x 2.9x $1.89 $1.67 $2.59 4.6x 3.0x $34.36 $11.75 52%Peyto Exploration & Development Corp. PEY OP Wood 164.9 $6.76 $1,115 4% 4.0x 4.5x 5.4x 2.6x 2.9x $3.48 $2.86 $2.22 2.4x 3.1x $19.97 $10.00 51% PrairieSky Royalty PSK OP Wood 233.7 $18.98 $4,445 4% 15.3x 20.2x 20.1x 0.0x -0.1x $1.23 $0.94 $0.94 20.2x 20.2x $6.00 $20.00 9%Seven Generations VII OP Wood 361.3 $10.20 $3,791 0% 4.0x 3.3x 4.0x 1.3x 1.6x $3.32 $4.64 $3.71 2.2x 2.8x $23.65 $14.00 37% Tamarack Valley Energy TVE OP Payne 235.2 $2.16 $508 0% 4.0x 3.0x 3.0x 0.9x 0.7x $0.70 $0.93 $0.89 2.3x 2.4x $4.00 $4.00 85%Torc Oil & Gas TOG OP Payne 220.4 $4.72 $1,038 6% 5.6x 5.1x 4.6x 1.5x 1.2x $1.10 $1.32 $1.33 3.6x 3.6x $8.31 $7.50 64%Tourmaline Oil TOU OP Payne 272.0 $17.92 $4,875 2% 5.3x 4.9x 4.0x 1.3x 0.9x $4.47 $4.71 $5.63 3.8x 3.2x $28.62 $30.00 70% Vermilion Energy Inc. VET OP Wood 152.8 $32.20 $4,916 9% 8.0x 7.7x 5.8x 2.3x 1.7x $4.93 $5.81 $7.06 6.0x 4.6x $47.46 $41.00 36%Whitecap Resources WCP OP Wood 413.2 $4.43 $1,830 7% 5.8x 4.1x 4.4x 1.8x 1.9x $1.37 $1.68 $1.56 2.6x 2.8x $6.66 $8.00 88%
Small CapAdvantage Oil & Gas AAV OP Payne 186.2 $2.05 $382 0% 3.2x 4.2x 4.3x 1.8x 2.1x $0.97 $0.74 $0.80 2.8x 2.6x $7.08 $4.00 95%Bellatrix Exploration BXE SP Payne 68.5 $0.66 $45 0% 5.0x 5.8x 8.0x 8.9x 14.3x $1.18 $0.80 $0.45 0.8x 1.5x $2.74 $1.20 82%Bonavista Energy BNP SP Wood 260.0 $1.22 $317 3% 3.4x 3.8x 4.3x 3.0x 3.4x $1.15 $0.98 $0.79 1.2x 1.5x $4.12 $1.20 2%Bonterra Energy BNE SP Payne 33.3 $5.87 $196 2% 4.3x 4.3x 4.6x 3.1x 3.3x $3.08 $3.18 $2.78 1.8x 2.1x $25.67 $9.00 55% Cardinal Energy CJ OP Payne 119.6 $2.18 $261 6% 5.8x 6.0x 3.9x 3.6x 1.9x $0.87 $0.65 $0.88 3.4x 2.5x $4.25 $4.25 100%Chinook Energy CKE SP Payne 223.6 $0.13 $29 0% 6.2x 11.9x 20.1x 1.1x 1.9x $0.02 $0.01 $0.01 11.6x 21.9x $0.40 $0.20 54%Crew Energy CR OP Payne 159.6 $0.90 $144 0% 3.7x 4.9x 4.1x 4.6x 3.7x $0.72 $0.51 $0.64 1.7x 1.4x $11.07 $2.00 122%Gear Energy GXE OP Hunt 218.8 $0.61 $133 0% 3.4x 6.2x 3.4x 2.7x 1.3x $0.21 $0.16 $0.27 3.8x 2.2x $1.73 $1.10 80%Granite Oil GXO SP Hunt 39.2 $0.65 $25 0% 2.4x 6.1x 4.0x 4.8x 2.8x $0.71 $0.28 $0.36 2.3x 1.8x $0.00 $1.10 69%InPlay Oil IPO OP Hunt 67.9 $1.05 $71 0% 6.3x 4.2x 3.1x 1.9x 1.4x $0.40 $0.40 $0.55 2.6x 1.9x $0.00 $2.00 90% Leucrotta Energy LXE OP Payne 200.5 $1.08 $216 0% 21.9x 14.8x 16.3x 0.0x 0.5x $0.05 $0.07 $0.07 14.9x 16.3x $1.37 $2.00 86%Obsidian Energy OBE SP Payne 515.4 $0.53 $273 0% 3.0x 7.6x 4.5x 6.3x 3.6x $0.38 $0.16 $0.27 3.3x 2.0x $2.59 $0.80 51%Painted Pony Energy PONY SP Payne 161.0 $1.35 $217 0% 4.7x 4.0x 5.1x 3.1x 4.3x $0.75 $0.80 $0.59 1.7x 2.3x $22.85 $1.75 30%Pengrowth Energy PGF SP Hunt 556.9 $0.77 $429 0% 7.8x 10.4x 7.7x 11.5x 6.7x $0.13 $0.11 $0.17 7.3x 4.6x $0.00 $0.90 17%PetroShale PSH OP Hunt 191.7 $1.11 $213 0% 10.7x 6.1x 3.2x 2.9x 1.5x $0.31 $0.35 $0.62 3.2x 1.8x $0.00 $2.75 148%Petrus Resources PRQ OP Hunt 49.5 $0.51 $25 0% 3.3x 4.1x 3.9x 4.4x 4.2x $0.92 $0.66 $0.67 0.8x 0.8x $5.12 $1.00 96% Pinecliff Energy PNE SP Payne 307.1 $0.26 $80 0% 4.1x 14.3x 15.1x 9.8x 11.1x $0.09 $0.02 $0.02 12.2x 13.0x $0.01 $0.30 15%Pipestone Energy PIPE OP Payne 189.6 $1.79 $143 0% 162.3x 29.5x 36.2x 8.7x 27.3x $0.03 $0.08 $0.04 22.0x 46.9x $28.62 $3.50 96%Storm Resources SRX SP Payne 121.6 $1.88 $229 0% 4.9x 3.8x 4.2x 1.3x 1.8x $0.53 $0.69 $0.69 0.0x 0.0x $6.25 $3.25 73%Surge Energy SGY OP Payne 317.9 $1.35 $429 7% 4.9x 6.8x 5.4x 3.9x 3.2x $0.45 $0.47 $0.48 2.9x 2.8x $28.62 $2.25 74% Yangarra Resources YGR OP Hunt 86.1 $2.98 $257 0% 6.2x 4.9x 3.3x 2.0x 1.2x $0.63 $0.93 $1.34 3.2x 2.2x $7.50 $5.50 85%
* Rating System: OP = Outperform; SP = Sector Perform; UP = Underperform; T = Tender; UR = Under Review; R = Restricted
Cash Flow PriceEV/DACF Net Debt/ CFPS - FD P/CFPS 12-Mth
Travis Wood Analyst 403-290-5102 —Associates:John Hunt: 403-441-0955 Brad Lenz: 403-441-0928 Alex Reid: 403-290-5627
Dan Payne Analyst 403-290-5441 —Associates:Mitch Mastel: 403-441-0952Andrew Nguyen: 403-290-5445
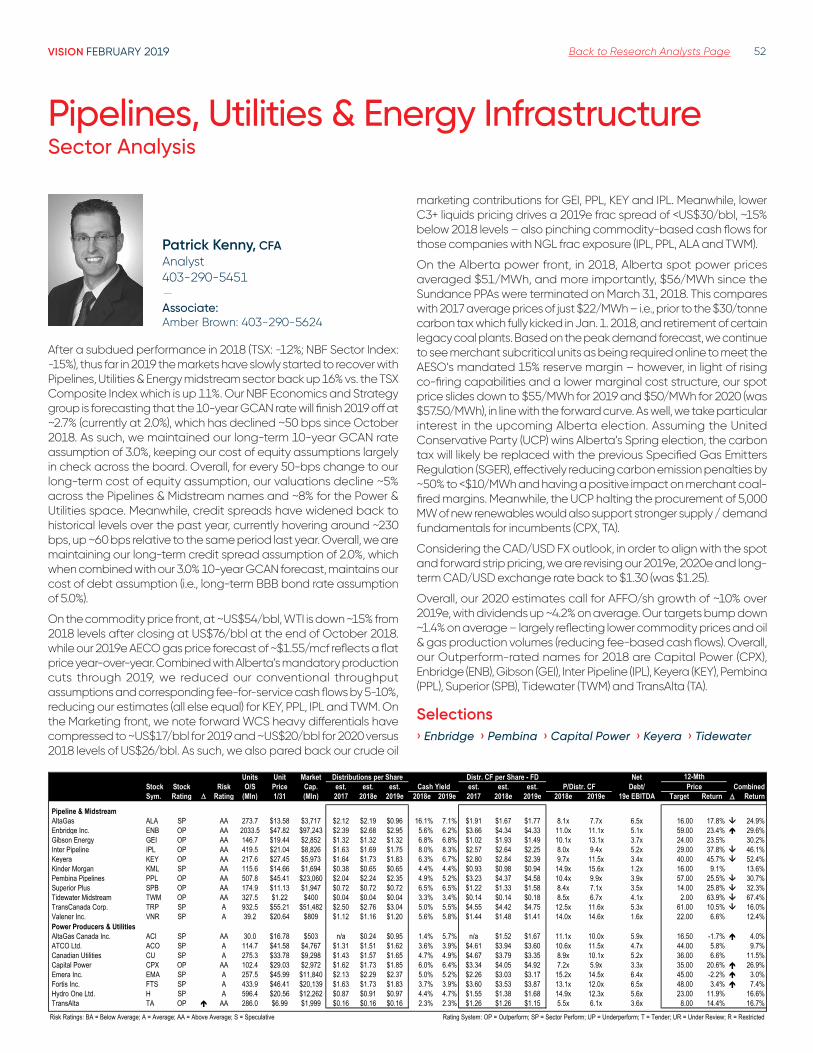
VISION FEBRUARY 2019 Back to Research Analysts Page 52
Pipelines, Utilities & Energy InfrastructureSector Analysis
Patrick Kenny, CFA Analyst 403-290-5451 —
Associate: Amber Brown: 403-290-5624
After a subdued performance in 2018 (TSX: -12%; NBF Sector Index: -15%), thus far in 2019 the markets have slowly started to recover with Pipelines, Utilities & Energy midstream sector back up 16% vs. the TSX Composite Index which is up 11%. Our NBF Economics and Strategy group is forecasting that the 10-year GCAN rate will finish 2019 off at ~2.7% (currently at 2.0%), which has declined ~50 bps since October 2018. As such, we maintained our long-term 10-year GCAN rate assumption of 3.0%, keeping our cost of equity assumptions largely in check across the board. Overall, for every 50-bps change to our long-term cost of equity assumption, our valuations decline ~5% across the Pipelines & Midstream names and ~8% for the Power & Utilities space. Meanwhile, credit spreads have widened back to historical levels over the past year, currently hovering around ~230 bps, up ~60 bps relative to the same period last year. Overall, we are maintaining our long-term credit spread assumption of 2.0%, which when combined with our 3.0% 10-year GCAN forecast, maintains our cost of debt assumption (i.e., long-term BBB bond rate assumption of 5.0%).
On the commodity price front, at ~US$54/bbl, WTI is down ~15% from 2018 levels after closing at US$76/bbl at the end of October 2018. while our 2019e AECO gas price forecast of ~$1.55/mcf reflects a flat price year-over-year. Combined with Alberta’s mandatory production cuts through 2019, we reduced our conventional throughput assumptions and corresponding fee-for-service cash flows by 5-10%, reducing our estimates (all else equal) for KEY, PPL, IPL and TWM. On the Marketing front, we note forward WCS heavy differentials have compressed to ~US$17/bbl for 2019 and ~US$20/bbl for 2020 versus 2018 levels of US$26/bbl. As such, we also pared back our crude oil
marketing contributions for GEI, PPL, KEY and IPL. Meanwhile, lower C3+ liquids pricing drives a 2019e frac spread of <US$30/bbl, ~15% below 2018 levels – also pinching commodity-based cash flows for those companies with NGL frac exposure (IPL, PPL, ALA and TWM).
On the Alberta power front, in 2018, Alberta spot power prices averaged $51/MWh, and more importantly, $56/MWh since the Sundance PPAs were terminated on March 31, 2018. This compares with 2017 average prices of just $22/MWh – i.e., prior to the $30/tonne carbon tax which fully kicked in Jan. 1. 2018, and retirement of certain legacy coal plants. Based on the peak demand forecast, we continue to see merchant subcritical units as being required online to meet the AESO’s mandated 15% reserve margin – however, in light of rising co-firing capabilities and a lower marginal cost structure, our spot price slides down to $55/MWh for 2019 and $50/MWh for 2020 (was $57.50/MWh), in line with the forward curve. As well, we take particular interest in the upcoming Alberta election. Assuming the United Conservative Party (UCP) wins Alberta’s Spring election, the carbon tax will likely be replaced with the previous Specified Gas Emitters Regulation (SGER), effectively reducing carbon emission penalties by ~50% to <$10/MWh and having a positive impact on merchant coal-fired margins. Meanwhile, the UCP halting the procurement of 5,000 MW of new renewables would also support stronger supply / demand fundamentals for incumbents (CPX, TA).
Considering the CAD/USD FX outlook, in order to align with the spot and forward strip pricing, we are revising our 2019e, 2020e and long-term CAD/USD exchange rate back to $1.30 (was $1.25).
Overall, our 2020 estimates call for AFFO/sh growth of ~10% over 2019e, with dividends up ~4.2% on average. Our targets bump down ~1.4% on average – largely reflecting lower commodity prices and oil & gas production volumes (reducing fee-based cash flows). Overall, our Outperform-rated names for 2018 are Capital Power (CPX), Enbridge (ENB), Gibson (GEI), Inter Pipeline (IPL), Keyera (KEY), Pembina (PPL), Superior (SPB), Tidewater (TWM) and TransAlta (TA).
Selections› Enbridge › Pembina › Capital Power › Keyera › Tidewater
Units Unit Market NetStock Stock Risk O/S Price Cap. est. est. est. est. est. est. Debt/ Price CombinedSym. Rating Rating (Mln) 1/31 (Mln) 2017 2018e 2019e 2018e 2019e 2017 2018e 2019e 2018e 2019e 19e EBITDA Target Return Return
Pipeline & MidstreamAltaGas ALA SP AA 273.7 $13.58 $3,717 $2.12 $2.19 $0.96 16.1% 7.1% $1.91 $1.67 $1.77 8.1x 7.7x 6.5x 16.00 17.8% 24.9%Enbridge Inc. ENB OP AA 2033.5 $47.82 $97,243 $2.39 $2.68 $2.95 5.6% 6.2% $3.66 $4.34 $4.33 11.0x 11.1x 5.1x 59.00 23.4% 29.6%Gibson Energy GEI OP AA 146.7 $19.44 $2,852 $1.32 $1.32 $1.32 6.8% 6.8% $1.02 $1.93 $1.49 10.1x 13.1x 3.7x 24.00 23.5% 30.2%Inter Pipeline IPL OP AA 419.5 $21.04 $8,826 $1.63 $1.69 $1.75 8.0% 8.3% $2.57 $2.64 $2.25 8.0x 9.4x 5.2x 29.00 37.8% 46.1%Keyera KEY OP AA 217.6 $27.45 $5,973 $1.64 $1.73 $1.83 6.3% 6.7% $2.80 $2.84 $2.39 9.7x 11.5x 3.4x 40.00 45.7% 52.4%Kinder Morgan KML SP AA 115.6 $14.66 $1,694 $0.38 $0.65 $0.65 4.4% 4.4% $0.93 $0.98 $0.94 14.9x 15.6x 1.2x 16.00 9.1% 13.6%Pembina Pipelines PPL OP AA 507.8 $45.41 $23,060 $2.04 $2.24 $2.35 4.9% 5.2% $3.23 $4.37 $4.58 10.4x 9.9x 3.9x 57.00 25.5% 30.7%Superior Plus SPB OP AA 174.9 $11.13 $1,947 $0.72 $0.72 $0.72 6.5% 6.5% $1.22 $1.33 $1.58 8.4x 7.1x 3.5x 14.00 25.8% 32.3%Tidewater Midstream TWM OP AA 327.5 $1.22 $400 $0.04 $0.04 $0.04 3.3% 3.4% $0.14 $0.14 $0.18 8.5x 6.7x 4.1x 2.00 63.9% 67.4%TransCanada Corp. TRP SP A 932.5 $55.21 $51,482 $2.50 $2.76 $3.04 5.0% 5.5% $4.55 $4.42 $4.75 12.5x 11.6x 5.3x 61.00 10.5% 16.0%Valener Inc. VNR SP A 39.2 $20.64 $809 $1.12 $1.16 $1.20 5.6% 5.8% $1.44 $1.48 $1.41 14.0x 14.6x 1.6x 22.00 6.6% 12.4%Veresen Inc. VSN #N/A #N/A #N/A #N/A #N/A #N/A #N/A #N/A #N/A #N/A #N/A #N/A #N/A #N/A 12.7x #N/A #N/A #N/A #N/APower Producers & UtilitiesAltaGas Canada Inc. ACI SP AA 30.0 $16.78 $503 n/a $0.24 $0.95 1.4% 5.7% n/a $1.52 $1.67 11.1x 10.0x 5.9x 16.50 -1.7% 4.0%ATCO Ltd. ACO SP A 114.7 $41.58 $4,767 $1.31 $1.51 $1.62 3.6% 3.9% $4.61 $3.94 $3.60 10.6x 11.5x 4.7x 44.00 5.8% 9.7%Canadian Utilities CU SP A 275.3 $33.78 $9,298 $1.43 $1.57 $1.65 4.7% 4.9% $4.67 $3.79 $3.35 8.9x 10.1x 5.2x 36.00 6.6% 11.5%Capital Power CPX OP AA 102.4 $29.03 $2,972 $1.62 $1.73 $1.85 6.0% 6.4% $3.34 $4.05 $4.92 7.2x 5.9x 3.3x 35.00 20.6% 26.9%Emera Inc. EMA SP A 257.5 $45.99 $11,840 $2.13 $2.29 $2.37 5.0% 5.2% $2.26 $3.03 $3.17 15.2x 14.5x 6.4x 45.00 -2.2% 3.0%Fortis Inc. FTS SP A 433.9 $46.41 $20,139 $1.63 $1.73 $1.83 3.7% 3.9% $3.60 $3.53 $3.87 13.1x 12.0x 6.5x 48.00 3.4% 7.4%Hydro One Ltd. H SP A 596.4 $20.56 $12,262 $0.87 $0.91 $0.97 4.4% 4.7% $1.55 $1.38 $1.68 14.9x 12.3x 5.6x 23.00 11.9% 16.6%TransAlta TA OP AA 286.0 $6.99 $1,999 $0.16 $0.16 $0.16 2.3% 2.3% $1.26 $1.26 $1.15 5.5x 6.1x 3.6x 8.00 14.4% 16.7%
Risk Ratings: BA = Below Average; A = Average; AA = Above Average; S = Speculative Rating System: OP = Outperform; SP = Sector Perform; UP = Underperform; T = Tender; UR = Under Review; R = Restricted
12-MthDistributions per Share Distr. CF per Share - FDCash Yield P/Distr. CF

VISION FEBRUARY 2019 Back to Research Analysts Page 53
Real EstateSector Analysis
A year of clear favorites2018 saw the Canadian REIT index outperform the TSX however investors clearly preferred the multi-family and industrial asset classes, even during the broader market downturn seen towards the end of the year. The multi-family and industrial REITs closed the year up 9.4% and 11.8% respectively, with the remaining classes posting negative returns.
Ironically, there was much skepticism regarding the outlook of Canada’s industrial sector, as trade tensions with the U.S. could have hurt the asset class. However, the privatization of PIRET led to a rerating of the sector that paved the way for more capital to flow into the asset class throughout the year. Positive developments from our only non-Canadian focused industrial name, WPT, meant that the industrial sector was the only asset class that saw our entire coverage universe end the year higher. Going into 2019, industrial REITs are facing fewer geopolitical headwinds, but slower economic growth prospects could dampen sentiment.
Momentum was also positive in the multi-family segment, despite a pullback towards the end of the year, particularly for Ontario focused names (CAR, IIP and, MI which completed its IPO during the summer). The lack of new supply, combined with positive dynamics from population growth, drove vacancies lower and rents higher. These dynamics remain in place today. Outside of Ontario, lower oil prices weighed on energy sensitive markets; but pressures from lower energy prices have eased off late.
Outside of the multi-family and industrial names, investor preferred higher quality assets, either from a geographical or asset quality perspective. The office segment provides the best example, as AP was the only REIT to post significant gains due to its ability to attract tech and media tenants because of its unique assets and urban portfolio. A similar trend could be seen in the retail sector where REI and SRU were able to significantly outperform their retail peers as their urban and to some extent stronger development pipeline set them apart from their peer group.
Lastly, the seniors and diversified sectors were the clear laggards. The markets preference to self diversify and a slew of idiosyncratic factors have weighed on the diversified sector causing many of them to stream line their portfolios and operations throughout much of 2018, with worst behind them the sector is now poised to offer some of the highest returns in the real estate sector. The outlook for seniors is also structurally positive due to demographics, although near term supply absorption issues and labor costs could continue to weigh on operational performance.
Selections› Allied Properties REIT - (AP.un: TSX; $48.00 target)
› BSR REIT - (HOM.u, TSX, US$11.50 target)
› Cominar REIT - (CUF.un: TSX; $16.00 target)
› Crombie REIT - (CRR.un: TSX; $15.00 target)
› Dream Global REIT - (DRG.un: TSX; $15.50 target)
› Dream Industrial REIT - (DIR.un: TSX; $11.25 target)
› H&R REIT - (HR.un: TSX; $26.50 target)
› Killam Apartment REIT - (KMP.un: TSX, $18.00 target)
› Pure Multi-Family - (RUF.u: TSX.V, US$7.00 target)
› RioCan REIT - (REI.un: TSX; $28.00 target)
› StorageVault Canada Inc. - (SVI: TSX.V; $3.25 target)
› Sienna Senior Living - (SIA, TSX, $18.50 target)
› Tricon Capital Group - (TCN, TSX, $13.00 target)
› WPT Industrial REIT - (WIR.u : TSX; US$15.00 target)
› CT REIT - (CRT.un: TSX; $14.50 target)
Tal Woolley Analyst 416-507-8009 —
Associate: Eric Kim: 416-869-7566
Matt Kornack Analyst 416-507-8104 —
Associate: Hussam Maqbool: 416-507-8108
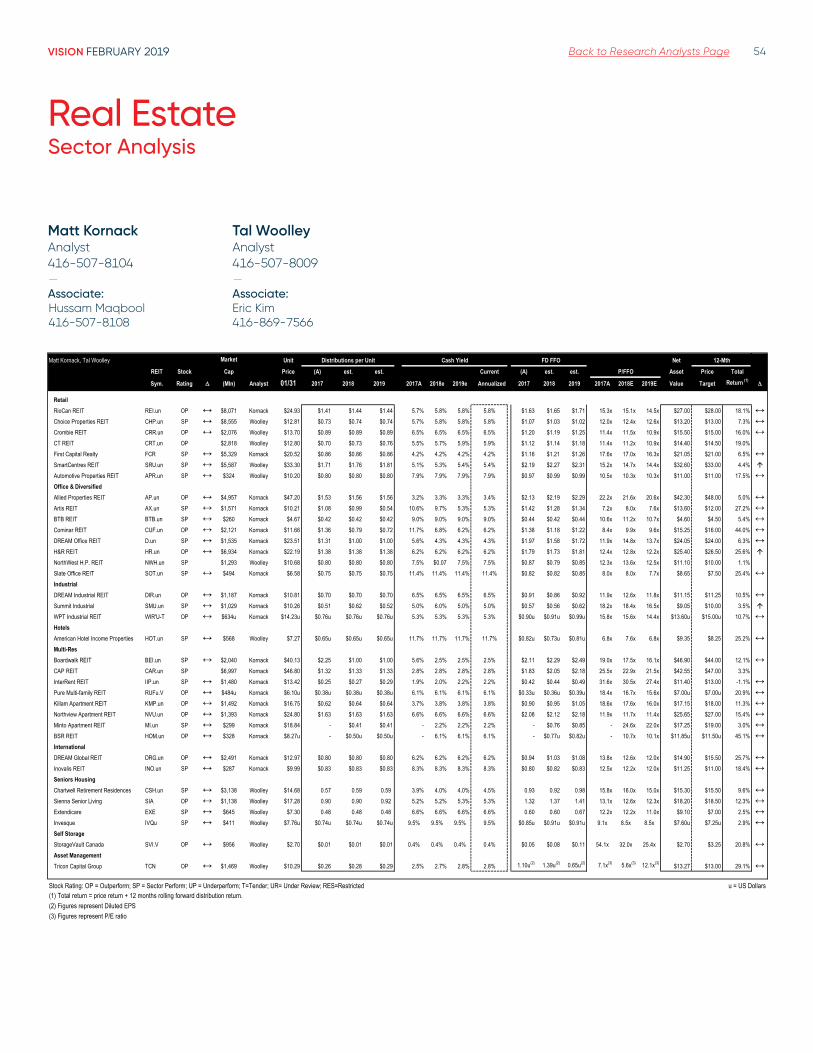
VISION FEBRUARY 2019 Back to Research Analysts Page 54
Real EstateSector Analysis
Market Unit FD FFO Net
REIT Stock Cap Price (A) est. est. Current (A) est. est. P/FFO Asset Total
Sym. Rating (Mln) Analyst 01/31 2017 2018 2019 2017A 2018e 2019e Annualized 2017 2018 2019 2017A 2018E 2019E Value Target Return (1)
RetailRioCan REIT REI.un OP ↔ $8,071 Kornack $24.93 $1.41 $1.44 $1.44 5.7% 5.8% 5.8% 5.8% $1.63 $1.65 $1.71 15.3x 15.1x 14.5x $27.00 $28.00 18.1% ↔Choice Properties REIT CHP.un SP ↔ $8,555 Woolley $12.81 $0.73 $0.74 $0.74 5.7% 5.8% 5.8% 5.8% $1.07 $1.03 $1.02 12.0x 12.4x 12.6x $13.20 $13.00 7.3% ↔Crombie REIT CRR.un OP ↔ $2,076 Woolley $13.70 $0.89 $0.89 $0.89 6.5% 6.5% 6.5% 6.5% $1.20 $1.19 $1.25 11.4x 11.5x 10.9x $15.50 $15.00 16.0% ↔CT REIT CRT.un OP $2,818 Woolley $12.80 $0.70 $0.73 $0.76 5.5% 5.7% 5.9% 5.9% $1.12 $1.14 $1.18 11.4x 11.2x 10.9x $14.40 $14.50 19.0%First Capital Realty FCR SP ↔ $5,329 Kornack $20.52 $0.86 $0.86 $0.86 4.2% 4.2% 4.2% 4.2% $1.16 $1.21 $1.26 17.6x 17.0x 16.3x $21.05 $21.00 6.5% ↔SmartCentres REIT SRU.un SP ↔ $5,587 Woolley $33.30 $1.71 $1.76 $1.81 5.1% 5.3% 5.4% 5.4% $2.19 $2.27 $2.31 15.2x 14.7x 14.4x $32.60 $33.00 4.4%
Automotive Properties REIT APR.un SP ↔ $324 Woolley $10.20 $0.80 $0.80 $0.80 7.9% 7.9% 7.9% 7.9% $0.97 $0.99 $0.99 10.5x 10.3x 10.3x $11.00 $11.00 17.5% ↔Office & DiversifiedAllied Properties REIT AP.un OP ↔ $4,957 Kornack $47.20 $1.53 $1.56 $1.56 3.2% 3.3% 3.3% 3.4% $2.13 $2.19 $2.29 22.2x 21.6x 20.6x $42.30 $48.00 5.0% ↔Artis REIT AX.un SP ↔ $1,571 Kornack $10.21 $1.08 $0.99 $0.54 10.6% 9.7% 5.3% 5.3% $1.42 $1.28 $1.34 7.2x 8.0x 7.6x $13.60 $12.00 27.2% ↔BTB REIT BTB.un SP ↔ $260 Kornack $4.67 $0.42 $0.42 $0.42 9.0% 9.0% 9.0% 9.0% $0.44 $0.42 $0.44 10.6x 11.2x 10.7x $4.60 $4.50 5.4% ↔Cominar REIT CUF.un OP ↔ $2,121 Kornack $11.66 $1.36 $0.79 $0.72 11.7% 6.8% 6.2% 6.2% $1.38 $1.18 $1.22 8.4x 9.9x 9.6x $15.25 $16.00 44.0% ↔DREAM Office REIT D.un SP ↔ $1,535 Kornack $23.51 $1.31 $1.00 $1.00 5.6% 4.3% 4.3% 4.3% $1.97 $1.58 $1.72 11.9x 14.8x 13.7x $24.05 $24.00 6.3% ↔H&R REIT HR.un OP ↔ $6,934 Kornack $22.19 $1.38 $1.38 $1.38 6.2% 6.2% 6.2% 6.2% $1.79 $1.73 $1.81 12.4x 12.8x 12.2x $25.40 $26.50 25.6%
NorthWest H.P. REIT NWH.un SP $1,293 Woolley $10.68 $0.80 $0.80 $0.80 7.5% $0.07 7.5% 7.5% $0.87 $0.79 $0.85 12.3x 13.6x 12.5x $11.10 $10.00 1.1%Slate Office REIT SOT.un SP ↔ $494 Kornack $6.58 $0.75 $0.75 $0.75 11.4% 11.4% 11.4% 11.4% $0.82 $0.82 $0.85 8.0x 8.0x 7.7x $8.65 $7.50 25.4% ↔IndustrialDREAM Industrial REIT DIR.un OP ↔ $1,187 Kornack $10.81 $0.70 $0.70 $0.70 6.5% 6.5% 6.5% 6.5% $0.91 $0.86 $0.92 11.9x 12.6x 11.8x $11.15 $11.25 10.5% ↔Summit Industrial SMU.un SP ↔ $1,029 Kornack $10.26 $0.51 $0.62 $0.52 5.0% 6.0% 5.0% 5.0% $0.57 $0.56 $0.62 18.2x 18.4x 16.5x $9.05 $10.00 3.5%
WPT Industrial REIT WIR'U-T OP ↔ $634u Kornack $14.23u $0.76u $0.76u $0.76u 5.3% 5.3% 5.3% 5.3% $0.90u $0.91u $0.99u 15.8x 15.6x 14.4x $13.60u $15.00u 10.7% ↔HotelsAmerican Hotel Income Properties HOT.un SP ↔ $568 Woolley $7.27 $0.65u $0.65u $0.65u 11.7% 11.7% 11.7% 11.7% $0.82u $0.73u $0.81u 6.8x 7.6x 6.8x $9.35 $8.25 25.2% ↔Multi-ResBoardwalk REIT BEI.un SP ↔ $2,040 Kornack $40.13 $2.25 $1.00 $1.00 5.6% 2.5% 2.5% 2.5% $2.11 $2.29 $2.49 19.0x 17.5x 16.1x $46.90 $44.00 12.1% ↔CAP REIT CAR.un SP $6,997 Kornack $46.80 $1.32 $1.33 $1.33 2.8% 2.8% 2.8% 2.8% $1.83 $2.05 $2.18 25.5x 22.9x 21.5x $42.55 $47.00 3.3%InterRent REIT IIP.un SP ↔ $1,480 Kornack $13.42 $0.25 $0.27 $0.29 1.9% 2.0% 2.2% 2.2% $0.42 $0.44 $0.49 31.6x 30.5x 27.4x $11.40 $13.00 -1.1% ↔Pure Multi-family REIT RUFu.V OP ↔ $484u Kornack $6.10u $0.38u $0.38u $0.38u 6.1% 6.1% 6.1% 6.1% $0.33u $0.36u $0.39u 18.4x 16.7x 15.6x $7.00u $7.00u 20.9% ↔Killam Apartment REIT KMP.un OP ↔ $1,492 Kornack $16.75 $0.62 $0.64 $0.64 3.7% 3.8% 3.8% 3.8% $0.90 $0.95 $1.05 18.6x 17.6x 16.0x $17.15 $18.00 11.3% ↔Northview Apartment REIT NVU.un OP ↔ $1,393 Kornack $24.80 $1.63 $1.63 $1.63 6.6% 6.6% 6.6% 6.6% $2.08 $2.12 $2.18 11.9x 11.7x 11.4x $25.65 $27.00 15.4% ↔Minto Apartment REIT MI.un SP ↔ $299 Kornack $18.84 - $0.41 $0.41 - 2.2% 2.2% 2.2% - $0.76 $0.85 - 24.6x 22.0x $17.25 $19.00 3.0% ↔BSR REIT HOM.un OP ↔ $328 Kornack $8.27u - $0.50u $0.50u - 6.1% 6.1% 6.1% - $0.77u $0.82u - 10.7x 10.1x $11.85u $11.50u 45.1% ↔InternationalDREAM Global REIT DRG.un OP ↔ $2,491 Kornack $12.97 $0.80 $0.80 $0.80 6.2% 6.2% 6.2% 6.2% $0.94 $1.03 $1.08 13.8x 12.6x 12.0x $14.90 $15.50 25.7% ↔Inovalis REIT INO.un SP ↔ $287 Kornack $9.99 $0.83 $0.83 $0.83 8.3% 8.3% 8.3% 8.3% $0.80 $0.82 $0.83 12.5x 12.2x 12.0x $11.25 $11.00 18.4% ↔Seniors Housing Chartwell Retirement Residences CSH.un SP ↔ $3,138 Woolley $14.68 0.57 0.59 0.59 3.9% 4.0% 4.0% 4.5% 0.93 0.92 0.98 15.8x 16.0x 15.0x $15.30 $15.50 9.6% ↔Sienna Senior Living SIA OP ↔ $1,138 Woolley $17.28 0.90 0.90 0.92 5.2% 5.2% 5.3% 5.3% 1.32 1.37 1.41 13.1x 12.6x 12.3x $18.20 $18.50 12.3% ↔Extendicare EXE SP ↔ $645 Woolley $7.30 0.48 0.48 0.48 6.6% 6.6% 6.6% 6.6% 0.60 0.60 0.67 12.2x 12.2x 11.0x $9.10 $7.00 2.5% ↔Invesque IVQu SP ↔ $411 Woolley $7.76u $0.74u $0.74u $0.74u 9.5% 9.5% 9.5% 9.5% $0.85u $0.91u $0.91u 9.1x 8.5x 8.5x $7.60u $7.25u 2.9% ↔Self StorageStorageVault Canada SVI.V OP ↔ $956 Woolley $2.70 $0.01 $0.01 $0.01 0.4% 0.4% 0.4% 0.4% $0.05 $0.08 $0.11 54.1x 32.0x 25.4x $2.70 $3.25 20.8% ↔Asset ManagementTricon Capital Group TCN OP ↔ $1,469 Woolley $10.29 $0.26 $0.28 $0.29 2.5% 2.7% 2.8% 2.8% 1.10u(2) 1.39u(2) 0.65u(2) 7.1x(3) 5.6x(3) 12.1x(3) $13.27 $13.00 29.1% ↔
Stock Rating: OP = Outperform; SP = Sector Perform; UP = Underperform; T=Tender; UR= Under Review; RES=Restricted u = US Dollars(1) Total return = price return + 12 months rolling forward distribution return.(2) Figures represent Diluted EPS(3) Figures represent P/E ratio
12-Mth
Price
Cash YieldMatt Kornack, Tal Woolley Distributions per Unit
Tal Woolley Analyst 416-507-8009 —Associate: Eric Kim416-869-7566
Matt Kornack Analyst 416-507-8104 —Associate: Hussam Maqbool416-507-8108
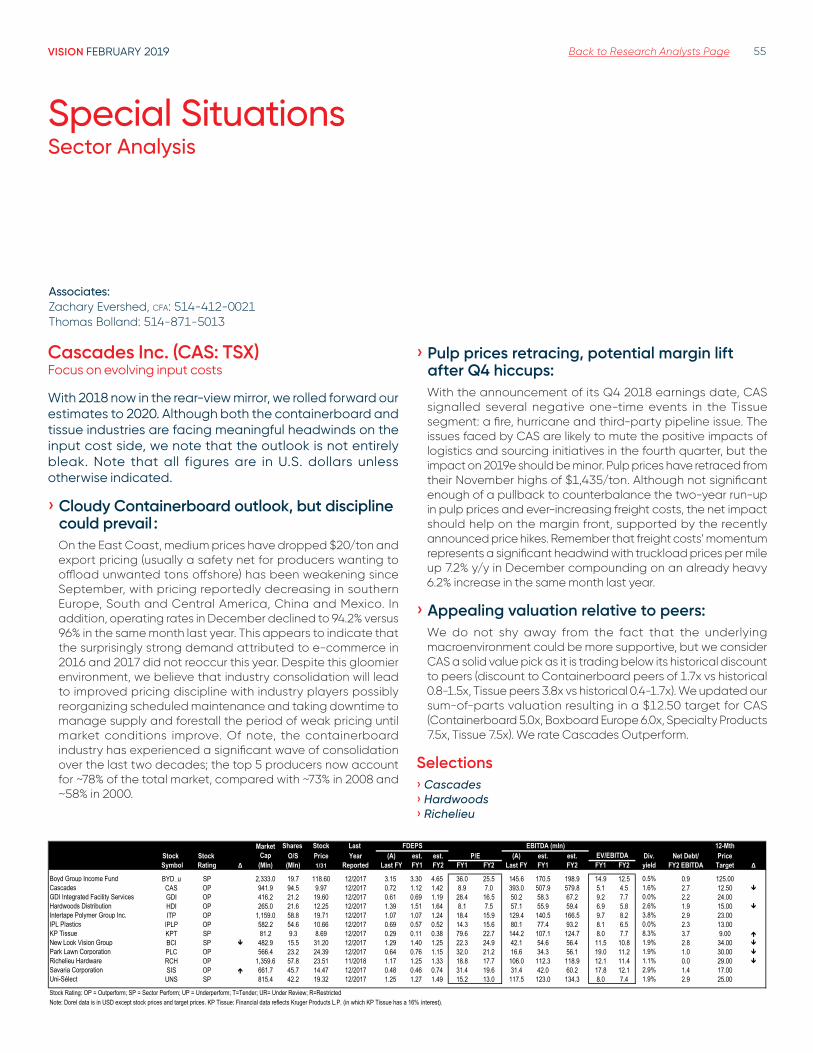
VISION FEBRUARY 2019 Back to Research Analysts Page 55
Special SituationsSector Analysis
Associates: Zachary Evershed, cfa: 514-412-0021Thomas Bolland: 514-871-5013
Cascades Inc . (CAS: TSX)Focus on evolving input costs
With 2018 now in the rear-view mirror, we rolled forward our estimates to 2020. Although both the containerboard and tissue industries are facing meaningful headwinds on the input cost side, we note that the outlook is not entirely bleak. Note that all figures are in U.S. dollars unless otherwise indicated.
› Cloudy Containerboard outlook, but discipline could prevail :On the East Coast, medium prices have dropped $20/ton and export pricing (usually a safety net for producers wanting to offload unwanted tons offshore) has been weakening since September, with pricing reportedly decreasing in southern Europe, South and Central America, China and Mexico. In addition, operating rates in December declined to 94.2% versus 96% in the same month last year. This appears to indicate that the surprisingly strong demand attributed to e-commerce in 2016 and 2017 did not reoccur this year. Despite this gloomier environment, we believe that industry consolidation will lead to improved pricing discipline with industry players possibly reorganizing scheduled maintenance and taking downtime to manage supply and forestall the period of weak pricing until market conditions improve. Of note, the containerboard industry has experienced a significant wave of consolidation over the last two decades; the top 5 producers now account for ~78% of the total market, compared with ~73% in 2008 and ~58% in 2000.
› Pulp prices retracing, potential margin lift after Q4 hiccups:With the announcement of its Q4 2018 earnings date, CAS signalled several negative one-time events in the Tissue segment: a fire, hurricane and third-party pipeline issue. The issues faced by CAS are likely to mute the positive impacts of logistics and sourcing initiatives in the fourth quarter, but the impact on 2019e should be minor. Pulp prices have retraced from their November highs of $1,435/ton. Although not significant enough of a pullback to counterbalance the two-year run-up in pulp prices and ever-increasing freight costs, the net impact should help on the margin front, supported by the recently announced price hikes. Remember that freight costs’ momentum represents a significant headwind with truckload prices per mile up 7.2% y/y in December compounding on an already heavy 6.2% increase in the same month last year.
› Appealing valuation relative to peers:We do not shy away from the fact that the underlying macroenvironment could be more supportive, but we consider CAS a solid value pick as it is trading below its historical discount to peers (discount to Containerboard peers of 1.7x vs historical 0.8-1.5x, Tissue peers 3.8x vs historical 0.4-1.7x). We updated our sum-of-parts valuation resulting in a $12.50 target for CAS (Containerboard 5.0x, Boxboard Europe 6.0x, Specialty Products 7.5x, Tissue 7.5x). We rate Cascades Outperform.
Selections› Cascades › Hardwoods› Richelieu
Market Shares Stock Last 12-MthStock Stock Cap O/S Price Year (A) est. est. P/E (A) est. est. Div. Net Debt/ Price
Symbol Rating ∆ (Mln) (Mln) 1/31 Reported Last FY FY1 FY2 FY1 FY2 Last FY FY1 FY2 FY1 FY2 yield FY2 EBITDA Target ∆
Boyd Group Income Fund BYD_u SP 2,333.0 19.7 118.60 12/2017 3.15 3.30 4.65 36.0 25.5 145.6 170.5 198.9 14.9 12.5 0.5% 0.9 125.00Cascades CAS OP 941.9 94.5 9.97 12/2017 0.72 1.12 1.42 8.9 7.0 393.0 507.9 579.8 5.1 4.5 1.6% 2.7 12.50
GDI Integrated Facility Services GDI OP 416.2 21.2 19.60 12/2017 0.61 0.69 1.19 28.4 16.5 50.2 58.3 67.2 9.2 7.7 0.0% 2.2 24.00Hardwoods Distribution HDI OP 265.0 21.6 12.25 12/2017 1.39 1.51 1.64 8.1 7.5 57.1 55.9 59.4 6.9 5.8 2.6% 1.9 15.00
Intertape Polymer Group Inc. ITP OP 1,159.0 58.8 19.71 12/2017 1.07 1.07 1.24 18.4 15.9 129.4 140.5 166.5 9.7 8.2 3.8% 2.9 23.00IPL Plastics IPLP OP 582.2 54.6 10.66 12/2017 0.69 0.57 0.52 14.3 15.6 80.1 77.4 93.2 8.1 6.5 0.0% 2.3 13.00KP Tissue KPT SP 81.2 9.3 8.69 12/2017 0.29 0.11 0.38 79.6 22.7 144.2 107.1 124.7 8.0 7.7 8.3% 3.7 9.00
New Look Vision Group BCI SP 482.9 15.5 31.20 12/2017 1.29 1.40 1.25 22.3 24.9 42.1 54.6 56.4 11.5 10.8 1.9% 2.8 34.00
Park Lawn Corporation PLC OP 566.4 23.2 24.39 12/2017 0.64 0.76 1.15 32.0 21.2 16.6 34.3 56.1 19.0 11.2 1.9% 1.0 30.00
Richelieu Hardware RCH OP 1,359.6 57.8 23.51 11/2018 1.17 1.25 1.33 18.8 17.7 106.0 112.3 118.9 12.1 11.4 1.1% 0.0 29.00
Savaria Corporation SIS OP 661.7 45.7 14.47 12/2017 0.48 0.46 0.74 31.4 19.6 31.4 42.0 60.2 17.8 12.1 2.9% 1.4 17.00Uni-Sélect UNS SP 815.4 42.2 19.32 12/2017 1.25 1.27 1.49 15.2 13.0 117.5 123.0 134.3 8.0 7.4 1.9% 2.9 25.00
Stock Rating: OP = Outperform; SP = Sector Perform; UP = Underperform; T=Tender; UR= Under Review; R=RestrictedNote: Dorel data is in USD except stock prices and target prices. KP Tissue: Financial data reflects Kruger Products L.P. (in which KP Tissue has a 16% interest).
EV/EBITDAEBITDA (mln)FDEPS
VISION FEBRUARY 2019 Back to Research Analysts Page 56
Sustainability & Clean TechSector Analysis
With less concern for rising rates and a recovery in the market, the IPP sector has performed relatively well over the last month. We believe that the sector still offers good value, with an opportunity for good dividends and capital appreciation. Over the coming 12 months the IPP sector should continue to exhibit good performance as a relatively safe haven for investment with some visibility on growth. We are looking for solid Q4 results from the group, with good wind, hydro and solar generation.
Recent Highlights:
› Boralex Inc . (BLX: TSX; Outperform; $23.50 target):BLX is a renewable power producer that specializes in wind farms with a presence in France, Canada and the United States. Q3 was a historical low point for French wind but initial data suggests that Q4 2018 wind generation should be closer to the long-term average. This coming Q4, BLX should also have full contribution from the recently acquired 201 MW Invenergy assets and the recently commissioned 89 MW in four new wind farms in France. With the recent acquisition of eight development projects in France, BLX now has 1,000 MW of development projects in France and is looking to move into offshore development along with partners. France is an attractive market with long-term contracts and plans to grow wind capacity to more than 22 GW by 2023 from 14 GW today. Although BLX carries some French concentration risk, we believe it should continue to outperform its peers through creating value by development and executing on asset recycling.
› Innergex Renewable Energy Inc . (INE: TSX; Outperform; $17.50 target):Innergex is a Canadian renewable power producer that develops, operates and owns renewable hydroelectric, wind power and solar projects across Canada, the United States, France and Iceland. Q4 results should be close to the LTA pushed by strong QC wind which could be offset by below LTA production in BC hydro. The recently acquired 260 MW solar project in the United States is almost construction-ready with a notice to proceed in hand. Growth includes a 315 MW solar project and a 350 MW wind project in the United States which should lead to diversification of its asset base. The 50% JV with Energia Llaima should lead to growth in Chile, with two hydro
facilities (125 MW) that could start construction in 2019E. Further, INE has PPAs to build 45 MW of solar and 180 MWh of Li storage batteries in Hawaii, with COD expected 2022E. To fund this growth, INE could sell its ownership in HS Orka, which could fetch over $350 million and will provide close to $300 million of equity to fund its growth pipeline. With this, INE may have more growth than its peers with visibility on financing.
› Northland Power Inc . (TSX: NPI; Outperform; $25.00 target):NPI holds interests in 2,040 MW (net) of operational capacity in natural gas-fired and renewable power generation. The company has an active growth pipeline, including a 269 MW offshore wind farm under construction in Germany and a 626 MW (net) offshore wind farm in advanced stages of development in Taiwan. It is also well positioned in new emerging offshore wind markets including Korea and Japan and could look to diversify into Mexico soon. NPI has the lowest cash flow duration in its peer group (less than six years) with generous but relatively short offshore wind contracts, implying lower interest rate risk. Further, the unique features in the Gemini project contract protect its revenues down to 80% of LTA production. Guidance is calling for a good Q4, implying quarterly adj. EBITDA of $200 million to $230 million as the yearly adj. EBITDA level was recently narrowed to the range of $870 million to $900 million.
Selections› Boralex › Innergex › Northland
Rupert Merer, P . Eng, CFA Analyst 416-869-8008
— Associates: Hassaan Khan: 416-869-7538 Adnan Waheed: 416-869-6763
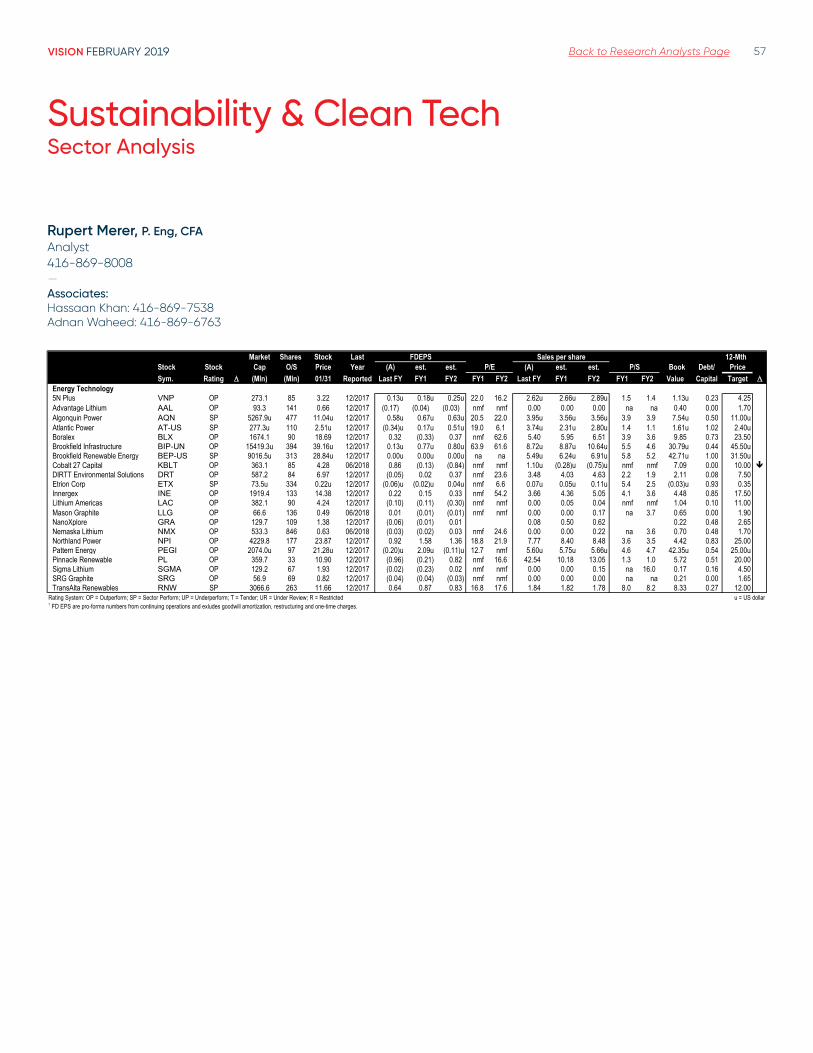
VISION FEBRUARY 2019 Back to Research Analysts Page 57
Sustainability & Clean TechSector Analysis
Rupert Merer, P . Eng, CFA Analyst 416-869-8008—Associates: Hassaan Khan: 416-869-7538Adnan Waheed: 416-869-6763
Market Shares Stock LastStock Stock Cap O/S Price Year (A) est. est. (A) est. est. P/S Book Debt/ PriceSym. Rating (Mln) (Mln) 01/31 Reported Last FY FY1 FY2 FY1 FY2 Last FY FY1 FY2 FY1 FY2 Value Capital Target
Energy Technology5N Plus VNP OP 273.1 85 3.22 12/2017 0.13u 0.18u 0.25u 22.0 16.2 2.62u 2.66u 2.89u 1.5 1.4 1.13u 0.23 4.25Advantage Lithium AAL OP 93.3 141 0.66 12/2017 (0.17) (0.04) (0.03) nmf nmf 0.00 0.00 0.00 na na 0.40 0.00 1.70Algonquin Power AQN SP 5267.9u 477 11.04u 12/2017 0.58u 0.67u 0.63u 20.5 22.0 3.95u 3.56u 3.56u 3.9 3.9 7.54u 0.50 11.00uAtlantic Power AT-US SP 277.3u 110 2.51u 12/2017 (0.34)u 0.17u 0.51u 19.0 6.1 3.74u 2.31u 2.80u 1.4 1.1 1.61u 1.02 2.40uBoralex BLX OP 1674.1 90 18.69 12/2017 0.32 (0.33) 0.37 nmf 62.6 5.40 5.95 6.51 3.9 3.6 9.85 0.73 23.50Brookfield Infrastructure BIP-UN OP 15419.3u 394 39.16u 12/2017 0.13u 0.77u 0.80u 63.9 61.6 8.72u 8.87u 10.64u 5.5 4.6 30.79u 0.44 45.50uBrookfield Renewable Energy BEP-US SP 9016.5u 313 28.84u 12/2017 0.00u 0.00u 0.00u na na 5.49u 6.24u 6.91u 5.8 5.2 42.71u 1.00 31.50uCobalt 27 Capital KBLT OP 363.1 85 4.28 06/2018 0.86 (0.13) (0.84) nmf nmf 1.10u (0.28)u (0.75)u nmf nmf 7.09 0.00 10.00 DIRTT Environmental Solutions DRT OP 587.2 84 6.97 12/2017 (0.05) 0.02 0.37 nmf 23.6 3.48 4.03 4.63 2.2 1.9 2.11 0.08 7.50Etrion Corp ETX SP 73.5u 334 0.22u 12/2017 (0.06)u (0.02)u 0.04u nmf 6.6 0.07u 0.05u 0.11u 5.4 2.5 (0.03)u 0.93 0.35Innergex INE OP 1919.4 133 14.38 12/2017 0.22 0.15 0.33 nmf 54.2 3.66 4.36 5.05 4.1 3.6 4.48 0.85 17.50Lithium Americas LAC OP 382.1 90 4.24 12/2017 (0.10) (0.11) (0.30) nmf nmf 0.00 0.05 0.04 nmf nmf 1.04 0.10 11.00Mason Graphite LLG OP 66.6 136 0.49 06/2018 0.01 (0.01) (0.01) nmf nmf 0.00 0.00 0.17 na 3.7 0.65 0.00 1.90NanoXplore GRA OP 129.7 109 1.38 12/2017 (0.06) (0.01) 0.01 0.08 0.50 0.62 0.22 0.48 2.65Nemaska Lithium NMX OP 533.3 846 0.63 06/2018 (0.03) (0.02) 0.03 nmf 24.6 0.00 0.00 0.22 na 3.6 0.70 0.48 1.70Northland Power NPI OP 4229.8 177 23.87 12/2017 0.92 1.58 1.36 18.8 21.9 7.77 8.40 8.48 3.6 3.5 4.42 0.83 25.00Pattern Energy PEGI OP 2074.0u 97 21.28u 12/2017 (0.20)u 2.09u (0.11)u 12.7 nmf 5.60u 5.75u 5.66u 4.6 4.7 42.35u 0.54 25.00uPinnacle Renewable PL OP 359.7 33 10.90 12/2017 (0.96) (0.21) 0.82 nmf 16.6 42.54 10.18 13.05 1.3 1.0 5.72 0.51 20.00Sigma Lithium SGMA OP 129.2 67 1.93 12/2017 (0.02) (0.23) 0.02 nmf nmf 0.00 0.00 0.15 na 16.0 0.17 0.16 4.50SRG Graphite SRG OP 56.9 69 0.82 12/2017 (0.04) (0.04) (0.03) nmf nmf 0.00 0.00 0.00 na na 0.21 0.00 1.65TransAlta Renewables RNW SP 3066.6 263 11.66 12/2017 0.64 0.87 0.83 16.8 17.6 1.84 1.82 1.78 8.0 8.2 8.33 0.27 12.00
Rating System: OP = Outperform; SP = Sector Perform; UP = Underperform; T = Tender; UR = Under Review; R = Restricted u = US dollar1 FD EPS are pro-forma numbers from continuing operations and exludes goodwill amortization, restructuring and one-time charges.
12-MthFDEPSP/E
Sales per share

VISION FEBRUARY 2019 Back to Research Analysts Page 58
TechnologySector Analysis
Richard Tse Analyst 416-869-6690 —
Associates: Andrew McGee: 416-869-8049 John Shao: 416-869-7938
After a rough tape for Tech in November and December, the group has kicked off 2019 by regaining some ground with the TSX Info Tech Index up around +9% and the Nasdaq up around +7.5% (YTD). Are we out of the woods yet? In our view, no. We’re still calling for volatility in light of the macro backdrop – as such, we’ve been recommending a barbell approach, leaning towards legacy (defensive) names like CGI and Open Text, and looking for opportunistic entry points in high-growth/TAM names that require a longer-term view, like Kinaxis and Shopify. With that broad take our ratings are largely unchanged with Outperform ratings on Altus, CGI, Kinaxis, Open Text, Shopify and Solium . Our top picks for 2019 continue to be:
› CGI Group:CGI has positioned itself well over the past 18-24 months to harvest recent investments to drive organic growth. In addition, CGI has delevered considerably – providing ample capital to pursue the M&A component of its growth strategy where we see the potential for transformational deals. We continue to see growth momentum (organic and acquisitions) with margin expansion care of a higher mix of IP/digital revenue. If that weren’t enough, we believe CGI is closer to a large acquisition.
› Kinaxis:Kinaxis remains one of the most compelling names in our coverage group despite the lofty valuation. We like the name for investors who have a longer time horizon. We believe momentum in Asia and Europe is continuing with outsized strength in verticals like Pharma and Auto. Recent wins (Novartis and Dyson) showcase the scale of the Company’s pipeline. If that wasn’t enough, we see the Company’s partner channels scaling. We believe the runway for Kinaxis continues to be long with the Company in the very early days of growth.
› OpenText:OpenText’s growth engine has not changed over the many years we’ve covered this name. We believe the Company has capacity to deploy $1.5 billion in capital on acquisitions, which is positive given the comments that its M&A pipeline remains robust. More importantly, we see a foundation building for organic growth which has been elusive for OpenText. In our view, that represents an inexpensive option on the name.
› Shopify:Shopify remains a leading technology platform for e-Commerce. Our view is that the fundamentals remains unchanged. Overall, we see a considerable runway of growth that’s underscored by a push internationally and a potential scaling in enterprise. We see: outsized relative growth for Shopify over the next three to five years; 2) we believe Shopify is the technology (platform) leader in enabling e-Commerce vendors; 3) we’re still early in the e-Commerce growth cycle; and 4) we believe Shopify could be a potential takeout candidate.
Selections› CGI› Kinaxis› OpenText › Shopify
Market Shares Stock Last FDEPS Debt/ 12-MthStock Stock Cap O/S Price Year (A) est. est. P/E (A) est. est. EV/EBITDA Book Total PriceSym. Rating (Mln) (Mln) 1/31 Reported Last FY FY1 FY2 FY1 FY2 Last FY FY1 FY2 FY1 FY2 Value Capital Target
Absolute Software Corp. ABT SP 332 40.3 8.24 2018 0.08u 0.13u 0.15u NMF NMF 9.2u 15.6u 16.7u 13.7 12.8 (1.40u) 0% 9.00 Altus Group Limited AIF OP 986 39.2 25.15 2017 1.13 1.18 1.92 21.4 13.1 81.9 73.8 103.9 14.6 10.4 9.21 68% 35.00CGI Group Inc. GIB.A OP 24,954 288.9 86.39 2018 4.19 4.60 4.89 18.8 17.7 2094.4 2240.3 2388.0 11.9 11.1 23.14 21% 100.00Constellation Software Inc. CSU SP 20,361 21.2 960.80 2017 21.85 26.60 31.03 27.1 23.2 643.8 767.4 892.6 20.0 17.2 33.62 44% 1000.00EXFO Inc. EXFO SP 181u 54.8 3.31u 2018 0.04u 0.20u 0.29u 16.2 11.6 17.2u 23.9u 30.4u 7.8 6.1 3.25u 10% 3.75uKinaxis Inc. KXS OP 1,996 25.7 77.60 2017 1.14u 0.99u 1.33u NMF NMF 40.1u 42.9u 52.4u 36.4 29.8 6.66u 0% 100.00Maxar Technologies Ltd. MAXR SP 331u 59.2 5.59u 2017 4.16u 4.08u 4.42u 1.4 1.3 378.7u 666.6u 743.3u 5.0 4.5 28.85u 64% 8.00u Mediagrif Interactive Inc. MDF SP 154 14.8 10.39 2018 0.57 0.74 0.80 14.0 13.1 23.2 23.2 23.7 7.3 7.2 9.10 17% 12.00Open Text Corporation OTEX OP 9,676u 269.4 35.92u 2018 2.56u 2.71u 3.01u 13.3 11.9 991.5u 1,076.2u 1,178.9u 10.7 9.8 13.83u 41% 50.00uReal Matters Inc. REAL SP 349 90.8 3.85 2017 0.07u 0.06u 0.13u NMF 21.6 5.8u 7.0u 15.9u 27.6 12.2 2.00u 0% 6.00Shopify Inc. SHOP OP 17,313u 106.6 162.34u 2017 0.16u 0.32u 0.83u NMF NMF 23.4u 28.4u 78.0u NMF NMF 15.68u 0% 180.00uSierra Wireless Inc. SWIR SP 547u 35.9 15.22u 2017 1.05u 0.91u 1.20u 16.7 12.7 53.4u 48.9u 64.3u 9.8 7.4 12.44u 0% 18.00u Solium Capital Inc. SUM OP 816 60.6 13.45 2017 0.09u 0.12u 0.22u NMF NMF 12.2u 16.8u 25.4u 30.7 20.3 2.59u 0% 14.00Baylin Technologies Inc. BYL OP 144 39.1 3.69 2017 (0.06) 0.07 0.29 NMF 12.7 5.0 16.6 24.8 10.6 7.3 2.04 28% 6.00 Rating System: OP = Outperform; SP = Sector Perform; UP = Underperform; T = Tender; UR = Under Review; R = Restricted u = US dollar* Covered by Andrew McGee
EBITDA (Mln)
VISION FEBRUARY 2019 Back to Research Analysts Page 59
Telecom & MediaSector Analysis
Adam Shine, cfa Analyst 514-879-2302 —
Associates: Ahmed Abdullah: 514-879-2564 Luc Troiani, CFA: 416-869-6585
Transcontinental
› f2019 margin gains skew post-H1 while efforts afoot to deal with waste concerns: TCL’s confident that it can extract more than the US$20M of savings initially promised from last year’s Coveris purchase. While revenue growth at Coveris isn’t expected until after f2019, synergies will serve as a key driver of Packaging margins which we see expanding from 11.9% in f2018 to 13.5% in f2019 & 14.6% in f2020. About 60% of savings will come from supplier rationalization and scale economies during f2019, with the other 40% skewing to later in the year and related to the insourcing of film extrusion at pre-existing packaging operations as well as bringing in-house to Coveris prepress capabilities (a core competency at TCL). We have this segment at 53% of f2019E revenues & 40% of Adj. EBITDA pre-corporate costs vs. 15% & 8.5%, respectively, in f2017. Consumer packaging companies and retailers are making commitments to reduce plastics over coming years. TCL is not oblivious to what’s afoot. Although nobody expects to see products wrapped in newspaper on store shelves anytime soon, the industry must make strides to address this issue. The company recently hired a Chief Strategy Officer who is tasked to interface with clients and figure out how TCL needs to position its offerings going forward. It will also be hiring a new R&D person to increase efforts in this area. In Printing, secular challenges have pushed
TCL to steadily optimize its platform through efficiencies. About 60% of the segment relates to business with retailers that’s been relatively stable of late, with the other 40% declining by double digits. While cities look to reduce waste, with a review underway in Montreal, TCL’s recyclable Publisac drives traffic for retailers, with more work being done to improve the offering and address municipal concerns. F2019 will be impacted by $37M in revenues, $22M of EBITDA, and $20M of EBIT due to the non-renewal of contracts with Hearst. We see the EBITDA impact as $13.1M in Q1, $6.4M in Q2, and $1.3M in each of Q3 & Q4, with Printing margins to expand in H2. PF2018 leverage of 2.7x is forecast to fall to 2.3x in f2019E & 1.8x in f2020E given strong FCF and ahead of more M&A. We look for a dividend increase with Q1 reporting on Feb. 28. Our target’s based on our f2020E NAV, with implied EV/EBITDA of 6.5x f2019E and 6.0x 2020E.
Selections› Corus› Quebecor› Thomson Reuters› Transcontinental
Market Shares Stock Last FDEPS EBITDA ($mln) ND/ 12-MthStock Stock Cap. O/S Price Year (A) est. est. P/E (A) est. est. Book Total PriceSym. Rating (Mln) (Mln) 1/31 Reported Last FY FY1 FY2 FY1 FY2 Last FY FY1 FY2 FY1 FY2 Value Capital Target
Broadcasting & Entertainment Cineplex Inc. CGX SP 1,801 63.3 28.44 12/2017 1.07 1.30 1.37 21.9 20.7 235.9 256.3 268.7 9.3 9.0 10.78 0.46 29.00
Corus Entertainment Inc. CJR.b OP 1,181 212.0 5.57 08/2018 1.14 0.84 0.88 6.7 6.4 575.6 575.6 543.3 5.3 5.1 7.18 0.54 6.50
DHX Media DHX SP 336 134.4 2.50 06/2018 (0.08) 0.01 0.02 NM NM 97.5 84.8 89.1 9.3 8.4 2.35 0.60 2.75Spin Master TOY OP 4,235 101.8 41.61 12/2017 1.70 1.72 1.84 18.4 17.2 292.2 317.1 345.7 9.7 8.5 5.25 -0.17 60.00Stingray Digital RAY.a OP 494 76.7 6.44 03/2018 0.50 0.75 0.82 8.6 7.9 41.5 110.0 115.8 7.7 7.0 3.85 0.58 9.00
TVA Group Inc. TVA.b SP 87 43.2 2.01 12/2017 0.50 0.17 0.28 11.9 7.1 66.4 45.2 52.9 2.6 2.6 6.06 0.12 2.50Printing & PublishingThomson Reuters TRI OP 34,249 498.5 68.71 12/2017 0.94 0.61 1.34 20.9 85.3 1591.0 1280.3 1387.1 19.9 19.0 17.12 0.37 73.00Transcontinental Inc. TCL.a OP 1,828 87.3 20.93 10/2018 2.91 2.76 2.91 7.6 7.2 459.3 519.6 528.2 5.8 5.3 18.24 0.47 25.00Advertising & MarketingAimia Inc. AIM SP 554 152.3 3.64 12/2017 0.40 1.05 (0.26) 3.5 NM 287.6 222.2 -4.1 4.6 NM NM -0.63 4.25Yellow Pages Y SP 160 28.1 5.71 12/2017 0.29 1.98 1.87 2.9 3.0 183.1 194.5 172.5 1.8 1.5 NM 0.59 8.00
TelecommunicationsBCE Inc. BCE SP 51,304 898.0 57.13 12/2017 3.42 3.49 3.62 16.4 15.8 9282.0 9543.8 9822.8 8.3 8.0 18.72 0.42 58.00
Cogeco Communications Inc. CCA OP 3,715 49.6 74.91 08/2019 5.78 6.21 6.30 12.1 11.9 1085.2 1169.1 1194.8 6.0 5.7 48.36 0.62 84.00
Quebecor Inc. QBR.b OP 7,201 232.8 30.93 12/2017 1.32 1.69 1.67 18.3 18.5 1628.2 1731.4 1814.2 8.0 7.4 -1.34 1.04 34.50Rogers Communications Inc. RCI.b OP 36,593 514.8 71.08 12/2018 4.34 4.47 4.87 15.9 14.6 5983.0 6454.8 6737.4 8.1 7.5 15.88 0.46 80.00
Shaw Communications SJR.b SP 13,553 508.0 26.68 08/2018 1.17 1.30 1.45 20.6 18.4 2056.0 2169.1 2292.0 8.3 7.8 11.97 0.41 27.00Telus Corp. T OP 27,520 598.0 46.02 12/2017 2.63 2.74 2.92 16.8 15.8 4910.0 5151.0 5347.3 7.9 7.6 16.73 0.58 50.00
Stock Rating: OP = Outperform; SP = Sector Perform; UP = Underperform; T=Tender; UR= Under Review; R=Restricted TRI & TOY estimates are in US$, rest is CAD$. RAY FY1 estimates & multiples are PF.
EV/EBITDA
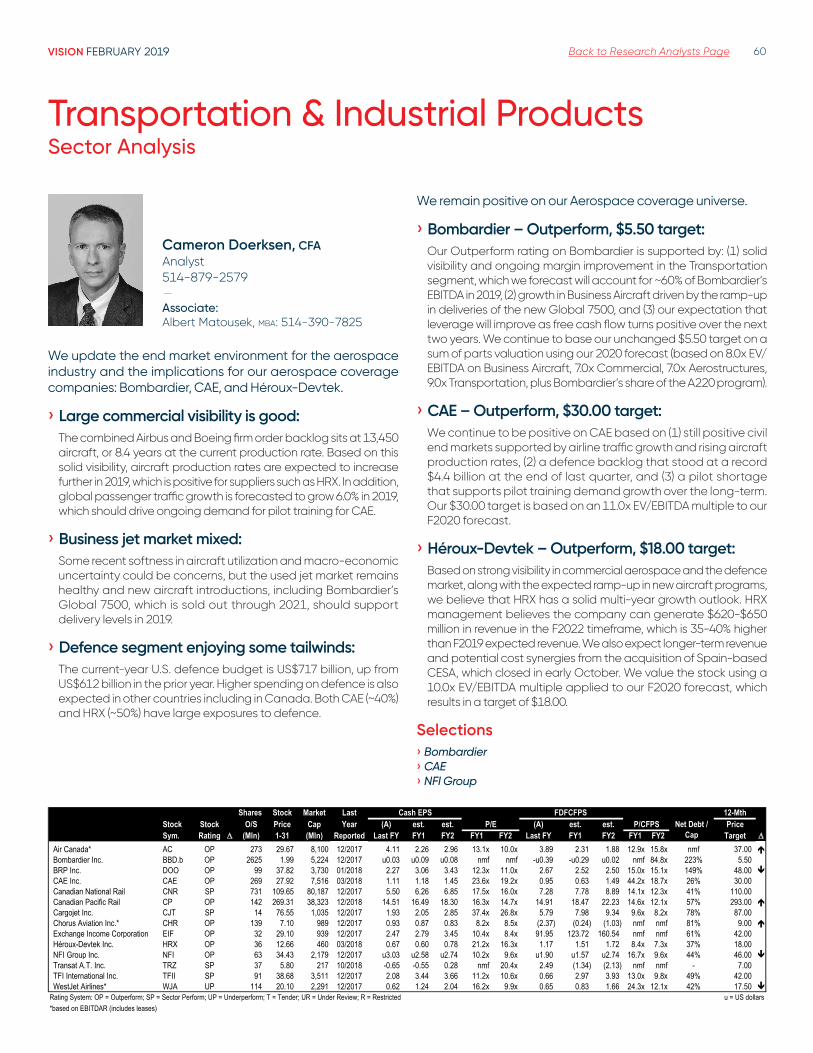
VISION FEBRUARY 2019 Back to Research Analysts Page 60
Transportation & Industrial ProductsSector Analysis
We update the end market environment for the aerospace industry and the implications for our aerospace coverage companies: Bombardier, CAE, and Héroux-Devtek.
› Large commercial visibility is good:The combined Airbus and Boeing firm order backlog sits at 13,450 aircraft, or 8.4 years at the current production rate. Based on this solid visibility, aircraft production rates are expected to increase further in 2019, which is positive for suppliers such as HRX. In addition, global passenger traffic growth is forecasted to grow 6.0% in 2019, which should drive ongoing demand for pilot training for CAE.
› Business jet market mixed:Some recent softness in aircraft utilization and macro-economic uncertainty could be concerns, but the used jet market remains healthy and new aircraft introductions, including Bombardier’s Global 7500, which is sold out through 2021, should support delivery levels in 2019.
› Defence segment enjoying some tailwinds:The current-year U.S. defence budget is US$717 billion, up from US$612 billion in the prior year. Higher spending on defence is also expected in other countries including in Canada. Both CAE (~40%) and HRX (~50%) have large exposures to defence.
We remain positive on our Aerospace coverage universe.
› Bombardier – Outperform, $5 .50 target:Our Outperform rating on Bombardier is supported by: (1) solid visibility and ongoing margin improvement in the Transportation segment, which we forecast will account for ~60% of Bombardier’s EBITDA in 2019, (2) growth in Business Aircraft driven by the ramp-up in deliveries of the new Global 7500, and (3) our expectation that leverage will improve as free cash flow turns positive over the next two years. We continue to base our unchanged $5.50 target on a sum of parts valuation using our 2020 forecast (based on 8.0x EV/EBITDA on Business Aircraft, 7.0x Commercial, 7.0x Aerostructures, 9.0x Transportation, plus Bombardier’s share of the A220 program).
› CAE – Outperform, $30 .00 target:We continue to be positive on CAE based on (1) still positive civil end markets supported by airline traffic growth and rising aircraft production rates, (2) a defence backlog that stood at a record $4.4 billion at the end of last quarter, and (3) a pilot shortage that supports pilot training demand growth over the long-term. Our $30.00 target is based on an 11.0x EV/EBITDA multiple to our F2020 forecast.
› Héroux-Devtek – Outperform, $18 .00 target: Based on strong visibility in commercial aerospace and the defence market, along with the expected ramp-up in new aircraft programs, we believe that HRX has a solid multi-year growth outlook. HRX management believes the company can generate $620-$650 million in revenue in the F2022 timeframe, which is 35-40% higher than F2019 expected revenue. We also expect longer-term revenue and potential cost synergies from the acquisition of Spain-based CESA, which closed in early October. We value the stock using a 10.0x EV/EBITDA multiple applied to our F2020 forecast, which results in a target of $18.00.
Selections› Bombardier › CAE› NFI Group
Shares Stock Market Last Cash EPS FDFCFPS 12-MthStock Stock O/S Price Cap Year (A) est. est. P/E (A) est. est. P/CFPS PriceSym. Rating (Mln) 1-31 (Mln) Reported Last FY FY1 FY2 FY1 FY2 Last FY FY1 FY2 FY1 FY2 Target
Air Canada* AC OP 273 29.67 8,100 12/2017 4.11 2.26 2.96 13.1x 10.0x 3.89 2.31 1.88 12.9x 15.8x nmf 37.00 Bombardier Inc. BBD.b OP 2625 1.99 5,224 12/2017 u0.03 u0.09 u0.08 nmf nmf -u0.39 -u0.29 u0.02 nmf 84.8x 223% 5.50BRP Inc. DOO OP 99 37.82 3,730 01/2018 2.27 3.06 3.43 12.3x 11.0x 2.67 2.52 2.50 15.0x 15.1x 149% 48.00 CAE Inc. CAE OP 269 27.92 7,516 03/2018 1.11 1.18 1.45 23.6x 19.2x 0.95 0.63 1.49 44.2x 18.7x 26% 30.00Canadian National Rail CNR SP 731 109.65 80,187 12/2017 5.50 6.26 6.85 17.5x 16.0x 7.28 7.78 8.89 14.1x 12.3x 41% 110.00Canadian Pacific Rail CP OP 142 269.31 38,323 12/2018 14.51 16.49 18.30 16.3x 14.7x 14.91 18.47 22.23 14.6x 12.1x 57% 293.00 Cargojet Inc. CJT SP 14 76.55 1,035 12/2017 1.93 2.05 2.85 37.4x 26.8x 5.79 7.98 9.34 9.6x 8.2x 78% 87.00Chorus Aviation Inc.* CHR OP 139 7.10 989 12/2017 0.93 0.87 0.83 8.2x 8.5x (2.37) (0.24) (1.03) nmf nmf 81% 9.00 Exchange Income Corporation EIF OP 32 29.10 939 12/2017 2.47 2.79 3.45 10.4x 8.4x 91.95 123.72 160.54 nmf nmf 61% 42.00Héroux-Devtek Inc. HRX OP 36 12.66 460 03/2018 0.67 0.60 0.78 21.2x 16.3x 1.17 1.51 1.72 8.4x 7.3x 37% 18.00NFI Group Inc. NFI OP 63 34.43 2,179 12/2017 u3.03 u2.58 u2.74 10.2x 9.6x u1.90 u1.57 u2.74 16.7x 9.6x 44% 46.00 Transat A.T. Inc. TRZ SP 37 5.80 217 10/2018 -0.65 -0.55 0.28 nmf 20.4x 2.49 (1.34) (2.13) nmf nmf - 7.00TFI International Inc. TFII SP 91 38.68 3,511 12/2017 2.08 3.44 3.66 11.2x 10.6x 0.66 2.97 3.93 13.0x 9.8x 49% 42.00WestJet Airlines* WJA UP 114 20.10 2,291 12/2017 0.62 1.24 2.04 16.2x 9.9x 0.65 0.83 1.66 24.3x 12.1x 42% 17.50
Rating System: OP = Outperform; SP = Sector Perform; UP = Underperform; T = Tender; UR = Under Review; R = Restricted*based on EBITDAR (includes leases)
Net Debt / Cap
u = US dollars
Cameron Doerksen, CFA Analyst 514-879-2579
— Associate: Albert Matousek, mba: 514-390-7825
VISION FEBRUARY 2019 Back to Research Analysts Page 61
Alphabetical Listing
5N Plus VNP 57Absolute Software Corp. ABT 58Advantage Lithium AAL 57Advantage Oil & Gas AAV 51Aecon Group ARE 45Ag Growth International Inc. AFN 43Agnico-Eagle Mines Ltd AEM 49AGT Food and Ingredients Inc. AGT 43Aimia Inc. AIM 59Air Canada AC 60Akumin AKU.u 44Alacer Gold Corp ASR 49Alamos Gold Inc AGI 49Alaris Royalty Corp. AD 41Algonquin Power AQN 57Allied Properties REIT AP.un 54Almaden Minerals Ltd AMM 49AltaGas ALA 52AltaGas Canada Inc. ACI 52Altus Group Limited AIF 58American Hotel Income Properties HOT.un 54ARC Resources Ltd. ARX 51Argonaut Gold Inc. AR 49Artis REIT AX.un 54ATCO Ltd. ACO 52Atlantic Gold Corp AGB.V 49Atlantic Power AT-US 57ATS Automation ATA 45AutoCanada ACQ 45Automotive Properties REIT APR.un 54B2Gold BTO 49Bank of Montreal BMO 39Bank of Nova Scotia BNS 39Barsele Minerals Corp. BME 49Baylin Technologies Inc. BYL 58Baytex Energy BTE 51BCE Inc. BCE 59Bellatrix Exploration BXE 51Birchcliff Energy BIR 51Bird Construction Inc. BDT 45Black Diamond Group Ltd. BDI 42Bluestone Resources Inc. BSR 49Boardwalk REIT BEI.un 54Bombardier Inc. BBD.b 60Bonavista Energy BNP 51Bonterra Energy BNE 51Boralex BLX 57Boyd Group Income Fund BYD_u 55Brookfield Infrastructure BIP-UN 57Brookfield Renewable Energy BEP-US 57BRP Inc. DOO 60BSR REIT HOM.un 54BTB REIT BTB.un 54CAE Inc. CAE 60Calfrac Well Services Ltd. CFW 42Callidus Capital Corp. CBL 41Canadian National Rail CNR 60Canadian Natural Resources CNQ 51Canadian Pacific Rail CP 60Canadian Tire CTC.a 46Canadian Utilities CU 52Canadian Western Bank CWB 39CAP REIT CAR.un 54Capital Power CPX 52Capstone Mining CS 47Cardinal Energy CJ 51Cargojet Inc. CJT 60Cascades CAS 55Cenovus Energy CVE 51Centerra Gold Inc CG 49Cervus Equipment Corporation CERV 43CES Energy Solutions Corp. CEU 42CGI Group Inc. GIB.A 58Chartwell Retirement Residences CSH.un 54Chemtrade Logistics Income Fund CHE.UN 44Chinook Energy CKE 51Choice Properties REIT CHP.un 54Chorus Aviation Inc. CHR 60CIBC CM 39Cineplex Inc. CGX 59Cobalt 27 Capital KBLT 57Cogeco Communications Inc. CCA 59Cominar REIT CUF.un 54Constellation Software Inc. CSU 58Copper Mountain Mining CMMC 47
Corus Entertainment Inc. CJR.b 59Couche Tard ATD.b 46Crescent Point Energy Corp. CPG 51Crew Energy CR 51CRH Medical CRH 44Crius Energy Trust KWH.UN 44Crombie REIT CRR.un 54Crown Capital Partners CRWN 41CT REIT CRT.un 54Detour Gold Corp DGC 49DHX Media DHX 59DIRTT Environmental Solutions DRT 57Dollarama DOL 46DREAM Global REIT DRG.un 54DREAM Industrial REIT DIR.un 54DREAM Office REIT D.un 54ECN Capital ECN 41Eldorado Gold Corp ELD 49Element Fleet Management EFN 41Emera Inc. EMA 52Empire Company EMP.a 46Enbridge Inc. ENB 52Encana Corporation (US$) ECA 51Endeavour Mining EDV 49Enerflex Ltd. EFX 42Enerplus Corporation ERF 51Equinox Gold Corp EQX 49Equitable Group EQB 41Etrion Corp ETX 57Exchange Income Corporation EIF 60EXFO Inc. EXFO 58Extendicare EXE 54Fairfax Financial Holdings FFH 41Falco Resources Ltd. FPC 49Fiera Capital Corp. FSZ 41Finning International Inc. FTT 45First Capital Realty FCR 54First Majestic Silver Corp FR 49First National Financial FN 41First Quantum Minerals FM 47Fortis Inc. FTS 52Fortuna Silver Mines Inc FVI 49Franco-Nevada Corp FNV 49Freehold Royalties FRU 51GDI Integrated Facility Services GDI 55Gear Energy GXE 51Genworth MI Canada MIC 41Gibson Energy GEI 52Gildan GIL 46Goldcorp Inc G 49Golden Star Resources GSC 49Granite Oil GXO 51Great-West Lifeco GWO 39H&R REIT HR.un 54Hardwoods Distribution HDI 55Héroux-Devtek Inc. HRX 60High Arctic Energy Services Inc. HWO 42Home Capital Group HCG 41Horizon North Logistics Inc. HNL 42Hudbay Minerals HBM 47Hudson's Bay Company HBC 46Hydro One Ltd. H 52IAMGOLD Corp IMG 49IBI Group Inc. IBG 45Imperial Oil IMO 51IMV Inc. IMV 44Industrial Alliance IAG 39Innergex INE 57Inovalis REIT INO.un 54InPlay Oil IPO 51Intact Financial Corp. IFC 41Inter Pipeline IPL 52InterRent REIT IIP.un 54Intertape Polymer Group Inc. ITP 55Invesque IVQu 54IPL Plastics IPLP 55Jamieson Wellness JWEL 44Just Energy Group JE 44K-Bro Linen KBL 44Kelt Exploration KEL 51Keyera KEY 52Killam Apartment REIT KMP.un 54Kinaxis Inc. KXS 58Kinder Morgan KML 52Kinross Gold Corp K 49
Kirkland Lake Gold Corp KL 49Knight Therapeutics GUD 44KP Tissue KPT 55Laurentian Bank LB 39Leagold Mining LMC 49Leucrotta Energy LXE 51Liberty Gold Corp LGD 49Lithium Americas LAC 57Loblaw L 46Lundin Mining LUN 47MAG Silver Corp MAG 49Manulife Financial MFC 39Marathon Gold Corp. MOZ 49Mason Graphite LLG 57MAV Beauty Brands MAV 46Maverix Metals Inc MMX.V 49Maxar Technologies Ltd. MAXR 58MCAN Mortgage Corp. MKP 41Mediagrif Interactive Inc. MDF 58Medical Facilities Corp. DR 44MEG Energy MEG 51Metro MRU 46Minto Apartment REIT MI.un 54Morneau Shepell MSI 41Mullen Group Ltd. MTL 42NanoXplore GRA 57National Bank NA 39National Energy Services Reunited NESR 42Nemaska Lithium NMX 57Nevada Copper NCU 47New Gold Inc NGD 49New Look Vision Group BCI 55Nexa Resources NEXA 47NFI Group Inc. NFI 60North American Construction Group Ltd. NOA 45Northland Power NPI 57Northview Apartment REIT NVU.un 54NorthWest H.P. REIT NWH.un 54NuVista Energy NVA 51Obsidian Energy OBE 51OceanaGold Corp OGC 49Open Text Corporation OTEX 58Osisko Gold Royalties Ltd OR 49Osisko Mining OSK 49Painted Pony Energy PONY 51Paramount Resources POU 51Park Lawn Corporation PLC 55Parkland Fuel Corporation PKI 46Pason Systems Corp. PSI 42Pattern Energy PEGI 57Pembina Pipelines PPL 52Pengrowth Energy PGF 51People Corporation PEO 41PetroShale PSH 51Petrus Resources PRQ 51Peyto Exploration & Development Corp. PEY 51Pinecliff Energy PNE 51Pinnacle Renewable PL 57Pipestone Energy PIPE 51PrairieSky Royalty PSK 51Precision Drilling Corp. PD 42ProMetic Life Sciences PLI 44Pure Multi-family REIT RUFu.V 54Quebecor Inc. QBR.b 59Real Matters Inc. REAL 58Richelieu Hardware RCH 55RioCan REIT REI.un 54Ritchie Bros. Auctioneers RBA 45Rocky Mountain Dealerships Inc. RME 43Rogers Communications Inc. RCI.b 59Rogers Sugar RSI 44Roots Corporation ROOT 46Royal Bank of Canada RY 39Royal Gold Inc RGLD.O 49Sabina Gold and Silver Corp. SBB 49Sandstorm Gold Ltd SSL 49Saputo SAP 46Savaria Corporation SIS 55Secure Energy Services Inc. SES 42Semafo Inc. SMF 49Seven Generations VII 51Shaw Communications SJR.b 59Shawcor Ltd. SCL 42Sherritt International S 47Shopify Inc. SHOP 58
Sienna Senior Living SIA 54Sierra Wireless Inc. SWIR 58Sigma Lithium SGMA 57SilverCrest Metals Inc. SIL.V 49Slate Office REIT SOT.un 54Sleep Country Canada ZZZ 46SmartCentres REIT SRU.un 54SNC-Lavalin SNC 45SolGold SOLG 47Solium Capital Inc. SUM 58Spin Master TOY 59SRG Graphite SRG 57SSR Mining Inc SSRM 49Stantec Inc. STN 45Stelco STLC 45STEP Energy Services Ltd. STEP 42Stingray Digital RAY.a 59StorageVault Canada SVI.V 54Storm Resources SRX 51Street Capital Group SCB 41Stuart Olson SOX 45Summit Industrial SMU.un 54Sun Life Financial SLF 39Suncor Energy SU 51Superior Plus SPB 52Surge Energy SGY 51Tahoe Resources Inc THO 49Tamarack Valley Energy TVE 51Taseko Mines TKO 47Teck Resources TECKb 47Telus Corp. T 59Tervita Corp TEV 42TFI International Inc. TFII 60Theratechnologies TH 44Thomson Reuters TRI 59Tidewater Midstream TWM 52Timbercreek Financial TF 41Titan Mining TI 47TMAC Resources TMR 49TMX Group X 41Torc Oil & Gas TOG 51Toromont Industries Ltd. TIH 45Toronto-Dominion Bank TD 39Tourmaline Oil TOU 51TransAlta TA 52TransAlta Renewables RNW 57Transat A.T. Inc. TRZ 60TransCanada Corp. TRP 52Transcontinental Inc. TCL.a 59Trevali Mining TV 47Trican Well Services TCW 42Tricon Capital Group TCN 54Trinidad Drilling Ltd. TDG 42Troilus Gold Corp. TLG 49TVA Group Inc. TVA.b 59Uni-Sélect UNS 55Valener Inc. VNR 52Veresen Inc. VSN 52Vermilion Energy Inc. VET 51Wesdome Corp. WDO 49WestJet Airlines WJA 60Wheaton Precious Metals Corp WPM 49Whitecap Resources WCP 51WPT Industrial REIT WIR'U-T 54WSP Global WSP 45Yamana Gold Inc YRI 49Yangarra Resources YGR 51Yellow Pages Y 59

Branches
International
NBF Securities UK(Regulated by The Financial Services Authority) 71 Fenchurch Street, 11th floor London, England EC3M 4HD Tel.: 44-207-680-9370 Tel.: 44-207-488-9379
New York65 East 55th Street, 31st Floor New York, NY 10022 Tel.: 212-632-8610
National Bank of Canada Financial Inc .
New York65 East 55th Street, 34th Floor New York, NY 10022 Tel.: 212-546-7500
Member of
› Montreal Exchange› Toronto Stock Exchange› Winnipeg Commodities Exchange› Securities Industry Association› CNQ› Investment Dealers Association of
Canada› Canadian Investor Protection Fund› Securities Investor Protection
Corporation
Ancaster • 911, Golf Links Road, Suite 201, Ancaster, ON, L9K 1H9 • 905-648-3813Baie-Comeau • 337, boulevard Lasalle, Baie-Comeau, QC, G4Z 2Z1 • 418-296-8838 Barrie • 126 Collier Street, Barrie, ON, L4M 1H4 • 705-719-1190Beauce • 11505, 1re Avenue est, Bureau 100, St-Georges, QC, G5Y 7X3 • 418-227-0121Berthierville • 779, rue Notre-Dame, Berthierville, QC, J0K 1A0 • 450-836-2727Bin-Scarth • 24 Binscarth Rd, Toronto, ON, M4W 1Y1 • 416-929-6432Brampton • 10520 Torbram Road (at Sandalwood Parkway), Brampton, ON, L6R 2S3 • 905-456-1515Brandon • 633-C, 18th Street, Brandon, MB, R7A 5B3 • 204-571-3200Calgary • 239 8th Ave., SW, Suite 100, Calgary, AB, T2P 1B9 • 403-476-0398Calgary - Southport • 10655 Southport Road SW, Suite 1100, Southland Tower, Calgary,AB, T2W 4Y1 • 403-301-4859Charlottetown • 300-119 Queen Street, Charlottetown, PEI, C1A 4B3 • 902-628-2106Chatham • 380 St. Clair, Street, Chatham, ON, N7L 3K2 • 519-351-7645Chicoutimi • 1180, boulevard Talbot, Suite 201, Chicoutimi, QC, G7H 4B6 • 418-549-8888Collingwood • 108 Hurontario Street, Collingwood, ON, L9Y 2L8 • 705-446-0255DIX30 • 9160, boulevard Leduc, Bureau 710, Brossard, QC, J4Y 0E3 • 450-462-2552Drumheller • 356 Centre Street, PO Box 2176, Drumheller, AB, T0J 0Y0 • 403-823-6857Drummondville • 595, boulevard Saint-Joseph, Bureau 200, Drummondville, QC, J2C 2B6 • 819-477-5024Duncan • 2763 Beverly Street, Suite 206, Duncan, BC, V9L 6X2 • 250-715-3050Edmonton • 10175 – 101 Street NW, Suite 1800, Edmonton, AB, T5J 0H3 • 780-412-6600Edmonton-North • 10088-102 Avenue, Suite 903, TD Tower, Edmonton, AB, T5J 2Z1 • 780-421-4455Eglinton • 295 Eglinton Avenue East, Delaware Square, Mississauga, ON, L4Z 3K6 • 905-507-4883 Gatineau • 920, St-Joseph, Bureau 100, Hull-Gatineau, QC, J8Z 1S9 • 819-770-5337Granby • 150, rue St-Jacques, Bureau 202, Granby, QC, J2G 8V6 • 450-378-0442GTA North • 9130 Leslie Street, suite 200, Richmond Hill, ON, L4B 0B9 • 416-756-4016Halifax • Purdy's Wharf Tower II, 1969 Upper Water Street, Suite 1601, Halifax, NS, B3J 3R7 • 902-496-7700Halifax-Spring Garden • 400-5657 Spring Garden Road, Parklane Terraces, Halifax, NS, B3J 3R4 • 902-425-1283Joliette • 40, rue Gauthier Sud, Bureau 3500, Joliette, QC, J6E 4J4 • 450-760-9595Kelowna • Suite 500 - 1632 Dickson Avenue, Kelowna, BC, V1Y 7T2 • 250-717-5510Lac-Mégantic • 3956, rue Laval, suite 100, QC, G6B 2W9 • 819-583-6035Laval • 2500, boulevard Daniel Johnson, Bureau 610, Laval, QC, H7T 2P6 • 450-686-5700Lethbridge • 404, 6th Street South, Lethbridge, AB, T1J 2C9 • 403-388-1900Lévis • 1550, boulevard Alphonse-Desjardins, Bureau 110, Lévis, QC, G6V 0G8 • 418-838-0456 London • 256 Pall Mall Street, Suite 201, London, ON, N6A 5P6 • 519-439-6228London-City Centre • 802-380 Wellington Street, London, ON, N6A 5B5 • 519-646-5711Metcalfe • 1155, rue Metcalfe, Suite 1450, Montréal, QC, H3B 2V6 • 514-879-4825Mississauga • 350, Burnhamthorpe road West, Suite 603, Mississauga, ON, L5B 3J1 • 905-272-2799Moncton • 735 Main Street, Suite 300, Moncton, NB, E1C 1E5 • 506-857-9926Mont Saint-Hilaire • 436, boulevard Sir-Wilfrid-Laurier, Suite 100, Mont Saint-Hilaire, QC, J3H 3N9 • 450-467-4770Montréal International • 1, Place Ville-Marie, Bureau 1700, Montréal, QC, H3B 2C1 • 514-879-5576Montréal L'Acadie • 9001, boulevard de l’Acadie, Bureau 802, Montréal, QC, H4N 3H5 • 514-389-5506North Bay • 680 Cassells Street, Suite 101, North Bay, ON, P1B 4A2 • 705-476-6360Oak Bay • #220 - 2186 Oak Bay Avenue, Victoria, BC, V8R 1G3 • 250-953-8400Oakville • 305 Church Street, Oakville, ON, L6J 7T2 • 905-849-3558
Oshawa • 575 Thornton Road North, Oshawa, ON, L1J 8L5 • 905-433-0210Ottawa • 50 O'Connor Street, Suite 1602, Ottawa, ON, K1P 6L2 • 613-236-0103Outremont • 1160, boulevard Laurier Ouest, App. 1, Outremont, QC, H2V 2L5 • 514-276-3532Owen Sound • 1717 2nd Ave. E., Suite 202, Owen Sound, ON, N4K 6V4. • 519-372-1277
Peterborough • 201 George Street North, suite 401, Peterborough, ON, K9J 3G7 • 705-740-1110Plessisville • 1719, rue St-Calixte, Plessisville, QC, G6L 1R2 • 819-362-6000Kirkland • 16,766 Route Transcanadienne, bureau 503, Kirkland, QC, H9H 4M7 • 514-426-2522PVM Montréal • 1, Place Ville-Marie, Bureau 1700, Montréal, QC, H3B 2C1 • 514-879-5200Québec • 500, Grande-Allée Est, Bureau 400, Québec, Qc, G1R 2J7 • 418-649-2525Québec - Sainte-Foy • Place de la Cité, 2600, boulevard Laurier, Bureau 700, Québec, QC, G1V 4W2 • 418-654-2323Red Deer • 4719 48th Avenue, Suite 200, Red Deer, AB, T4N 3T1 • 403-348-2600Regina • 1770-1881 Scarth Street, 17th Floor, McCallum Hill Centre - Tower II, Regina, SK, S4P 4K9 • 306-781-0500Repentigny • 534, rue Notre-Dame, Bureau 201, Repentigny, QC, J6A 2T8 • 450-582-7001Richmond • 135-8010 Saba Road, Richmond, BC, V6Y 4B2 • 604-658-8050Richmond Hill • 500 Highway 7 East, Gr. Floor, Richmond Hill, ON, L4B 1J1 • 905-477-2002Rimouski • 127, boulevard René-Lepage Est, Bureau 100, Rimouski, QC, G5L 1P1 • 418-721-6767Rivière-du-Loup • 10, rue Beaubien, Rivière-du-Loup, QC, G5R 1H7 • 418-867-7900 Rouyn-Noranda • 104, 8e rue, Rouyn-Noranda, QC, J9X 2A6 • 819-762-4347Saint John • 72 Prince William Street, Saint John, NB, E2L 2B1 • 506-642-1740Sainte-Marie-de-Beauce • 249, Du Collège, Bureau 100, Ste-Marie, QC, G6E 3Y1 • 418-387-8155Saint-Félicien • 1120, boulevard Sacré-Cœur, Saint-Félicien, QC, G8K 1P7 • 418-679-2684Saint-Hyacinthe • 1355, rue Daniel-Johnson Ouest, bureau 4100, Saint-Hyacinthe, QC, J2S 8W7 • 450-774-5354Saint-Jean-sur-Richelieu • 395, boul. du Séminaire Nord, Suite 201, Saint-Jean-sur-Richelieu, QC, J3B 8C5 • 450-349-7777Saint-Jérôme • 265, rue St-George, Suite 100, Saint-Jérôme, QC, J7Z 5A1 • 450-569-8383Saskatoon - 8th St. • 1220 8th Street East, Saskatoon, SK, S7H 0S6 • 306-657-3465Sept-Îles • 805, boulevard Laure, Suite 200, Sept-Îles, QC, G4R 1Y6 • 418-962-9154Shawinigan • 602, avenue de Grand-Mère, 2e étage, Shawinigan, QC, G9T 2H5 • 819-538-8628Sherbrooke • 1802, rue King Ouest, Suite 200, Sherbrooke, QC, J1J 0A2 • 819-566-7212Sidney • 2537, Beacon Avenue, Suite 205, Sidney, BC, V8L 1Y3 • 250-657-2200Sorel • 26, Pl. Charles-de-Montmagny, Suite 100, Sorel, QC, J3P 7E3 • 450-743-8474 St. Catharines • 40 King Street, St. Catharines, ON, L2R 3H4 • 905-641-1221Sudbury • 10 Elm Street, Suite 501, Sudbury, ON, P3C 1S8 • 705-671-1160Thedford Mines • 222, boulevard Frontenac Ouest, bureau 107, Thedford Mines, QC, G6G 6N7 • 418-338-6183Thunder Bay • Hydro BLG 34 Cumberland Street North, 7th Fl., Thunder Bay, ON, P7A 4L3 • 807-683-1777Toronto 1 • Exchange Tower, 130 King Street West, Suite 3200, Toronto, ON, M5X 1J9 • 416-869-3707 Toronto Midtown • 22 St. Clair Ave East, suite 1202, Toronto, ON, M4T 2S5 • 416-507-8870Trois-Rivières • 7200, rue Marion, Trois-Rivières, QC, G9A 0A5 • 819-379-0000Val d'Or • 840, 3e avenue, Val d'Or, QC, J9P 1T1 • 819-824-3687Valleyfield • 1356, boulevard Monseigneur-Langlois, Valleyfield, QC, J6S 1E3 • 450-370-4656Vancouver - PB1859 • 1076 Alberni Street, Suite 201, Vancouver, BC, V6A 1A3 • 778-783-6420Vancouver 1 • 475 Howe Street, Suite 3000, Vancouver, BC, V6C 2B3 • 604-623-6777 Vernon • 3100-30th Avenue, Suite 101, Vernon, BC, V1T 2C2 • 250-260-4580Victoria • 700-737 Yates Street, Victoria, BC, V8W 1L6 • 250-953-8400Victoria - Fort • 1480 Fort Street, Victoria, BC, V8S 1Z5 • 250-475-3698Victoriaville • 650, boulevard Jutras Est, Bureau 150, Victoriaville, QC, G6S 1E1 • 819-758-3191Waterloo • 180 King Street South, Suite 701, Waterloo, ON, N2J 1P8 • 519-742-9991White Rock • 2121 160th Street, Surrey, BC, V3Z 9N6 • 604-541-4925
Windsor • 1 Riverside Drive West,Suite 600, Windsor, ON, N9A 5K3 • 519-258-5810Winnipeg • 200 Waterfront Drive, Suite 400, Winnipeg, MB, R3B 3P1 • 204-925-2250Yorkton • 89 Broadway Street West, Yorkton, SK, S3N 0L9 • 306-782-6450
MontrealNational Bank Financial
Sun Life Building1155 Metcalfe StreetMontreal, QC H3B 4S9514-879-2222
TorontoNational Bank Financial
The Exchange Tower130 King Street West4th Floor PodiumToronto, ON M5X 1J9416-869-3707
Canada (Toll-Free)
1-800-361-88381-800-361-9522
United States (Toll-Free)
1-800-678-7155
National Bank Financial (NBF) is an indirect wholly owned subsidiary of National Bank of Canada. National Bank of Canada is a public company listed on Canadian stock exchanges.
The particulars contained herein were obtained from sources which we believe reliable but are not guaranteed by us and may be incomplete. The opinions expressed are based upon our analysis and interpretation of these particulars and are not to be construed as a solicitation or offer to buy or sell the securities mentioned herein. The Firm may act as financial advisor, fiscal agent or underwriter for certain of the companies mentioned herein and may receive a remuneration for its services. The Firm and/or its officers, directors, representatives, associates, may have a position in the securities mentioned herein and may make purchases and/or sales of these securities from time to time in the open market or otherwise. To U.S. residents: With respect to the distribution of this report in the United States, National Bank of Canada Financial Inc. (NBCFI) is regulated by the Financial Industry Regulatory Authority (FINRA) and a member of the Securities Investor Protection Corporation (SIPC). This report has been prepared in whole or in part by, research analysts employed by non-US affiliates of NBCFI that are not registered as broker/dealers in the US. These non-US research analysts are not registered as associated persons of NBCFI and are not licensed or qualified as research analysts with FINRA or any other US regulatory authority and, accordingly, may not be subject (among other things) to FINRA restrictions regarding communications by a research analyst with the subject company, public appearances by research analysts and trading securities held a research analyst account.
All of the views expressed in this research report accurately reflect the research analysts’ personal views regarding any and all of the subject securities or issuers. No part of the analysts’ compensation was, is, or will be, directly or indirectly, related to the specific recommendations or views expressed in this research report. The analyst responsible for the production of this report certifies that the views expressed herein reflect his or her accurate personal and technical judgment at the moment of publication. Because the views of analysts may differ, members of the National Bank Financial Group may have or may in the future issue reports that are inconsistent with this report, or that reach conclusions different from those in this report. To make further inquiry related to this report, United States residents should contact their NBCFI registered representative.
© 2014 National Bank Financial. All rights reserved. This report may not be reproduced in whole or in part, or further distributed or published or referred to in any manner whatsoever nor may the information, opinions or conclusions contained in it be referred to without in each case the prior express consent of National Bank Financial.
Corporate Offices
2019
/02