Embed Size (px)
Citation preview
Vision 2015 Building on Excellence
Waterloo Engineering Strategic Plan Progress Report 2013/14
November, 2014

|
This document is published by the Office of the Dean of Engineering.
Please direct enquiries to: Director of Planning, Faculty of Engineering
University of Waterloo (519) 888-4567 x32544 [email protected]
Vision 2015 Progress Report: 2013/14 1
Table of Contents
I. Executive Summary ................................................................................................................................................... 5 Priorities for 2015 .................................................................................................................................................... 6 Summary of Current Vision 2015 Goals ................................................................................................................. 7 Vision 2015 Aspiration ............................................................................................................................................ 8 Vision 2015 Key Priorities ....................................................................................................................................... 8 Waterloo Engineering Today .................................................................................................................................. 9 Waterloo Engineering in Context .......................................................................................................................... 10
II. Alignment with the University of Waterloo Strategic Plan ........................................................................................ 11 III. Vision 2015 Strategic Plan Progress Report ............................................................................................................ 12
A. Faculty and Staff ........................................................................................................................................... 12 B. Undergraduate Studies ................................................................................................................................. 15
Co-operative Education ........................................................................................................................ 19 Accreditation ......................................................................................................................................... 20
C. Graduate Studies .......................................................................................................................................... 21 D. Research ....................................................................................................................................................... 24 E. Teaching ....................................................................................................................................................... 26 F. Outreach ....................................................................................................................................................... 28
Diversity ................................................................................................................................................ 29 G. Internationalization ........................................................................................................................................ 31 H. Entrepreneurship .......................................................................................................................................... 33 I. Space .............................................................................................................................................................. 34 J. Information Technology ................................................................................................................................ 35 K. Advancement ................................................................................................................................................ 36 L. Academic Unit Progress Report Summaries ................................................................................................ 39
School of Architecture ........................................................................................................................... 39 Chemical Engineering Department ....................................................................................................... 45 Civil & Environmental Engineering Department ................................................................................... 49 Conrad Business, Entrepreneurship & Technology Centre .................................................................. 54 Electrical & Computer Engineering Department ................................................................................... 58 Management Sciences Department ..................................................................................................... 64 Mechanical & Mechatronics Engineering Department.......................................................................... 69 Systems Design Engineering Department ............................................................................................ 73
IV. Key Metrics & Performance Indicators ..................................................................................................................... 78 A. Faculty and Staff ........................................................................................................................................... 78 B. Undergraduate Studies ................................................................................................................................. 82 C. Graduate Studies .......................................................................................................................................... 86 D. Research ....................................................................................................................................................... 89 E. Women in Engineering ................................................................................................................................. 93 F. Internationalization ........................................................................................................................................ 93 G. Advancement ................................................................................................................................................ 94 H. Space ............................................................................................................................................................ 95
V. Appendices ............................................................................................................................................................... 96 A. Faculty and Staff Data Tables ...................................................................................................................... 96 B. Undergraduate Studies Data Tables .......................................................................................................... 105 C. Graduate Studies Data Tables ................................................................................................................... 117 D. Research Data Tables ................................................................................................................................ 130 E. Women in Engineering Data Tables ........................................................................................................... 140 F. Internationalization Data Tables ................................................................................................................. 140 G. Advancement Data Tables ......................................................................................................................... 141 H. Space Data Tables ..................................................................................................................................... 143 I. Data Notes .................................................................................................................................................... 144
2 Waterloo Engineering
List of Tables and Figures Table 1: Key Metrics: Current Values and Change from the Vision 2015 Baseline (2010/11) ......................................... 9 Table 2: Key Performance Indicators: Current Values and Change from the Vision 2015 Baseline (2010/11) ............... 9 Table 3: Waterloo Engineering in the Institutional Context, 2013/14 ............................................................................. 10 Table 4: Waterloo Engineering in the Provincial and National Contexts, 2013 .............................................................. 10 Table 5: Waterloo Engineering in International University Rankings, 2014 ................................................................... 10 Table 6: Alignment of Vision 2015 and University of Waterloo Strategic Plan Goals .................................................... 11
Figure 1: Faculty Complement Plan Performance to Target .......................................................................................... 12 Figure 2: Staff Complement Plan Performance to Target .............................................................................................. 13 Figure 3: Undergraduate Intake Plan Performance to Target ........................................................................................ 15 Figure 4: Fraction of 4B Registrations with Options ....................................................................................................... 19 Figure 5: International Co-op Work Terms Performance to Target ................................................................................ 19 Figure 6: Regular Faculty PEng Status Performance to Target ..................................................................................... 21 Figure 7: Graduate Intake Plan Performance to Target by Visa Status ......................................................................... 21 Figure 8: Graduate Intake Plan Performance to Target by Program Type ..................................................................... 22 Figure 9: Research Funding Plan Performance to Target .............................................................................................. 24 Figure 10: High School Outreach Program Participation Performance to Target .......................................................... 29 Figure 11: ESQ Workshop Participation Performance to Target .................................................................................... 29 Figure 12: Female Engineering Undergraduate Confirmation Rate Performance to Target .......................................... 30 Figure 13: International Undergraduate Student Intake Plan Performance to Target .................................................... 31 Figure 14: Undergraduate International Exchange Participation .................................................................................... 32 Figure 15: International Co-op Work Terms Performance to Target .............................................................................. 32 Figure 16: ARCH Regular Faculty Complement Plan Performance to Target ............................................................... 39 Figure 17: ARCH Staff Complement Plan Performance to Target ................................................................................. 40 Figure 18: ARCH Undergraduate Intake Plan Performance to Target ........................................................................... 40 Figure 19: ARCH Graduate Intake Plan Performance to Target .................................................................................... 41 Figure 20: ARCH Research Funding Plan Performance to Target ................................................................................ 43 Figure 21: CHE Regular Faculty Complement Plan Performance to Target .................................................................. 45 Figure 22: CHE Regular Faculty PEng Status Performance to Target .......................................................................... 45 Figure 23: CHE Staff Complement Plan Performance to Target .................................................................................... 46 Figure 24: CHE Undergraduate Intake Plan Performance to Target .............................................................................. 46 Figure 25: NANTE Undergraduate Intake Plan Performance to Target ......................................................................... 47 Figure 26: CHE Graduate Intake Plan Performance to Target by Visa Status ............................................................... 47 Figure 27: CHE Graduate Intake Plan Performance to Target by Program Type .......................................................... 48 Figure 28: CHE Research Funding Plan Performance to Target ................................................................................... 48 Figure 29: CEE Regular Faculty Complement Plan Performance to Target .................................................................. 49 Figure 30: CEE Regular Faculty PEng Status Performance to Target ........................................................................... 50 Figure 31: CEE Staff Complement Plan Performance to Target .................................................................................... 50 Figure 32: CIVE Undergraduate Intake Plan Performance to Target ............................................................................. 51 Figure 33: ENVE Undergraduate Intake Plan Performance to Target ........................................................................... 51 Figure 34: GEOE Undergraduate Intake Plan Performance to Target ........................................................................... 51 Figure 35: CEE Graduate Intake Plan Performance to Target by Visa Status ............................................................... 53 Figure 36: CEE Graduate Intake Plan Performance to Target by Program Type .......................................................... 53 Figure 37: CEE Research Funding Plan Performance to Target ................................................................................... 54 Figure 38: CONRAD Regular Faculty Complement Plan Performance to Target .......................................................... 55 Figure 39: CONRAD Staff Complement Plan Performance to Target ............................................................................ 55 Figure 40: CONRAD Graduate Intake Plan Performance to Target by Visa Status....................................................... 56 Figure 41: CONRAD Graduate Intake Plan Performance to Target by Program Type .................................................. 56 Figure 42: CONRAD Research Funding Plan Performance to Target ........................................................................... 57 Figure 43: ECE Regular Faculty Complement Plan Performance to Target .................................................................. 58
Vision 2015 Progress Report: 2013/14 3
Figure 44: ECE Regular Faculty PEng Status Performance to Target ........................................................................... 58 Figure 45: ECE Staff Complement Plan Performance to Target .................................................................................... 59 Figure 46: EE&CE Undergraduate Intake Plan Performance to Target ......................................................................... 59 Figure 47: SE Undergraduate Intake Plan Performance to Target ................................................................................ 60 Figure 48: NANTE Undergraduate Intake Plan Performance to Target ......................................................................... 60 Figure 49: MCTR Undergraduate Intake Plan Performance to Target ........................................................................... 60 Figure 50: ECE Graduate Intake Plan Performance to Target by Visa Status ............................................................... 61 Figure 51: ECE Graduate Intake Plan Performance to Target by Program Type .......................................................... 62 Figure 52: ECE Research Funding Plan Performance to Target ................................................................................... 63 Figure 53: MSCI Regular Faculty Complement Plan Performance to Target ................................................................ 64 Figure 54: MSCI Regular Faculty PEng Status Performance to Target ......................................................................... 65 Figure 55: MSCI Staff Complement Plan Performance to Target .................................................................................. 65 Figure 56: MGMT Undergraduate Intake Plan Performance to Target .......................................................................... 66 Figure 57: MSCI Graduate Intake Plan Performance to Target by Visa Status ............................................................. 67 Figure 58: MSCI Graduate Intake Plan Performance to Target by Program Type......................................................... 67 Figure 59: MSCI Research Funding Plan Performance to Target .................................................................................. 68 Figure 60: MME Regular Faculty Complement Plan Performance to Target ................................................................. 69 Figure 61: MME Regular Faculty PEng Status Performance to Target .......................................................................... 69 Figure 62: MME Staff Complement Plan Performance to Target ................................................................................... 70 Figure 63: ME Undergraduate Intake Plan Performance to Target ................................................................................ 70 Figure 64: MCTR Undergraduate Intake Plan Performance to Target ........................................................................... 71 Figure 65: MME Graduate Intake Plan Performance to Target by Visa Status .............................................................. 72 Figure 66: MME Graduate Intake Plan Performance to Target by Program Type ......................................................... 72 Figure 67: MME Research Funding Plan Performance to Target .................................................................................. 72 Figure 68: SDE Regular Faculty Complement Plan Performance to Target .................................................................. 73 Figure 69: SDE Regular Faculty PEng Status Performance to Target ........................................................................... 73 Figure 70: SDE Staff Complement Plan Performance to Target .................................................................................... 74 Figure 71: SDE Undergraduate Intake Plan Performance to Target .............................................................................. 74 Figure 72: MCTR Undergraduate Intake Plan Performance to Target ........................................................................... 75 Figure 73: BIO Undergraduate Intake Plan Performance to Target ............................................................................... 75 Figure 74: SDE Graduate Intake Plan Performance to Target by Visa Status ............................................................... 76 Figure 75: SDE Graduate Intake Plan Performance to Target by Program Type .......................................................... 76 Figure 76: SDE Research Funding Plan Performance to Target ................................................................................... 76 Figure 77: Regular Faculty 2005-2014 (A1) ................................................................................................................... 78 Figure 78: Regular Faculty, 2014 (A1) ............................................................................................................................ 78 Figure 79: TTS Faculty by PhD School, 2014 (A4) ........................................................................................................ 79 Figure 80: Regular Faculty by PEng Status, 2014 (A2) .................................................................................................. 79 Figure 81: Age Distribution of Regular Faculty, 2014 (A3) ............................................................................................. 79 Figure 82: Non-regular and Non-faculty Appointments by Department, 2014 (A5) ....................................................... 79 Figure 83: Non-regular and Non-faculty Appointments by Type, 2014 (A5) .................................................................. 79 Figure 84: FTE Staff, 2005-2014 (A7) ............................................................................................................................ 80 Figure 85: FTE Staff in Academic Units, 2014 (A7) ........................................................................................................ 80 Figure 86: FTE Staff in Administrative Units, 2014 (A7) ................................................................................................. 80 Figure 87: Age Distribution of Staff, 2014 (A8) ............................................................................................................... 80 Figure 88: Faculty to Staff Ratios, 2006-2014 (A10) ...................................................................................................... 81 Figure 89: Faculty to Staff Ratios, 2014 (A10)................................................................................................................ 81 Figure 90: Undergraduate Enrolment 2004-2013 (B1) ................................................................................................... 82 Figure 91: Undergraduate Enrolment, Fall 2013 (B1) .................................................................................................... 82 Figure 92: Undergraduate Students per Regular Faculty Member, 2005/06-2013/14 (B6) ........................................... 83 Figure 93: Undergraduate Students per Regular Faculty Member, 2013/14 (B6) ......................................................... 83 Figure 94: Undergraduate Year One New Admissions, 2007-2013 (B4) ....................................................................... 83 Figure 95: Undergraduate Admissions by Final Entering Grade Averages, 2007-2013 (B5) ........................................ 83
4 Waterloo Engineering
Figure 96: Co-op Employment, 2005-2013 (B8) ............................................................................................................. 84 Figure 97: Co-op Employment by Program, 2013 (B8) .................................................................................................. 84 Figure 98: Co-op Employment by Location, 2013 (B8) .................................................................................................. 84 Figure 99: Undergraduate Student International Exchange Participation, 2009-2013 (B10) ......................................... 84 Figure 100: Undergraduate Degrees Granted, 2004-2013 (B3) ..................................................................................... 85 Figure 101: Undergraduate Degrees Granted, 2013 (B3) .............................................................................................. 85 Figure 102: Undergraduate Degrees Granted per Regular Faculty Member, 2009/10-2013/14 (B7) ............................ 85 Figure 103: Undergraduate Degrees Granted per Regular Faculty Member, 2013/14 (B7) .......................................... 85 Figure 104: Graduate Enrolment, 2004-2013 (C1) ......................................................................................................... 86 Figure 105: Graduate Enrolment, 2013 (C1) .................................................................................................................. 86 Figure 106: Graduate Students per TTS Faculty Member, 2005/06-2013/14 (C5) ........................................................ 87 Figure 107: Graduate Students per TTS Faculty Member, 2013/14 (C5) ...................................................................... 87 Figure 108: Graduate Proportion of Total FTE Enrolment, 2009/10-2013/14 (C7) ........................................................ 87 Figure 109: FTE Graduate Student Admissions, 2010-2013 (C4) ................................................................................. 87 Figure 110: FTE Graduate Student Admissions, 2013 (C4) ........................................................................................... 87 Figure 111: Graduate Student Financial Support, 2013/14: PhD Students (C8)............................................................ 88 Figure 112: Graduate Student Financial Support, 2013/14: Research Master's Students (C8) .................................... 88 Figure 113: Graduate Degrees Granted, 2004-2013 (C3) .............................................................................................. 88 Figure 114: Graduate Degrees Granted, 2013 (C3) ....................................................................................................... 88 Figure 115: Graduate Degrees Granted per TTS Faculty Member, 2009/10-2013/14 (C6) .......................................... 89 Figure 116: Graduate Degrees Granted per TTS Faculty Member, 2013/14 (C6) ......................................................... 89 Figure 117: Research Funds by Sector ($millions) and per TTS Faculty Member, 2004/05-2013/14 (D1&D7) ............ 89 Figure 118: Research Funds by Sector ($millions), 2013/14 (D1) ................................................................................. 90 Figure 119: NSERC Funding by Type ($millions), 2004/05-2013/14 (D3) ..................................................................... 90 Figure 120: Tri-Council Funding and NSERC Funding by Type ($millions), 2013/14 (D2&D3) ..................................... 90 Figure 121: University of Waterloo* Share of NSERC Awards in Engineering Subjects, 2009/10-2013/14 (D4) .......... 90 Figure 122: University of Waterloo* Share of NSERC Funding in Engineering Subjects, 2009/10-2013/14 (D4) ......... 90 Figure 123: Industry Research Funding by Region, 2004/05-2013/14 (D6) ................................................................... 91 Figure 124: Research Chair Holders, 2014 (D9) ............................................................................................................ 91 Figure 125: University of Waterloo* Publications in Thomson Reuters-indexed Journals Classified as Engineering or Materials Science (D10) .................................................................................................................................................. 91 Figure 126: Citations to University of Waterloo* Publications in Thomson Reuters-indexed Journals Classified as Engineering or Materials Science (D11) ......................................................................................................................... 92 Figure 127: Impact Relative to Subject Area (Engineering or Materials Science) of University of Waterloo* Publications in Thomson Reuters-indexed Journals (D12) ................................................................................................................. 92 Figure 128: Women in Engineering and Architecture, 2009-2013 (A1&B1&C1) ............................................................ 93 Figure 129: Women in Engineering Programs, 2013 (E1) .............................................................................................. 93 Figure 130: Women in Architecture, 2013 (E2) .............................................................................................................. 93 Figure 131: International Students, 2009-2013 (B1&C1) ............................................................................................... 93 Figure 132: International Students, 2013 (F1) ................................................................................................................ 94 Figure 133: International Opportunities for Undergraduate Students, 2009-2013 (B8&B10) ......................................... 94 Figure 134: Industry Research Funding by Source Region, 2013/14 (D6) .................................................................... 94 Figure 135: Alumni, 2007-2013 (G1&G2) ....................................................................................................................... 94 Figure 136: Alumni Who Have Donated to UW as of May 1, 2014 (G3) ........................................................................ 95 Figure 137: Funds Raised ($millions), 2010/11-2013/14 (G4) ....................................................................................... 95 Figure 138: Campaign Progress ($millions) as of May 1, 2014 (G5) ............................................................................ 95 Figure 139: Space Holdings (nasm), 2006/07-2013/14 (H1) .......................................................................................... 95
Vision 2015 Progress Report: 2013/14 5
I. Executive Summary
In November 2010, Waterloo Engineering initiated a comprehensive planning exercise that resulted in the second strategic academic plan for the Faculty of Engineering. Published in May 2012, Vision 2015: Building on Excellence presented a set of goals and strategies aimed at achieving our aspiration to be a truly world-class school of engineering.
A key element of planning in the Faculty of Engineering is our commitment to an annual assessment of our current status and a progress report on our plan. This annual review process provides an opportunity to critically examine our plans and to make changes in direction if needed. This report represents the second such progress report on our Vision 2015 plan. Sections III.A-III.K summarize our progress at the Faculty level and Section III.L includes a summary of each academic unit’s progress report. Section IV presents high-level key metrics and performance indicators used to assess our progress, supported further by the detailed data in Appendices A-H.
This progress report represents the first stage in extending our Vision 2015 strategic academic plan out to 2018 in order to align with the timeframe of the University of Waterloo’s strategic plan, published in fall 2013. Throughout this report, our targets have been updated and extended to 2018. Over the course of the coming year, the Engineering Planning Committee will consult with community members and review our goals and strategies in order to publish in fall 2015 a refreshed strategic roadmap for the Faculty of Engineering that extends to 2018.
Over the past year, hiring has been in line with our faculty and staff plans. In total, 10.5 regular faculty positions (8.5 of which were new positions) and 15 regular staff positions (three of which were new) were filled between May 1, 2013 and May 1, 2014. The extent to which we are slightly below our established faculty and staff complement targets is largely due to positions that have been vacated and are in search. Faculty and staff complements are expected to increase further in the coming years in support of our planned undergraduate program expansion. An operational effectiveness and efficiency project carried out in 2013/14 has resulted in staff changes aimed at enhancing the administrative work and services provided by the Dean of Engineering Office. This new administrative structure should increase our capacity to move our faculty and staff goals forward strategically in the coming year.
We continue to meet our undergraduate targets with very high quality students. Over the past decade, undergraduate enrolment has increased by over 44% to reach a record total of 6,995 in fall 2013. A new phase of undergraduate expansion began in fall 2014 with the launch of a new program in biomedical engineering and the introduction of a second stream of mechatronics engineering. The applicant response to both programs was exceptionally strong, and intake in both programs is expected to gradually increase to reach steady state intake in 2021. Strategies to enhance student success and to improve the learning environment continue to be implemented across the Faculty. Despite student growth resulting in approximately 500 additional required jobs in 2013, employment rates in our highly successful co-operative education program remain high. In the past year we also successfully completed the CEAB accreditation process for all 12 engineering programs.
Our graduate student enrolment has remained relatively stable in recent years, at 1,850 in fall 2013. Graduate student intake decreased between 2012 and 2013, retuning to 2011 levels. Efforts to understand and address the reasons for this decline have been a focus of the past year and will remain a priority in the coming year. Over the past year we have made a number of operational changes and process improvements and established a Graduate Recruitment Working Group to work with the Faculty’s Graduate Recruitment Specialist. The Conrad Centre has launched a new certificate and diploma program in business and entrepreneurship for professional master’s students.
Research funding earned by Engineering researchers totalled $52.3 million in 2013/14, falling short of target. This was largely due to the deferral of a number of key provincial and non tri-agency programs. Strategies are being implemented to further develop industrial partnerships and access special programs in order to maintain the stable funding required for a quality research program. Other indicators of research excellence, including research chairs, faculty awards and honours, and bibliometric measures of scholarly output all demonstrate strong research performance. Over the past year, our key strategic areas of research strength were identified. A priority for the coming year is to further quantify these areas and to pursue partnerships and funding opportunities aligned with our identified strengths.
Our new teaching portfolio, established as a Vision 2015 priority, completed its first full calendar year in 2013 and continued to develop a strong foundation of initiatives and programming. The Engineering Teaching Development Committee is actively engaging teaching champions in each academic unit in a community of practice that supports teaching excellence across the Faculty. Over the past year, a multi-department Engineering Ideas Clinic™ Committee developed several clinic-based activities to be introduced as pilots aimed at integrating student learning through
6 Waterloo Engineering
hands-on modules. Floor plans and detailed facility specifications were also created for the future Engineering Ideas Clinic™ space in our planned new Engineering 7 (E7) buildling.
To date, we have met our Vision 2015 targets for outreach activities, exceeding our targets for high school programming by such a large margin that they have been increased in this progress report. Efforts to increase the participation of women in engineering have been enhanced through additional initiatives supported by industry partners, including programs focused on coding and entrepreneurship. The Associate Dean, Outreach is working with the new University Diversity Director to enhance inclusivity across the Faculty.
To enhance and consolidate our internationalization activities, a new Associate Dean portfolio was established for internationalization in July, 2014. This office has assumed responsibility for undergraduate international exchange and the development and maintenance of strategic global academic and research partnerships. As we continue to work to further globalize the undergraduate student population and experience, this portfolio will develop mechanisms to increase the support available to our international students.
Our Vision 2015 commitment to enhance the support we provide for entrepreneurship and innovation remains a central priority for the Faculty. In addition to attending to existing programs such as E Co-op, the Bridging Entrepreneurs to Students (BETS) co-op initiative and capstone design awards, the Conrad Centre launched an entrepreneurship option for engineering students in fall 2014. Furthermore, the space plans for the proposed new E7 building focus on providing a space that will foster collaboration, integration, innovation and entrepreneurship.
Of course our Vision 2015 plan cannot be accomplished without the required resources. Engineering Computing is on track to implement its plan to maintain a quality computing environment and to provide excellent computing support. Our Advancement team continues its work to support our plan priorities through philanthropic giving and enhancements to the Faculty’s reputation and visibility nationally and internationally. The limitations of our physical space remain perhaps the most significant potential constraint to the achievement of our Vision 2015 goals. Construction of the new E7 building remains the top space priority for the Faculty: Over the past year we have developed an E7 space plan, raised significant funds and received approval from the University Board of Governors for its construction.
This second Vision 2015 progress report marks another year of excellent progress toward our goals. Under the guidance of a dedicated team of leaders, and with the excellent effort of all our students, faculty members and staff, we are working steadily toward securing our place as a world-class school of engineering.
Priorities for 2015 In the coming year, we will continue working on all fronts to make progress on each of our goals. This list of priorities provides a snapshot of the highest priority items among those goals, on which we need to strategically focus to make the most progress possible this year.
Implement processes in each department to measure graduate attributes as required for the professional accreditation of our undergraduate programs.
Enhance undergraduate student success and increase retention.
Move forward on implementing innovative new teaching initiatives, including the Engineering Ideas Clinic™.
Enhance research outreach and strategic graduate student recruitment.
Pursue major opportunities in our identified areas of distinguishing research excellence.
Focus on collaboration and establishing strategic partnerships, in particular the expansion of industry partnerships in emerging areas and the development of strategic research and PhD program partnerships with leading global engineering schools.
Vision 2015 Progress Report: 2013/14 7
Summary of Current Vision 2015 Goals Goal A1: Increase the Faculty Complement Strategically Goal A2: Increase the Staff Complement to Appropriate Levels Goal A3: Establish a Culture of Service Excellence Goal A4: Improve Internal Communications Goal A5: Recognize and Promote Faculty and Staff Excellence Goal A6: Support the Career-Long Development of Faculty and Staff Goal A7: Fully Engage All Faculty Members Goal B1: Maintain Relatively Stable Undergraduate Intake Targets Goal B2: Enhance the Undergraduate Academic Program Goal B3: Support the Retention of Undergraduate Students Goal B4: Improve the Undergraduate Student Experience Goal B5: Increase the Number of Co-op Jobs Goal B6: Provide Unemployed First Work Term Students a Meaningful Experience Goal B7: Support the Successful Implementation of WatPD-Engineering Goal B8: Ensure the Ongoing Accreditation of all Engineering Programs Goal C1: Strategically Increase Graduate Enrolment Goal C2: Improve Graduate Operations and Service Goal C3: Improve the Graduate Program Goal C4: Enhance the Graduate Student Experience Goal D1: Increase Research Funding Goal D2: Establish a Shared Commitment to Research Excellence Goal D3: Eliminate Barriers to Research Success Goal D4: Celebrate Research Excellence Goal D5: Strategically Identify and Assess Research Strengths Goal E1: Enhance Support for Teaching at the Faculty Level Goal E2: Contribute to the Development of Faculty Members and TAs as Teachers Goal E3: Affirm the Importance of Teaching Goal E4: Support Teaching Innovations and Strategies for Integrating Learning Goal F1: Expand the Scope of Waterloo Engineering Outreach Programs Goal F2: Enhance the Waterloo Engineering Community through Participation in Outreach Goal F3: Increase the Participation of Women in Engineering at Waterloo Goal F4: Build an Inclusive Atmosphere within Waterloo Engineering Goal G1: Increase International Undergraduate Enrolments Goal G2: Increase International Experience Opportunities for Undergraduates Goal G3: Increase International Graduate Studies and Research Collaborations Goal G4: Pursue Targeted Collaboration Initiatives in India Goal H1: Enhance Existing Supports for Entrepreneurship and Innovation Goal H2: Introduce New Initiatives to Foster Entrepreneurial Activity and Innovation Goal H3: Develop New Spaces and Infrastructure to Support Entrepreneurship and Innovation Goal I1: Complete a Comprehensive Update to the Existing Space Plan Goal I2: Create the Space Required to Meet Operational and Strategic Needs Goal I3: Harmonize all Aspects of Safety within the Faculty of Engineering Goal J1: Ensure a Quality Computing Environment Goal J2: Enhance Support to Computing Clients Goal J3: Support Improvements to Operational Efficiency and Innovation in Service Delivery Goal K1: Secure the Philanthropic Support Required for our Priority Initiatives Goal K2: Enhance the Faculty’s Reputation as a World-class Leader in Engineering Research and Education
8 Waterloo Engineering
Vision 2015 Aspiration Waterloo Engineering aspires to be a truly world-class school of engineering. The programs we offer, the students we graduate, and the solutions we develop will be sought after by outstanding students, employers, employees and partners.
Waterloo Engineering will be:
the top choice of outstanding high school students from Canada and abroad who are seeking a challenging academic program of the highest quality, fully integrated with real-world experience
in demand by excellent students, both domestic and international, seeking high-calibre graduate education and by working engineers seeking professional upgrading opportunities
the destination of choice among Canadian and global employers seeking co-op students or graduates at all levels for full-time employment
sought after by outstanding engineering faculty looking for a rewarding career that supports teaching and research excellence
the top choice of industry, government and community partners seeking to connect with outstanding researchers, students, entrepreneurs and innovators to solve local, national and global challenges
Vision 2015 Key Priorities Attracting, engaging, and retaining outstanding people: undergraduate students, graduate students, faculty
and staff
Committing to excellence in academic programs and services
Undertaking high-impact research, both within and across the disciplines and spanning the theoretical to the practical
Building connections and promoting collaboration
Fostering innovation and entrepreneurship
Providing the world-class facilities required to support excellence in education and research
Vision 2015 Progress Report: 2013/14 9
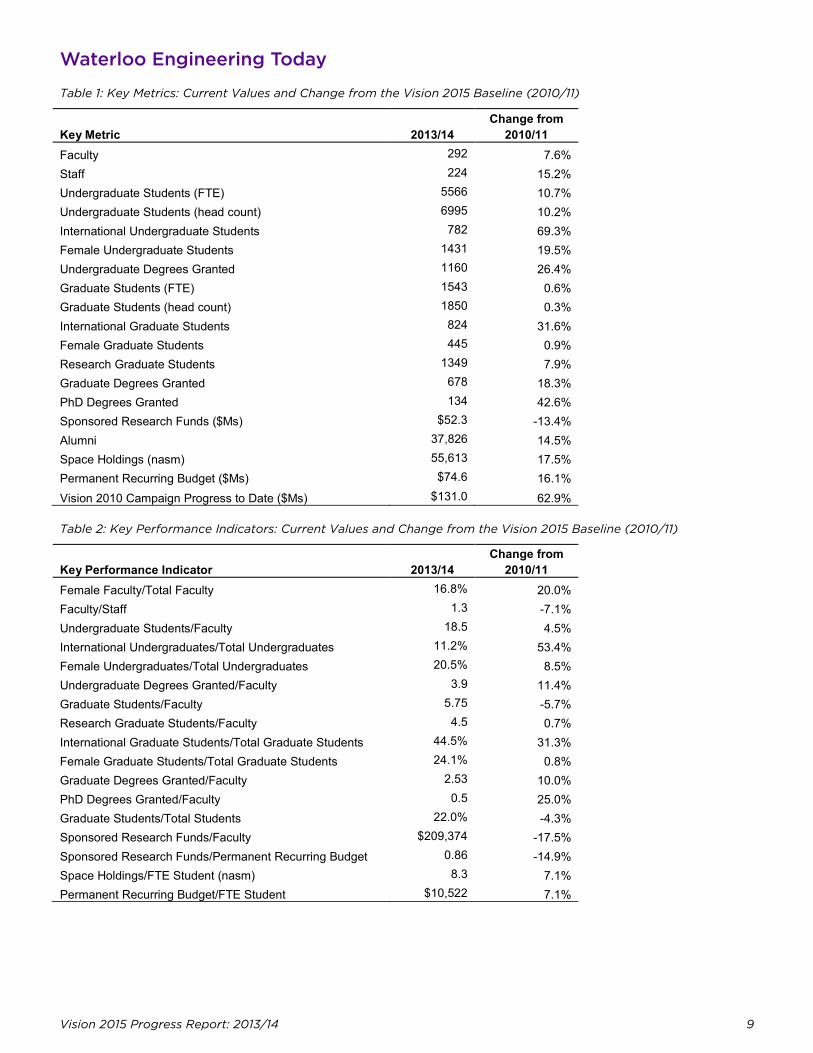
Waterloo Engineering Today
Table 1: Key Metrics: Current Values and Change from the Vision 2015 Baseline (2010/11)
Key Metric 2013/14 Change from
2010/11 Faculty 292 7.6% Staff 224 15.2% Undergraduate Students (FTE) 5566 10.7% Undergraduate Students (head count) 6995 10.2% International Undergraduate Students 782 69.3% Female Undergraduate Students 1431 19.5% Undergraduate Degrees Granted 1160 26.4% Graduate Students (FTE) 1543 0.6% Graduate Students (head count) 1850 0.3% International Graduate Students 824 31.6% Female Graduate Students 445 0.9% Research Graduate Students 1349 7.9% Graduate Degrees Granted 678 18.3% PhD Degrees Granted 134 42.6% Sponsored Research Funds ($Ms) $52.3 -13.4% Alumni 37,826 14.5% Space Holdings (nasm) 55,613 17.5% Permanent Recurring Budget ($Ms) $74.6 16.1% Vision 2010 Campaign Progress to Date ($Ms) $131.0 62.9%
Table 2: Key Performance Indicators: Current Values and Change from the Vision 2015 Baseline (2010/11)
Key Performance Indicator 2013/14 Change from
2010/11 Female Faculty/Total Faculty 16.8% 20.0% Faculty/Staff 1.3 -7.1% Undergraduate Students/Faculty 18.5 4.5% International Undergraduates/Total Undergraduates 11.2% 53.4% Female Undergraduates/Total Undergraduates 20.5% 8.5% Undergraduate Degrees Granted/Faculty 3.9 11.4% Graduate Students/Faculty 5.75 -5.7% Research Graduate Students/Faculty 4.5 0.7% International Graduate Students/Total Graduate Students 44.5% 31.3% Female Graduate Students/Total Graduate Students 24.1% 0.8% Graduate Degrees Granted/Faculty 2.53 10.0% PhD Degrees Granted/Faculty 0.5 25.0% Graduate Students/Total Students 22.0% -4.3% Sponsored Research Funds/Faculty $209,374 -17.5% Sponsored Research Funds/Permanent Recurring Budget 0.86 -14.9% Space Holdings/FTE Student (nasm) 8.3 7.1% Permanent Recurring Budget/FTE Student $10,522 7.1%
10 Waterloo Engineering
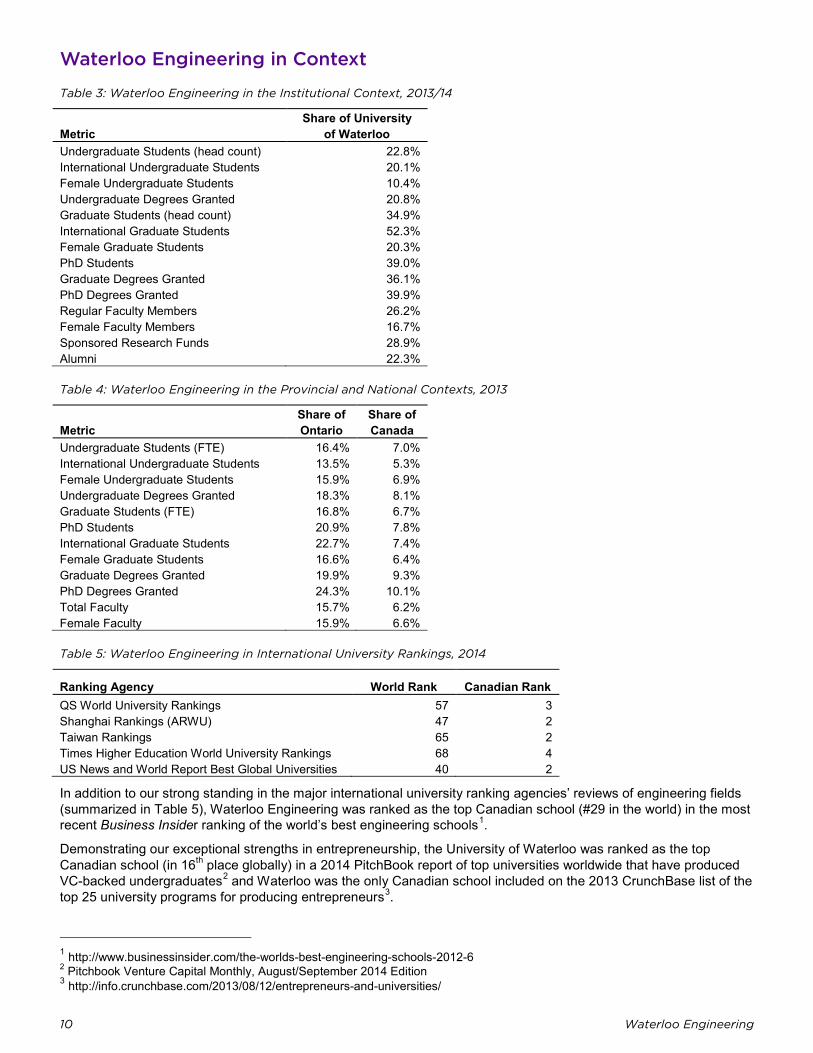
Waterloo Engineering in Context
Table 3: Waterloo Engineering in the Institutional Context, 2013/14
Metric Share of University
of Waterloo Undergraduate Students (head count) 22.8% International Undergraduate Students 20.1% Female Undergraduate Students 10.4% Undergraduate Degrees Granted 20.8% Graduate Students (head count) 34.9% International Graduate Students 52.3% Female Graduate Students 20.3% PhD Students 39.0% Graduate Degrees Granted 36.1% PhD Degrees Granted 39.9% Regular Faculty Members 26.2% Female Faculty Members 16.7% Sponsored Research Funds 28.9% Alumni 22.3%
Table 4: Waterloo Engineering in the Provincial and National Contexts, 2013
Metric Share of Ontario
Share of Canada
Undergraduate Students (FTE) 16.4% 7.0% International Undergraduate Students 13.5% 5.3% Female Undergraduate Students 15.9% 6.9% Undergraduate Degrees Granted 18.3% 8.1% Graduate Students (FTE) 16.8% 6.7% PhD Students 20.9% 7.8% International Graduate Students 22.7% 7.4% Female Graduate Students 16.6% 6.4% Graduate Degrees Granted 19.9% 9.3% PhD Degrees Granted 24.3% 10.1% Total Faculty 15.7% 6.2% Female Faculty 15.9% 6.6%
Table 5: Waterloo Engineering in International University Rankings, 2014
Ranking Agency World Rank Canadian Rank QS World University Rankings 57 3 Shanghai Rankings (ARWU) 47 2 Taiwan Rankings 65 2 Times Higher Education World University Rankings 68 4 US News and World Report Best Global Universities 40 2
In addition to our strong standing in the major international university ranking agencies’ reviews of engineering fields (summarized in Table 5), Waterloo Engineering was ranked as the top Canadian school (#29 in the world) in the most recent Business Insider ranking of the world’s best engineering schools1.
1 http://www.businessinsider.com/the-worlds-best-engineering-schools-2012-6
Demonstrating our exceptional strengths in entrepreneurship, the University of Waterloo was ranked as the top Canadian school (in 16th place globally) in a 2014 PitchBook report of top universities worldwide that have produced VC-backed undergraduates2 and Waterloo was the only Canadian school included on the 2013 CrunchBase list of the top 25 university programs for producing entrepreneurs3.
2 Pitchbook Venture Capital Monthly, August/September 2014 Edition 3 http://info.crunchbase.com/2013/08/12/entrepreneurs-and-universities/
Vision 2015 Progress Report: 2013/14 11
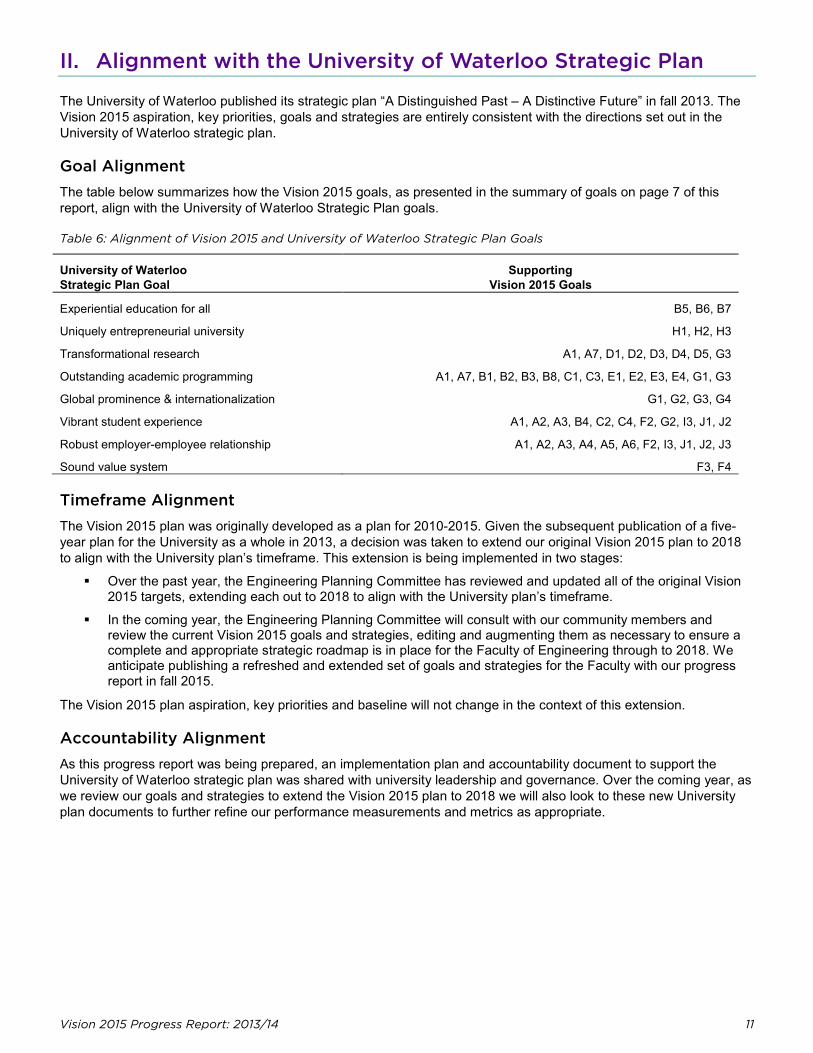
II. Alignment with the University of Waterloo Strategic Plan
The University of Waterloo published its strategic plan “A Distinguished Past – A Distinctive Future” in fall 2013. The Vision 2015 aspiration, key priorities, goals and strategies are entirely consistent with the directions set out in the University of Waterloo strategic plan.
Goal Alignment The table below summarizes how the Vision 2015 goals, as presented in the summary of goals on page 7 of this report, align with the University of Waterloo Strategic Plan goals.
Table 6: Alignment of Vision 2015 and University of Waterloo Strategic Plan Goals
University of Waterloo Strategic Plan Goal
Supporting Vision 2015 Goals
Experiential education for all B5, B6, B7
Uniquely entrepreneurial university H1, H2, H3
Transformational research A1, A7, D1, D2, D3, D4, D5, G3
Outstanding academic programming A1, A7, B1, B2, B3, B8, C1, C3, E1, E2, E3, E4, G1, G3
Global prominence & internationalization G1, G2, G3, G4
Vibrant student experience A1, A2, A3, B4, C2, C4, F2, G2, I3, J1, J2
Robust employer-employee relationship A1, A2, A3, A4, A5, A6, F2, I3, J1, J2, J3
Sound value system F3, F4
Timeframe Alignment The Vision 2015 plan was originally developed as a plan for 2010-2015. Given the subsequent publication of a five-year plan for the University as a whole in 2013, a decision was taken to extend our original Vision 2015 plan to 2018 to align with the University plan’s timeframe. This extension is being implemented in two stages:
Over the past year, the Engineering Planning Committee has reviewed and updated all of the original Vision 2015 targets, extending each out to 2018 to align with the University plan’s timeframe.
In the coming year, the Engineering Planning Committee will consult with our community members and review the current Vision 2015 goals and strategies, editing and augmenting them as necessary to ensure a complete and appropriate strategic roadmap is in place for the Faculty of Engineering through to 2018. We anticipate publishing a refreshed and extended set of goals and strategies for the Faculty with our progress report in fall 2015.
The Vision 2015 plan aspiration, key priorities and baseline will not change in the context of this extension.
Accountability Alignment As this progress report was being prepared, an implementation plan and accountability document to support the University of Waterloo strategic plan was shared with university leadership and governance. Over the coming year, as we review our goals and strategies to extend the Vision 2015 plan to 2018 we will also look to these new University plan documents to further refine our performance measurements and metrics as appropriate.
12 Waterloo Engineering
0%10%20%30%40%50%60%70%80%90%100%
050
100150200250300350400
% W
omen
Tota
l Fac
ulty
III. Vision 2015 Strategic Plan Progress Report
A. Faculty and Staff Over the past decade, our regular faculty complement has grown by 38.5% (see Figure 77) and our staff complement has grown by 49% (see Figure 84). These and other information about our faculty and staff complements are presented in Section IV.A of this report.
Overall, we have made good progress on our Vision 2015 faculty and staff goals to date. While our hiring plans are progressing well, we are slightly below our faculty and staff complement targets due to vacancies resulting from retirements and resignations. Hiring will remain a major priority in the coming years as growth in faculty and staff accelerates in support of our new undergraduate program in biomedical engineering and the addition of a second stream of students to our high-demand mechatronics engineering program.
Goal A1: Increase the Faculty Complement Strategically
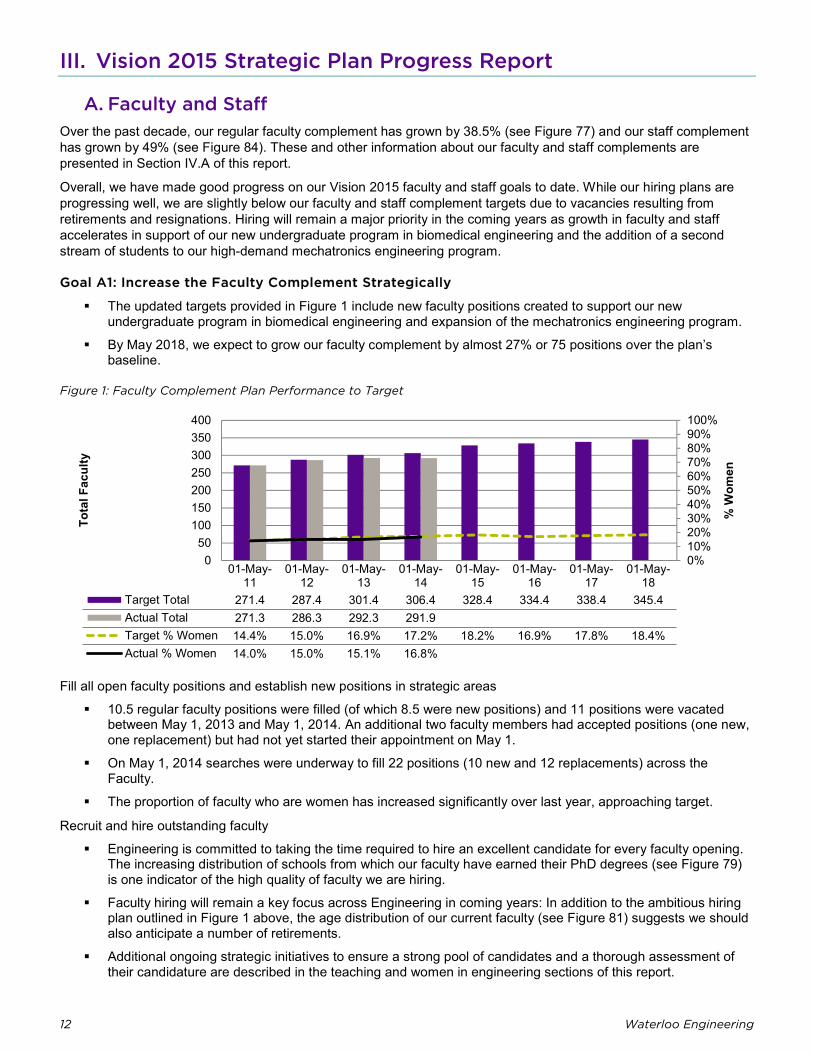
The updated targets provided in Figure 1 include new faculty positions created to support our new undergraduate program in biomedical engineering and expansion of the mechatronics engineering program.
By May 2018, we expect to grow our faculty complement by almost 27% or 75 positions over the plan’s baseline.
Figure 1: Faculty Complement Plan Performance to Target
01-May-11
01-May-12
01-May-13
01-May-14
01-May-15
01-May-16
01-May-17
01-May-18
Target Total 271.4 287.4 301.4 306.4 328.4 334.4 338.4 345.4Actual Total 271.3 286.3 292.3 291.9Target % Women 14.4% 15.0% 16.9% 17.2% 18.2% 16.9% 17.8% 18.4%Actual % Women 14.0% 15.0% 15.1% 16.8%
Fill all open faculty positions and establish new positions in strategic areas
10.5 regular faculty positions were filled (of which 8.5 were new positions) and 11 positions were vacated between May 1, 2013 and May 1, 2014. An additional two faculty members had accepted positions (one new, one replacement) but had not yet started their appointment on May 1.
On May 1, 2014 searches were underway to fill 22 positions (10 new and 12 replacements) across the Faculty.
The proportion of faculty who are women has increased significantly over last year, approaching target.
Recruit and hire outstanding faculty
Engineering is committed to taking the time required to hire an excellent candidate for every faculty opening. The increasing distribution of schools from which our faculty have earned their PhD degrees (see Figure 79) is one indicator of the high quality of faculty we are hiring.
Faculty hiring will remain a key focus across Engineering in coming years: In addition to the ambitious hiring plan outlined in Figure 1 above, the age distribution of our current faculty (see Figure 81) suggests we should also anticipate a number of retirements.
Additional ongoing strategic initiatives to ensure a strong pool of candidates and a thorough assessment of their candidature are described in the teaching and women in engineering sections of this report.
Vision 2015 Progress Report: 2013/14 13
0
50
100
150
200
250
300
Goal A2: Increase the Staff Complement to Appropriate Levels
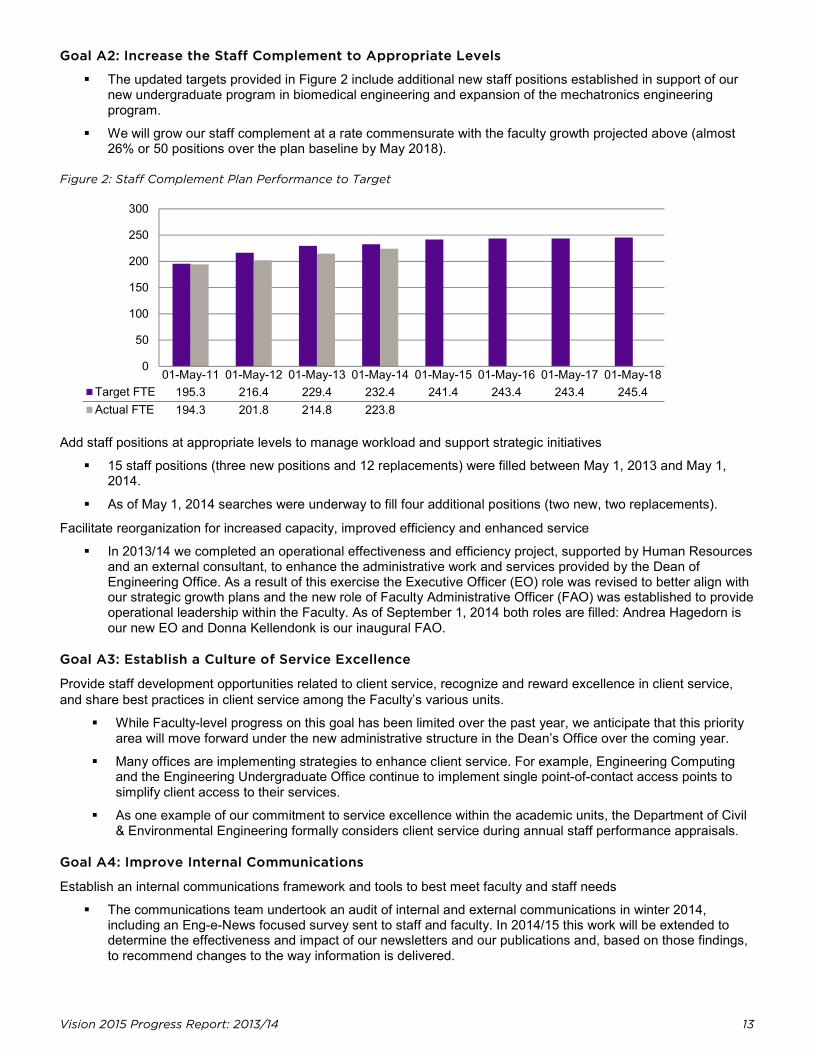
The updated targets provided in Figure 2 include additional new staff positions established in support of our new undergraduate program in biomedical engineering and expansion of the mechatronics engineering program.
We will grow our staff complement at a rate commensurate with the faculty growth projected above (almost 26% or 50 positions over the plan baseline by May 2018).
Figure 2: Staff Complement Plan Performance to Target
01-May-11 01-May-12 01-May-13 01-May-14 01-May-15 01-May-16 01-May-17 01-May-18Target FTE 195.3 216.4 229.4 232.4 241.4 243.4 243.4 245.4Actual FTE 194.3 201.8 214.8 223.8
Add staff positions at appropriate levels to manage workload and support strategic initiatives
15 staff positions (three new positions and 12 replacements) were filled between May 1, 2013 and May 1, 2014.
As of May 1, 2014 searches were underway to fill four additional positions (two new, two replacements).
Facilitate reorganization for increased capacity, improved efficiency and enhanced service
In 2013/14 we completed an operational effectiveness and efficiency project, supported by Human Resources and an external consultant, to enhance the administrative work and services provided by the Dean of Engineering Office. As a result of this exercise the Executive Officer (EO) role was revised to better align with our strategic growth plans and the new role of Faculty Administrative Officer (FAO) was established to provide operational leadership within the Faculty. As of September 1, 2014 both roles are filled: Andrea Hagedorn is our new EO and Donna Kellendonk is our inaugural FAO.
Goal A3: Establish a Culture of Service Excellence
Provide staff development opportunities related to client service, recognize and reward excellence in client service, and share best practices in client service among the Faculty’s various units.
While Faculty-level progress on this goal has been limited over the past year, we anticipate that this priority area will move forward under the new administrative structure in the Dean’s Office over the coming year.
Many offices are implementing strategies to enhance client service. For example, Engineering Computing and the Engineering Undergraduate Office continue to implement single point-of-contact access points to simplify client access to their services.
As one example of our commitment to service excellence within the academic units, the Department of Civil & Environmental Engineering formally considers client service during annual staff performance appraisals.
Goal A4: Improve Internal Communications
Establish an internal communications framework and tools to best meet faculty and staff needs
The communications team undertook an audit of internal and external communications in winter 2014, including an Eng-e-News focused survey sent to staff and faculty. In 2014/15 this work will be extended to determine the effectiveness and impact of our newsletters and our publications and, based on those findings, to recommend changes to the way information is delivered.
14 Waterloo Engineering
The Engineering Communications Council reconvened in late 2013 as a venue to share University-wide and Engineering communication, marketing and strategic updates, as well as best practices. Engineering editorial and events calendars were introduced to keep staff and faculty up to date on Faculty activities.
In the coming year, the Dean will begin holding regular lunch meetings with small groups of staff who are either new to Engineering or who would like the opportunity to meet the Dean and share their thoughts on their experience in the Faculty.
Starting in September, 2014, all members of the Waterloo Engineering community will receive regular emails with updates from the Dean to celebrate achievements within the Faculty.
Goal A5: Recognize and Promote Faculty and Staff Excellence
Increase nominations to internal and external awards and honours
The Engineering Awards and Honours Committee has been meeting on a regular schedule since fall 2013 and is now professionally supported by a technical writer from the Engineering Research Office who is providing project management, editorial and nomination preparation support.
These enhanced resources have already resulted in many successful nominations to prestigious external awards and honours in 2013 as outlined in the research section of this report and in Table 6 of Appendix V.A
Many new honours and awards – including memberships in Canada’s and Ontario’s most prestigious honorific societies – have also been earned by our faculty members in 2014. (A complete list of 2014 awards will be included in the next Vision 2015 progress report.)
The 2014 Waterloo Engineering Outstanding Staff Award was awarded to Kirsten Deckert of Systems Design Engineering and Jim Baleshta of Mechanical & Mechatronics Engineering. Faculty members who earned internal Faculty of Engineering awards are listed in the teaching and research sections of this report.
Establish additional awards within Waterloo Engineering
Establishing a Waterloo Engineering Award of Excellence in Graduate Student Supervision is a priority for the coming year.
Goal A6: Support the Career-Long Development of Faculty and Staff
Identify and promote development opportunities for faculty and staff
In addition to the many commitments made to the development of staff and faculty in each of our academic and administrative units, a number of Faculty-wide development opportunities were offered:
- 30 staff managers from the Faculty of Engineering attended a training session on the University’s revised staff employment policy co-ordinated by the Dean of Engineering Office in fall 2013.
- The Associate Dean, Teaching facilitated an Instructional Skills Workshop, a workshop on engaging student attention in large classes, and a series of five sessions to help develop understanding of teaching/learning effectiveness for engineering faculty in 2013.
- The Engineering Research Office offered information sessions on NSERC Discovery Grants and NSERC Strategic Grants and a workshop on the Early Researcher Award in 2013. Approximately 20 to 30 faculty members attended each.
Establish a culture of mentorship
Across Engineering, new faculty members are connected with mentors through different mechanisms, ranging from the assignment of a formal mentor to the facilitation of connections with informal mentors.
Mentorship specific to teaching development is available from each department’s teaching champion as well as the Associate Dean, Teaching.
Identify and cultivate future leaders
11 staff members from across Engineering participated in leadership programs through the University Organizational and Human Development Office in 2013.
Vision 2015 Progress Report: 2013/14 15
Goal A7: Fully Engage All Faculty Members
Promote a holistic and integrated view of teaching and research and maintain the engagement and contributions of all members of our highly capable professoriate
At its 2014 retreat, the Engineering Planning Committee shared current efforts and known best practices in facilitating responsive workload distributions that recognize, accept and appropriately reward faculty members’ changes in focus over the course of an academic career.
It is anticipated that, with the new administrative support structure in the Dean’s Office, consistent data can be gathered in the coming year from all academic units in order to establish a more complete aggregated picture of current workload distribution among faculty members.
B. Undergraduate Studies This report marks the final plan progress report to be prepared by Prof. Wayne Loucks, who has made a remarkable contribution to Waterloo Engineering over his 16 years as Associate Dean, Undergraduate Studies. In that context, Associate Dean Loucks has prepared this year’s report, including some future recommendations, as a tool to prepare a strong foundation for the next Associate Dean’s success and the ongoing strategic development of this key portfolio.
Over the past decade, our undergraduate enrolment has increased by over 44% (see Figure 90), to a record total of 6,995 students as of November 1, 2013. Despite this increase, the size and quality of our applicant pool continues to steadily increase as noted in Figure 95: in 2013 we reached a record high of 73% of entering students with a final high school average of 90% or higher. Section IV.B of this report provides further measures and key performance indicators about our undergraduate students and programs.
We continue to meet our intake targets and make strong progress on recommendations for improvements to first-year engineering. Work continues toward many of our undergraduate goals that require consensus from multiple stakeholders, often within and outside the Faculty of Engineering. One significant change reflected in this report relates to our goal for limited undergraduate enrolment growth (Goal B1), as we update our intake targets to reflect undergraduate growth plans in biomedical engineering and mechatronics engineering.
Goal B1: Maintain Relatively Stable Undergraduate Intake Targets
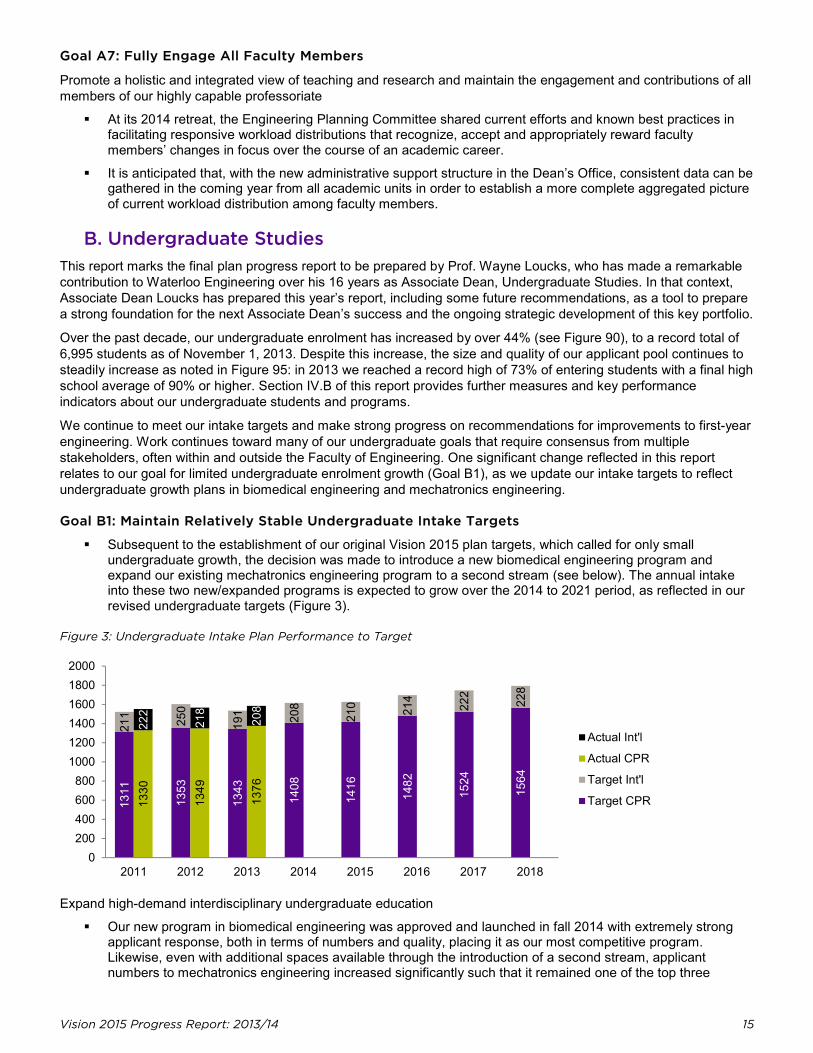
Subsequent to the establishment of our original Vision 2015 plan targets, which called for only small undergraduate growth, the decision was made to introduce a new biomedical engineering program and expand our existing mechatronics engineering program to a second stream (see below). The annual intake into these two new/expanded programs is expected to grow over the 2014 to 2021 period, as reflected in our revised undergraduate targets (Figure 3).
Figure 3: Undergraduate Intake Plan Performance to Target
Expand high-demand interdisciplinary undergraduate education
Our new program in biomedical engineering was approved and launched in fall 2014 with extremely strong applicant response, both in terms of numbers and quality, placing it as our most competitive program. Likewise, even with additional spaces available through the introduction of a second stream, applicant numbers to mechatronics engineering increased significantly such that it remained one of the top three
1311
1353
1343
1408
1416
1482
1524
1564
211 250
191 20
8
210 214
222
228
1330
1349
1376
222
218
208
2011 2012 2013 2014 2015 2016 2017 20180
200400600800
100012001400160018002000
Actual Int'l
Actual CPR
Target Int'l
Target CPR
16 Waterloo Engineering
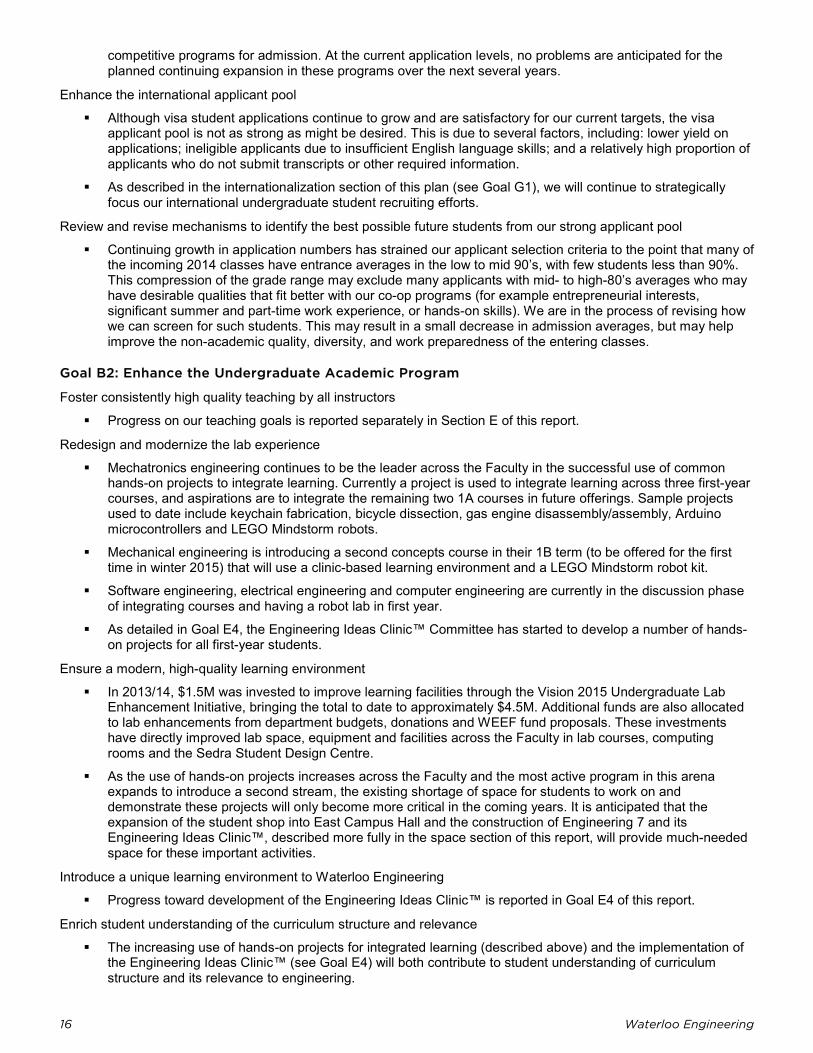
competitive programs for admission. At the current application levels, no problems are anticipated for the planned continuing expansion in these programs over the next several years.
Enhance the international applicant pool
Although visa student applications continue to grow and are satisfactory for our current targets, the visa applicant pool is not as strong as might be desired. This is due to several factors, including: lower yield on applications; ineligible applicants due to insufficient English language skills; and a relatively high proportion of applicants who do not submit transcripts or other required information.
As described in the internationalization section of this plan (see Goal G1), we will continue to strategically focus our international undergraduate student recruiting efforts.
Review and revise mechanisms to identify the best possible future students from our strong applicant pool
Continuing growth in application numbers has strained our applicant selection criteria to the point that many of the incoming 2014 classes have entrance averages in the low to mid 90’s, with few students less than 90%. This compression of the grade range may exclude many applicants with mid- to high-80’s averages who may have desirable qualities that fit better with our co-op programs (for example entrepreneurial interests, significant summer and part-time work experience, or hands-on skills). We are in the process of revising how we can screen for such students. This may result in a small decrease in admission averages, but may help improve the non-academic quality, diversity, and work preparedness of the entering classes.
Goal B2: Enhance the Undergraduate Academic Program
Foster consistently high quality teaching by all instructors
Progress on our teaching goals is reported separately in Section E of this report.
Redesign and modernize the lab experience
Mechatronics engineering continues to be the leader across the Faculty in the successful use of common hands-on projects to integrate learning. Currently a project is used to integrate learning across three first-year courses, and aspirations are to integrate the remaining two 1A courses in future offerings. Sample projects used to date include keychain fabrication, bicycle dissection, gas engine disassembly/assembly, Arduino microcontrollers and LEGO Mindstorm robots.
Mechanical engineering is introducing a second concepts course in their 1B term (to be offered for the first time in winter 2015) that will use a clinic-based learning environment and a LEGO Mindstorm robot kit.
Software engineering, electrical engineering and computer engineering are currently in the discussion phase of integrating courses and having a robot lab in first year.
As detailed in Goal E4, the Engineering Ideas Clinic™ Committee has started to develop a number of hands-on projects for all first-year students.
Ensure a modern, high-quality learning environment
In 2013/14, $1.5M was invested to improve learning facilities through the Vision 2015 Undergraduate Lab Enhancement Initiative, bringing the total to date to approximately $4.5M. Additional funds are also allocated to lab enhancements from department budgets, donations and WEEF fund proposals. These investments have directly improved lab space, equipment and facilities across the Faculty in lab courses, computing rooms and the Sedra Student Design Centre.
As the use of hands-on projects increases across the Faculty and the most active program in this arena expands to introduce a second stream, the existing shortage of space for students to work on and demonstrate these projects will only become more critical in the coming years. It is anticipated that the expansion of the student shop into East Campus Hall and the construction of Engineering 7 and its Engineering Ideas Clinic™, described more fully in the space section of this report, will provide much-needed space for these important activities.
Introduce a unique learning environment to Waterloo Engineering
Progress toward development of the Engineering Ideas Clinic™ is reported in Goal E4 of this report.
Enrich student understanding of the curriculum structure and relevance
The increasing use of hands-on projects for integrated learning (described above) and the implementation of the Engineering Ideas Clinic™ (see Goal E4) will both contribute to student understanding of curriculum structure and its relevance to engineering.
Vision 2015 Progress Report: 2013/14 17
Goal B3: Support the Retention of Undergraduate Students
Enhance first-year student success
The recently-established tutor centre is well used by TAs and students for drop-in help sessions, one-on-one help for students, mini-tutorial sessions and before exam help sessions. In addition to the tutor centre, the WEEF Lab, the rooms at the back of the lab and the corridors outside it are also furnished to serve as places where TAs will help students or where students will go for group or independent study. Significant progress has been made toward reducing student traffic into teaching team offices, but the importance of separating office space and student help areas must continue to be stressed to tutors, TAs and students.
The university skills course (GENE 101) has been co-developed and co-taught by Associate Director of First Year, Bill Owen, and Student Success Office staff over the last four years. This shared responsibility for updating and teaching is likely to continue in the future.
We have begun to analyze data about students who are opting into and out of the reduced load program during their first 1A term and their success rates and term averages in subsequent terms. Early findings from these data include:
- Opt-in rates are typically less than 20%. - Success rates and averages of students who opt in compared to opt out are in the same range. Thus, it is
difficult to definitely say that the program is saving students who would have otherwise been unsuccessful, or that their averages are any higher than those who opt out. More data are needed to follow students after 1B to determine if there is a long-term impact of the reduced load program. This result may also be an indication that we may not yet be attracting the correct group of students to the program.
- Success rate in the second 1A term is a perfect 100% and term averages are high. It is believed that the main contributing reasons for this are that students are in a reduced load from beginning of the term, are in smaller classes, and get personalized attention. The GENE 101 course also tends to increase the term average.
- The success rates of students in the reduced load program are about double that of the QPR program. - Anecdotally, students who opt in appreciate the reduced load program and see its benefits.
A clear process forward on English language support is yet required in the Faculty. In addition to the Vision 2015 objective to address communication skills for engineering students, the University strategic plan has identified a need for communication throughout the curriculum as a major thrust for all programs. The University process is starting by focusing on first-year student needs. Engineering has little will for a common approach at the Faculty level and current plans vary among departments. Ongoing concerns relate to whether non-native English speakers will get the help they need from this varied approach and preparing the Faculty for the anticipated end to the ELPE.
Progress continues on implementation of the recommendations of the Engineering Education for Enduring Success report: Approximately 60% of the 25 recommendations (R6 – R19 and R25) have been completed and implemented and 10 others (R1 - R5, R20 – R24) are partially completed. To date, R5 (modifying the curriculum to promote mastery) and R21 (assigning a full-time lecturer to care for first-year students) have seen minimal progress. Specific areas of progress include:
- Modifying the AIF to provide more insight into applicants (R16): Completed. The scoring rubric on the AIF was revised to emphasize four general attributes: sense of purpose, commitment and engagement, employability and excellence. The impact of the AIF on admission decisions has effectively remained the same, but the way in which the score is calculated has been modified somewhat.
- Integrating life skills into 1A courses (R4): Partially completed. Civil & Environmental Engineering programs do this as part of their concepts course and Electrical & Computer Engineering has initiated this process in a concepts course. The two Associate Directors of First Year visit all programs and give three one-hour lectures on study skills, time management, life balance, exam preparation, exam anxiety, promotion rules and the reduced load program. Workshop attendance by students is voluntary.
- Updating the hiring practice for Engineering Instructional Support Tutors (EIS) to emphasize teaching (R17): Partially completed and ongoing. The two Associate Directors of First Year are now responsible for WEEF TA hiring. For the hiring of the two new EIS Tutors, the applicants were required to give a mini-tutorial or solve a sample problem during interviews.
- Enhancing TA training (R18): Completed and ongoing. Lunchtime sessions are offered by the two Associate Directors of First Year to TAs to improve their marking, proctoring, tutoring, presentation and teaching abilities. The First Year Office started delivering its own version of ExpecTAtions in fall 2013.
18 Waterloo Engineering
The issue of student loading is part of recommendation R23, but as yet very limited related information is available. Attempts have been made by the Director of First Year to obtain expectations from course instructors, but response rates are low and variable. Attempts to poll students informally have resulted in an estimate of 50-60 hours per week, although individual students can vary by a large amount around this mean. An in-depth study on this topic will be useful.
As we approach six years since the publication of the Engineering Education for Enduring Success report it is time to more closely assess our progress and the success and limitations of changes made. It is recommended that the Dean strike a new taskforce to assess first-year opportunities and challenges. This taskforce will provide the next Associate Dean, Undergraduate with a roadmap for possible changes.
Support student success at all levels
Starting in 2014 there has been a refocusing of the Student Success Office to provide support to various Faculty initiatives related to student success. The appointment of a Senior Faculty Relations and Academic Support Specialist with responsibilities including Engineering provides a framework for improved effectiveness and support. It is anticipated that there will be more to report in 2015.
The Engineering First Year Office and the Student Success Office both support (mainly) first-year students in academic courses, life skills issues, time management, and other related areas. The First Year Office, the Director and Associate Directors are very tightly integrated with the students. Currently we direct students towards the Student Success Office when the First Year Office cannot deal with their issues, including English language support and extended help with life skills and time management issues.
In addition to the first-year English language initiative challenges described above, a secondary goal of the University English language initiative is to facilitate support in second- and third-year courses. At this time there are only very tentative steps by some engineering departments to engage other units for communication support after first year.
Goal B4: Improve the Undergraduate Student Experience
Improve service and communications
Preliminary steps have been taken toward the assessment of student traffic and service quality. Short-term traffic studies for first-year advisors counted about 2,000 significant visits in the past year, excluding drop-in visits. Looking ahead, we hope to enable the exchange calendar tracking tool for Engineering Undergraduate Office users. It is anticipated that with this tool and consistent appointment booking by the Engineering Student Services Advisors, we should have better data on traffic intensity. We have not yet identified an effective way to assess service quality as seen by students.
In addition to visits we continue to use generic “Ask Us” email addresses for general questions ([email protected] ), academic support for first-year students ([email protected]) and exchange questions ([email protected]). These addresses allow us to allocate multiple members of our team to the task of providing answers to our students.
Enhance undergraduate processes
The required courses have been developed and approved to facilitate interdisciplinary fourth-year design projects: GENE 403 was offered for the first time in spring 2014 with 13 students from across three programs.
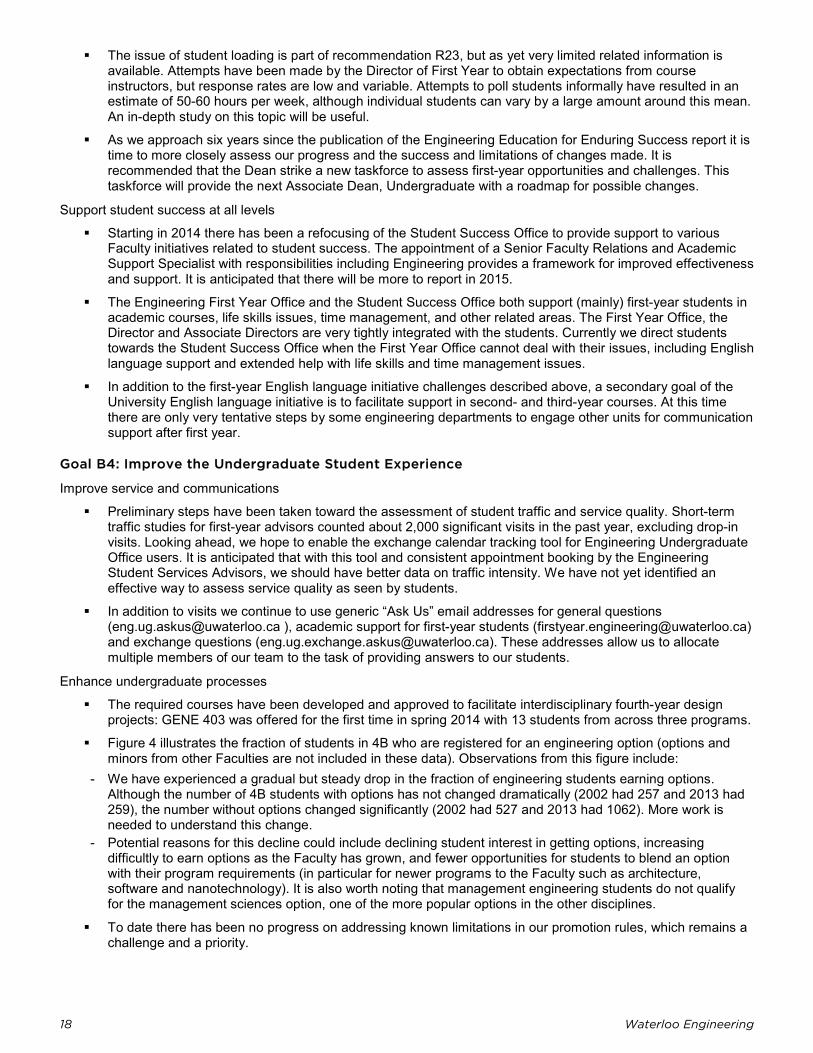
Figure 4 illustrates the fraction of students in 4B who are registered for an engineering option (options and minors from other Faculties are not included in these data). Observations from this figure include:
- We have experienced a gradual but steady drop in the fraction of engineering students earning options. Although the number of 4B students with options has not changed dramatically (2002 had 257 and 2013 had 259), the number without options changed significantly (2002 had 527 and 2013 had 1062). More work is needed to understand this change.
- Potential reasons for this decline could include declining student interest in getting options, increasing difficultly to earn options as the Faculty has grown, and fewer opportunities for students to blend an option with their program requirements (in particular for newer programs to the Faculty such as architecture, software and nanotechnology). It is also worth noting that management engineering students do not qualify for the management sciences option, one of the more popular options in the other disciplines.
To date there has been no progress on addressing known limitations in our promotion rules, which remains a challenge and a priority.
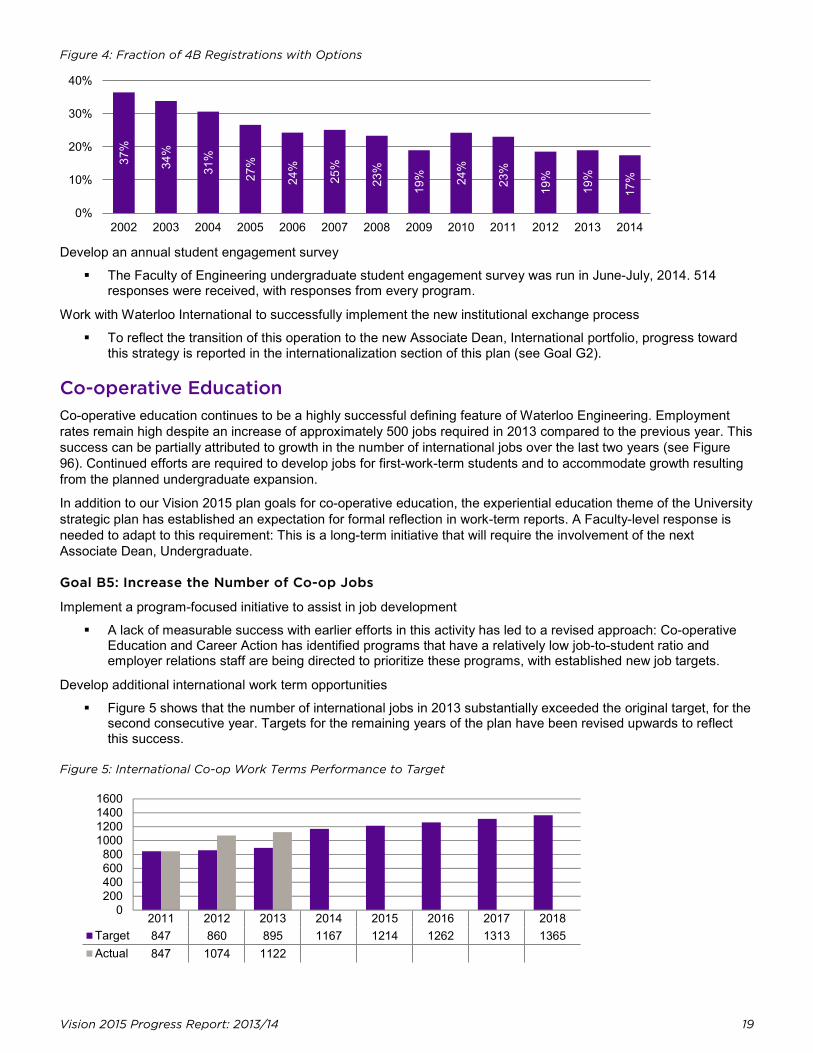
Vision 2015 Progress Report: 2013/14 19
Figure 4: Fraction of 4B Registrations with Options
Develop an annual student engagement survey
The Faculty of Engineering undergraduate student engagement survey was run in June-July, 2014. 514 responses were received, with responses from every program.
Work with Waterloo International to successfully implement the new institutional exchange process
To reflect the transition of this operation to the new Associate Dean, International portfolio, progress toward this strategy is reported in the internationalization section of this plan (see Goal G2).
Co-operative Education Co-operative education continues to be a highly successful defining feature of Waterloo Engineering. Employment rates remain high despite an increase of approximately 500 jobs required in 2013 compared to the previous year. This success can be partially attributed to growth in the number of international jobs over the last two years (see Figure 96). Continued efforts are required to develop jobs for first-work-term students and to accommodate growth resulting from the planned undergraduate expansion.
In addition to our Vision 2015 plan goals for co-operative education, the experiential education theme of the University strategic plan has established an expectation for formal reflection in work-term reports. A Faculty-level response is needed to adapt to this requirement: This is a long-term initiative that will require the involvement of the next Associate Dean, Undergraduate.
Goal B5: Increase the Number of Co-op Jobs
Implement a program-focused initiative to assist in job development
A lack of measurable success with earlier efforts in this activity has led to a revised approach: Co-operative Education and Career Action has identified programs that have a relatively low job-to-student ratio and employer relations staff are being directed to prioritize these programs, with established new job targets.
Develop additional international work term opportunities
Figure 5 shows that the number of international jobs in 2013 substantially exceeded the original target, for the second consecutive year. Targets for the remaining years of the plan have been revised upwards to reflect this success.
Figure 5: International Co-op Work Terms Performance to Target
2011 2012 2013 2014 2015 2016 2017 2018Target 847 860 895 1167 1214 1262 1313 1365Actual 847 1074 1122
37%
34%
31%
27%
24%
25%
23%
19%
24%
23%
19%
19%
17%
0%
10%
20%
30%
40%
2002 2003 2004 2005 2006 2007 2008 2009 2010 2011 2012 2013 2014
0200400600800
1000120014001600
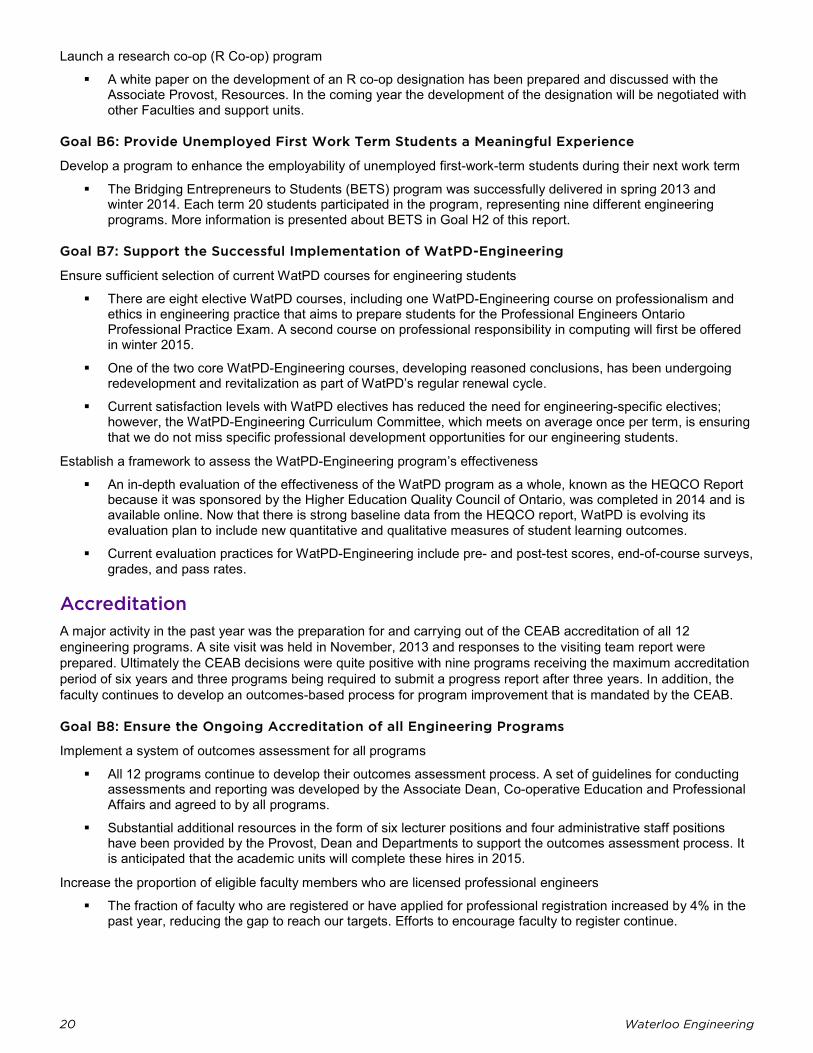
20 Waterloo Engineering
Launch a research co-op (R Co-op) program
A white paper on the development of an R co-op designation has been prepared and discussed with the Associate Provost, Resources. In the coming year the development of the designation will be negotiated with other Faculties and support units.
Goal B6: Provide Unemployed First Work Term Students a Meaningful Experience
Develop a program to enhance the employability of unemployed first-work-term students during their next work term
The Bridging Entrepreneurs to Students (BETS) program was successfully delivered in spring 2013 and winter 2014. Each term 20 students participated in the program, representing nine different engineering programs. More information is presented about BETS in Goal H2 of this report.
Goal B7: Support the Successful Implementation of WatPD-Engineering
Ensure sufficient selection of current WatPD courses for engineering students
There are eight elective WatPD courses, including one WatPD-Engineering course on professionalism and ethics in engineering practice that aims to prepare students for the Professional Engineers Ontario Professional Practice Exam. A second course on professional responsibility in computing will first be offered in winter 2015.
One of the two core WatPD-Engineering courses, developing reasoned conclusions, has been undergoing redevelopment and revitalization as part of WatPD’s regular renewal cycle.
Current satisfaction levels with WatPD electives has reduced the need for engineering-specific electives; however, the WatPD-Engineering Curriculum Committee, which meets on average once per term, is ensuring that we do not miss specific professional development opportunities for our engineering students.
Establish a framework to assess the WatPD-Engineering program’s effectiveness
An in-depth evaluation of the effectiveness of the WatPD program as a whole, known as the HEQCO Report because it was sponsored by the Higher Education Quality Council of Ontario, was completed in 2014 and is available online. Now that there is strong baseline data from the HEQCO report, WatPD is evolving its evaluation plan to include new quantitative and qualitative measures of student learning outcomes.
Current evaluation practices for WatPD-Engineering include pre- and post-test scores, end-of-course surveys, grades, and pass rates.
Accreditation A major activity in the past year was the preparation for and carrying out of the CEAB accreditation of all 12 engineering programs. A site visit was held in November, 2013 and responses to the visiting team report were prepared. Ultimately the CEAB decisions were quite positive with nine programs receiving the maximum accreditation period of six years and three programs being required to submit a progress report after three years. In addition, the faculty continues to develop an outcomes-based process for program improvement that is mandated by the CEAB.
Goal B8: Ensure the Ongoing Accreditation of all Engineering Programs
Implement a system of outcomes assessment for all programs
All 12 programs continue to develop their outcomes assessment process. A set of guidelines for conducting assessments and reporting was developed by the Associate Dean, Co-operative Education and Professional Affairs and agreed to by all programs.
Substantial additional resources in the form of six lecturer positions and four administrative staff positions have been provided by the Provost, Dean and Departments to support the outcomes assessment process. It is anticipated that the academic units will complete these hires in 2015.
Increase the proportion of eligible faculty members who are licensed professional engineers
The fraction of faculty who are registered or have applied for professional registration increased by 4% in the past year, reducing the gap to reach our targets. Efforts to encourage faculty to register continue.
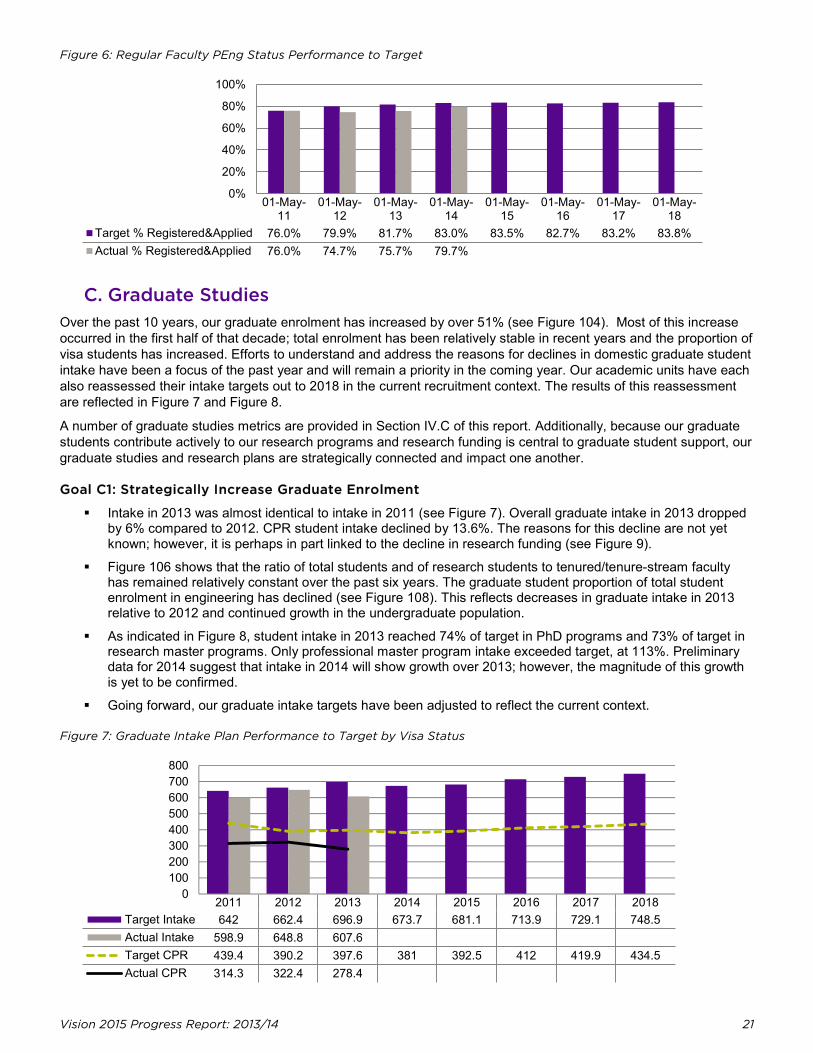
Vision 2015 Progress Report: 2013/14 21
0%
20%
40%
60%
80%
100%
800700600500400300200100
0
Figure 6: Regular Faculty PEng Status Performance to Target
01-May-11
01-May-12
01-May-13
01-May-14
01-May-15
01-May-16
01-May-17
01-May-18
Target % Registered&Applied 76.0% 79.9% 81.7% 83.0% 83.5% 82.7% 83.2% 83.8%Actual % Registered&Applied 76.0% 74.7% 75.7% 79.7%
C. Graduate Studies Over the past 10 years, our graduate enrolment has increased by over 51% (see Figure 104). Most of this increase occurred in the first half of that decade; total enrolment has been relatively stable in recent years and the proportion of visa students has increased. Efforts to understand and address the reasons for declines in domestic graduate student intake have been a focus of the past year and will remain a priority in the coming year. Our academic units have each also reassessed their intake targets out to 2018 in the current recruitment context. The results of this reassessment are reflected in Figure 7 and Figure 8.
A number of graduate studies metrics are provided in Section IV.C of this report. Additionally, because our graduate students contribute actively to our research programs and research funding is central to graduate student support, our graduate studies and research plans are strategically connected and impact one another.
Goal C1: Strategically Increase Graduate Enrolment
Intake in 2013 was almost identical to intake in 2011 (see Figure 7). Overall graduate intake in 2013 dropped by 6% compared to 2012. CPR student intake declined by 13.6%. The reasons for this decline are not yet known; however, it is perhaps in part linked to the decline in research funding (see Figure 9).
Figure 106 shows that the ratio of total students and of research students to tenured/tenure-stream faculty has remained relatively constant over the past six years. The graduate student proportion of total student enrolment in engineering has declined (see Figure 108). This reflects decreases in graduate intake in 2013 relative to 2012 and continued growth in the undergraduate population.
As indicated in Figure 8, student intake in 2013 reached 74% of target in PhD programs and 73% of target in research master programs. Only professional master program intake exceeded target, at 113%. Preliminary data for 2014 suggest that intake in 2014 will show growth over 2013; however, the magnitude of this growth is yet to be confirmed.
Going forward, our graduate intake targets have been adjusted to reflect the current context.
Figure 7: Graduate Intake Plan Performance to Target by Visa Status
2011 2012 2013 2014 2015 2016 2017 2018Target Intake 642 662.4 696.9 673.7 681.1 713.9 729.1 748.5Actual Intake 598.9 648.8 607.6Target CPR 439.4 390.2 397.6 381 392.5 412 419.9 434.5Actual CPR 314.3 322.4 278.4
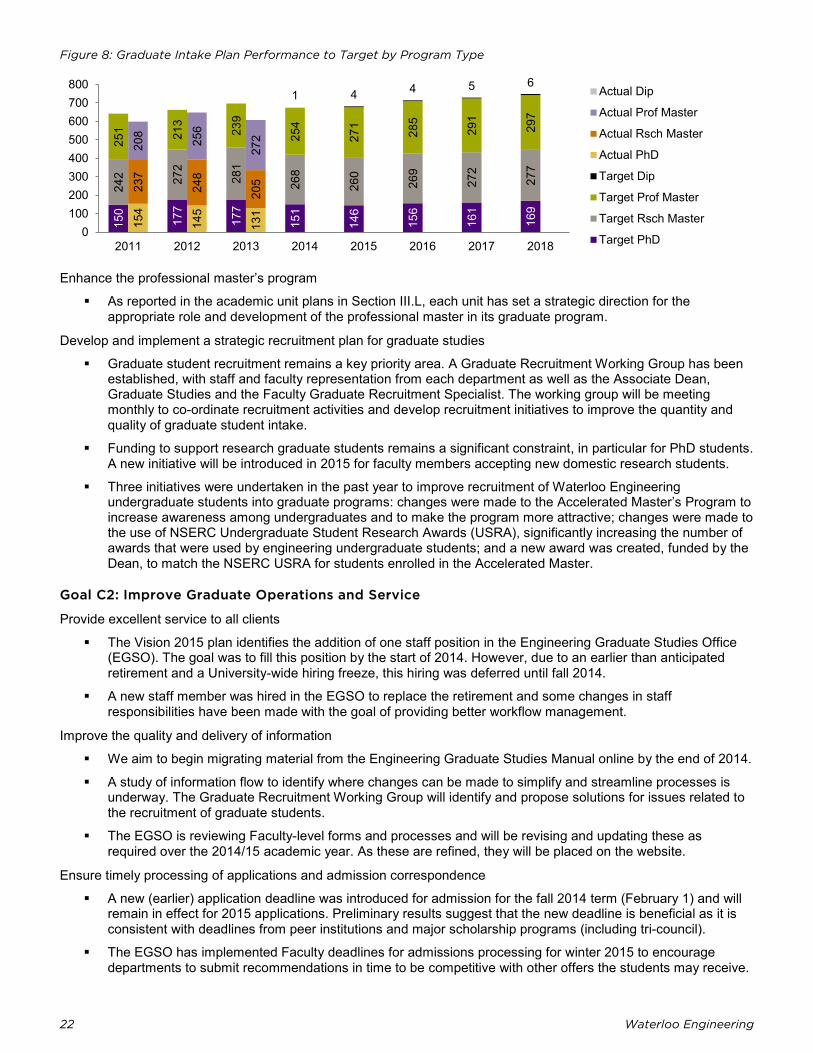
22 Waterloo Engineering
Figure 8: Graduate Intake Plan Performance to Target by Program Type
Enhance the professional master’s program
As reported in the academic unit plans in Section III.L, each unit has set a strategic direction for the appropriate role and development of the professional master in its graduate program.
Develop and implement a strategic recruitment plan for graduate studies
Graduate student recruitment remains a key priority area. A Graduate Recruitment Working Group has been established, with staff and faculty representation from each department as well as the Associate Dean, Graduate Studies and the Faculty Graduate Recruitment Specialist. The working group will be meeting monthly to co-ordinate recruitment activities and develop recruitment initiatives to improve the quantity and quality of graduate student intake.
Funding to support research graduate students remains a significant constraint, in particular for PhD students. A new initiative will be introduced in 2015 for faculty members accepting new domestic research students.
Three initiatives were undertaken in the past year to improve recruitment of Waterloo Engineering undergraduate students into graduate programs: changes were made to the Accelerated Master’s Program to increase awareness among undergraduates and to make the program more attractive; changes were made to the use of NSERC Undergraduate Student Research Awards (USRA), significantly increasing the number of awards that were used by engineering undergraduate students; and a new award was created, funded by the Dean, to match the NSERC USRA for students enrolled in the Accelerated Master.
Goal C2: Improve Graduate Operations and Service
Provide excellent service to all clients
The Vision 2015 plan identifies the addition of one staff position in the Engineering Graduate Studies Office (EGSO). The goal was to fill this position by the start of 2014. However, due to an earlier than anticipated retirement and a University-wide hiring freeze, this hiring was deferred until fall 2014.
A new staff member was hired in the EGSO to replace the retirement and some changes in staff responsibilities have been made with the goal of providing better workflow management.
Improve the quality and delivery of information
We aim to begin migrating material from the Engineering Graduate Studies Manual online by the end of 2014.
A study of information flow to identify where changes can be made to simplify and streamline processes is underway. The Graduate Recruitment Working Group will identify and propose solutions for issues related to the recruitment of graduate students.
The EGSO is reviewing Faculty-level forms and processes and will be revising and updating these as required over the 2014/15 academic year. As these are refined, they will be placed on the website.
Ensure timely processing of applications and admission correspondence
A new (earlier) application deadline was introduced for admission for the fall 2014 term (February 1) and will remain in effect for 2015 applications. Preliminary results suggest that the new deadline is beneficial as it is consistent with deadlines from peer institutions and major scholarship programs (including tri-council).
The EGSO has implemented Faculty deadlines for admissions processing for winter 2015 to encourage departments to submit recommendations in time to be competitive with other offers the students may receive.
150
177
177
151
146
156
161
169
242 27
2
281
268
260
269
272
277
251 21
3
239
254
271
285
291
297
1 4 4 5 6
154
145
131
237
248
205
208
256
272
2011 2012 2013 2014 2015 2016 2017 20180
100200300400500600700800 Actual Dip
Actual Prof Master
Actual Rsch Master
Actual PhD
Target Dip
Target Prof Master
Target Rsch Master
Target PhD
Vision 2015 Progress Report: 2013/14 23
The EGSO will continue to work to improve communications and co-ordination with departments about application deadlines and requirements and about admissions processing times.
Develop an effective and efficient strategy for managing cases of academic discipline and grievances
Efforts to develop effective and efficient procedures to manage Policy 71 (Student Discipline) and Policy 70 (Petitions and Grievances) cases involving our graduate students have begun by involving the Academic Integrity Co-ordinator for the Faculty of Engineering in cases involving graduate students.
Goal C3: Improve the Graduate Program
Foster consistently high quality graduate student supervision
Engineering faculty members, in particular new faculty members, have been made aware of the University Graduate Studies Office’s online guide for graduate research and supervision.
Revisions have been proposed to the regulations concerning Approved Doctoral Dissertation Supervisors (ADDS), including changes to the range of methods by which faculty members may demonstrate they have met the requirements for ADDS approval. One of these new methods is successfully completing a workshop, being developed by the University Graduate Studies Office, addressing the roles and responsibilities of the faculty supervisor and the graduate student and related University regulations and policies.
The need for an Engineering-specific expectation document and faculty information sessions related to graduate student supervision will be re-assessed after the University level workshop has been developed and the proposed ADDS regulation has received final approval.
The Waterloo Engineering Award of Excellence in Graduate Student Supervision is yet to be established.
Improve graduate course offerings
The range of graduate course offerings has continued to improve through the introduction of new courses and the modification or renewal of others. The level of improvement does not appear to be uniform across departments.
The Associate Dean, Graduate Studies will continue to work with departments to seek ways to increase the number of graduate courses offered; to minimize duplication of courses offered by different departments; and to review courses, particularly those with consistently low enrolments, for relevance.
Increase the academic rigour of graduate programs
The Electrical & Computer Engineering Department is embarking on changing its PhD comprehensive exam format. Related discussions will take place with other departments in fall 2014.
The EGSO has begun to more strictly enforce existing requirements for program limit extensions and comprehensive exam time limit extensions.
Improve the quality of students admitted to graduate programs
Discussions are continuing with academic units and the Graduate Recruitment Working Group on how best to continue to improve the quality of students admitted to the graduate programs.
Goal C4: Enhance the Graduate Student Experience
Evaluate current graduate student funding
The actual level of funding that Waterloo Engineering research graduate students receive (which is typically much higher than the guaranteed minimum level) is now being used in marketing and recruitment efforts.
Strategies to improve the level of funding (including incentives for recruiting) for domestic PhD students are being developed and will be in place for the 2015 admission cycle.
Attend to graduate student space needs
Departments have continued to be active in increasing the amount and quality of space dedicated for graduate student offices.
Place constraints on the number of graduate courses in which a student can simultaneously enrol
A solution has been implemented within Quest and appears to be working well.
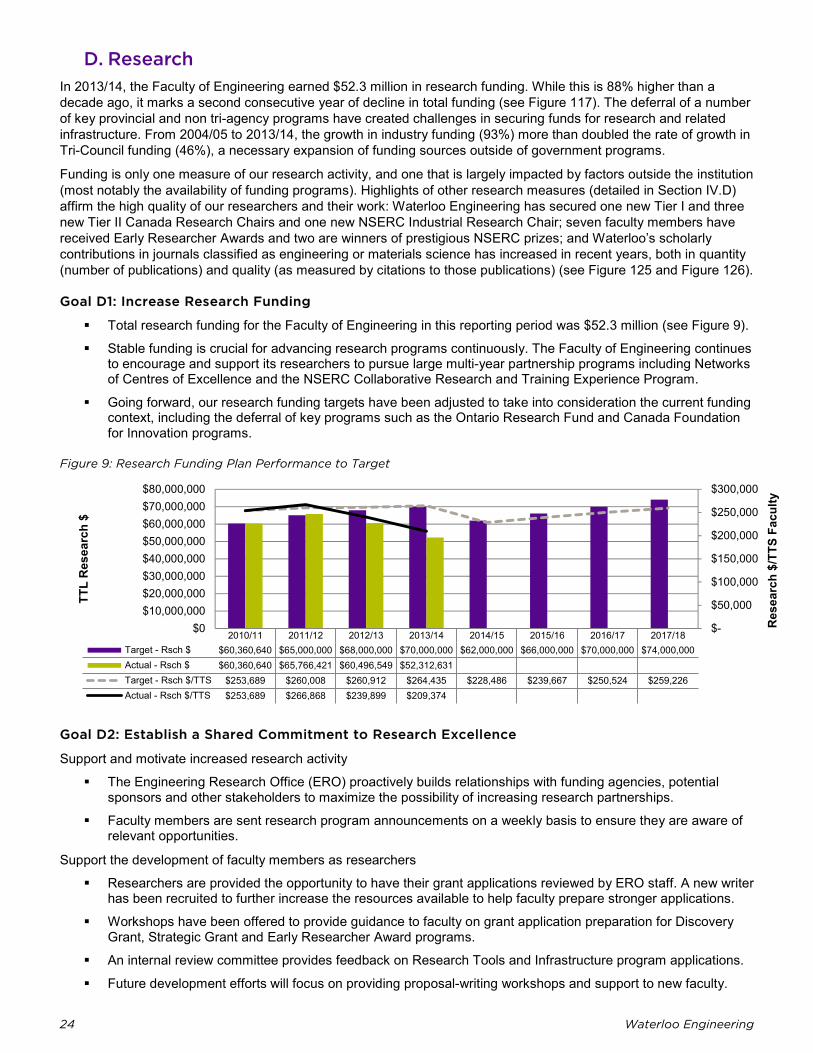
24 Waterloo Engineering
$-
$50,000
$100,000
$150,000
$200,000
$250,000
$300,000
$0$10,000,000$20,000,000$30,000,000$40,000,000$50,000,000$60,000,000$70,000,000$80,000,000
Res
earc
h $/
TTS
Facu
lty
TTL
Res
earc
h $
D. Research In 2013/14, the Faculty of Engineering earned $52.3 million in research funding. While this is 88% higher than a decade ago, it marks a second consecutive year of decline in total funding (see Figure 117). The deferral of a number of key provincial and non tri-agency programs have created challenges in securing funds for research and related infrastructure. From 2004/05 to 2013/14, the growth in industry funding (93%) more than doubled the rate of growth in Tri-Council funding (46%), a necessary expansion of funding sources outside of government programs.
Funding is only one measure of our research activity, and one that is largely impacted by factors outside the institution (most notably the availability of funding programs). Highlights of other research measures (detailed in Section IV.D) affirm the high quality of our researchers and their work: Waterloo Engineering has secured one new Tier I and three new Tier II Canada Research Chairs and one new NSERC Industrial Research Chair; seven faculty members have received Early Researcher Awards and two are winners of prestigious NSERC prizes; and Waterloo’s scholarly contributions in journals classified as engineering or materials science has increased in recent years, both in quantity (number of publications) and quality (as measured by citations to those publications) (see Figure 125 and Figure 126).
Goal D1: Increase Research Funding
Total research funding for the Faculty of Engineering in this reporting period was $52.3 million (see Figure 9).
Stable funding is crucial for advancing research programs continuously. The Faculty of Engineering continues to encourage and support its researchers to pursue large multi-year partnership programs including Networks of Centres of Excellence and the NSERC Collaborative Research and Training Experience Program.
Going forward, our research funding targets have been adjusted to take into consideration the current funding context, including the deferral of key programs such as the Ontario Research Fund and Canada Foundation for Innovation programs.
Figure 9: Research Funding Plan Performance to Target
2010/11 2011/12 2012/13 2013/14 2014/15 2015/16 2016/17 2017/18Target - Rsch $ $60,360,640 $65,000,000 $68,000,000 $70,000,000 $62,000,000 $66,000,000 $70,000,000 $74,000,000Actual - Rsch $ $60,360,640 $65,766,421 $60,496,549 $52,312,631Target - Rsch $/TTS $253,689 $260,008 $260,912 $264,435 $228,486 $239,667 $250,524 $259,226Actual - Rsch $/TTS $253,689 $266,868 $239,899 $209,374
Goal D2: Establish a Shared Commitment to Research Excellence
Support and motivate increased research activity
The Engineering Research Office (ERO) proactively builds relationships with funding agencies, potential sponsors and other stakeholders to maximize the possibility of increasing research partnerships.
Faculty members are sent research program announcements on a weekly basis to ensure they are aware of relevant opportunities.
Support the development of faculty members as researchers
Researchers are provided the opportunity to have their grant applications reviewed by ERO staff. A new writer has been recruited to further increase the resources available to help faculty prepare stronger applications.
Workshops have been offered to provide guidance to faculty on grant application preparation for Discovery Grant, Strategic Grant and Early Researcher Award programs.
An internal review committee provides feedback on Research Tools and Infrastructure program applications.
Future development efforts will focus on providing proposal-writing workshops and support to new faculty.
Vision 2015 Progress Report: 2013/14 25
Develop stronger ties with industry
The ERO routinely holds meetings with large and small companies to discuss industrial challenges that can be addressed through research, and actively collaborates with the University’s Industry Liaison Officers and Centre for Career Action to raise awareness and visibility of our research strengths.
Waterloo Engineering research is shared with broader audiences through conferences such as OCE Discovery, Waterloo Innovation Summit and Communitech Tech Leadership.
A database of faculty members’ research applications has significantly improved staff ability to identify researcher expertise that is relevant to a company’s needs. A goal for the coming year is to link external-facing websites to the appropriate internal databases in order to further improve potential industry partners’ ability to find relevant researchers.
Partner with a targeted set of leading global universities
Implementation of this strategy is reported in Goal G3 of the internationalization section of this report.
Goal D3: Eliminate Barriers to Research Success
Enable a culture of collaboration and co-operation
The Faculty of Engineering is home to a number of research institutes and centres, such as the Waterloo Centre for Automotive Research, where researchers from various disciplines collaborate.
In our identified areas of research strength, the ERO will foster strong interdisciplinary research, collaborating with academic units to seek external partnerships and identify funding opportunities.
Improve client service
The ERO has provided assistance for engineering researchers completing the new Common CV system. Feedback from professors who utilized this service was very positive.
Staff in the ERO provide service directly to researchers through grant application review services, technical writing support for large initiatives, and assistance organizing site visits for major funding programs.
Attendance at research-focused workshops and events is tracked, and participant feedback is solicited to gauge how their format, frequency or content can be improved over time.
Improve the efficacy of communications
Weekly emails notify faculty members of potential funding opportunities, information sessions, webinars, etc.
A priority for the coming year is to create a SharePoint site where faculty can find important forms and information for upcoming funding opportunities.
Goal D4: Celebrate Research Excellence
Recognize research excellence
As noted in Goal A5, the Engineering Awards and Honours Committee has been meeting on a regular schedule since fall 2013 and is now professionally supported by an ERO technical writer. This new model has proven very successful, as evidenced in many significant recognitions earned in 2013/ 2014, including:
- Prof. John McPhee has received a Tier I Canada Research Chair and, together with industry partners Toyota Motor Manufacturing and MapleSoft, received an NSERC Synergy Award for Innovation.
- Prof. Zhou Wang was awarded the prestigious NSERC E.W.R. Steacie Award. - Tier II Canada Research Chairs have been awarded to Prof. Hossein Abouee Mehrizi, Prof. Sriram
Narasimhan and Prof. Alex Wong. - Prof. Adrian Gerlich has been named the NSERC/TransCanada Industrial Research Chair in Welding. - Prof. Catherine Rosenberg was named a fellow of the Canadian Academy of Engineering. - Prof. Amir Khajepour was awarded the Professional Engineers of Ontario Engineering Medal for Research
and Development. - Profs. Nandita Basu, Sebastian Fischmeister, Frank Gu, Dana Kulic, Sean Peterson, Christopher Wilson and
Aiping Yu received Early Researcher Awards. - Profs. Susan Tighe and Chris Eliasmith are among the inaugural members of the Royal Society of Canada's
College of New Scholars.
26 Waterloo Engineering
Prof. Safieddin Safavi-Naeini earned the Faculty of Engineering’s En-hui Yang Engineering Research Innovation Award for 2014 and the Waterloo Engineering Research Excellence Award was awarded to Profs. Bo Cui, Eihab Abdel-Rahman and Magdy Salama.
Increase public awareness of research strengths and achievements
Waterloo Engineering research stories are being featured on institutional social media channels, including Facebook and Twitter. Our researchers have been featured in internal and external media more than 24 times in the past year. Additionally, Engineering has been contacted numerous times by national media to request comment from research experts on topical news stories.
A number of events in 2013/14 served an important role in communicating our research: - The annual WE Innovate event provided an opportunity for graduate students and faculty to display their
research through posters and demonstrations to local high school students and companies. - Researchers and industry partners were brought together at an NSERC-sponsored event on information
security featuring Engineering faculty speakers. - Science and Engineering jointly hosted an event focused on the topic of sensors and devices, featuring
several Engineering speakers and posters. - The Waterloo Innovation Summit included Engineering faculty speakers and several startup companies
founded by our alumni.
The ERO participates in the monthly Engineering Communications Council meeting which facilitates information sharing about events and marketing initiatives and provides an opportunity to encourage academic units and centres to promote their research.
Goal D5: Strategically Identify and Assess Research Strengths
Over the past year, the Dean of Engineering, Associate Dean for Research, Engineering Planning Committee and ERO staff worked to identify a number of broad research themes and specific technology areas that will be used to inform our strategic research thrusts. These topics are anticipated to have significant global impact and offer many opportunities that align with Waterloo Engineering strengths. Selected themes include:
- uniting the digital universe, with focus on 5G wireless technologies - machine intelligence including applications to manufacturing - powering economies with focus on energy storage - advancing the human condition through connected infrastructure, bioengineering, healthcare and water
technologies
An exercise will be undertaken within the Faculty to map researcher expertise to these areas. Opportunities to apply to major funding programs will be strategically pursued where we have a critical mass of alignment between research strengths and a program’s goals.
In order to assess our identified areas of distinguishing research excellence, metrics such as faculty research grants and chairs in related areas will be developed and tracked annually.
E. Teaching Significant progress on our teaching goals was made throughout 2013, which marked the first complete calendar year of operation for the new teaching portfolio in the Faculty of Engineering. Notably, by the end of 2013 regular operational activities had been established and implemented in support of all four of our strategic teaching goals.
Goal E1: Enhance Support for Teaching at the Faculty Level
Develop and foster a community comprised of department representatives dedicated to teaching
The Engineering Teaching Development Committee, comprised of representatives who champion teaching in every academic unit (except, currently, the School of Architecture), the Associate Dean, Teaching and the Assistant to the Associate Dean, Teaching, was formed and began holding regular monthly meetings in 2013.
Initial projects for this group included: - developing experience in, and a template for, peer review of teaching for evaluation of new hires, for
formative feedback to colleagues, and for reporting in tenure and promotion files - building awareness of activities and resources for teaching development in the Faculty and the University
Vision 2015 Progress Report: 2013/14 27
Goal E2: Contribute to the Development of Faculty Members and TAs as Teachers
Establish minimum teaching development expectations for all new faculty members
Since March, 2012 all appointment letters for regular faculty positions contain an explicit statement on the importance of our teaching mandate and the expectation that all new faculty will develop a plan for learning about teaching. Those without equivalent experience must complete four workshops offered by the Centre for Teaching Excellence (CTE).
In fall 2013 the Associate Dean, Teaching started meeting with all new faculty members to review their incoming teaching background, and to discuss plans and resources for teaching development.
A written statement of the expectations for adequate teaching in the Faculty of Engineering has been developed for use when inadequate teaching is recognized.
In support of the 2013 annual faculty performance review process, academic unit heads were provided distributions and other aggregate data from the course evaluation scores for courses offered by their unit.
Promote opportunities for all instructors to learn more about teaching over their career
A number of development opportunities were facilitated for, or promoted to, instructors in Engineering in 2013: - 8 instructors participated in the Instructional Skills Workshop (two sessions of which were facilitated or co-
facilitated by the Associate Dean, Teaching) - 24 instructors participated in a workshop offered by the Associate Dean, Teaching on engaging student
attention in large classes - 30 instructors participated in the annual teaching conference, Opportunities and New Directions - Four instructors participated in the 2013 Teaching Excellence Academy (TEA) workshop - Five workshops on special topics were developed and offered by the Associate Dean, Teaching in 2013;
however, to focus on priority work related to Goal E1 these were discontinued in 2014
Material was developed on the teaching criteria for tenure and promotion and how these criteria can be documented, for presentation at an informal lunch meeting for pre-tenure faculty in early 2014.
Engineering Teaching Development community pages are maintained in LEARN to provide interested instructors access to teaching resources (76 instructors are currently enrolled in these pages).
The TA training workshop, ExpecTAtions, was maintained and reviewed in 2013. We developed a plan with the offices for Academic Integrity, Safety, and Conflict Management & Human Rights to deliver online modules for TAs on academic integrity, ethical behaviour and safety, and tested a prototype model for a revised workshop with the First Year Office.
Provide mentorship in teaching
Teaching mentorship is encouraged through the teaching champion in each unit and is further supported as needed by the Associate Dean, Teaching.
Goal E3: Affirm the Importance of Teaching
Include an assessment of teaching potential when hiring new faculty
As noted in Goal E1, development of skills and tools for peer teaching assessment is a current Engineering Teaching Development Committee priority. Additionally, support has been provided directly to some departmental hiring committees through “live” training sessions.
Measure teaching quality and outcomes for individual and institutional improvement
Work progressed throughout 2013 to maintain and improve the student course evaluation process: - with EngSoc representatives, streamlined the process for efficiency, reliability and use of volunteer time - analyzed and communicated aggregate properties of summary grades from the evaluations - revised the web portal to the database to ensure that users are aware of key aggregate properties (means,
85th percentile and 15th percentile) of the accumulated data - developed a standard reporting for course evaluation scores in tenure and promotion presentations, including
standard aggregate properties for all courses in each unit
In 2013 we completed a review of existing student exit surveys across the Faculty, setting the foundation for progress throughout 2014 toward implementing a Faculty-wide exit survey with a set of common questions.
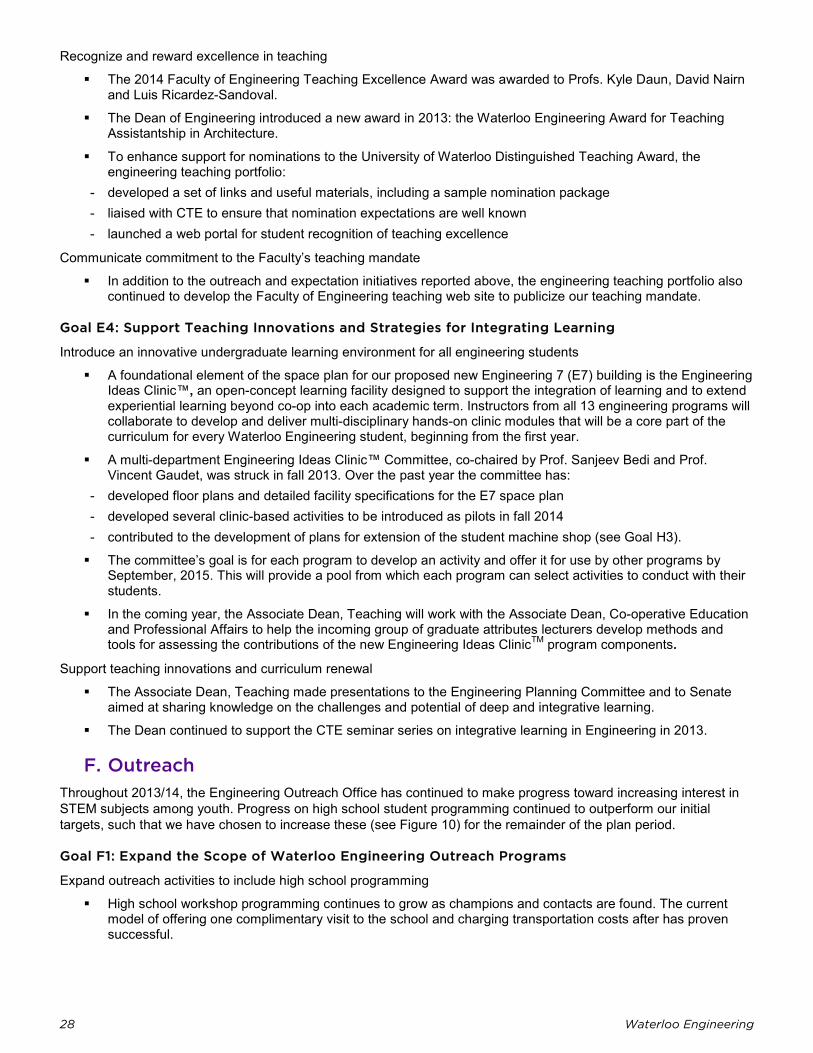
28 Waterloo Engineering
Recognize and reward excellence in teaching
The 2014 Faculty of Engineering Teaching Excellence Award was awarded to Profs. Kyle Daun, David Nairn and Luis Ricardez-Sandoval.
The Dean of Engineering introduced a new award in 2013: the Waterloo Engineering Award for Teaching Assistantship in Architecture.
To enhance support for nominations to the University of Waterloo Distinguished Teaching Award, the engineering teaching portfolio:
- developed a set of links and useful materials, including a sample nomination package - liaised with CTE to ensure that nomination expectations are well known - launched a web portal for student recognition of teaching excellence
Communicate commitment to the Faculty’s teaching mandate
In addition to the outreach and expectation initiatives reported above, the engineering teaching portfolio also continued to develop the Faculty of Engineering teaching web site to publicize our teaching mandate.
Goal E4: Support Teaching Innovations and Strategies for Integrating Learning
Introduce an innovative undergraduate learning environment for all engineering students
A foundational element of the space plan for our proposed new Engineering 7 (E7) building is the Engineering Ideas Clinic™, an open-concept learning facility designed to support the integration of learning and to extend experiential learning beyond co-op into each academic term. Instructors from all 13 engineering programs will collaborate to develop and deliver multi-disciplinary hands-on clinic modules that will be a core part of the curriculum for every Waterloo Engineering student, beginning from the first year.
A multi-department Engineering Ideas Clinic™ Committee, co-chaired by Prof. Sanjeev Bedi and Prof. Vincent Gaudet, was struck in fall 2013. Over the past year the committee has:
- developed floor plans and detailed facility specifications for the E7 space plan - developed several clinic-based activities to be introduced as pilots in fall 2014 - contributed to the development of plans for extension of the student machine shop (see Goal H3).
The committee’s goal is for each program to develop an activity and offer it for use by other programs by September, 2015. This will provide a pool from which each program can select activities to conduct with their students.
In the coming year, the Associate Dean, Teaching will work with the Associate Dean, Co-operative Education and Professional Affairs to help the incoming group of graduate attributes lecturers develop methods and tools for assessing the contributions of the new Engineering Ideas ClinicTM program components.
Support teaching innovations and curriculum renewal
The Associate Dean, Teaching made presentations to the Engineering Planning Committee and to Senate aimed at sharing knowledge on the challenges and potential of deep and integrative learning.
The Dean continued to support the CTE seminar series on integrative learning in Engineering in 2013.
F. Outreach Throughout 2013/14, the Engineering Outreach Office has continued to make progress toward increasing interest in STEM subjects among youth. Progress on high school student programming continued to outperform our initial targets, such that we have chosen to increase these (see Figure 10) for the remainder of the plan period.
Goal F1: Expand the Scope of Waterloo Engineering Outreach Programs
Expand outreach activities to include high school programming
High school workshop programming continues to grow as champions and contacts are found. The current model of offering one complimentary visit to the school and charging transportation costs after has proven successful.
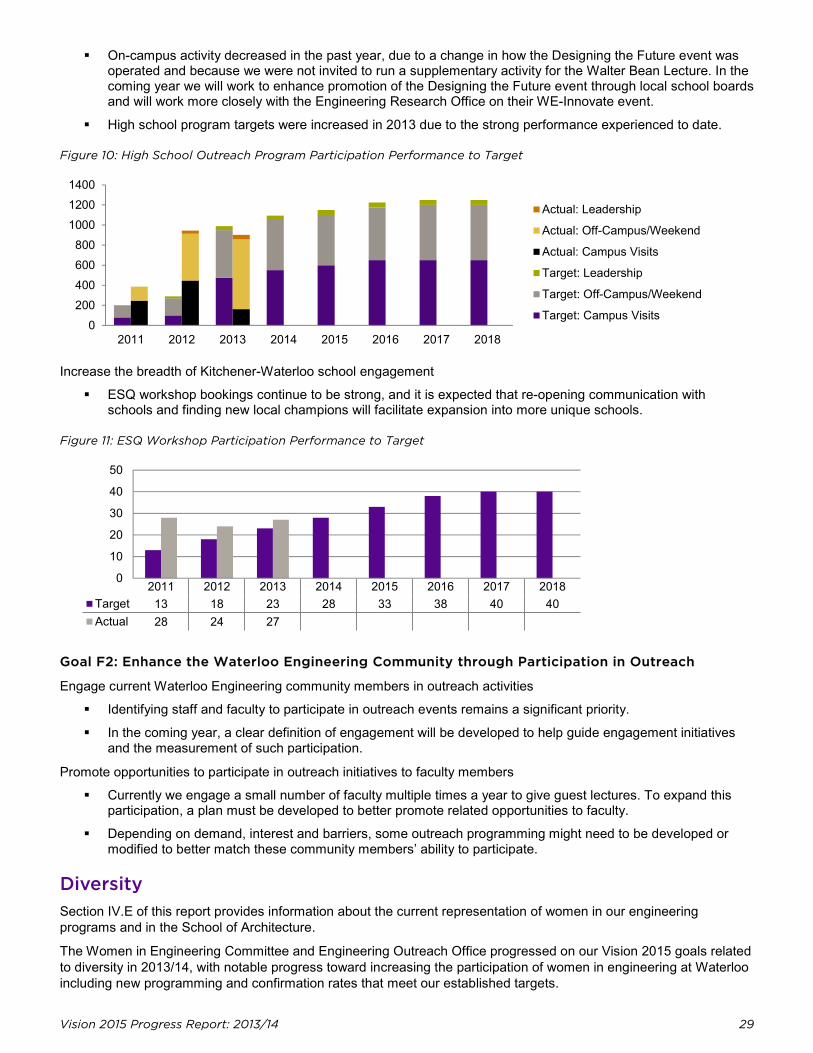
Vision 2015 Progress Report: 2013/14 29
On-campus activity decreased in the past year, due to a change in how the Designing the Future event was operated and because we were not invited to run a supplementary activity for the Walter Bean Lecture. In the coming year we will work to enhance promotion of the Designing the Future event through local school boards and will work more closely with the Engineering Research Office on their WE-Innovate event.
High school program targets were increased in 2013 due to the strong performance experienced to date.
Figure 10: High School Outreach Program Participation Performance to Target
Increase the breadth of Kitchener-Waterloo school engagement
ESQ workshop bookings continue to be strong, and it is expected that re-opening communication with schools and finding new local champions will facilitate expansion into more unique schools.
Figure 11: ESQ Workshop Participation Performance to Target
2011 2012 2013 2014 2015 2016 2017 2018Target 13 18 23 28 33 38 40 40Actual 28 24 27
Goal F2: Enhance the Waterloo Engineering Community through Participation in Outreach
Engage current Waterloo Engineering community members in outreach activities
Identifying staff and faculty to participate in outreach events remains a significant priority.
In the coming year, a clear definition of engagement will be developed to help guide engagement initiatives and the measurement of such participation.
Promote opportunities to participate in outreach initiatives to faculty members
Currently we engage a small number of faculty multiple times a year to give guest lectures. To expand this participation, a plan must be developed to better promote related opportunities to faculty.
Depending on demand, interest and barriers, some outreach programming might need to be developed or modified to better match these community members’ ability to participate.
Diversity Section IV.E of this report provides information about the current representation of women in our engineering programs and in the School of Architecture.
The Women in Engineering Committee and Engineering Outreach Office progressed on our Vision 2015 goals related to diversity in 2013/14, with notable progress toward increasing the participation of women in engineering at Waterloo including new programming and confirmation rates that meet our established targets.
2011 2012 2013 2014 2015 2016 2017 20180
200400600800
100012001400
Actual: Leadership
Actual: Off-Campus/Weekend
Actual: Campus Visits
Target: Leadership
Target: Off-Campus/Weekend
Target: Campus Visits
0
10
20
30
40
50
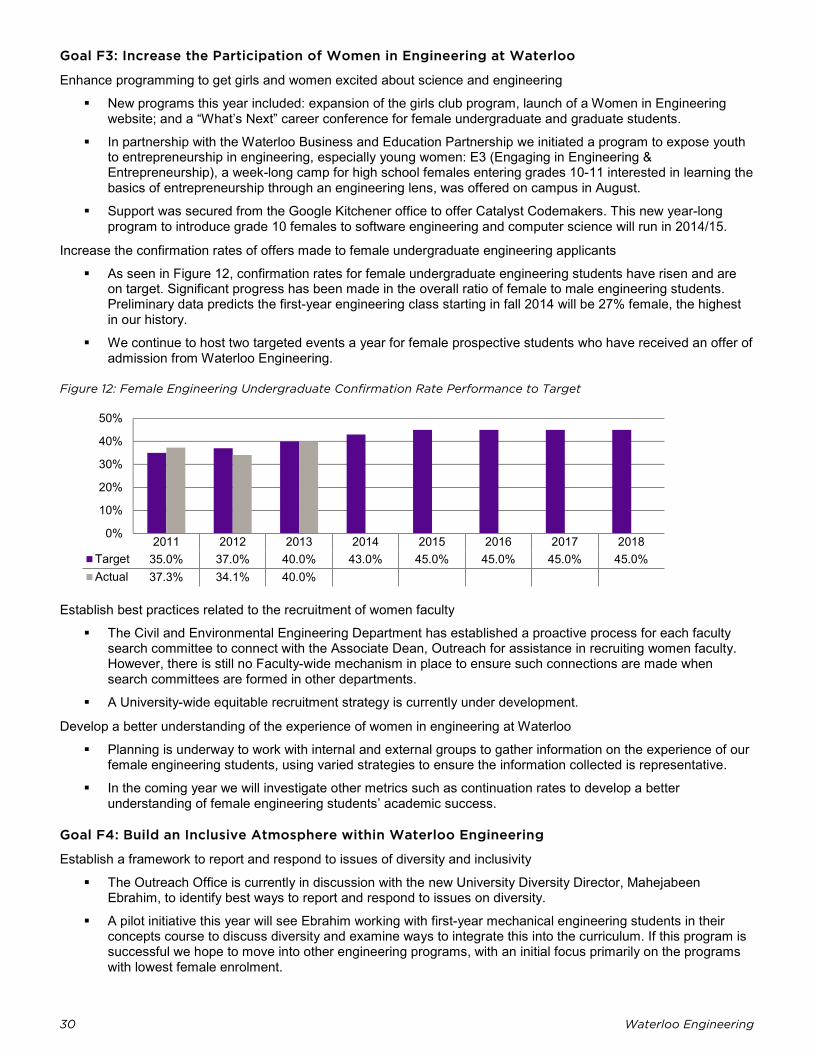
30 Waterloo Engineering
0%
10%
20%
30%
40%
50%
Goal F3: Increase the Participation of Women in Engineering at Waterloo
Enhance programming to get girls and women excited about science and engineering
New programs this year included: expansion of the girls club program, launch of a Women in Engineering website; and a “What’s Next” career conference for female undergraduate and graduate students.
In partnership with the Waterloo Business and Education Partnership we initiated a program to expose youth to entrepreneurship in engineering, especially young women: E3 (Engaging in Engineering & Entrepreneurship), a week-long camp for high school females entering grades 10-11 interested in learning the basics of entrepreneurship through an engineering lens, was offered on campus in August.
Support was secured from the Google Kitchener office to offer Catalyst Codemakers. This new year-long program to introduce grade 10 females to software engineering and computer science will run in 2014/15.
Increase the confirmation rates of offers made to female undergraduate engineering applicants
As seen in Figure 12, confirmation rates for female undergraduate engineering students have risen and are on target. Significant progress has been made in the overall ratio of female to male engineering students. Preliminary data predicts the first-year engineering class starting in fall 2014 will be 27% female, the highest in our history.
We continue to host two targeted events a year for female prospective students who have received an offer of admission from Waterloo Engineering.
Figure 12: Female Engineering Undergraduate Confirmation Rate Performance to Target
2011 2012 2013 2014 2015 2016 2017 2018Target 35.0% 37.0% 40.0% 43.0% 45.0% 45.0% 45.0% 45.0%Actual 37.3% 34.1% 40.0%
Establish best practices related to the recruitment of women faculty
The Civil and Environmental Engineering Department has established a proactive process for each faculty search committee to connect with the Associate Dean, Outreach for assistance in recruiting women faculty. However, there is still no Faculty-wide mechanism in place to ensure such connections are made when search committees are formed in other departments.
A University-wide equitable recruitment strategy is currently under development.
Develop a better understanding of the experience of women in engineering at Waterloo
Planning is underway to work with internal and external groups to gather information on the experience of our female engineering students, using varied strategies to ensure the information collected is representative.
In the coming year we will investigate other metrics such as continuation rates to develop a better understanding of female engineering students’ academic success.
Goal F4: Build an Inclusive Atmosphere within Waterloo Engineering
Establish a framework to report and respond to issues of diversity and inclusivity
The Outreach Office is currently in discussion with the new University Diversity Director, Mahejabeen Ebrahim, to identify best ways to report and respond to issues on diversity.
A pilot initiative this year will see Ebrahim working with first-year mechanical engineering students in their concepts course to discuss diversity and examine ways to integrate this into the curriculum. If this program is successful we hope to move into other engineering programs, with an initial focus primarily on the programs with lowest female enrolment.
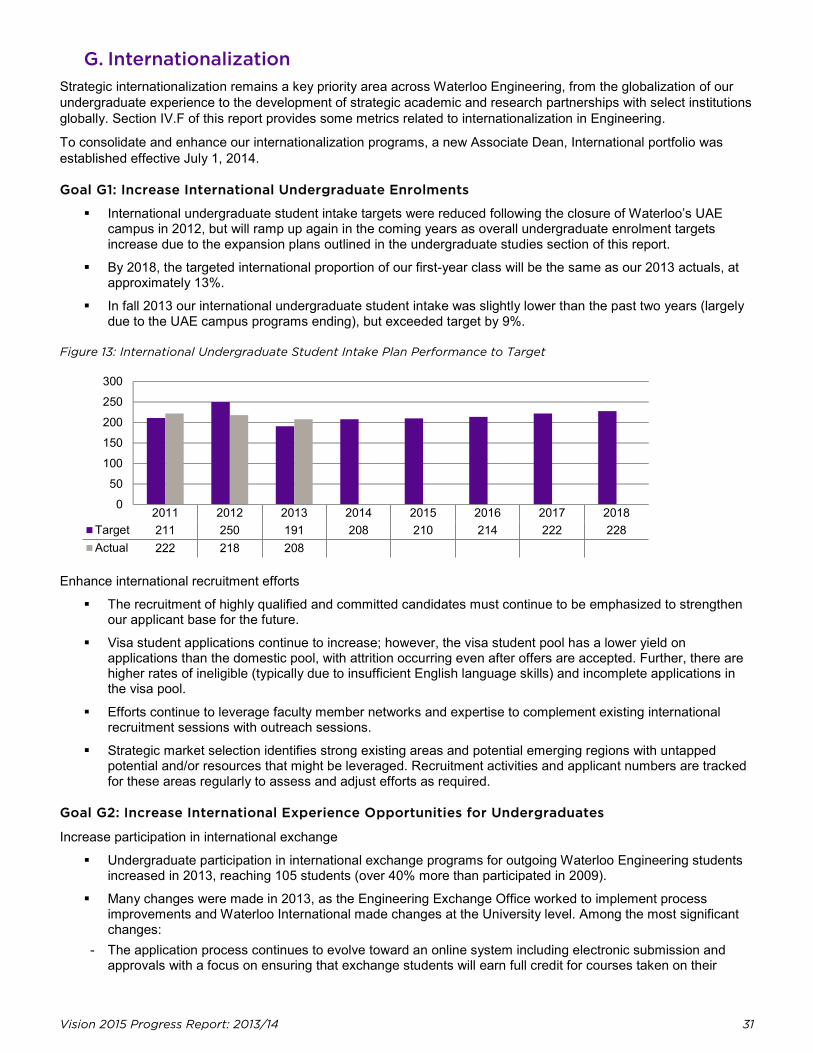
Vision 2015 Progress Report: 2013/14 31
0
50
100
150
200
250
300
G. Internationalization Strategic internationalization remains a key priority area across Waterloo Engineering, from the globalization of our undergraduate experience to the development of strategic academic and research partnerships with select institutions globally. Section IV.F of this report provides some metrics related to internationalization in Engineering.
To consolidate and enhance our internationalization programs, a new Associate Dean, International portfolio was established effective July 1, 2014.
Goal G1: Increase International Undergraduate Enrolments
International undergraduate student intake targets were reduced following the closure of Waterloo’s UAE campus in 2012, but will ramp up again in the coming years as overall undergraduate enrolment targets increase due to the expansion plans outlined in the undergraduate studies section of this report.
By 2018, the targeted international proportion of our first-year class will be the same as our 2013 actuals, at approximately 13%.
In fall 2013 our international undergraduate student intake was slightly lower than the past two years (largely due to the UAE campus programs ending), but exceeded target by 9%.
Figure 13: International Undergraduate Student Intake Plan Performance to Target
2011 2012 2013 2014 2015 2016 2017 2018Target 211 250 191 208 210 214 222 228Actual 222 218 208
Enhance international recruitment efforts
The recruitment of highly qualified and committed candidates must continue to be emphasized to strengthen our applicant base for the future.
Visa student applications continue to increase; however, the visa student pool has a lower yield on applications than the domestic pool, with attrition occurring even after offers are accepted. Further, there are higher rates of ineligible (typically due to insufficient English language skills) and incomplete applications in the visa pool.
Efforts continue to leverage faculty member networks and expertise to complement existing international recruitment sessions with outreach sessions.
Strategic market selection identifies strong existing areas and potential emerging regions with untapped potential and/or resources that might be leveraged. Recruitment activities and applicant numbers are tracked for these areas regularly to assess and adjust efforts as required.
Goal G2: Increase International Experience Opportunities for Undergraduates
Increase participation in international exchange
Undergraduate participation in international exchange programs for outgoing Waterloo Engineering students increased in 2013, reaching 105 students (over 40% more than participated in 2009).
Many changes were made in 2013, as the Engineering Exchange Office worked to implement process improvements and Waterloo International made changes at the University level. Among the most significant changes:
- The application process continues to evolve toward an online system including electronic submission and approvals with a focus on ensuring that exchange students will earn full credit for courses taken on their
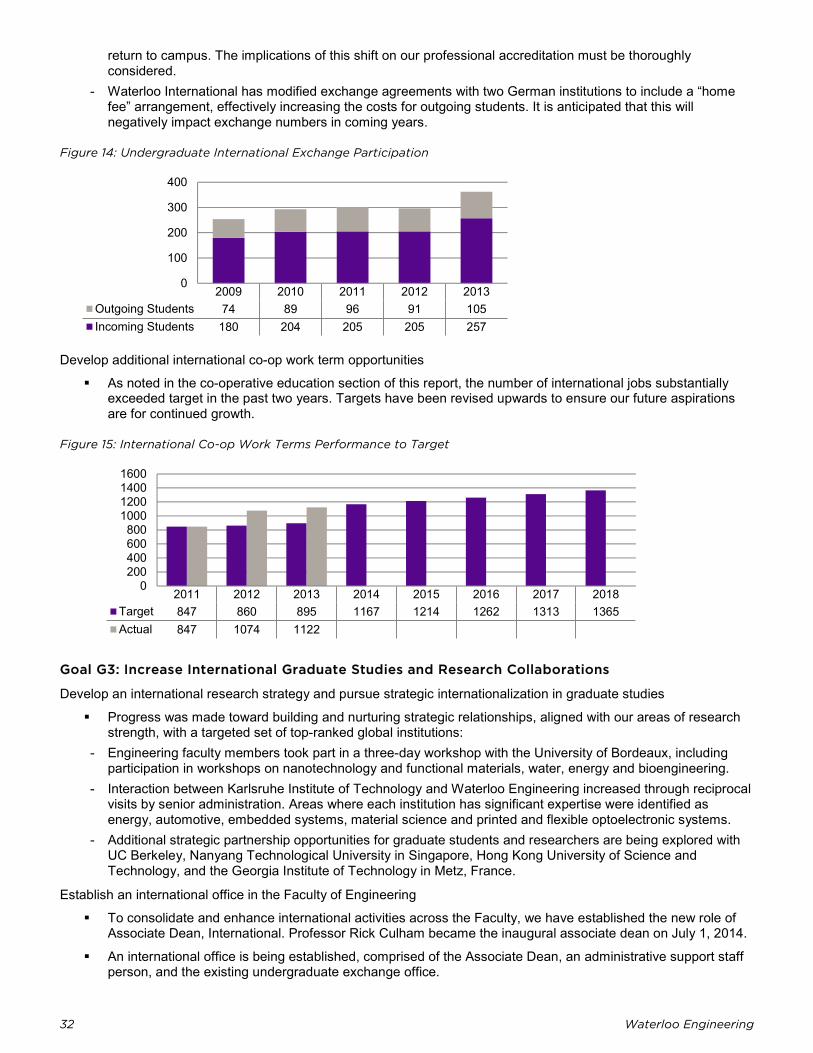
32 Waterloo Engineering
0
100
200
300
400
1600140012001000800600400200
0
return to campus. The implications of this shift on our professional accreditation must be thoroughly considered.
- Waterloo International has modified exchange agreements with two German institutions to include a “home fee” arrangement, effectively increasing the costs for outgoing students. It is anticipated that this will negatively impact exchange numbers in coming years.
Figure 14: Undergraduate International Exchange Participation
2009 2010 2011 2012 2013Outgoing Students 74 89 96 91 105Incoming Students 180 204 205 205 257
Develop additional international co-op work term opportunities
As noted in the co-operative education section of this report, the number of international jobs substantially exceeded target in the past two years. Targets have been revised upwards to ensure our future aspirations are for continued growth.
Figure 15: International Co-op Work Terms Performance to Target
2011 2012 2013 2014 2015 2016 2017 2018Target 847 860 895 1167 1214 1262 1313 1365Actual 847 1074 1122
Goal G3: Increase International Graduate Studies and Research Collaborations
Develop an international research strategy and pursue strategic internationalization in graduate studies
Progress was made toward building and nurturing strategic relationships, aligned with our areas of research strength, with a targeted set of top-ranked global institutions:
- Engineering faculty members took part in a three-day workshop with the University of Bordeaux, including participation in workshops on nanotechnology and functional materials, water, energy and bioengineering.
- Interaction between Karlsruhe Institute of Technology and Waterloo Engineering increased through reciprocal visits by senior administration. Areas where each institution has significant expertise were identified as energy, automotive, embedded systems, material science and printed and flexible optoelectronic systems.
- Additional strategic partnership opportunities for graduate students and researchers are being explored with UC Berkeley, Nanyang Technological University in Singapore, Hong Kong University of Science and Technology, and the Georgia Institute of Technology in Metz, France.
Establish an international office in the Faculty of Engineering
To consolidate and enhance international activities across the Faculty, we have established the new role of Associate Dean, International. Professor Rick Culham became the inaugural associate dean on July 1, 2014.
An international office is being established, comprised of the Associate Dean, an administrative support staff person, and the existing undergraduate exchange office.
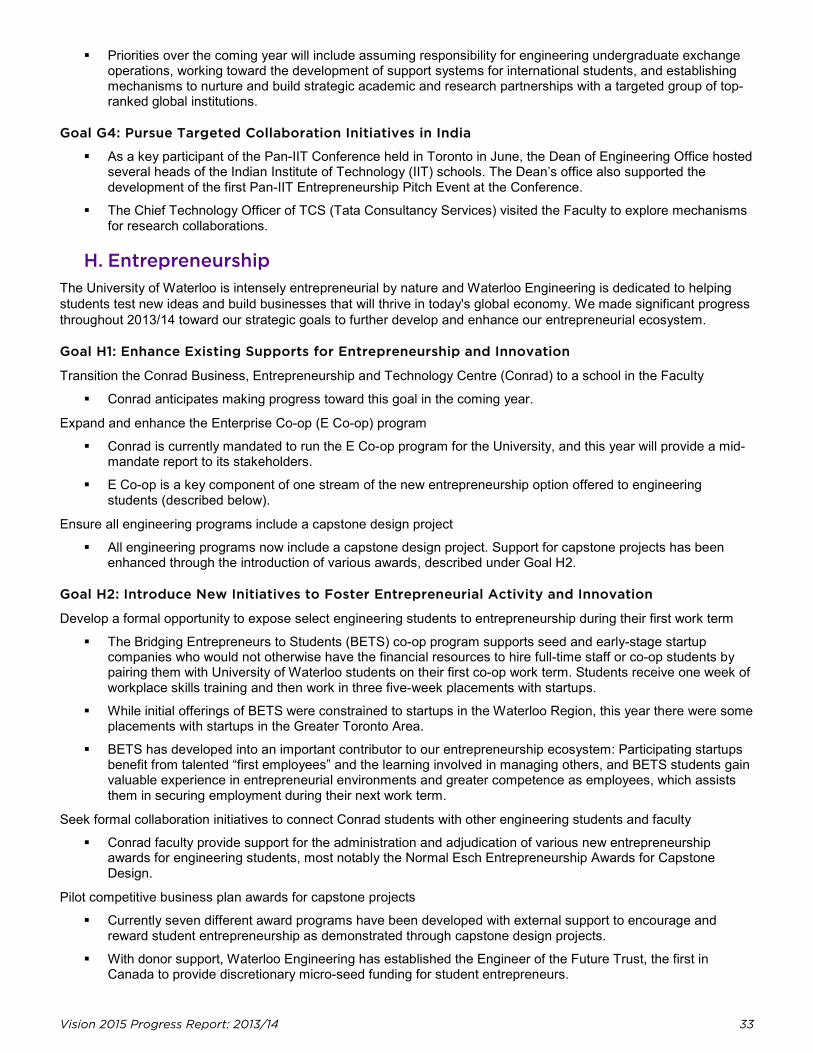
Vision 2015 Progress Report: 2013/14 33
Priorities over the coming year will include assuming responsibility for engineering undergraduate exchange operations, working toward the development of support systems for international students, and establishing mechanisms to nurture and build strategic academic and research partnerships with a targeted group of top-ranked global institutions.
Goal G4: Pursue Targeted Collaboration Initiatives in India
As a key participant of the Pan-IIT Conference held in Toronto in June, the Dean of Engineering Office hosted several heads of the Indian Institute of Technology (IIT) schools. The Dean’s office also supported the development of the first Pan-IIT Entrepreneurship Pitch Event at the Conference.
The Chief Technology Officer of TCS (Tata Consultancy Services) visited the Faculty to explore mechanisms for research collaborations.
H. Entrepreneurship The University of Waterloo is intensely entrepreneurial by nature and Waterloo Engineering is dedicated to helping students test new ideas and build businesses that will thrive in today's global economy. We made significant progress throughout 2013/14 toward our strategic goals to further develop and enhance our entrepreneurial ecosystem.
Goal H1: Enhance Existing Supports for Entrepreneurship and Innovation
Transition the Conrad Business, Entrepreneurship and Technology Centre (Conrad) to a school in the Faculty
Conrad anticipates making progress toward this goal in the coming year.
Expand and enhance the Enterprise Co-op (E Co-op) program
Conrad is currently mandated to run the E Co-op program for the University, and this year will provide a mid-mandate report to its stakeholders.
E Co-op is a key component of one stream of the new entrepreneurship option offered to engineering students (described below).
Ensure all engineering programs include a capstone design project
All engineering programs now include a capstone design project. Support for capstone projects has been enhanced through the introduction of various awards, described under Goal H2.
Goal H2: Introduce New Initiatives to Foster Entrepreneurial Activity and Innovation
Develop a formal opportunity to expose select engineering students to entrepreneurship during their first work term
The Bridging Entrepreneurs to Students (BETS) co-op program supports seed and early-stage startup companies who would not otherwise have the financial resources to hire full-time staff or co-op students by pairing them with University of Waterloo students on their first co-op work term. Students receive one week of workplace skills training and then work in three five-week placements with startups.
While initial offerings of BETS were constrained to startups in the Waterloo Region, this year there were some placements with startups in the Greater Toronto Area.
BETS has developed into an important contributor to our entrepreneurship ecosystem: Participating startups benefit from talented “first employees” and the learning involved in managing others, and BETS students gain valuable experience in entrepreneurial environments and greater competence as employees, which assists them in securing employment during their next work term.
Seek formal collaboration initiatives to connect Conrad students with other engineering students and faculty
Conrad faculty provide support for the administration and adjudication of various new entrepreneurship awards for engineering students, most notably the Normal Esch Entrepreneurship Awards for Capstone Design.
Pilot competitive business plan awards for capstone projects
Currently seven different award programs have been developed with external support to encourage and reward student entrepreneurship as demonstrated through capstone design projects.
With donor support, Waterloo Engineering has established the Engineer of the Future Trust, the first in Canada to provide discretionary micro-seed funding for student entrepreneurs.
34 Waterloo Engineering
In the past year, over $820,000 has been raised to support engineering capstone and entrepreneurship awards and pitch competitions and to launch the Engineer of the Future Trust.
Introduce a Graduate Diploma in Business and Entrepreneurship
Conrad is now offering six courses a year toward this diploma. The courses have been well received, and have typically filled in each term.
Enrolments in these courses are dominated by students pursuing a Certificate in Business and Entrepreneurship (rather than the stand-alone diploma) as part of their studies in a professional master program elsewhere in the Faculty of Engineering.
Launch an undergraduate option in entrepreneurship
Conrad launched an entrepreneurship option in September, 2014 that is available to all interested Waterloo Engineering undergraduates.
Making a minor in entrepreneurship available to all undergraduates on campus has become a priority for Conrad, and is central to the University’s emerging entrepreneurship strategic priorities.
Goal H3: Develop New Spaces and Infrastructure to Support Entrepreneurship and Innovation
Embed the facilitation of entrepreneurship in the design of E7
Major facilities in support of student entrepreneurship and innovation are incorporated into the space plans for Engineering 7, including:
- the Engineering Ideas Clinic™ where students will design, build, test and refine ideas in a series of multidisciplinary modules that inspire creativity, inquiry, ideas generation and interest in entrepreneurship (see Goal E4)
- departmental “garages,” which will provide enhanced facilities for students to work on capstone design projects
- a multimedia pitch area for honing presentations and pitching new ventures - a main-campus home for Conrad, where students can take advantage of programs including E Co-op, MBET
and the undergraduate option in entrepreneurship
Strengthen campus opportunities to build-test hardware devices and prototypes
Through the recently-established Alumni Entrepreneurship Support Program, new alumni who are developing an idea for a potential future business will have access to the student machine shop, 3D printing service, device and circuit fabrication and characterization facilities and — as of 2015 — a surface mounting fabrication facility.
Renovated space in ECH will also be available to new graduates who need to further refine their capstone prototypes and develop their businesses.
Space has been allocated in East Campus Hall to accommodate an extension of the E5 WEEF Student Shop to provide much-needed additional capacity for students to complete their projects. This additional shop space, which is expected to be operational in early 2015, will alleviate demand on the current space that is resulting in unacceptable wait times for students to use some equipment.
I. Space
Waterloo Engineering space holdings have increased by 19,046 nasm (52%) over the past eight years, to reach 55,613 nasm (see Figure 139). While this is a significant achievement, space limitations remain the most pressing constraint to the achievement of many of our plan goals. Space and facilities are also essential supporting elements to many of our strategic goals, from research enhancement to the facilitation of entrepreneurship to innovation in teaching and learning. While we continue to move forward with our current space plans, we note that the availability of funding would be very helpful to accelerate them.
Goal I1: Complete a Comprehensive Update to the Existing Space Plan
The current space plan for Waterloo Engineering focuses on providing space required by the departments participating in the new undergraduate program in biomedical engineering and the expansion to a second stream of mechatronics engineering.
Vision 2015 Progress Report: 2013/14 35
The space plan has also been updated to reallocate space within the Faculty as a result of the closure of the University’s UAE campus (which resulted in the cancellation of growth plans in Chemical Engineering and Civil & Environmental Engineering). This ongoing initiative is expected to continue through to mid-2015.
An emerging space opportunity for Engineering exists as a result of a proposal made to the University in May, 2014 to acquire space within the recently acquired Blackberry Buildings. At this time the Faculty is in discussion with the University for at least one floor of EC4 (previously referred to as BB4).
Goal I2: Create the Space Required to Meet Operational and Strategic Needs
Our priority space goal remains the construction of Engineering 7 (E7). A space plan has been completed and significant funds raised. Approval was granted by the University Board of Governors on October 28, 2014 leading to planned ground breaking before November, 2015 and full occupancy in September, 2018.
- As described in Goal H3 of the entrepreneurship section, E7 and adjacent space in East Campus Hall will provide space and infrastructure that will nurture student entrepreneurship and innovation.
- To help achieve the Faculty’s strategic goal related to facilitating innovative teaching approaches and the integration of learning (see Goal E4), a 13,200-square-foot Engineering Ideas Clinic™ will be located in E7. Here students will design, build, test and refine ideas in a series of multidisciplinary modules that integrate classroom theory with hands-on learning.
We are currently working to add at least a floor of EC4 to our space inventory to address the critical space needs of Systems Design Engineering and Mechanical & Mechatronics Engineering.
It is also planned, given our very serious space shortfall, to investigate the feasibility of erecting a single-floor steel structure above suitable sections of E3. Such a light-weight structure could be used to provide graduate offices for students engaged in the laboratories of E2 and E3 and potential design studio space should the proposed new architectural engineering program (described in the Civil & Environmental Engineering report in Section III.L) move forward.
A longer-term space objective is to finalize the reconsolidation of Chemical Engineering onto the East Campus, which requires E8 (the extension of E6, which opened in 2012) to be planned and constructed.
A second long-term objective is the vision for E9 to be located, potentially, immediately north of E7; this project is a long way into the future but provision is being made in E7 for accommodate a potential future overhead link into E9.
Goal I3: Harmonize all Aspects of Safety within the Faculty of Engineering
The Engineering Safety Planning Committee (ESPC) expanded its membership to include representatives from the six departments located on main campus, as well as the Dean’s Office. Efforts are underway to identify and include a representative from the School of Architecture.
The ESPC has concluded its analysis of potential methods for safe access to Engineering buildings and labs, with a resulting recommendation that WATCARD access would be the superior method. The next steps in this project will involve presenting this recommendation, initially to the Dean, for further review and consideration.
Meetings with the University Information Systems and Technology office regarding the development of a safety training database interface have been very productive, with a draft version for beta testing expected in fall 2014.
Chemical Engineering and Mechanical & Mechatronics Engineering have completed a hazard analysis and developed a first round of Standard Operating Procedures (SOPs). This initiative is progressing in the other departments with completion expected in winter 2015. A SharePoint site is in place for departments to share completed SOPs.
A new safety focus for departments with facilities in the Mike & Ophelia Lazaridis Quantum-Nano Centre (QNC) is a University-level committee struck in 2014 to focus on the QNC labs and development of a campus-wide resource on the safe handling of nano-powders.
J. Information Technology In 2013/14, Engineering Computing continued to ensure a quality computing environment for students, staff, and faculty. The upgrade and/or renovation of undergraduate labs is ahead of schedule. Client support continues to be a priority for the unit. In 2013/14, six projects have been advanced and sufficiently completed to support improvements to operational efficiency and innovation in service delivery for all units in Engineering and across the University.
36 Waterloo Engineering
Goal J1: Ensure a Quality Computing Environment
Undergraduate computer labs and terminal servers are upgraded and/or renovated on a rotating basis following a regular schedule to ensure a quality computing environment for our students. In 2013/14 the Fulcrum (22 stations), Pulley (24 stations), and Lever (42 stations) labs were upgraded. Next labs scheduled for upgrade include Wheel (20 stations, upgraded September 2014) and WEEF (140 stations).
In fall 2013 a dedicated computer lab for professional master’s students was opened. These students, who previously did not have on-campus access to dedicated computing resources, now have access to a lab with 25 desktop and nine laptop computing stations and space for collaborative work and project meetings.
The digital signage used to communicate computing environment operating status is being upgraded to allow more cost effective operation and a larger number of units with the potential to communicate a wider range of items.
Goal J2: Enhance Support to Computing Clients
In 2013 two additional part-time staff members were hired to increase the IT Service Desk hours to 10 a.m. – 4 p.m. Monday to Friday. This support level has been maintained throughout 2013/2014.
The IT service phone line continues to provide a single point of contact through which faculty and staff support requests are routed to the individual(s) best placed to respond.
Goal J3: Support Improvements to Operational Efficiency and Innovation in Service Delivery
The Associate Dean, Computing continues to implement a process by which inefficient or ineffective operations and duplication of efforts are identified by Engineering Computing staff and solutions are developed, either by adapting and sharing existing systems or by implementing new systems. Among such innovations:
- ECResearch, a fileserver that provides secure, cost-effective and scalable disk space for researchers needing to back up large amounts of data has been implemented. Over 60 faculty research groups use this facility.
- The functionality of the Online Faculty Information System has been further developed to assist faculty with the creation of their Common CV.
- Documint, a searchable document management system, was developed and implemented for the Canadian Engineering Accreditation Board external reviewers’ visit in fall 2013. Further uses for this system are being explored.
- Surveyor, an online survey tool for use on devices capable of accessing the Internet, has been developed and was made available in a beta release in winter 2014.
- The Faculty Appointment Tool, a SharePoint system for tracking academic appointments, continues to be enhanced and used extensively by staff in the Dean of Engineering Office. In 2013/14 it was rolled out as an information resource to select staff in all eight academic units and piloted for data input in two departments.
- Trak/AUDIT, an asset management system, is now being used by all Faculties except Environment. In 2014/15 its further development and use at the institutional level will be investigated by an IST team.
K. Advancement We have made significant progress to support Vision 2015 by enhancing the Faculty’s reputation as a world-class leader in engineering research and education, and by securing the philanthropic support required for our priority initiatives.
Goal K1: Secure the Philanthropic Support Required for our Priority Initiatives
Close the gap in the Vision 2010 Campaign, with a focus on infrastructure funding
The Vision 2010 campaign has currently achieved 109% of its $120 million fundraising goal (see Figure 138) and the Faculty has progressed into the Educating the Engineer of the Future Campaign.
Develop and execute a fundraising strategy for Vision 2015 priorities, in particular as they relate to capital needs and graduate fellowships
In an effort to move forward from the Vision 2010 brand for the Faculty fundraising campaign as well as incorporate the Vision 2015 fundraising priorities we extended the Vision 2010 campaign goal and we are in the process of re-branding as the Educating the Engineer of the Future Campaign.
Vision 2015 Progress Report: 2013/14 37
The expanded campaign is currently in the quiet phase. As a result of our early success in fundraising for the new E7 building, we are expanding the scope of the campaign to include additional strategic objectives including graduate scholarships and student experience initiatives. We are currently planning an additional goal of $70M with an end date set to coincide with the opening of the E7 building in 2018.
Maintain Faculty-level fundraising while supporting departmental priorities through enhanced annual fund initiatives and goals
Waterloo Engineering is donor-centric in its fundraising approach, working with our donors to match their philanthropic interests in Engineering with our broad range of programs, student needs and projects. During the past year, financial and in-kind support has been raised to support departmental needs through undesignated donations to program support and equipment as well as targeted donor gifts to, for example: support from Toyota Canada for graduate scholarships in automotive safety; memorial scholarships and fundraising initiatives in Civil & Environmental Engineering, Architecture, and Chemical Engineering; an undergraduate scholarship in honour of Rick Haldenby’s 25 years as Director of the School of Architecture; contributions to the Engineer of the Future Trust; and support for capstone design initiatives.
Engage our alumni at a higher level by offering strategic engagement opportunities based on their interests and capacity
The restructuring and evaluation of the alumni affairs program initiated in 2011 continued this year as we shift from a broad-based event model to a plan that includes more strategic events focused on our key geographic areas (Waterloo, GTA, Ottawa, Calgary and San Francisco/Bay area). In 2013, 18 alumni events were organized by Waterloo Engineering’s Advancement Office, reaching a total of 5,597 alumni.
Goal K2: Enhance the Faculty’s Reputation as a World-class Leader in Engineering Research and Education
Strengthen the Faculty brand through consistent messaging and visual identity
The foundation for success in external communications is the brand: a shared understanding of who we are and how we tell our story, supported by a positioning statement, key messages, a clear visual ID, strategic marketing and strong stakeholder engagement. During the past year, a significant initiative was undertaken to define and develop key messaging for the Educating the Engineer of the Future Campaign – a campaign that will support significant fundraising, engage pride in our alumni and strengthen Waterloo Engineering’s reputation.
Expand Waterloo Engineering’s profile as a world-class school of engineering
Our reputation as a leader in engineering education and research was enhanced in the past year with exceptional media coverage, including an article in Bloomberg BusinessWeek that called the University of Waterloo “Canada's Stanford” and a Business Insider article that described Waterloo Engineering as the #1 engineering school in Canada.
Interviews with high-profile entrepreneurs such as Alexis Ohanian, co-founder of reddit, who praised Waterloo Engineering and its entrepreneurial environment, served to elevate our profile and strengthen our brand and marketing and communications materials.
Improve all web sites and introduce new electronic and social media strategies
During the past year, considerable progress was made with the migration of the Faculty’s expansive web site to the new Drupal platform. In addition, a concerted effort was made to increase the Faculty’s reputation and awareness through greater content marketing, specifically the more strategic use of social media and video.
Develop and implement a strategic graduate student recruitment program
Progress, while challenging, continues to be made in the area of graduate recruitment. An engineering graduate studies marketing and recruitment plan was implemented, building on the learnings and successes of the previous year. Preparation of the updated plan included a basic competitive and market analysis. New initiatives included: the implementation of a national engineering graduate studies consortium; a research awareness campaign including social media, advertising digitally and on the TTC; and improved communications with prospective students through brochures, call campaigns, and confirmation mailings.
Support efforts to create an engaging and inclusive environment for current students
The Engineering Ambassador Team grew from 82 to 117 students and over 150 trained faculty members actively volunteered for undergraduate recruitment events.
38 Waterloo Engineering
Lead efforts to keep faculty and staff informed of key initiatives and achievements
The Engineering Communications Council reconvened in late 2013. Held monthly, the meetings are attended by staff and faculty representatives from across Engineering and include the maintenance and distribution of editorial and events calendars.
An audit of our internal and external communications took place in 2014, including an Eng-e-News-focused survey sent to staff and faculty.
Support Vision 2015 development and alumni objectives with best-in-class marketing communications
During the past year, three foundational documents were created in preparation for the Educating the Engineer of the Future campaign and the related marketing and fundraising activities. These included: the case for support; a campaign plan for fundraising; and the campaign communications plan. The overall strategy for the campaign has been continually refined over the past year as key elements have been tested for relevancy and impact with our stakeholder audiences.
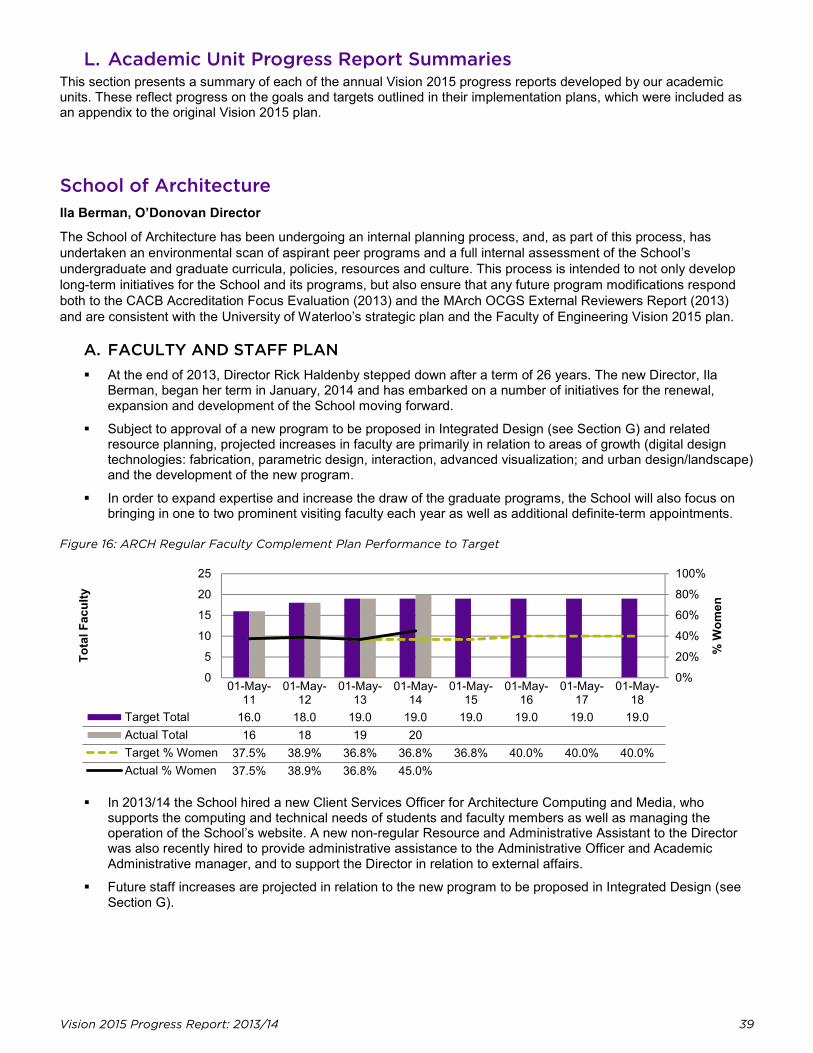
Vision 2015 Progress Report: 2013/14 39
0%
20%
40%
60%
80%
100%
0
5
10
15
20
25
% W
omen
Tota
l Fac
ulty
L. Academic Unit Progress Report Summaries This section presents a summary of each of the annual Vision 2015 progress reports developed by our academic units. These reflect progress on the goals and targets outlined in their implementation plans, which were included as an appendix to the original Vision 2015 plan.
School of Architecture Ila Berman, O’Donovan Director
The School of Architecture has been undergoing an internal planning process, and, as part of this process, has undertaken an environmental scan of aspirant peer programs and a full internal assessment of the School’s undergraduate and graduate curricula, policies, resources and culture. This process is intended to not only develop long-term initiatives for the School and its programs, but also ensure that any future program modifications respond both to the CACB Accreditation Focus Evaluation (2013) and the MArch OCGS External Reviewers Report (2013) and are consistent with the University of Waterloo’s strategic plan and the Faculty of Engineering Vision 2015 plan.
A. FACULTY AND STAFF PLAN At the end of 2013, Director Rick Haldenby stepped down after a term of 26 years. The new Director, Ila
Berman, began her term in January, 2014 and has embarked on a number of initiatives for the renewal, expansion and development of the School moving forward.
Subject to approval of a new program to be proposed in Integrated Design (see Section G) and related resource planning, projected increases in faculty are primarily in relation to areas of growth (digital design technologies: fabrication, parametric design, interaction, advanced visualization; and urban design/landscape) and the development of the new program.
In order to expand expertise and increase the draw of the graduate programs, the School will also focus on bringing in one to two prominent visiting faculty each year as well as additional definite-term appointments.
Figure 16: ARCH Regular Faculty Complement Plan Performance to Target
01-May-11
01-May-12
01-May-13
01-May-14
01-May-15
01-May-16
01-May-17
01-May-18
Target Total 16.0 18.0 19.0 19.0 19.0 19.0 19.0 19.0Actual Total 16 18 19 20Target % Women 37.5% 38.9% 36.8% 36.8% 36.8% 40.0% 40.0% 40.0%Actual % Women 37.5% 38.9% 36.8% 45.0%
In 2013/14 the School hired a new Client Services Officer for Architecture Computing and Media, who supports the computing and technical needs of students and faculty members as well as managing the operation of the School’s website. A new non-regular Resource and Administrative Assistant to the Director was also recently hired to provide administrative assistance to the Administrative Officer and Academic Administrative manager, and to support the Director in relation to external affairs.
Future staff increases are projected in relation to the new program to be proposed in Integrated Design (see Section G).
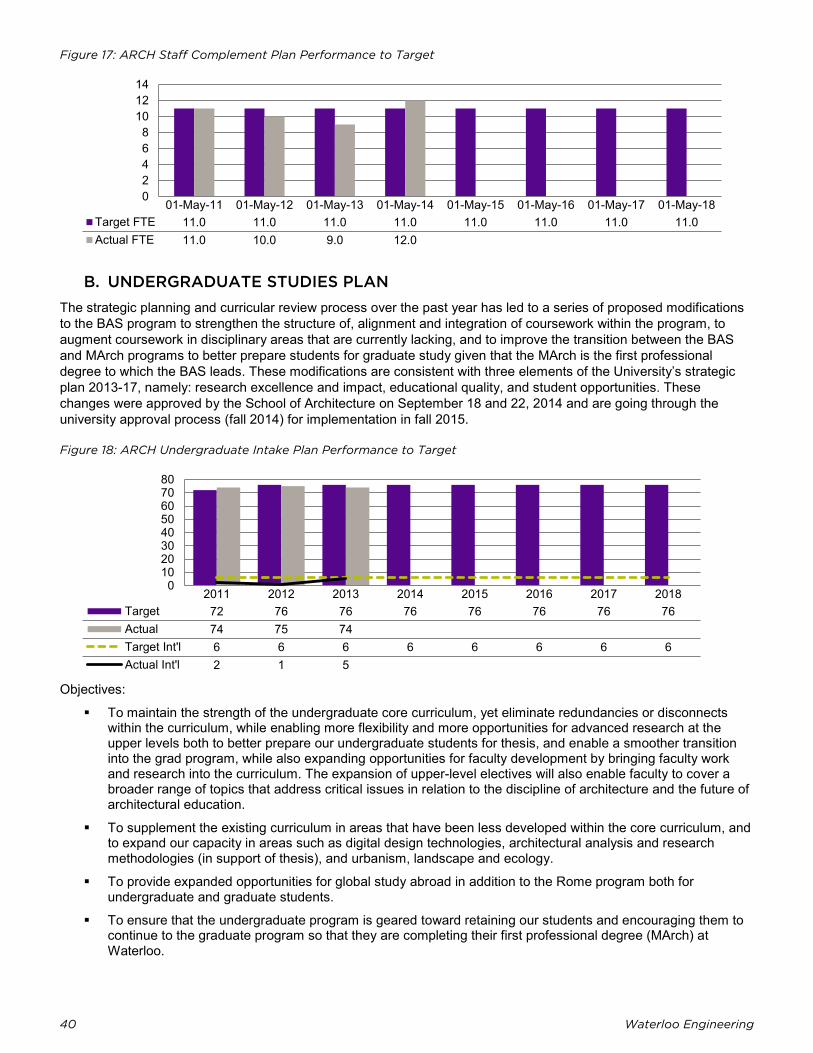
40 Waterloo Engineering
02468
101214
01020304050607080
Figure 17: ARCH Staff Complement Plan Performance to Target
01-May-11 01-May-12 01-May-13 01-May-14 01-May-15 01-May-16 01-May-17 01-May-18Target FTE 11.0 11.0 11.0 11.0 11.0 11.0 11.0 11.0Actual FTE 11.0 10.0 9.0 12.0
B. UNDERGRADUATE STUDIES PLAN The strategic planning and curricular review process over the past year has led to a series of proposed modifications to the BAS program to strengthen the structure of, alignment and integration of coursework within the program, to augment coursework in disciplinary areas that are currently lacking, and to improve the transition between the BAS and MArch programs to better prepare students for graduate study given that the MArch is the first professional degree to which the BAS leads. These modifications are consistent with three elements of the University’s strategic plan 2013-17, namely: research excellence and impact, educational quality, and student opportunities. These changes were approved by the School of Architecture on September 18 and 22, 2014 and are going through the university approval process (fall 2014) for implementation in fall 2015.
Figure 18: ARCH Undergraduate Intake Plan Performance to Target
2011 2012 2013 2014 2015 2016 2017 2018Target 72 76 76 76 76 76 76 76Actual 74 75 74Target Int'l 6 6 6 6 6 6 6 6Actual Int'l 2 1 5
Objectives:
To maintain the strength of the undergraduate core curriculum, yet eliminate redundancies or disconnects within the curriculum, while enabling more flexibility and more opportunities for advanced research at the upper levels both to better prepare our undergraduate students for thesis, and enable a smoother transition into the grad program, while also expanding opportunities for faculty development by bringing faculty work and research into the curriculum. The expansion of upper-level electives will also enable faculty to cover a broader range of topics that address critical issues in relation to the discipline of architecture and the future of architectural education.
To supplement the existing curriculum in areas that have been less developed within the core curriculum, and to expand our capacity in areas such as digital design technologies, architectural analysis and research methodologies (in support of thesis), and urbanism, landscape and ecology.
To provide expanded opportunities for global study abroad in addition to the Rome program both for undergraduate and graduate students.
To ensure that the undergraduate program is geared toward retaining our students and encouraging them to continue to the graduate program so that they are completing their first professional degree (MArch) at Waterloo.
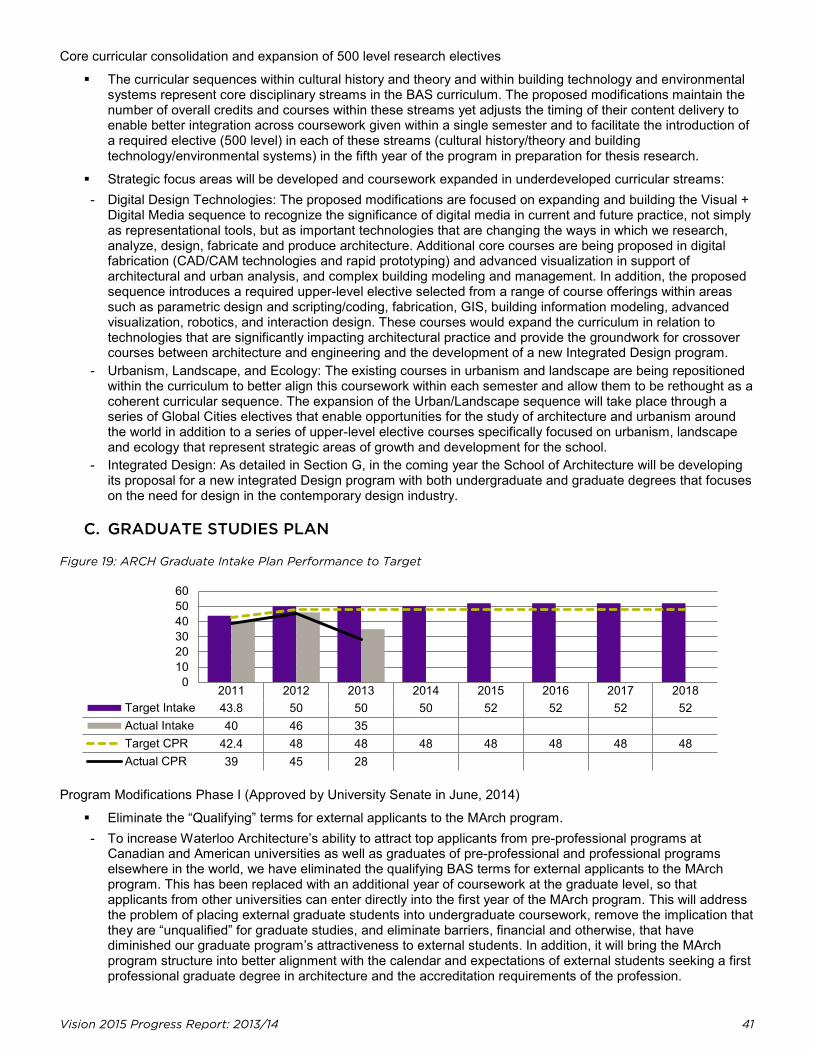
Vision 2015 Progress Report: 2013/14 41
0102030405060
Core curricular consolidation and expansion of 500 level research electives
The curricular sequences within cultural history and theory and within building technology and environmental systems represent core disciplinary streams in the BAS curriculum. The proposed modifications maintain the number of overall credits and courses within these streams yet adjusts the timing of their content delivery to enable better integration across coursework given within a single semester and to facilitate the introduction of a required elective (500 level) in each of these streams (cultural history/theory and building technology/environmental systems) in the fifth year of the program in preparation for thesis research.
Strategic focus areas will be developed and coursework expanded in underdeveloped curricular streams: - Digital Design Technologies: The proposed modifications are focused on expanding and building the Visual +
Digital Media sequence to recognize the significance of digital media in current and future practice, not simply as representational tools, but as important technologies that are changing the ways in which we research, analyze, design, fabricate and produce architecture. Additional core courses are being proposed in digital fabrication (CAD/CAM technologies and rapid prototyping) and advanced visualization in support of architectural and urban analysis, and complex building modeling and management. In addition, the proposed sequence introduces a required upper-level elective selected from a range of course offerings within areas such as parametric design and scripting/coding, fabrication, GIS, building information modeling, advanced visualization, robotics, and interaction design. These courses would expand the curriculum in relation to technologies that are significantly impacting architectural practice and provide the groundwork for crossover courses between architecture and engineering and the development of a new Integrated Design program.
- Urbanism, Landscape, and Ecology: The existing courses in urbanism and landscape are being repositioned within the curriculum to better align this coursework within each semester and allow them to be rethought as a coherent curricular sequence. The expansion of the Urban/Landscape sequence will take place through a series of Global Cities electives that enable opportunities for the study of architecture and urbanism around the world in addition to a series of upper-level elective courses specifically focused on urbanism, landscape and ecology that represent strategic areas of growth and development for the school.
- Integrated Design: As detailed in Section G, in the coming year the School of Architecture will be developing its proposal for a new integrated Design program with both undergraduate and graduate degrees that focuses on the need for design in the contemporary design industry.
C. GRADUATE STUDIES PLAN
Figure 19: ARCH Graduate Intake Plan Performance to Target
2011 2012 2013 2014 2015 2016 2017 2018Target Intake 43.8 50 50 50 52 52 52 52Actual Intake 40 46 35Target CPR 42.4 48 48 48 48 48 48 48Actual CPR 39 45 28
Program Modifications Phase I (Approved by University Senate in June, 2014)
Eliminate the “Qualifying” terms for external applicants to the MArch program. - To increase Waterloo Architecture’s ability to attract top applicants from pre-professional programs at
Canadian and American universities as well as graduates of pre-professional and professional programs elsewhere in the world, we have eliminated the qualifying BAS terms for external applicants to the MArch program. This has been replaced with an additional year of coursework at the graduate level, so that applicants from other universities can enter directly into the first year of the MArch program. This will address the problem of placing external graduate students into undergraduate coursework, remove the implication that they are “unqualified” for graduate studies, and eliminate barriers, financial and otherwise, that have diminished our graduate program’s attractiveness to external students. In addition, it will bring the MArch program structure into better alignment with the calendar and expectations of external students seeking a first professional graduate degree in architecture and the accreditation requirements of the profession.
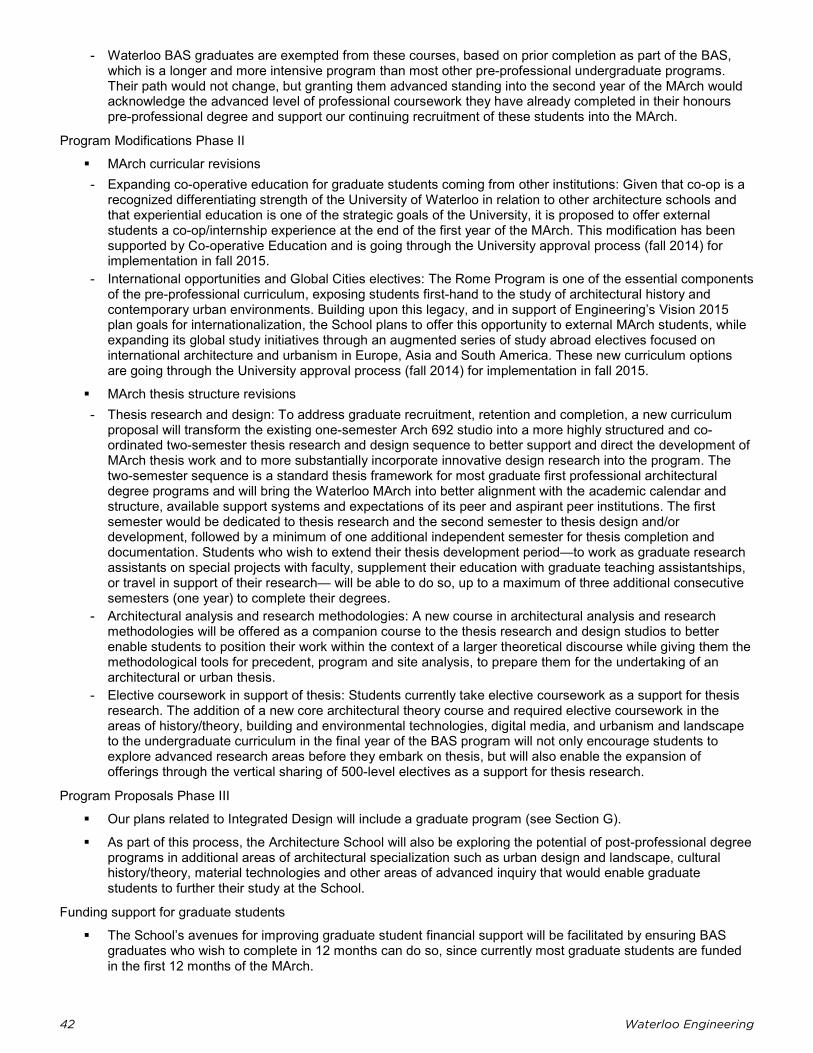
42 Waterloo Engineering
- Waterloo BAS graduates are exempted from these courses, based on prior completion as part of the BAS, which is a longer and more intensive program than most other pre-professional undergraduate programs. Their path would not change, but granting them advanced standing into the second year of the MArch would acknowledge the advanced level of professional coursework they have already completed in their honours pre-professional degree and support our continuing recruitment of these students into the MArch.
Program Modifications Phase II
MArch curricular revisions - Expanding co-operative education for graduate students coming from other institutions: Given that co-op is a
recognized differentiating strength of the University of Waterloo in relation to other architecture schools and that experiential education is one of the strategic goals of the University, it is proposed to offer external students a co-op/internship experience at the end of the first year of the MArch. This modification has been supported by Co-operative Education and is going through the University approval process (fall 2014) for implementation in fall 2015.
- International opportunities and Global Cities electives: The Rome Program is one of the essential components of the pre-professional curriculum, exposing students first-hand to the study of architectural history and contemporary urban environments. Building upon this legacy, and in support of Engineering’s Vision 2015 plan goals for internationalization, the School plans to offer this opportunity to external MArch students, while expanding its global study initiatives through an augmented series of study abroad electives focused on international architecture and urbanism in Europe, Asia and South America. These new curriculum options are going through the University approval process (fall 2014) for implementation in fall 2015.
MArch thesis structure revisions - Thesis research and design: To address graduate recruitment, retention and completion, a new curriculum
proposal will transform the existing one-semester Arch 692 studio into a more highly structured and co-ordinated two-semester thesis research and design sequence to better support and direct the development of MArch thesis work and to more substantially incorporate innovative design research into the program. The two-semester sequence is a standard thesis framework for most graduate first professional architectural degree programs and will bring the Waterloo MArch into better alignment with the academic calendar and structure, available support systems and expectations of its peer and aspirant peer institutions. The first semester would be dedicated to thesis research and the second semester to thesis design and/or development, followed by a minimum of one additional independent semester for thesis completion and documentation. Students who wish to extend their thesis development period—to work as graduate research assistants on special projects with faculty, supplement their education with graduate teaching assistantships, or travel in support of their research— will be able to do so, up to a maximum of three additional consecutive semesters (one year) to complete their degrees.
- Architectural analysis and research methodologies: A new course in architectural analysis and research methodologies will be offered as a companion course to the thesis research and design studios to better enable students to position their work within the context of a larger theoretical discourse while giving them the methodological tools for precedent, program and site analysis, to prepare them for the undertaking of an architectural or urban thesis.
- Elective coursework in support of thesis: Students currently take elective coursework as a support for thesis research. The addition of a new core architectural theory course and required elective coursework in the areas of history/theory, building and environmental technologies, digital media, and urbanism and landscape to the undergraduate curriculum in the final year of the BAS program will not only encourage students to explore advanced research areas before they embark on thesis, but will also enable the expansion of offerings through the vertical sharing of 500-level electives as a support for thesis research.
Program Proposals Phase III
Our plans related to Integrated Design will include a graduate program (see Section G).
As part of this process, the Architecture School will also be exploring the potential of post-professional degree programs in additional areas of architectural specialization such as urban design and landscape, cultural history/theory, material technologies and other areas of advanced inquiry that would enable graduate students to further their study at the School.
Funding support for graduate students
The School’s avenues for improving graduate student financial support will be facilitated by ensuring BAS graduates who wish to complete in 12 months can do so, since currently most graduate students are funded in the first 12 months of the MArch.
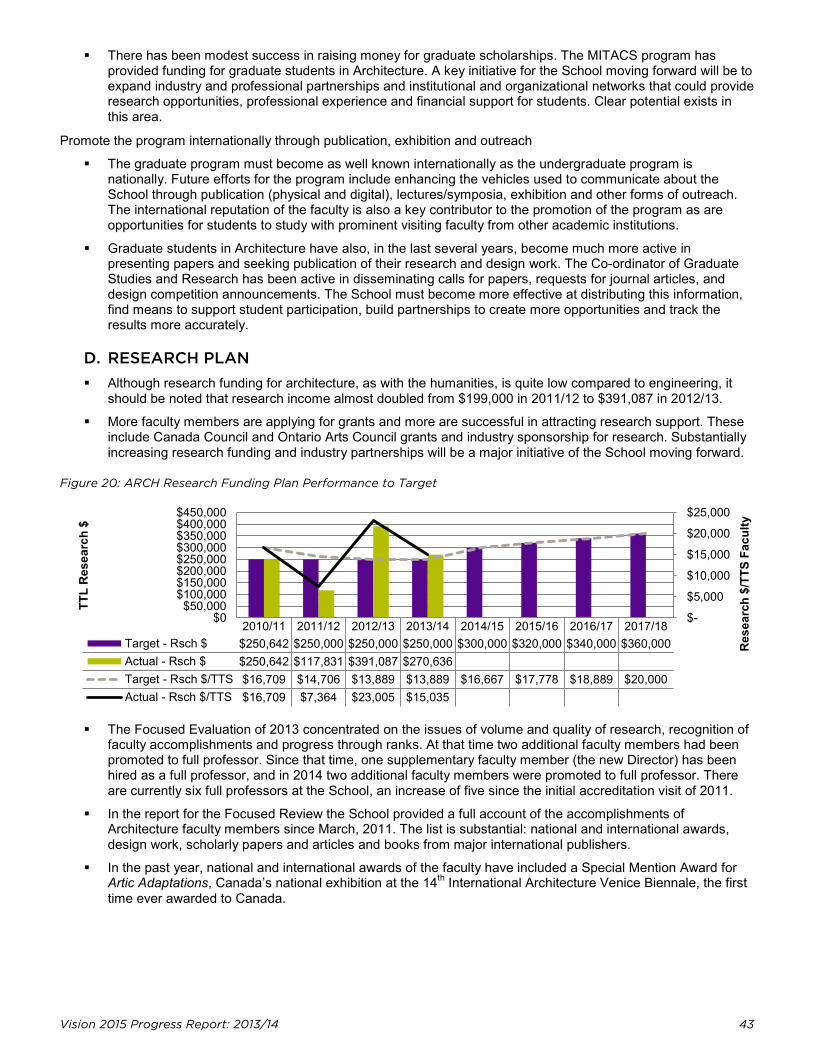
Vision 2015 Progress Report: 2013/14 43
$-
$5,000
$10,000
$15,000
$20,000
$25,000
$0$50,000
$100,000$150,000$200,000$250,000$300,000$350,000$400,000$450,000
Res
earc
h $/
TTS
Facu
lty
TTL
Res
earc
h $
There has been modest success in raising money for graduate scholarships. The MITACS program has provided funding for graduate students in Architecture. A key initiative for the School moving forward will be to expand industry and professional partnerships and institutional and organizational networks that could provide research opportunities, professional experience and financial support for students. Clear potential exists in this area.
Promote the program internationally through publication, exhibition and outreach
The graduate program must become as well known internationally as the undergraduate program is nationally. Future efforts for the program include enhancing the vehicles used to communicate about the School through publication (physical and digital), lectures/symposia, exhibition and other forms of outreach. The international reputation of the faculty is also a key contributor to the promotion of the program as are opportunities for students to study with prominent visiting faculty from other academic institutions.
Graduate students in Architecture have also, in the last several years, become much more active in presenting papers and seeking publication of their research and design work. The Co-ordinator of Graduate Studies and Research has been active in disseminating calls for papers, requests for journal articles, and design competition announcements. The School must become more effective at distributing this information, find means to support student participation, build partnerships to create more opportunities and track the results more accurately.
D. RESEARCH PLAN Although research funding for architecture, as with the humanities, is quite low compared to engineering, it
should be noted that research income almost doubled from $199,000 in 2011/12 to $391,087 in 2012/13.
More faculty members are applying for grants and more are successful in attracting research support. These include Canada Council and Ontario Arts Council grants and industry sponsorship for research. Substantially increasing research funding and industry partnerships will be a major initiative of the School moving forward.
Figure 20: ARCH Research Funding Plan Performance to Target
2010/11 2011/12 2012/13 2013/14 2014/15 2015/16 2016/17 2017/18Target - Rsch $ $250,642 $250,000 $250,000 $250,000 $300,000 $320,000 $340,000 $360,000Actual - Rsch $ $250,642 $117,831 $391,087 $270,636Target - Rsch $/TTS $16,709 $14,706 $13,889 $13,889 $16,667 $17,778 $18,889 $20,000Actual - Rsch $/TTS $16,709 $7,364 $23,005 $15,035
The Focused Evaluation of 2013 concentrated on the issues of volume and quality of research, recognition of faculty accomplishments and progress through ranks. At that time two additional faculty members had been promoted to full professor. Since that time, one supplementary faculty member (the new Director) has been hired as a full professor, and in 2014 two additional faculty members were promoted to full professor. There are currently six full professors at the School, an increase of five since the initial accreditation visit of 2011.
In the report for the Focused Review the School provided a full account of the accomplishments of Architecture faculty members since March, 2011. The list is substantial: national and international awards, design work, scholarly papers and articles and books from major international publishers.
In the past year, national and international awards of the faculty have included a Special Mention Award for Artic Adaptations, Canada’s national exhibition at the 14th International Architecture Venice Biennale, the first time ever awarded to Canada.
44 Waterloo Engineering
E. SPACE PLAN Space limitations have defined the cap on undergraduate and graduate targets for the last five years and will continue to do so until our physical facilities are expanded. In the short term, efforts are being made to more efficiently utilize space within the existing facility through scheduling and the overlap of teaching, studio and graduate office space.
Over the past year, the satellite facility in Rome has undergone substantial renovations to both upgrade and expand the facility that has been supporting Architecture's Rome Program for the last three decades and that will offer new space and facilities to host other Waterloo academic programs. The improvements include necessary structural steel beams, the exposure of original historic ceiling and other details, the resurfacing of walls and refinishing of floors in addition to electrical and technology upgrades and the incorporation of new lighting and furnishing. The renovations, which will be completed in January, 2015, will substantially improve the facility and enhance the already tremendous experience for our students and faculty.
The new programs to be proposed in Integrated Design will require an additional 80,000 square feet of teaching, research and workshop/lab space to be located in Cambridge on a site adjacent to the present School of Architecture in order to share and optimize the use of faculty and facilities.
In addition to the campus expansion in Cambridge, the School is also looking to launch a 5,000 square foot satellite in Toronto—a city which currently operates as an urban laboratory for many of the projects taken on at the School and which provides the vast majority of local co-op placements for our students. This space, which would be primarily for graduate students within architecture and design, would enable the School to expand its reach and range of academic, professional and industry partners, facilitate the incorporation of international visiting faculty, while supporting studios focused on the future of architecture and design.
F. ADVANCEMENT PLAN Architecture alumnus Alison Brooks received the Engineering Alumni Achievement Medal and was named
one of the most influential people in Britain this past year.
Architecture alumni are very connected to the School and the Director is expanding alumni related activities to include alumni events and outreach in relation to ongoing School events such as lecture series, symposia, exhibitions and special events.
Advancement activities for Architecture are expected to substantially increase in intensity in relation to fundraising for the new facilities in Cambridge for the new program to be proposed in Integrated Design.
G. PROPOSED NEW PROGRAM PLAN: INTEGRATED DESIGN In the coming year the School of Architecture will be further developing its proposal for a new Integrated Design program, with both undergraduate and graduate degrees, that focuses on the need for design in the contemporary digital industry. This is the most critical endeavour for the School moving forward.
The intention of the new programs is to substantially increase the student population on the Cambridge campus, enrich the student experience, open new expanded study opportunities for architecture students at the graduate and undergraduate levels, introduce new faculty that will teach across programs, expand physical and fiscal resources, enhance connections with local, regional and national high technology industries and provide other opportunities for undergraduate architecture students to pursue non-professional graduate degrees in a related discipline while providing channels for their emergent entrepreneurial energies.
The new design program will operate at the nexus of industrial design, communication design and interaction design as well as emerging fields in new digital design technologies.
These degree programs will be grounded in coursework in relation to five parallel academic streams in design, culture, technology, communication and entrepreneurship.
As a non-professional program, the Master in Integrated Design will also provide expanded opportunities for undergraduate students across the University to study design at the graduate level.
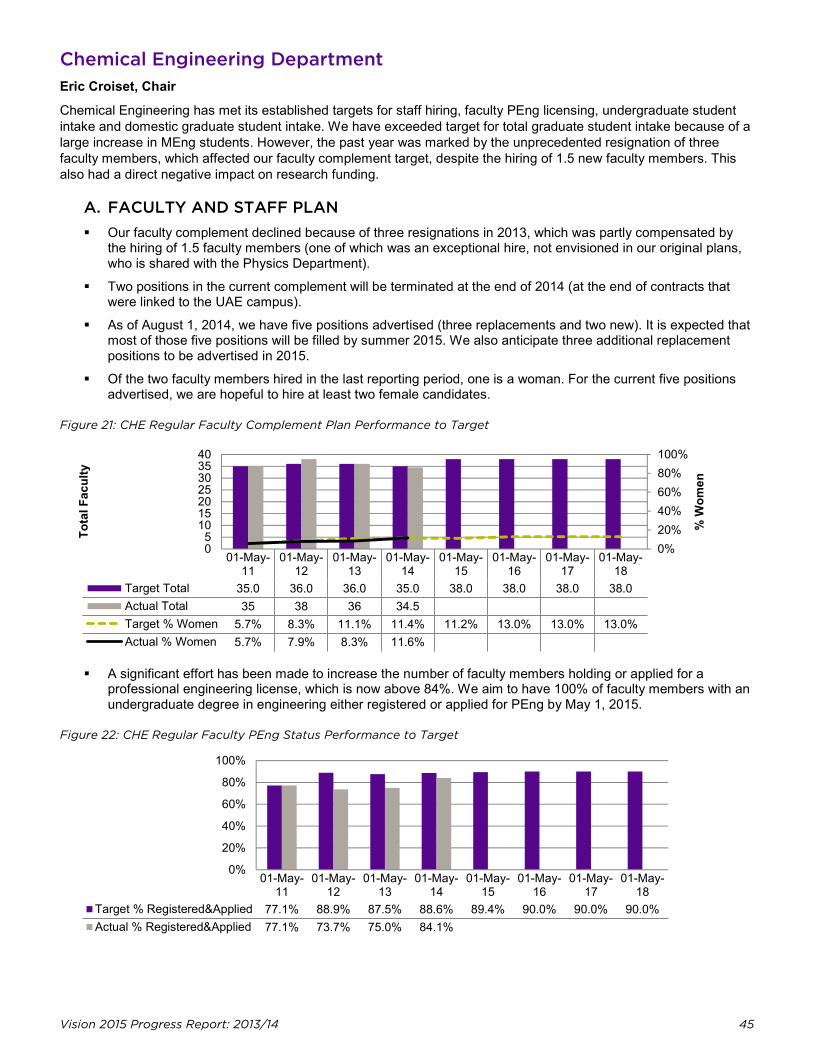
Vision 2015 Progress Report: 2013/14 45
0%20%40%60%80%100%
05
10152025303540
% W
omen
Tota
l Fac
ulty
0%
20%
40%
60%
80%
100%
Chemical Engineering Department Eric Croiset, Chair
Chemical Engineering has met its established targets for staff hiring, faculty PEng licensing, undergraduate student intake and domestic graduate student intake. We have exceeded target for total graduate student intake because of a large increase in MEng students. However, the past year was marked by the unprecedented resignation of three faculty members, which affected our faculty complement target, despite the hiring of 1.5 new faculty members. This also had a direct negative impact on research funding.
A. FACULTY AND STAFF PLAN Our faculty complement declined because of three resignations in 2013, which was partly compensated by
the hiring of 1.5 faculty members (one of which was an exceptional hire, not envisioned in our original plans, who is shared with the Physics Department).
Two positions in the current complement will be terminated at the end of 2014 (at the end of contracts that were linked to the UAE campus).
As of August 1, 2014, we have five positions advertised (three replacements and two new). It is expected that most of those five positions will be filled by summer 2015. We also anticipate three additional replacement positions to be advertised in 2015.
Of the two faculty members hired in the last reporting period, one is a woman. For the current five positions advertised, we are hopeful to hire at least two female candidates.
Figure 21: CHE Regular Faculty Complement Plan Performance to Target
01-May-11
01-May-12
01-May-13
01-May-14
01-May-15
01-May-16
01-May-17
01-May-18
Target Total 35.0 36.0 36.0 35.0 38.0 38.0 38.0 38.0Actual Total 35 38 36 34.5Target % Women 5.7% 8.3% 11.1% 11.4% 11.2% 13.0% 13.0% 13.0%Actual % Women 5.7% 7.9% 8.3% 11.6%
A significant effort has been made to increase the number of faculty members holding or applied for a professional engineering license, which is now above 84%. We aim to have 100% of faculty members with an undergraduate degree in engineering either registered or applied for PEng by May 1, 2015.
Figure 22: CHE Regular Faculty PEng Status Performance to Target
01-May-11
01-May-12
01-May-13
01-May-14
01-May-15
01-May-16
01-May-17
01-May-18
Target % Registered&Applied 77.1% 88.9% 87.5% 88.6% 89.4% 90.0% 90.0% 90.0%Actual % Registered&Applied 77.1% 73.7% 75.0% 84.1%
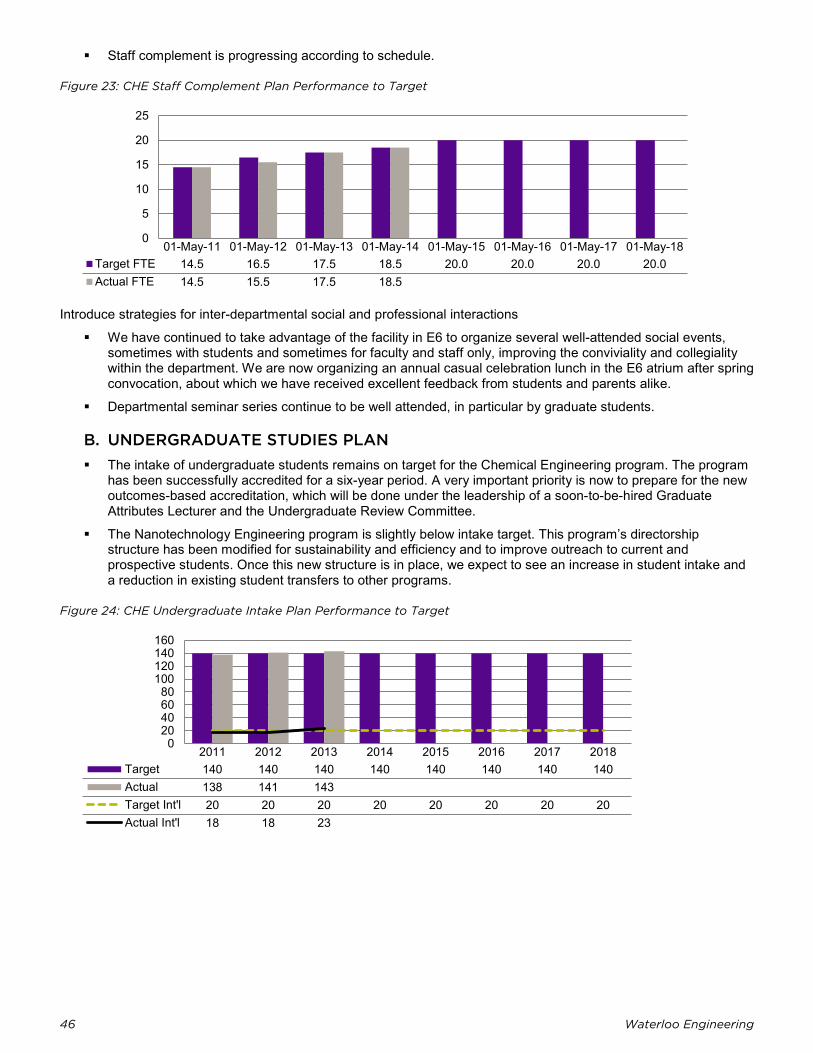
46 Waterloo Engineering
0
5
10
15
20
25
020406080
100120140160
Staff complement is progressing according to schedule.
Figure 23: CHE Staff Complement Plan Performance to Target
01-May-11 01-May-12 01-May-13 01-May-14 01-May-15 01-May-16 01-May-17 01-May-18Target FTE 14.5 16.5 17.5 18.5 20.0 20.0 20.0 20.0Actual FTE 14.5 15.5 17.5 18.5
Introduce strategies for inter-departmental social and professional interactions
We have continued to take advantage of the facility in E6 to organize several well-attended social events, sometimes with students and sometimes for faculty and staff only, improving the conviviality and collegiality within the department. We are now organizing an annual casual celebration lunch in the E6 atrium after spring convocation, about which we have received excellent feedback from students and parents alike.
Departmental seminar series continue to be well attended, in particular by graduate students.
B. UNDERGRADUATE STUDIES PLAN The intake of undergraduate students remains on target for the Chemical Engineering program. The program
has been successfully accredited for a six-year period. A very important priority is now to prepare for the new outcomes-based accreditation, which will be done under the leadership of a soon-to-be-hired Graduate Attributes Lecturer and the Undergraduate Review Committee.
The Nanotechnology Engineering program is slightly below intake target. This program’s directorship structure has been modified for sustainability and efficiency and to improve outreach to current and prospective students. Once this new structure is in place, we expect to see an increase in student intake and a reduction in existing student transfers to other programs.
Figure 24: CHE Undergraduate Intake Plan Performance to Target
2011 2012 2013 2014 2015 2016 2017 2018Target 140 140 140 140 140 140 140 140Actual 138 141 143Target Int'l 20 20 20 20 20 20 20 20Actual Int'l 18 18 23
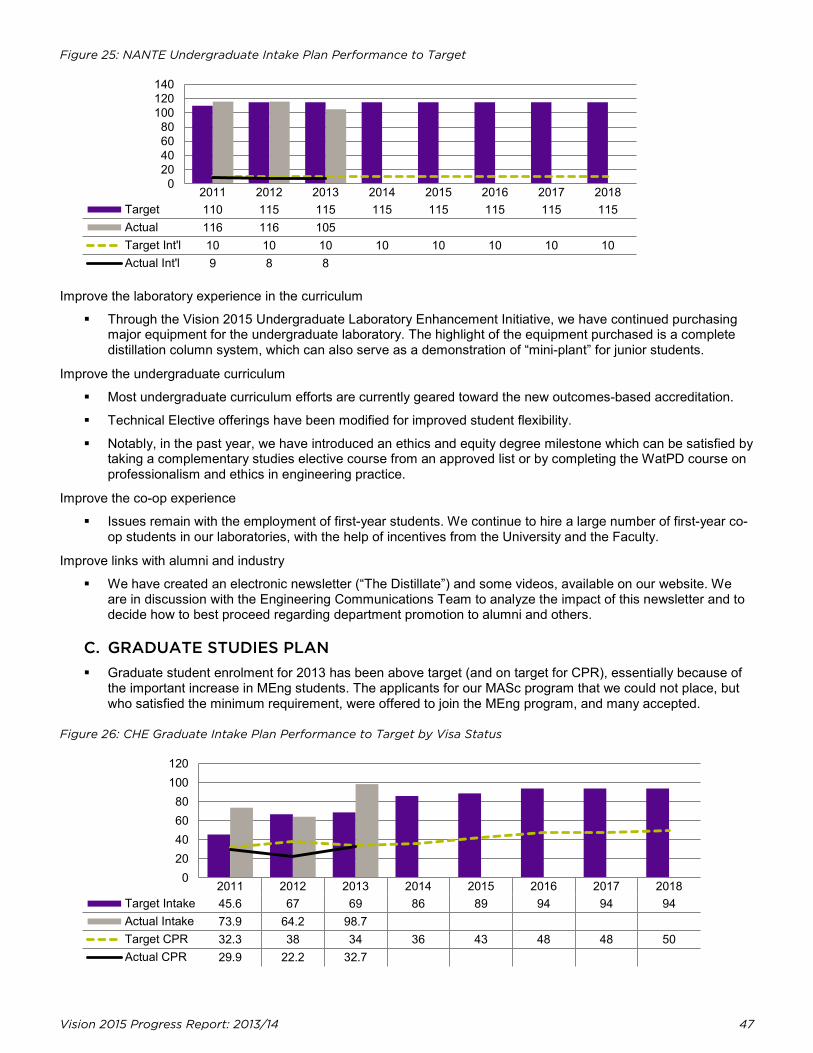
Vision 2015 Progress Report: 2013/14 47
020406080
100120140
020406080
100120
Figure 25: NANTE Undergraduate Intake Plan Performance to Target
2011 2012 2013 2014 2015 2016 2017 2018Target 110 115 115 115 115 115 115 115Actual 116 116 105Target Int'l 10 10 10 10 10 10 10 10Actual Int'l 9 8 8
Improve the laboratory experience in the curriculum
Through the Vision 2015 Undergraduate Laboratory Enhancement Initiative, we have continued purchasing major equipment for the undergraduate laboratory. The highlight of the equipment purchased is a complete distillation column system, which can also serve as a demonstration of “mini-plant” for junior students.
Improve the undergraduate curriculum
Most undergraduate curriculum efforts are currently geared toward the new outcomes-based accreditation.
Technical Elective offerings have been modified for improved student flexibility.
Notably, in the past year, we have introduced an ethics and equity degree milestone which can be satisfied by taking a complementary studies elective course from an approved list or by completing the WatPD course on professionalism and ethics in engineering practice.
Improve the co-op experience
Issues remain with the employment of first-year students. We continue to hire a large number of first-year co-op students in our laboratories, with the help of incentives from the University and the Faculty.
Improve links with alumni and industry
We have created an electronic newsletter (“The Distillate”) and some videos, available on our website. We are in discussion with the Engineering Communications Team to analyze the impact of this newsletter and to decide how to best proceed regarding department promotion to alumni and others.
C. GRADUATE STUDIES PLAN Graduate student enrolment for 2013 has been above target (and on target for CPR), essentially because of
the important increase in MEng students. The applicants for our MASc program that we could not place, but who satisfied the minimum requirement, were offered to join the MEng program, and many accepted.
Figure 26: CHE Graduate Intake Plan Performance to Target by Visa Status
2011 2012 2013 2014 2015 2016 2017 2018Target Intake 45.6 67 69 86 89 94 94 94Actual Intake 73.9 64.2 98.7Target CPR 32.3 38 34 36 43 48 48 50Actual CPR 29.9 22.2 32.7
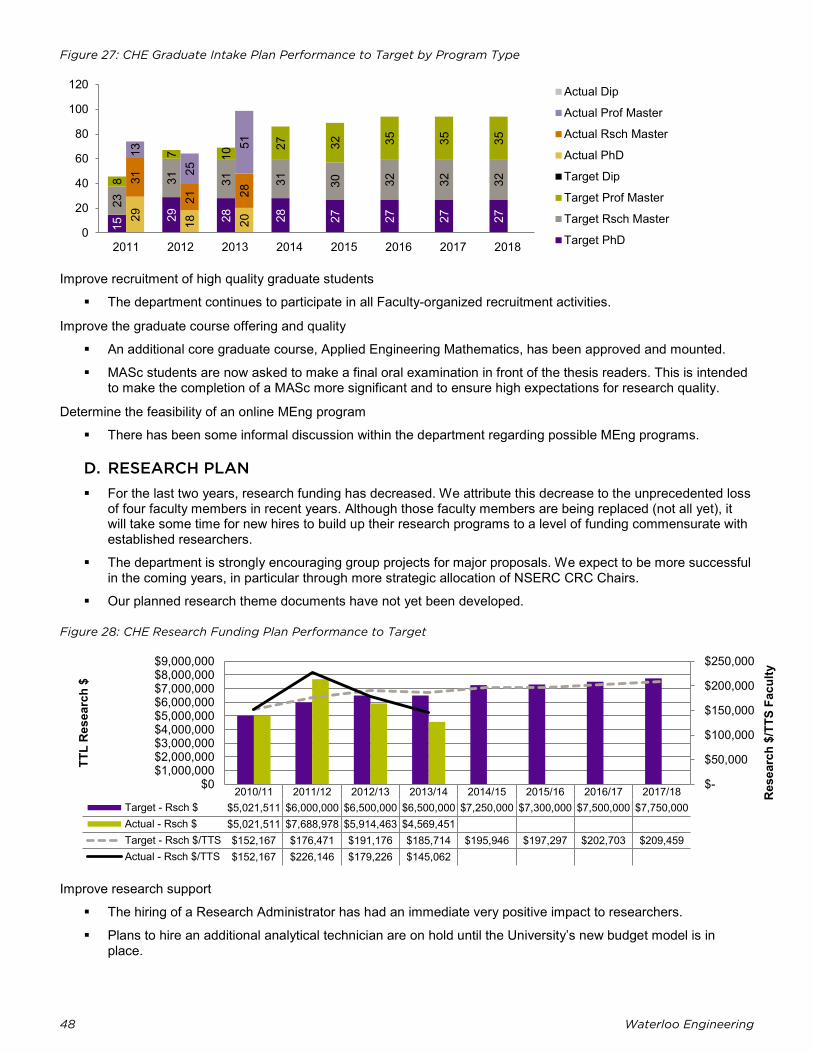
48 Waterloo Engineering
$-
$50,000
$100,000
$150,000
$200,000
$250,000
$0$1,000,000$2,000,000$3,000,000$4,000,000$5,000,000$6,000,000$7,000,000$8,000,000$9,000,000
Res
earc
h $/
TTS
Facu
lty
TTL
Res
earc
h $
Figure 27: CHE Graduate Intake Plan Performance to Target by Program Type
Improve recruitment of high quality graduate students
The department continues to participate in all Faculty-organized recruitment activities.
Improve the graduate course offering and quality
An additional core graduate course, Applied Engineering Mathematics, has been approved and mounted.
MASc students are now asked to make a final oral examination in front of the thesis readers. This is intended to make the completion of a MASc more significant and to ensure high expectations for research quality.
Determine the feasibility of an online MEng program
There has been some informal discussion within the department regarding possible MEng programs.
D. RESEARCH PLAN For the last two years, research funding has decreased. We attribute this decrease to the unprecedented loss
of four faculty members in recent years. Although those faculty members are being replaced (not all yet), it will take some time for new hires to build up their research programs to a level of funding commensurate with established researchers.
The department is strongly encouraging group projects for major proposals. We expect to be more successful in the coming years, in particular through more strategic allocation of NSERC CRC Chairs.
Our planned research theme documents have not yet been developed.
Figure 28: CHE Research Funding Plan Performance to Target
2010/11 2011/12 2012/13 2013/14 2014/15 2015/16 2016/17 2017/18Target - Rsch $ $5,021,511 $6,000,000 $6,500,000 $6,500,000 $7,250,000 $7,300,000 $7,500,000 $7,750,000Actual - Rsch $ $5,021,511 $7,688,978 $5,914,463 $4,569,451Target - Rsch $/TTS $152,167 $176,471 $191,176 $185,714 $195,946 $197,297 $202,703 $209,459Actual - Rsch $/TTS $152,167 $226,146 $179,226 $145,062
Improve research support
The hiring of a Research Administrator has had an immediate very positive impact to researchers.
Plans to hire an additional analytical technician are on hold until the University’s new budget model is in place.
15 29
28
28
27
27
27
27 23
31
31
31
30
32
32
32
8
7 10 27
32
35
35
35
29
18
20
31
21 28
13
25
51
2011 2012 2013 2014 2015 2016 2017 20180
20
40
60
80
100
120 Actual Dip
Actual Prof Master
Actual Rsch Master
Actual PhD
Target Dip
Target Prof Master
Target Rsch Master
Target PhD
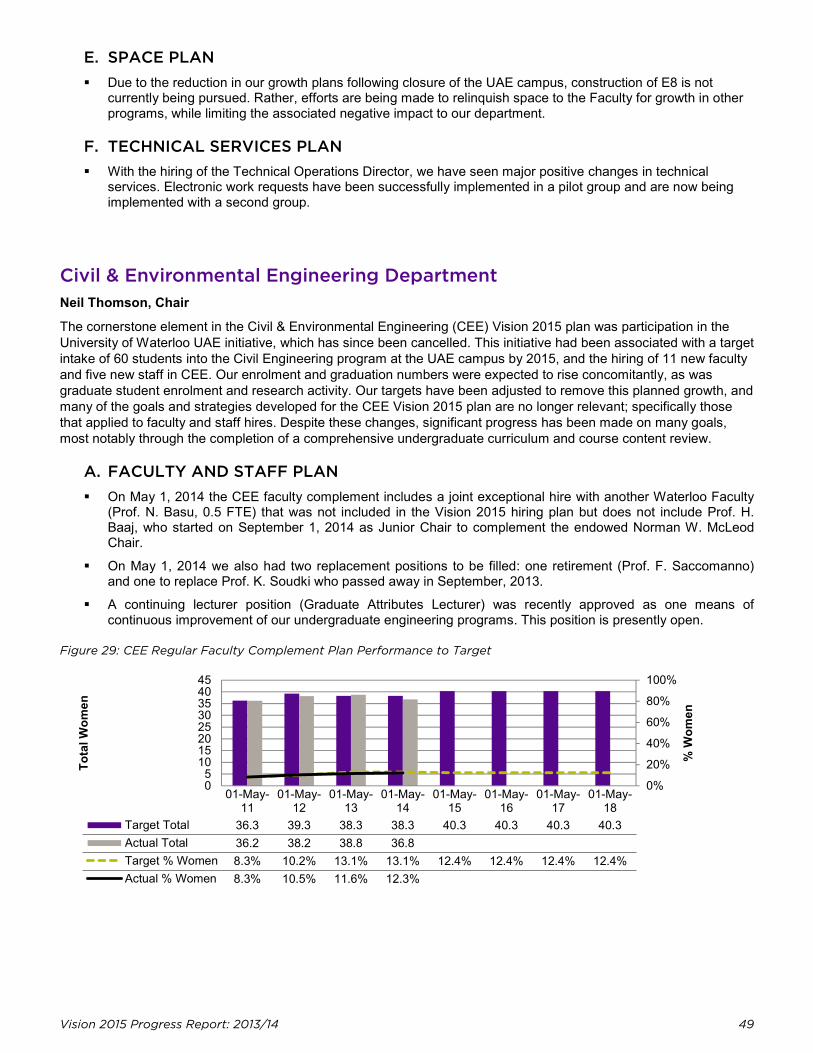
Vision 2015 Progress Report: 2013/14 49
0%
20%
40%
60%
80%
100%
05
1015202530354045
% W
omen
Tota
l Wom
en
E. SPACE PLAN Due to the reduction in our growth plans following closure of the UAE campus, construction of E8 is not
currently being pursued. Rather, efforts are being made to relinquish space to the Faculty for growth in other programs, while limiting the associated negative impact to our department.
F. TECHNICAL SERVICES PLAN With the hiring of the Technical Operations Director, we have seen major positive changes in technical
services. Electronic work requests have been successfully implemented in a pilot group and are now being implemented with a second group.
Civil & Environmental Engineering Department Neil Thomson, Chair
The cornerstone element in the Civil & Environmental Engineering (CEE) Vision 2015 plan was participation in the University of Waterloo UAE initiative, which has since been cancelled. This initiative had been associated with a target intake of 60 students into the Civil Engineering program at the UAE campus by 2015, and the hiring of 11 new faculty and five new staff in CEE. Our enrolment and graduation numbers were expected to rise concomitantly, as was graduate student enrolment and research activity. Our targets have been adjusted to remove this planned growth, and many of the goals and strategies developed for the CEE Vision 2015 plan are no longer relevant; specifically those that applied to faculty and staff hires. Despite these changes, significant progress has been made on many goals, most notably through the completion of a comprehensive undergraduate curriculum and course content review.
A. FACULTY AND STAFF PLAN On May 1, 2014 the CEE faculty complement includes a joint exceptional hire with another Waterloo Faculty
(Prof. N. Basu, 0.5 FTE) that was not included in the Vision 2015 hiring plan but does not include Prof. H. Baaj, who started on September 1, 2014 as Junior Chair to complement the endowed Norman W. McLeod Chair.
On May 1, 2014 we also had two replacement positions to be filled: one retirement (Prof. F. Saccomanno) and one to replace Prof. K. Soudki who passed away in September, 2013.
A continuing lecturer position (Graduate Attributes Lecturer) was recently approved as one means of continuous improvement of our undergraduate engineering programs. This position is presently open.
Figure 29: CEE Regular Faculty Complement Plan Performance to Target
01-May-11
01-May-12
01-May-13
01-May-14
01-May-15
01-May-16
01-May-17
01-May-18
Target Total 36.3 39.3 38.3 38.3 40.3 40.3 40.3 40.3Actual Total 36.2 38.2 38.8 36.8Target % Women 8.3% 10.2% 13.1% 13.1% 12.4% 12.4% 12.4% 12.4%Actual % Women 8.3% 10.5% 11.6% 12.3%
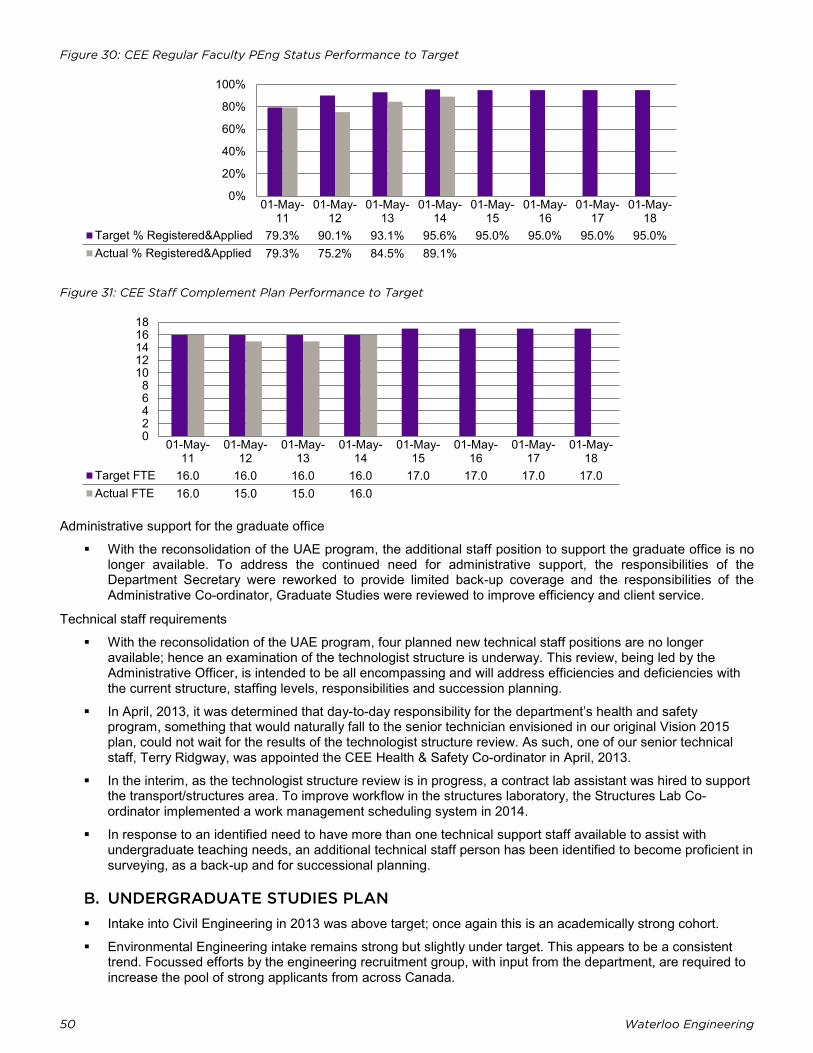
50 Waterloo Engineering
0%
20%
40%
60%
80%
100%
02468
1012141618
Figure 30: CEE Regular Faculty PEng Status Performance to Target
01-May-11
01-May-12
01-May-13
01-May-14
01-May-15
01-May-16
01-May-17
01-May-18
Target % Registered&Applied 79.3% 90.1% 93.1% 95.6% 95.0% 95.0% 95.0% 95.0%Actual % Registered&Applied 79.3% 75.2% 84.5% 89.1%
Figure 31: CEE Staff Complement Plan Performance to Target
01-May-11
01-May-12
01-May-13
01-May-14
01-May-15
01-May-16
01-May-17
01-May-18
Target FTE 16.0 16.0 16.0 16.0 17.0 17.0 17.0 17.0Actual FTE 16.0 15.0 15.0 16.0
Administrative support for the graduate office
With the reconsolidation of the UAE program, the additional staff position to support the graduate office is no longer available. To address the continued need for administrative support, the responsibilities of the Department Secretary were reworked to provide limited back-up coverage and the responsibilities of the Administrative Co-ordinator, Graduate Studies were reviewed to improve efficiency and client service.
Technical staff requirements
With the reconsolidation of the UAE program, four planned new technical staff positions are no longer available; hence an examination of the technologist structure is underway. This review, being led by the Administrative Officer, is intended to be all encompassing and will address efficiencies and deficiencies with the current structure, staffing levels, responsibilities and succession planning.
In April, 2013, it was determined that day-to-day responsibility for the department’s health and safety program, something that would naturally fall to the senior technician envisioned in our original Vision 2015 plan, could not wait for the results of the technologist structure review. As such, one of our senior technical staff, Terry Ridgway, was appointed the CEE Health & Safety Co-ordinator in April, 2013.
In the interim, as the technologist structure review is in progress, a contract lab assistant was hired to support the transport/structures area. To improve workflow in the structures laboratory, the Structures Lab Co-ordinator implemented a work management scheduling system in 2014.
In response to an identified need to have more than one technical support staff available to assist with undergraduate teaching needs, an additional technical staff person has been identified to become proficient in surveying, as a back-up and for successional planning.
B. UNDERGRADUATE STUDIES PLAN Intake into Civil Engineering in 2013 was above target; once again this is an academically strong cohort.
Environmental Engineering intake remains strong but slightly under target. This appears to be a consistent trend. Focussed efforts by the engineering recruitment group, with input from the department, are required to increase the pool of strong applicants from across Canada.
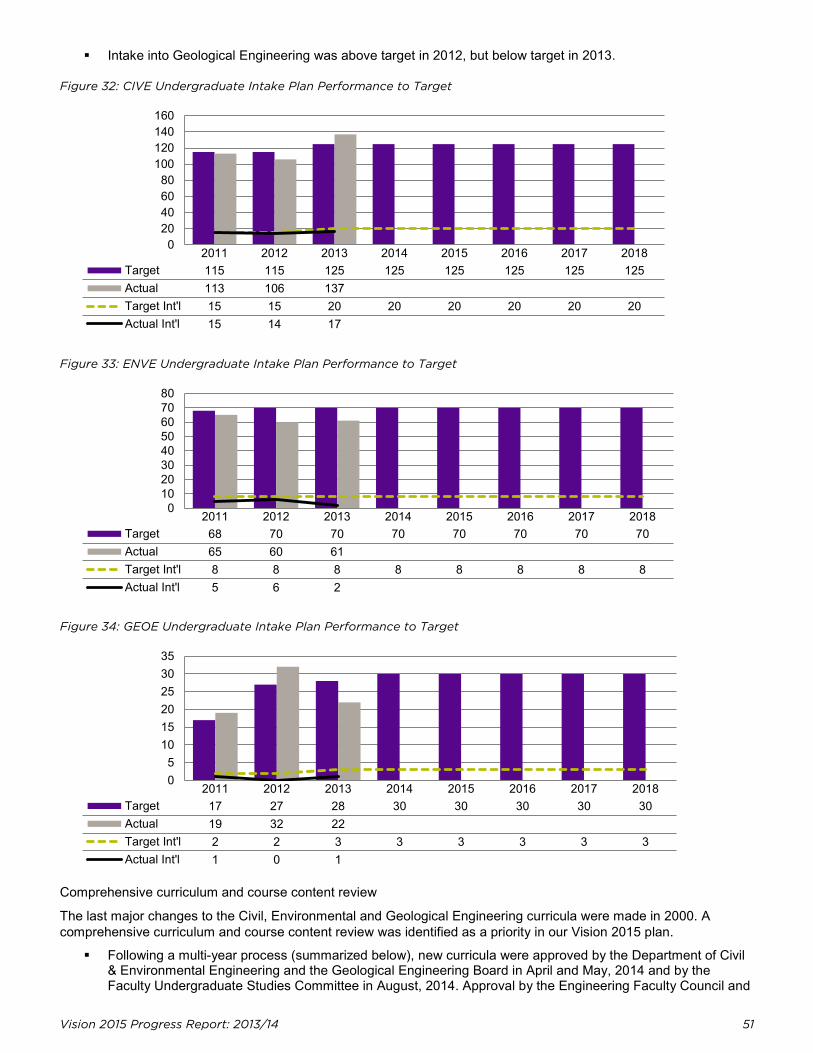
Vision 2015 Progress Report: 2013/14 51
020406080
100120140160
01020304050607080
05
101520253035
Intake into Geological Engineering was above target in 2012, but below target in 2013.
Figure 32: CIVE Undergraduate Intake Plan Performance to Target
2011 2012 2013 2014 2015 2016 2017 2018Target 115 115 125 125 125 125 125 125Actual 113 106 137Target Int'l 15 15 20 20 20 20 20 20Actual Int'l 15 14 17
Figure 33: ENVE Undergraduate Intake Plan Performance to Target
2011 2012 2013 2014 2015 2016 2017 2018Target 68 70 70 70 70 70 70 70Actual 65 60 61Target Int'l 8 8 8 8 8 8 8 8Actual Int'l 5 6 2
Figure 34: GEOE Undergraduate Intake Plan Performance to Target
2011 2012 2013 2014 2015 2016 2017 2018Target 17 27 28 30 30 30 30 30Actual 19 32 22Target Int'l 2 2 3 3 3 3 3 3Actual Int'l 1 0 1
Comprehensive curriculum and course content review
The last major changes to the Civil, Environmental and Geological Engineering curricula were made in 2000. A comprehensive curriculum and course content review was identified as a priority in our Vision 2015 plan.
Following a multi-year process (summarized below), new curricula were approved by the Department of Civil & Environmental Engineering and the Geological Engineering Board in April and May, 2014 and by the Faculty Undergraduate Studies Committee in August, 2014. Approval by the Engineering Faculty Council and
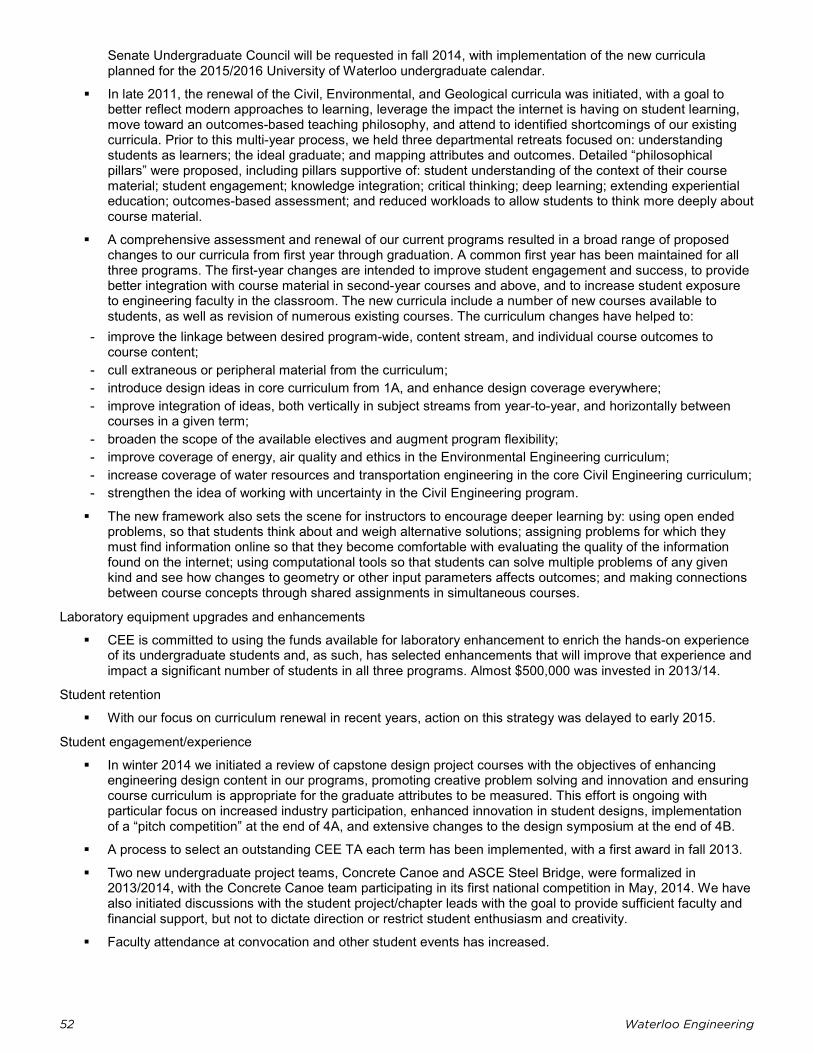
52 Waterloo Engineering
Senate Undergraduate Council will be requested in fall 2014, with implementation of the new curricula planned for the 2015/2016 University of Waterloo undergraduate calendar.
In late 2011, the renewal of the Civil, Environmental, and Geological curricula was initiated, with a goal to better reflect modern approaches to learning, leverage the impact the internet is having on student learning, move toward an outcomes-based teaching philosophy, and attend to identified shortcomings of our existing curricula. Prior to this multi-year process, we held three departmental retreats focused on: understanding students as learners; the ideal graduate; and mapping attributes and outcomes. Detailed “philosophical pillars” were proposed, including pillars supportive of: student understanding of the context of their course material; student engagement; knowledge integration; critical thinking; deep learning; extending experiential education; outcomes-based assessment; and reduced workloads to allow students to think more deeply about course material.
A comprehensive assessment and renewal of our current programs resulted in a broad range of proposed changes to our curricula from first year through graduation. A common first year has been maintained for all three programs. The first-year changes are intended to improve student engagement and success, to provide better integration with course material in second-year courses and above, and to increase student exposure to engineering faculty in the classroom. The new curricula include a number of new courses available to students, as well as revision of numerous existing courses. The curriculum changes have helped to:
- improve the linkage between desired program-wide, content stream, and individual course outcomes to course content;
- cull extraneous or peripheral material from the curriculum; - introduce design ideas in core curriculum from 1A, and enhance design coverage everywhere; - improve integration of ideas, both vertically in subject streams from year-to-year, and horizontally between
courses in a given term; - broaden the scope of the available electives and augment program flexibility; - improve coverage of energy, air quality and ethics in the Environmental Engineering curriculum; - increase coverage of water resources and transportation engineering in the core Civil Engineering curriculum; - strengthen the idea of working with uncertainty in the Civil Engineering program.
The new framework also sets the scene for instructors to encourage deeper learning by: using open ended problems, so that students think about and weigh alternative solutions; assigning problems for which they must find information online so that they become comfortable with evaluating the quality of the information found on the internet; using computational tools so that students can solve multiple problems of any given kind and see how changes to geometry or other input parameters affects outcomes; and making connections between course concepts through shared assignments in simultaneous courses.
Laboratory equipment upgrades and enhancements
CEE is committed to using the funds available for laboratory enhancement to enrich the hands-on experience of its undergraduate students and, as such, has selected enhancements that will improve that experience and impact a significant number of students in all three programs. Almost $500,000 was invested in 2013/14.
Student retention
With our focus on curriculum renewal in recent years, action on this strategy was delayed to early 2015.
Student engagement/experience
In winter 2014 we initiated a review of capstone design project courses with the objectives of enhancing engineering design content in our programs, promoting creative problem solving and innovation and ensuring course curriculum is appropriate for the graduate attributes to be measured. This effort is ongoing with particular focus on increased industry participation, enhanced innovation in student designs, implementation of a “pitch competition” at the end of 4A, and extensive changes to the design symposium at the end of 4B.
A process to select an outstanding CEE TA each term has been implemented, with a first award in fall 2013.
Two new undergraduate project teams, Concrete Canoe and ASCE Steel Bridge, were formalized in 2013/2014, with the Concrete Canoe team participating in its first national competition in May, 2014. We have also initiated discussions with the student project/chapter leads with the goal to provide sufficient faculty and financial support, but not to dictate direction or restrict student enthusiasm and creativity.
Faculty attendance at convocation and other student events has increased.
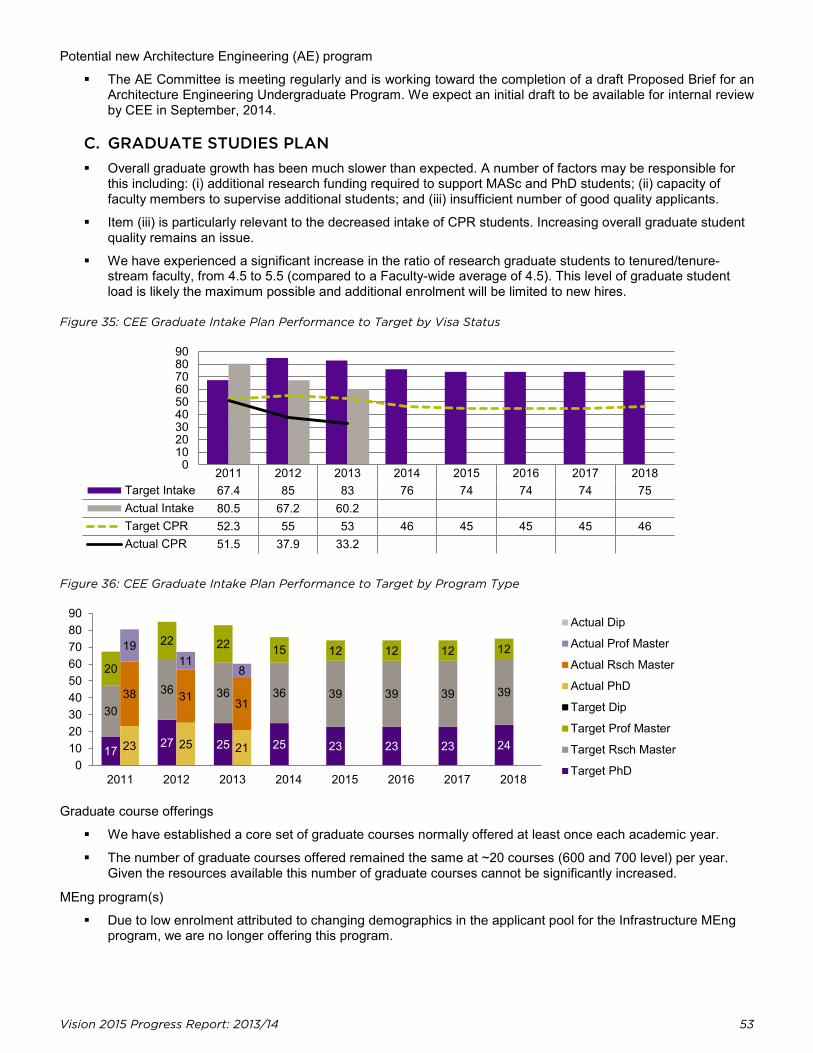
Vision 2015 Progress Report: 2013/14 53
0102030405060708090
Potential new Architecture Engineering (AE) program
The AE Committee is meeting regularly and is working toward the completion of a draft Proposed Brief for an Architecture Engineering Undergraduate Program. We expect an initial draft to be available for internal review by CEE in September, 2014.
C. GRADUATE STUDIES PLAN Overall graduate growth has been much slower than expected. A number of factors may be responsible for
this including: (i) additional research funding required to support MASc and PhD students; (ii) capacity of faculty members to supervise additional students; and (iii) insufficient number of good quality applicants.
Item (iii) is particularly relevant to the decreased intake of CPR students. Increasing overall graduate student quality remains an issue.
We have experienced a significant increase in the ratio of research graduate students to tenured/tenure-stream faculty, from 4.5 to 5.5 (compared to a Faculty-wide average of 4.5). This level of graduate student load is likely the maximum possible and additional enrolment will be limited to new hires.
Figure 35: CEE Graduate Intake Plan Performance to Target by Visa Status
2011 2012 2013 2014 2015 2016 2017 2018Target Intake 67.4 85 83 76 74 74 74 75Actual Intake 80.5 67.2 60.2Target CPR 52.3 55 53 46 45 45 45 46Actual CPR 51.5 37.9 33.2
Figure 36: CEE Graduate Intake Plan Performance to Target by Program Type
Graduate course offerings
We have established a core set of graduate courses normally offered at least once each academic year.
The number of graduate courses offered remained the same at ~20 courses (600 and 700 level) per year. Given the resources available this number of graduate courses cannot be significantly increased.
MEng program(s)
Due to low enrolment attributed to changing demographics in the applicant pool for the Infrastructure MEng program, we are no longer offering this program.
17 27 25 25 23 23 23 24
30
36 36 36 39 39 39 39
20
22 22 15 12 12 12 12
23 25 21
38 31 31
19 11
8
2011 2012 2013 2014 2015 2016 2017 20180
102030405060708090
Actual Dip
Actual Prof Master
Actual Rsch Master
Actual PhD
Target Dip
Target Prof Master
Target Rsch Master
Target PhD
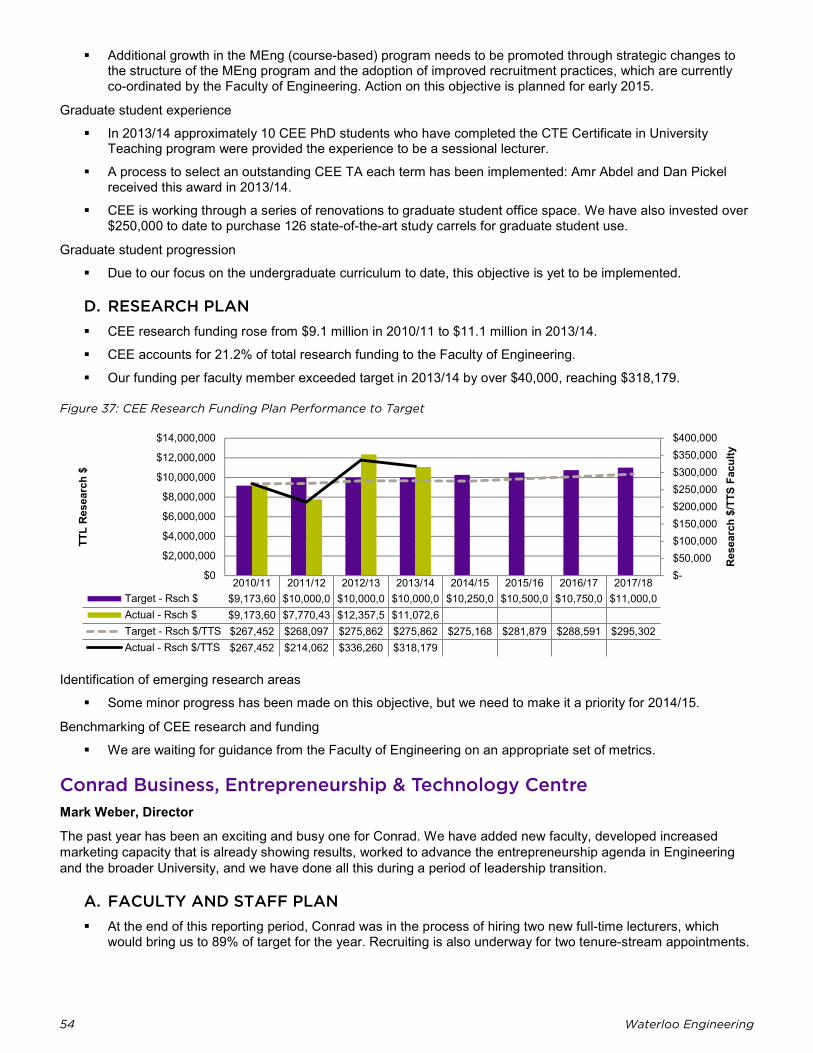
54 Waterloo Engineering
$- $50,000 $100,000 $150,000 $200,000 $250,000 $300,000 $350,000 $400,000
$0
$2,000,000
$4,000,000
$6,000,000
$8,000,000
$10,000,000
$12,000,000
$14,000,000
Res
earc
h $/
TTS
Facu
lty
TTL
Res
earc
h $
Additional growth in the MEng (course-based) program needs to be promoted through strategic changes to the structure of the MEng program and the adoption of improved recruitment practices, which are currently co-ordinated by the Faculty of Engineering. Action on this objective is planned for early 2015.
Graduate student experience
In 2013/14 approximately 10 CEE PhD students who have completed the CTE Certificate in University Teaching program were provided the experience to be a sessional lecturer.
A process to select an outstanding CEE TA each term has been implemented: Amr Abdel and Dan Pickel received this award in 2013/14.
CEE is working through a series of renovations to graduate student office space. We have also invested over $250,000 to date to purchase 126 state-of-the-art study carrels for graduate student use.
Graduate student progression
Due to our focus on the undergraduate curriculum to date, this objective is yet to be implemented.
D. RESEARCH PLAN CEE research funding rose from $9.1 million in 2010/11 to $11.1 million in 2013/14.
CEE accounts for 21.2% of total research funding to the Faculty of Engineering.
Our funding per faculty member exceeded target in 2013/14 by over $40,000, reaching $318,179.
Figure 37: CEE Research Funding Plan Performance to Target
2010/11 2011/12 2012/13 2013/14 2014/15 2015/16 2016/17 2017/18Target - Rsch $ $9,173,60 $10,000,0 $10,000,0 $10,000,0 $10,250,0 $10,500,0 $10,750,0 $11,000,0Actual - Rsch $ $9,173,60 $7,770,43 $12,357,5 $11,072,6Target - Rsch $/TTS $267,452 $268,097 $275,862 $275,862 $275,168 $281,879 $288,591 $295,302Actual - Rsch $/TTS $267,452 $214,062 $336,260 $318,179
Identification of emerging research areas
Some minor progress has been made on this objective, but we need to make it a priority for 2014/15.
Benchmarking of CEE research and funding
We are waiting for guidance from the Faculty of Engineering on an appropriate set of metrics.
Conrad Business, Entrepreneurship & Technology Centre Mark Weber, Director
The past year has been an exciting and busy one for Conrad. We have added new faculty, developed increased marketing capacity that is already showing results, worked to advance the entrepreneurship agenda in Engineering and the broader University, and we have done all this during a period of leadership transition.
A. FACULTY AND STAFF PLAN At the end of this reporting period, Conrad was in the process of hiring two new full-time lecturers, which
would bring us to 89% of target for the year. Recruiting is also underway for two tenure-stream appointments.
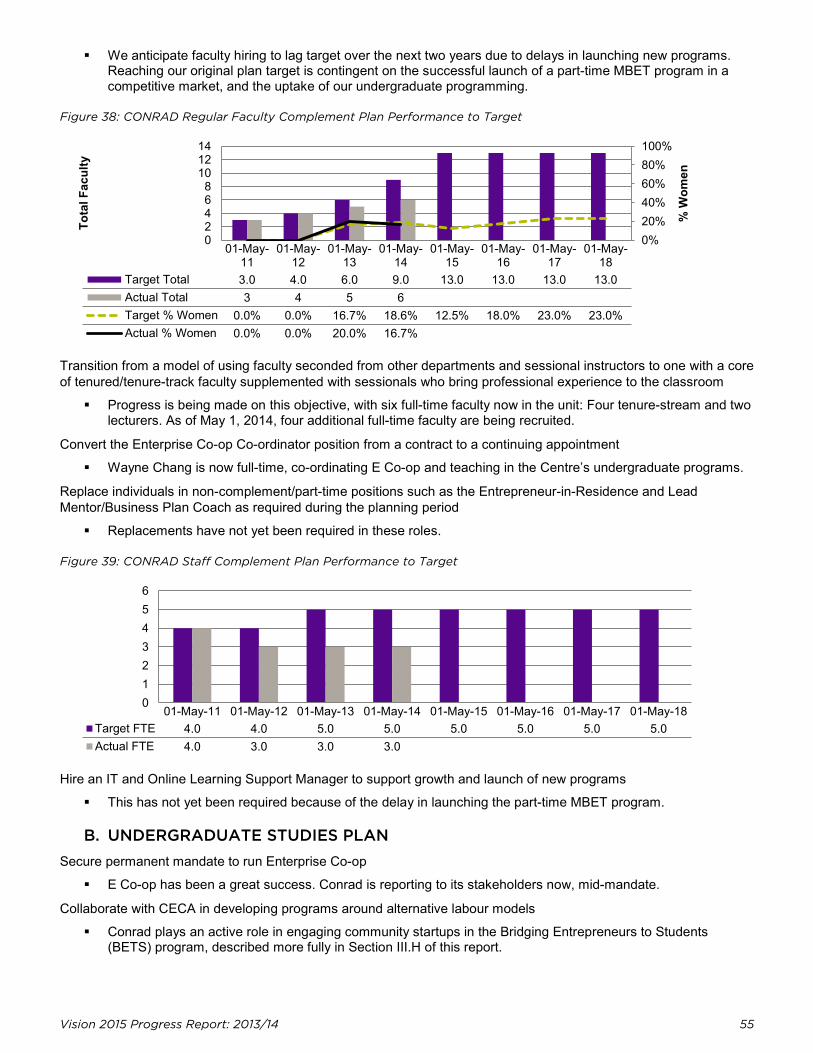
Vision 2015 Progress Report: 2013/14 55
0%20%40%60%80%100%
02468
101214
% W
omen
Tota
l Fac
ulty
0123456
We anticipate faculty hiring to lag target over the next two years due to delays in launching new programs. Reaching our original plan target is contingent on the successful launch of a part-time MBET program in a competitive market, and the uptake of our undergraduate programming.
Figure 38: CONRAD Regular Faculty Complement Plan Performance to Target
01-May-11
01-May-12
01-May-13
01-May-14
01-May-15
01-May-16
01-May-17
01-May-18
Target Total 3.0 4.0 6.0 9.0 13.0 13.0 13.0 13.0Actual Total 3 4 5 6Target % Women 0.0% 0.0% 16.7% 18.6% 12.5% 18.0% 23.0% 23.0%Actual % Women 0.0% 0.0% 20.0% 16.7%
Transition from a model of using faculty seconded from other departments and sessional instructors to one with a core of tenured/tenure-track faculty supplemented with sessionals who bring professional experience to the classroom
Progress is being made on this objective, with six full-time faculty now in the unit: Four tenure-stream and two lecturers. As of May 1, 2014, four additional full-time faculty are being recruited.
Convert the Enterprise Co-op Co-ordinator position from a contract to a continuing appointment
Wayne Chang is now full-time, co-ordinating E Co-op and teaching in the Centre’s undergraduate programs.
Replace individuals in non-complement/part-time positions such as the Entrepreneur-in-Residence and Lead Mentor/Business Plan Coach as required during the planning period
Replacements have not yet been required in these roles.
Figure 39: CONRAD Staff Complement Plan Performance to Target
01-May-11 01-May-12 01-May-13 01-May-14 01-May-15 01-May-16 01-May-17 01-May-18Target FTE 4.0 4.0 5.0 5.0 5.0 5.0 5.0 5.0Actual FTE 4.0 3.0 3.0 3.0
Hire an IT and Online Learning Support Manager to support growth and launch of new programs
This has not yet been required because of the delay in launching the part-time MBET program.
B. UNDERGRADUATE STUDIES PLAN Secure permanent mandate to run Enterprise Co-op
E Co-op has been a great success. Conrad is reporting to its stakeholders now, mid-mandate.
Collaborate with CECA in developing programs around alternative labour models
Conrad plays an active role in engaging community startups in the Bridging Entrepreneurs to Students (BETS) program, described more fully in Section III.H of this report.
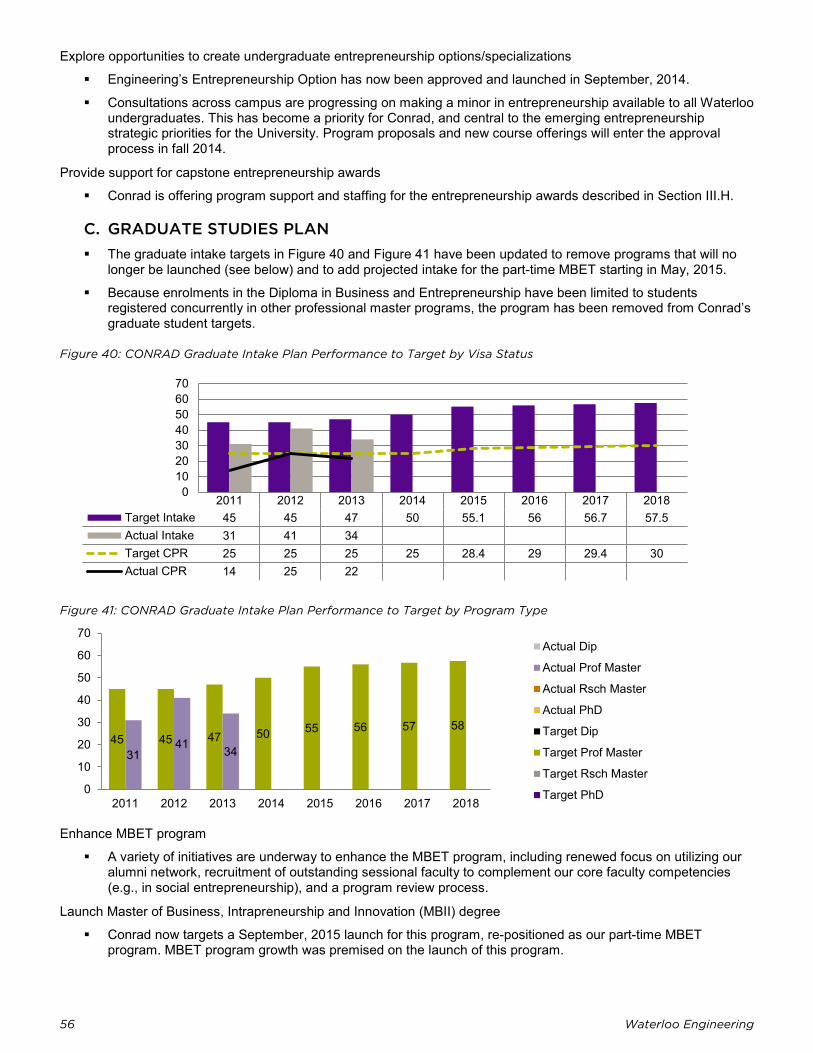
56 Waterloo Engineering
010203040506070
Explore opportunities to create undergraduate entrepreneurship options/specializations
Engineering’s Entrepreneurship Option has now been approved and launched in September, 2014.
Consultations across campus are progressing on making a minor in entrepreneurship available to all Waterloo undergraduates. This has become a priority for Conrad, and central to the emerging entrepreneurship strategic priorities for the University. Program proposals and new course offerings will enter the approval process in fall 2014.
Provide support for capstone entrepreneurship awards
Conrad is offering program support and staffing for the entrepreneurship awards described in Section III.H.
C. GRADUATE STUDIES PLAN The graduate intake targets in Figure 40 and Figure 41 have been updated to remove programs that will no
longer be launched (see below) and to add projected intake for the part-time MBET starting in May, 2015.
Because enrolments in the Diploma in Business and Entrepreneurship have been limited to students registered concurrently in other professional master programs, the program has been removed from Conrad’s graduate student targets.
Figure 40: CONRAD Graduate Intake Plan Performance to Target by Visa Status
2011 2012 2013 2014 2015 2016 2017 2018Target Intake 45 45 47 50 55.1 56 56.7 57.5Actual Intake 31 41 34Target CPR 25 25 25 25 28.4 29 29.4 30Actual CPR 14 25 22
Figure 41: CONRAD Graduate Intake Plan Performance to Target by Program Type
Enhance MBET program
A variety of initiatives are underway to enhance the MBET program, including renewed focus on utilizing our alumni network, recruitment of outstanding sessional faculty to complement our core faculty competencies (e.g., in social entrepreneurship), and a program review process.
Launch Master of Business, Intrapreneurship and Innovation (MBII) degree
Conrad now targets a September, 2015 launch for this program, re-positioned as our part-time MBET program. MBET program growth was premised on the launch of this program.
45 45 47 50 55 56 57 58
31 41 34
2011 2012 2013 2014 2015 2016 2017 20180
10
20
30
40
50
60
70Actual Dip
Actual Prof Master
Actual Rsch Master
Actual PhD
Target Dip
Target Prof Master
Target Rsch Master
Target PhD
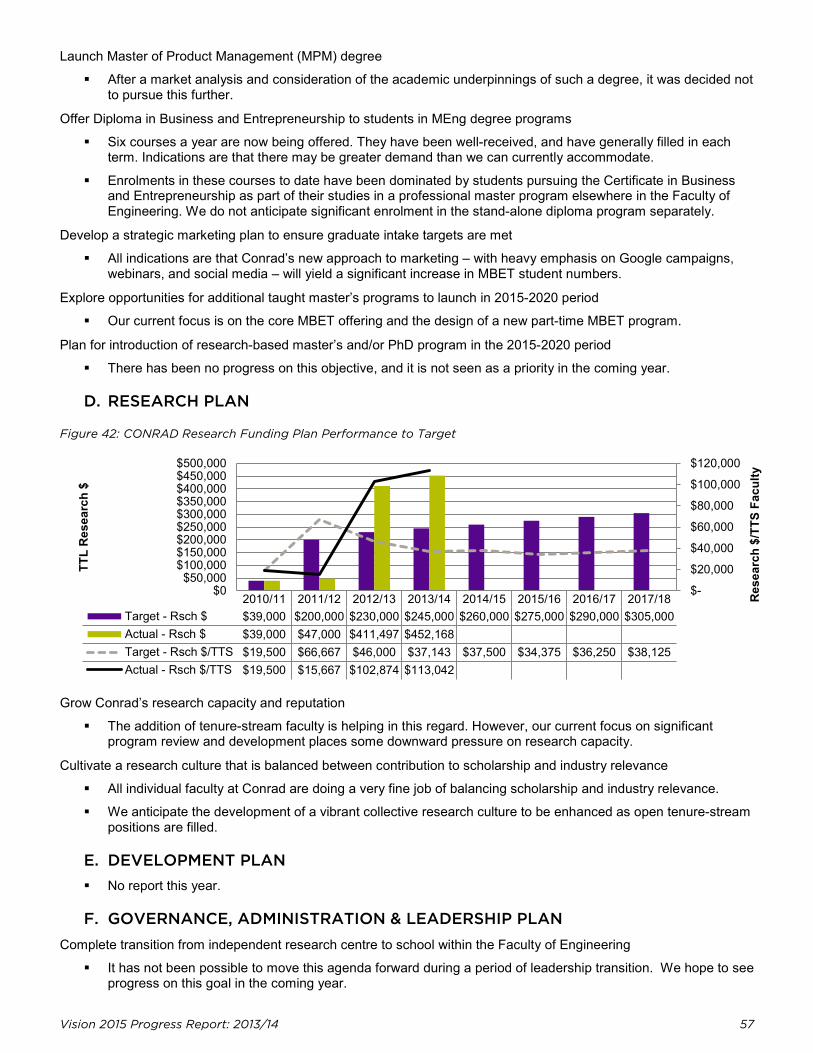
Vision 2015 Progress Report: 2013/14 57
$-
$20,000
$40,000
$60,000
$80,000
$100,000
$120,000
$0$50,000
$100,000$150,000$200,000$250,000$300,000$350,000$400,000$450,000$500,000
Res
earc
h $/
TTS
Facu
lty
TTL
Res
earc
h $
Launch Master of Product Management (MPM) degree
After a market analysis and consideration of the academic underpinnings of such a degree, it was decided not to pursue this further.
Offer Diploma in Business and Entrepreneurship to students in MEng degree programs
Six courses a year are now being offered. They have been well-received, and have generally filled in each term. Indications are that there may be greater demand than we can currently accommodate.
Enrolments in these courses to date have been dominated by students pursuing the Certificate in Business and Entrepreneurship as part of their studies in a professional master program elsewhere in the Faculty of Engineering. We do not anticipate significant enrolment in the stand-alone diploma program separately.
Develop a strategic marketing plan to ensure graduate intake targets are met
All indications are that Conrad’s new approach to marketing – with heavy emphasis on Google campaigns, webinars, and social media – will yield a significant increase in MBET student numbers.
Explore opportunities for additional taught master’s programs to launch in 2015-2020 period
Our current focus is on the core MBET offering and the design of a new part-time MBET program.
Plan for introduction of research-based master’s and/or PhD program in the 2015-2020 period
There has been no progress on this objective, and it is not seen as a priority in the coming year.
D. RESEARCH PLAN
Figure 42: CONRAD Research Funding Plan Performance to Target
2010/11 2011/12 2012/13 2013/14 2014/15 2015/16 2016/17 2017/18Target - Rsch $ $39,000 $200,000 $230,000 $245,000 $260,000 $275,000 $290,000 $305,000Actual - Rsch $ $39,000 $47,000 $411,497 $452,168Target - Rsch $/TTS $19,500 $66,667 $46,000 $37,143 $37,500 $34,375 $36,250 $38,125Actual - Rsch $/TTS $19,500 $15,667 $102,874 $113,042
Grow Conrad’s research capacity and reputation
The addition of tenure-stream faculty is helping in this regard. However, our current focus on significant program review and development places some downward pressure on research capacity.
Cultivate a research culture that is balanced between contribution to scholarship and industry relevance
All individual faculty at Conrad are doing a very fine job of balancing scholarship and industry relevance.
We anticipate the development of a vibrant collective research culture to be enhanced as open tenure-stream positions are filled.
E. DEVELOPMENT PLAN No report this year.
F. GOVERNANCE, ADMINISTRATION & LEADERSHIP PLAN Complete transition from independent research centre to school within the Faculty of Engineering
It has not been possible to move this agenda forward during a period of leadership transition. We hope to see progress on this goal in the coming year.
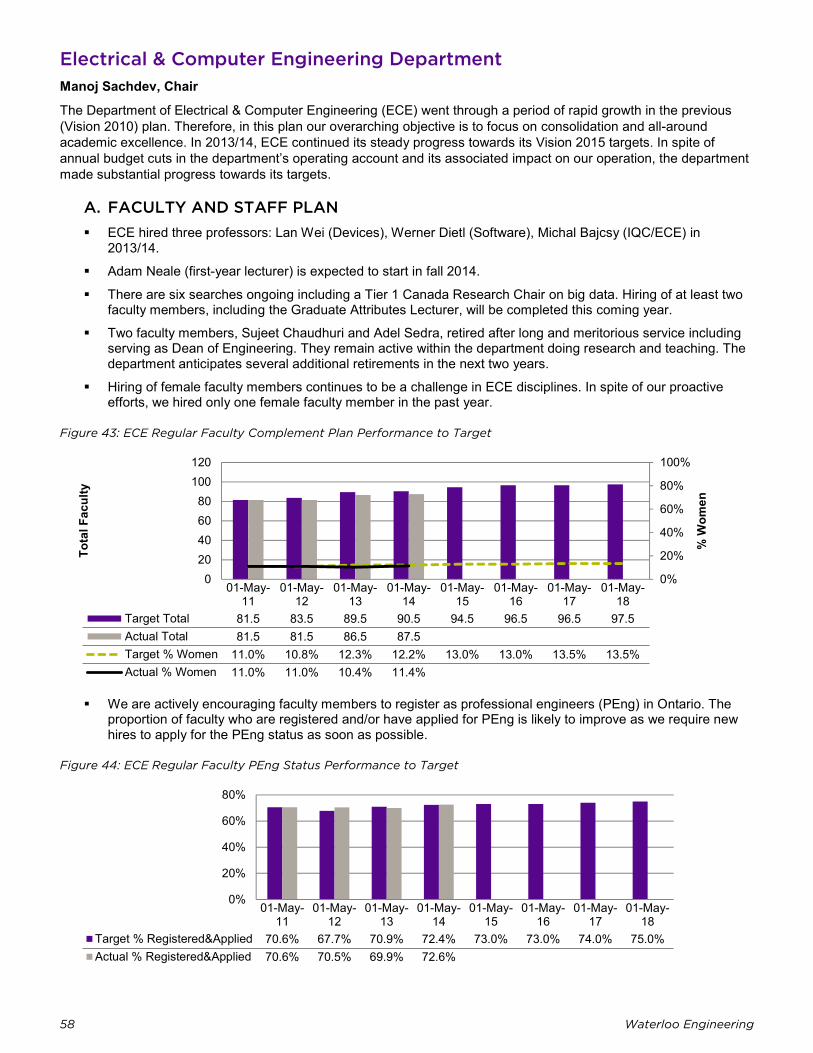
58 Waterloo Engineering
0%
20%
40%
60%
80%
100%
020406080
100120
% W
omen
Tota
l Fac
ulty
0%
20%
40%
60%
80%
Electrical & Computer Engineering Department Manoj Sachdev, Chair
The Department of Electrical & Computer Engineering (ECE) went through a period of rapid growth in the previous (Vision 2010) plan. Therefore, in this plan our overarching objective is to focus on consolidation and all-around academic excellence. In 2013/14, ECE continued its steady progress towards its Vision 2015 targets. In spite of annual budget cuts in the department’s operating account and its associated impact on our operation, the department made substantial progress towards its targets.
A. FACULTY AND STAFF PLAN ECE hired three professors: Lan Wei (Devices), Werner Dietl (Software), Michal Bajcsy (IQC/ECE) in
2013/14.
Adam Neale (first-year lecturer) is expected to start in fall 2014.
There are six searches ongoing including a Tier 1 Canada Research Chair on big data. Hiring of at least two faculty members, including the Graduate Attributes Lecturer, will be completed this coming year.
Two faculty members, Sujeet Chaudhuri and Adel Sedra, retired after long and meritorious service including serving as Dean of Engineering. They remain active within the department doing research and teaching. The department anticipates several additional retirements in the next two years.
Hiring of female faculty members continues to be a challenge in ECE disciplines. In spite of our proactive efforts, we hired only one female faculty member in the past year.
Figure 43: ECE Regular Faculty Complement Plan Performance to Target
01-May-11
01-May-12
01-May-13
01-May-14
01-May-15
01-May-16
01-May-17
01-May-18
Target Total 81.5 83.5 89.5 90.5 94.5 96.5 96.5 97.5Actual Total 81.5 81.5 86.5 87.5Target % Women 11.0% 10.8% 12.3% 12.2% 13.0% 13.0% 13.5% 13.5%Actual % Women 11.0% 11.0% 10.4% 11.4%
We are actively encouraging faculty members to register as professional engineers (PEng) in Ontario. The proportion of faculty who are registered and/or have applied for PEng is likely to improve as we require new hires to apply for the PEng status as soon as possible.
Figure 44: ECE Regular Faculty PEng Status Performance to Target
01-May-11
01-May-12
01-May-13
01-May-14
01-May-15
01-May-16
01-May-17
01-May-18
Target % Registered&Applied 70.6% 67.7% 70.9% 72.4% 73.0% 73.0% 74.0% 75.0%Actual % Registered&Applied 70.6% 70.5% 69.9% 72.6%
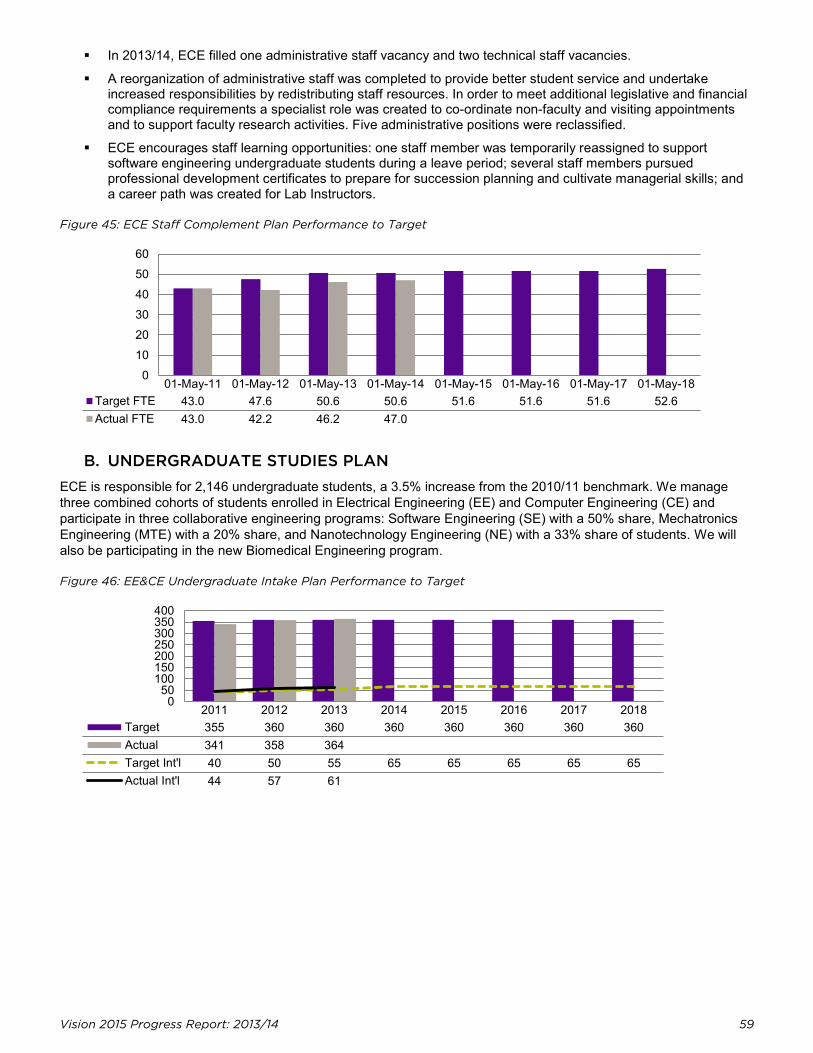
Vision 2015 Progress Report: 2013/14 59
0102030405060
050
100150200250300350400
In 2013/14, ECE filled one administrative staff vacancy and two technical staff vacancies.
A reorganization of administrative staff was completed to provide better student service and undertake increased responsibilities by redistributing staff resources. In order to meet additional legislative and financial compliance requirements a specialist role was created to co-ordinate non-faculty and visiting appointments and to support faculty research activities. Five administrative positions were reclassified.
ECE encourages staff learning opportunities: one staff member was temporarily reassigned to support software engineering undergraduate students during a leave period; several staff members pursued professional development certificates to prepare for succession planning and cultivate managerial skills; and a career path was created for Lab Instructors.
Figure 45: ECE Staff Complement Plan Performance to Target
01-May-11 01-May-12 01-May-13 01-May-14 01-May-15 01-May-16 01-May-17 01-May-18Target FTE 43.0 47.6 50.6 50.6 51.6 51.6 51.6 52.6Actual FTE 43.0 42.2 46.2 47.0
B. UNDERGRADUATE STUDIES PLAN ECE is responsible for 2,146 undergraduate students, a 3.5% increase from the 2010/11 benchmark. We manage three combined cohorts of students enrolled in Electrical Engineering (EE) and Computer Engineering (CE) and participate in three collaborative engineering programs: Software Engineering (SE) with a 50% share, Mechatronics Engineering (MTE) with a 20% share, and Nanotechnology Engineering (NE) with a 33% share of students. We will also be participating in the new Biomedical Engineering program.
Figure 46: EE&CE Undergraduate Intake Plan Performance to Target
2011 2012 2013 2014 2015 2016 2017 2018Target 355 360 360 360 360 360 360 360Actual 341 358 364Target Int'l 40 50 55 65 65 65 65 65Actual Int'l 44 57 61
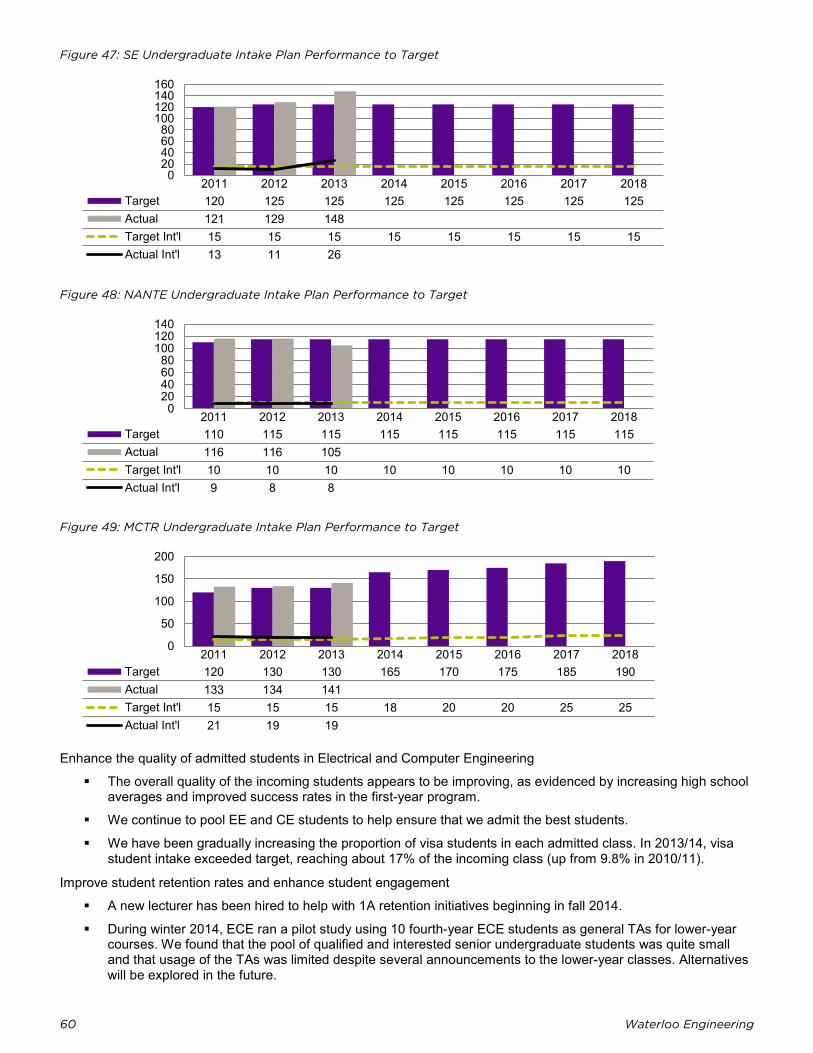
60 Waterloo Engineering
020406080
100120140160
020406080
100120140
0
50
100
150
200
Figure 47: SE Undergraduate Intake Plan Performance to Target
2011 2012 2013 2014 2015 2016 2017 2018Target 120 125 125 125 125 125 125 125Actual 121 129 148Target Int'l 15 15 15 15 15 15 15 15Actual Int'l 13 11 26
Figure 48: NANTE Undergraduate Intake Plan Performance to Target
2011 2012 2013 2014 2015 2016 2017 2018Target 110 115 115 115 115 115 115 115Actual 116 116 105Target Int'l 10 10 10 10 10 10 10 10Actual Int'l 9 8 8
Figure 49: MCTR Undergraduate Intake Plan Performance to Target
2011 2012 2013 2014 2015 2016 2017 2018Target 120 130 130 165 170 175 185 190Actual 133 134 141Target Int'l 15 15 15 18 20 20 25 25Actual Int'l 21 19 19
Enhance the quality of admitted students in Electrical and Computer Engineering
The overall quality of the incoming students appears to be improving, as evidenced by increasing high school averages and improved success rates in the first-year program.
We continue to pool EE and CE students to help ensure that we admit the best students.
We have been gradually increasing the proportion of visa students in each admitted class. In 2013/14, visa student intake exceeded target, reaching about 17% of the incoming class (up from 9.8% in 2010/11).
Improve student retention rates and enhance student engagement
A new lecturer has been hired to help with 1A retention initiatives beginning in fall 2014.
During winter 2014, ECE ran a pilot study using 10 fourth-year ECE students as general TAs for lower-year courses. We found that the pool of qualified and interested senior undergraduate students was quite small and that usage of the TAs was limited despite several announcements to the lower-year classes. Alternatives will be explored in the future.
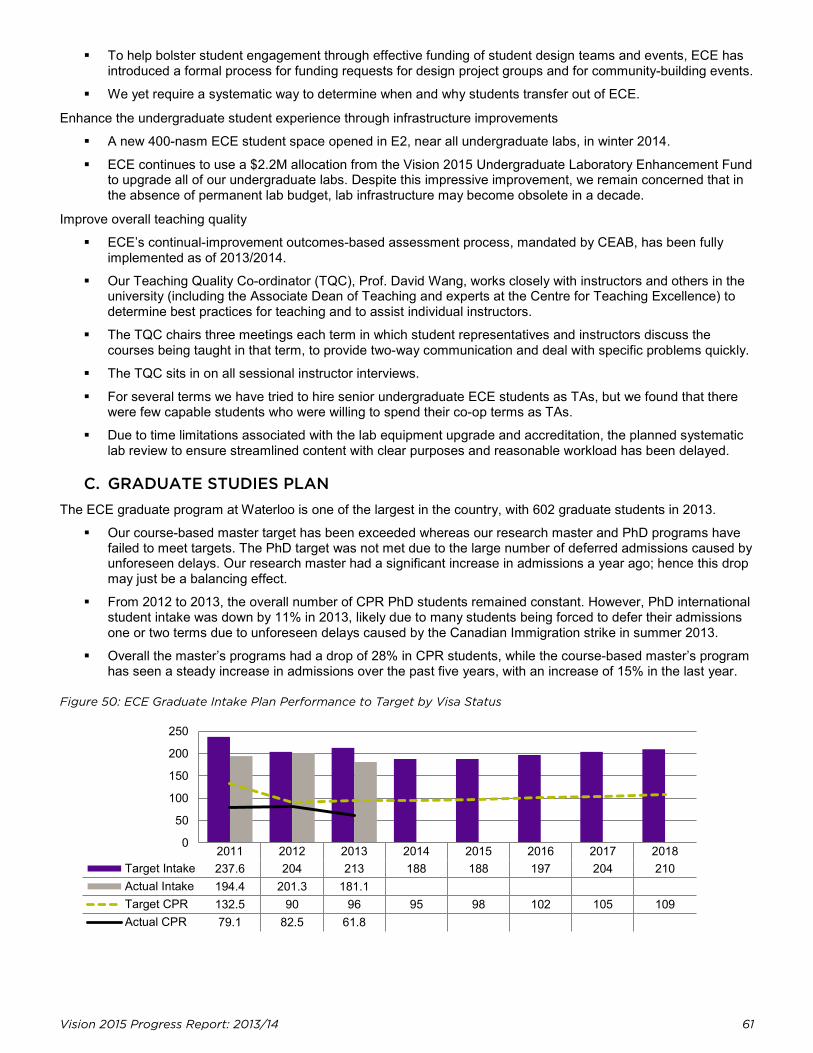
Vision 2015 Progress Report: 2013/14 61
0
50
100
150
200
250
To help bolster student engagement through effective funding of student design teams and events, ECE has introduced a formal process for funding requests for design project groups and for community-building events.
We yet require a systematic way to determine when and why students transfer out of ECE.
Enhance the undergraduate student experience through infrastructure improvements
A new 400-nasm ECE student space opened in E2, near all undergraduate labs, in winter 2014.
ECE continues to use a $2.2M allocation from the Vision 2015 Undergraduate Laboratory Enhancement Fund to upgrade all of our undergraduate labs. Despite this impressive improvement, we remain concerned that in the absence of permanent lab budget, lab infrastructure may become obsolete in a decade.
Improve overall teaching quality
ECE’s continual-improvement outcomes-based assessment process, mandated by CEAB, has been fully implemented as of 2013/2014.
Our Teaching Quality Co-ordinator (TQC), Prof. David Wang, works closely with instructors and others in the university (including the Associate Dean of Teaching and experts at the Centre for Teaching Excellence) to determine best practices for teaching and to assist individual instructors.
The TQC chairs three meetings each term in which student representatives and instructors discuss the courses being taught in that term, to provide two-way communication and deal with specific problems quickly.
The TQC sits in on all sessional instructor interviews.
For several terms we have tried to hire senior undergraduate ECE students as TAs, but we found that there were few capable students who were willing to spend their co-op terms as TAs.
Due to time limitations associated with the lab equipment upgrade and accreditation, the planned systematic lab review to ensure streamlined content with clear purposes and reasonable workload has been delayed.
C. GRADUATE STUDIES PLAN The ECE graduate program at Waterloo is one of the largest in the country, with 602 graduate students in 2013.
Our course-based master target has been exceeded whereas our research master and PhD programs have failed to meet targets. The PhD target was not met due to the large number of deferred admissions caused by unforeseen delays. Our research master had a significant increase in admissions a year ago; hence this drop may just be a balancing effect.
From 2012 to 2013, the overall number of CPR PhD students remained constant. However, PhD international student intake was down by 11% in 2013, likely due to many students being forced to defer their admissions one or two terms due to unforeseen delays caused by the Canadian Immigration strike in summer 2013.
Overall the master’s programs had a drop of 28% in CPR students, while the course-based master’s program has seen a steady increase in admissions over the past five years, with an increase of 15% in the last year.
Figure 50: ECE Graduate Intake Plan Performance to Target by Visa Status
2011 2012 2013 2014 2015 2016 2017 2018Target Intake 237.6 204 213 188 188 197 204 210Actual Intake 194.4 201.3 181.1Target CPR 132.5 90 96 95 98 102 105 109Actual CPR 79.1 82.5 61.8
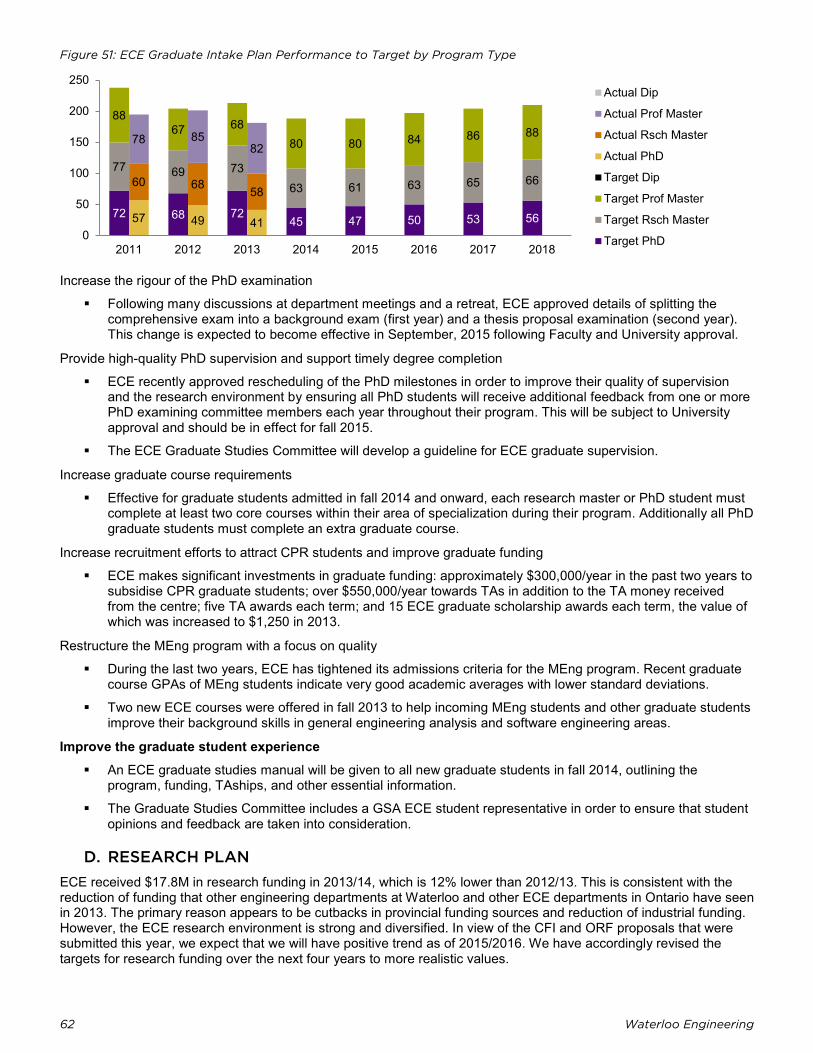
62 Waterloo Engineering
Figure 51: ECE Graduate Intake Plan Performance to Target by Program Type
Increase the rigour of the PhD examination
Following many discussions at department meetings and a retreat, ECE approved details of splitting the comprehensive exam into a background exam (first year) and a thesis proposal examination (second year). This change is expected to become effective in September, 2015 following Faculty and University approval.
Provide high-quality PhD supervision and support timely degree completion
ECE recently approved rescheduling of the PhD milestones in order to improve their quality of supervision and the research environment by ensuring all PhD students will receive additional feedback from one or more PhD examining committee members each year throughout their program. This will be subject to University approval and should be in effect for fall 2015.
The ECE Graduate Studies Committee will develop a guideline for ECE graduate supervision.
Increase graduate course requirements
Effective for graduate students admitted in fall 2014 and onward, each research master or PhD student must complete at least two core courses within their area of specialization during their program. Additionally all PhD graduate students must complete an extra graduate course.
Increase recruitment efforts to attract CPR students and improve graduate funding
ECE makes significant investments in graduate funding: approximately $300,000/year in the past two years to subsidise CPR graduate students; over $550,000/year towards TAs in addition to the TA money received from the centre; five TA awards each term; and 15 ECE graduate scholarship awards each term, the value of which was increased to $1,250 in 2013.
Restructure the MEng program with a focus on quality
During the last two years, ECE has tightened its admissions criteria for the MEng program. Recent graduate course GPAs of MEng students indicate very good academic averages with lower standard deviations.
Two new ECE courses were offered in fall 2013 to help incoming MEng students and other graduate students improve their background skills in general engineering analysis and software engineering areas.
Improve the graduate student experience An ECE graduate studies manual will be given to all new graduate students in fall 2014, outlining the
program, funding, TAships, and other essential information.
The Graduate Studies Committee includes a GSA ECE student representative in order to ensure that student opinions and feedback are taken into consideration.
D. RESEARCH PLAN ECE received $17.8M in research funding in 2013/14, which is 12% lower than 2012/13. This is consistent with the reduction of funding that other engineering departments at Waterloo and other ECE departments in Ontario have seen in 2013. The primary reason appears to be cutbacks in provincial funding sources and reduction of industrial funding. However, the ECE research environment is strong and diversified. In view of the CFI and ORF proposals that were submitted this year, we expect that we will have positive trend as of 2015/2016. We have accordingly revised the targets for research funding over the next four years to more realistic values.
72 68 72 45 47 50 53 56
77 69 73 63 61 63 65 66
88 67 68
80 80 84 86 88
57 49 41
60 68 58
78 85 82
2011 2012 2013 2014 2015 2016 2017 20180
50
100
150
200
250Actual Dip
Actual Prof Master
Actual Rsch Master
Actual PhD
Target Dip
Target Prof Master
Target Rsch Master
Target PhD
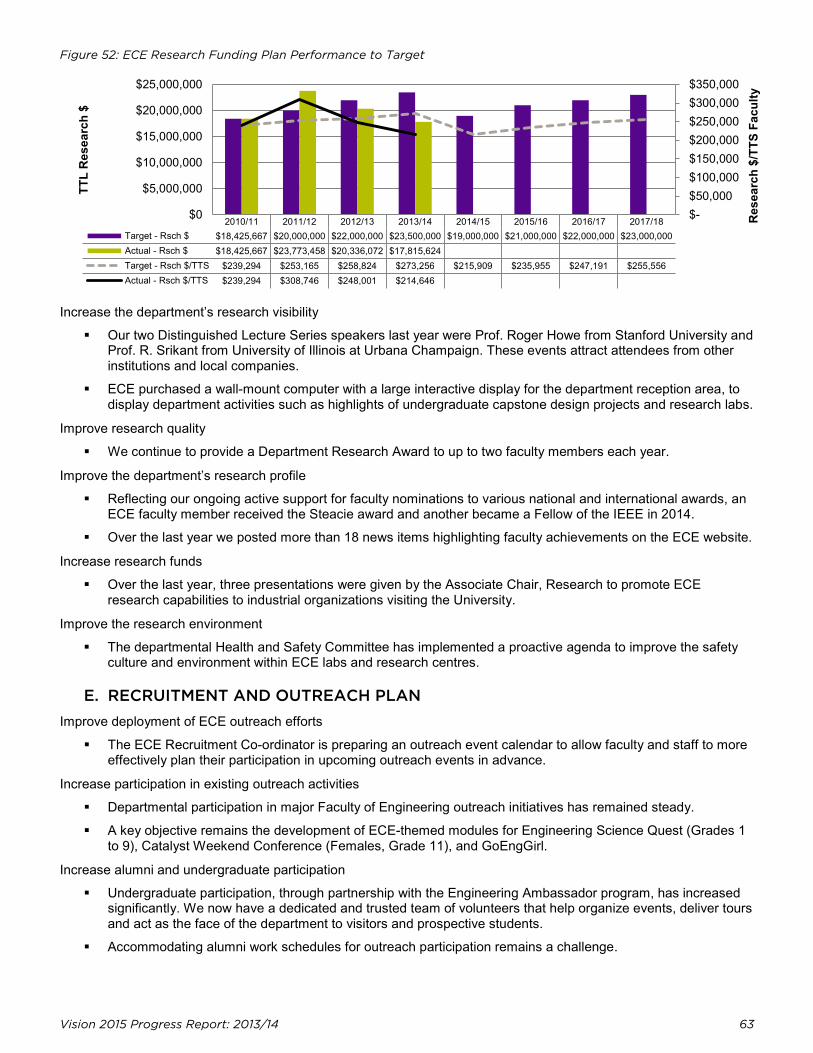
Vision 2015 Progress Report: 2013/14 63
$- $50,000 $100,000 $150,000 $200,000 $250,000 $300,000 $350,000
$0
$5,000,000
$10,000,000
$15,000,000
$20,000,000
$25,000,000
Res
earc
h $/
TTS
Facu
lty
TTL
Res
earc
h $
Figure 52: ECE Research Funding Plan Performance to Target
2010/11 2011/12 2012/13 2013/14 2014/15 2015/16 2016/17 2017/18Target - Rsch $ $18,425,667 $20,000,000 $22,000,000 $23,500,000 $19,000,000 $21,000,000 $22,000,000 $23,000,000Actual - Rsch $ $18,425,667 $23,773,458 $20,336,072 $17,815,624Target - Rsch $/TTS $239,294 $253,165 $258,824 $273,256 $215,909 $235,955 $247,191 $255,556Actual - Rsch $/TTS $239,294 $308,746 $248,001 $214,646
Increase the department’s research visibility
Our two Distinguished Lecture Series speakers last year were Prof. Roger Howe from Stanford University and Prof. R. Srikant from University of Illinois at Urbana Champaign. These events attract attendees from other institutions and local companies.
ECE purchased a wall-mount computer with a large interactive display for the department reception area, to display department activities such as highlights of undergraduate capstone design projects and research labs.
Improve research quality
We continue to provide a Department Research Award to up to two faculty members each year.
Improve the department’s research profile
Reflecting our ongoing active support for faculty nominations to various national and international awards, an ECE faculty member received the Steacie award and another became a Fellow of the IEEE in 2014.
Over the last year we posted more than 18 news items highlighting faculty achievements on the ECE website.
Increase research funds
Over the last year, three presentations were given by the Associate Chair, Research to promote ECE research capabilities to industrial organizations visiting the University.
Improve the research environment
The departmental Health and Safety Committee has implemented a proactive agenda to improve the safety culture and environment within ECE labs and research centres.
E. RECRUITMENT AND OUTREACH PLAN Improve deployment of ECE outreach efforts
The ECE Recruitment Co-ordinator is preparing an outreach event calendar to allow faculty and staff to more effectively plan their participation in upcoming outreach events in advance.
Increase participation in existing outreach activities
Departmental participation in major Faculty of Engineering outreach initiatives has remained steady.
A key objective remains the development of ECE-themed modules for Engineering Science Quest (Grades 1 to 9), Catalyst Weekend Conference (Females, Grade 11), and GoEngGirl.
Increase alumni and undergraduate participation
Undergraduate participation, through partnership with the Engineering Ambassador program, has increased significantly. We now have a dedicated and trusted team of volunteers that help organize events, deliver tours and act as the face of the department to visitors and prospective students.
Accommodating alumni work schedules for outreach participation remains a challenge.
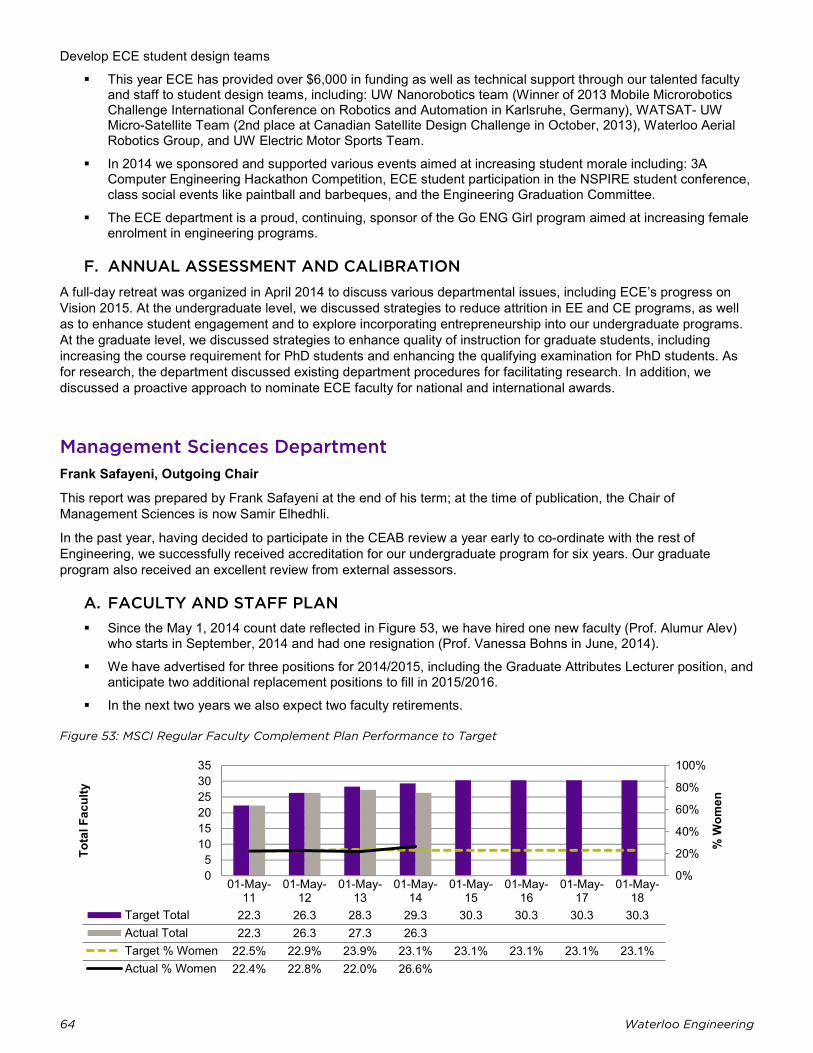
64 Waterloo Engineering
0%
20%
40%
60%
80%
100%
05
101520253035
% W
omen
Tota
l Fac
ulty
Develop ECE student design teams
This year ECE has provided over $6,000 in funding as well as technical support through our talented faculty and staff to student design teams, including: UW Nanorobotics team (Winner of 2013 Mobile Microrobotics Challenge International Conference on Robotics and Automation in Karlsruhe, Germany), WATSAT- UW Micro-Satellite Team (2nd place at Canadian Satellite Design Challenge in October, 2013), Waterloo Aerial Robotics Group, and UW Electric Motor Sports Team.
In 2014 we sponsored and supported various events aimed at increasing student morale including: 3A Computer Engineering Hackathon Competition, ECE student participation in the NSPIRE student conference, class social events like paintball and barbeques, and the Engineering Graduation Committee.
The ECE department is a proud, continuing, sponsor of the Go ENG Girl program aimed at increasing female enrolment in engineering programs.
F. ANNUAL ASSESSMENT AND CALIBRATION A full-day retreat was organized in April 2014 to discuss various departmental issues, including ECE’s progress on Vision 2015. At the undergraduate level, we discussed strategies to reduce attrition in EE and CE programs, as well as to enhance student engagement and to explore incorporating entrepreneurship into our undergraduate programs. At the graduate level, we discussed strategies to enhance quality of instruction for graduate students, including increasing the course requirement for PhD students and enhancing the qualifying examination for PhD students. As for research, the department discussed existing department procedures for facilitating research. In addition, we discussed a proactive approach to nominate ECE faculty for national and international awards.
Management Sciences Department Frank Safayeni, Outgoing Chair
This report was prepared by Frank Safayeni at the end of his term; at the time of publication, the Chair of Management Sciences is now Samir Elhedhli.
In the past year, having decided to participate in the CEAB review a year early to co-ordinate with the rest of Engineering, we successfully received accreditation for our undergraduate program for six years. Our graduate program also received an excellent review from external assessors.
A. FACULTY AND STAFF PLAN Since the May 1, 2014 count date reflected in Figure 53, we have hired one new faculty (Prof. Alumur Alev)
who starts in September, 2014 and had one resignation (Prof. Vanessa Bohns in June, 2014).
We have advertised for three positions for 2014/2015, including the Graduate Attributes Lecturer position, and anticipate two additional replacement positions to fill in 2015/2016.
In the next two years we also expect two faculty retirements.
Figure 53: MSCI Regular Faculty Complement Plan Performance to Target
01-May-11
01-May-12
01-May-13
01-May-14
01-May-15
01-May-16
01-May-17
01-May-18
Target Total 22.3 26.3 28.3 29.3 30.3 30.3 30.3 30.3Actual Total 22.3 26.3 27.3 26.3Target % Women 22.5% 22.9% 23.9% 23.1% 23.1% 23.1% 23.1% 23.1%Actual % Women 22.4% 22.8% 22.0% 26.6%
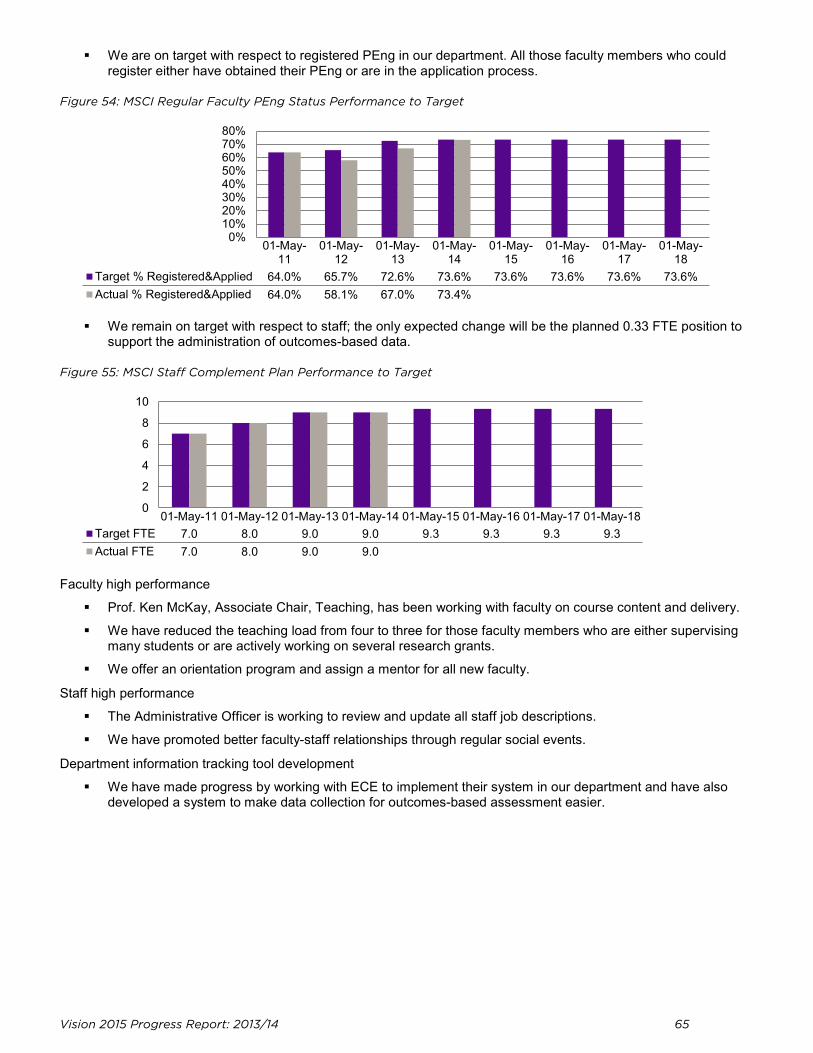
Vision 2015 Progress Report: 2013/14 65
80%70%60%50%40%30%20%10%0%
0
2
4
6
8
10
We are on target with respect to registered PEng in our department. All those faculty members who could register either have obtained their PEng or are in the application process.
Figure 54: MSCI Regular Faculty PEng Status Performance to Target
01-May-11
01-May-12
01-May-13
01-May-14
01-May-15
01-May-16
01-May-17
01-May-18
Target % Registered&Applied 64.0% 65.7% 72.6% 73.6% 73.6% 73.6% 73.6% 73.6%Actual % Registered&Applied 64.0% 58.1% 67.0% 73.4%
We remain on target with respect to staff; the only expected change will be the planned 0.33 FTE position to support the administration of outcomes-based data.
Figure 55: MSCI Staff Complement Plan Performance to Target
01-May-11 01-May-12 01-May-13 01-May-14 01-May-15 01-May-16 01-May-17 01-May-18Target FTE 7.0 8.0 9.0 9.0 9.3 9.3 9.3 9.3Actual FTE 7.0 8.0 9.0 9.0
Faculty high performance
Prof. Ken McKay, Associate Chair, Teaching, has been working with faculty on course content and delivery.
We have reduced the teaching load from four to three for those faculty members who are either supervising many students or are actively working on several research grants.
We offer an orientation program and assign a mentor for all new faculty.
Staff high performance
The Administrative Officer is working to review and update all staff job descriptions.
We have promoted better faculty-staff relationships through regular social events.
Department information tracking tool development
We have made progress by working with ECE to implement their system in our department and have also developed a system to make data collection for outcomes-based assessment easier.
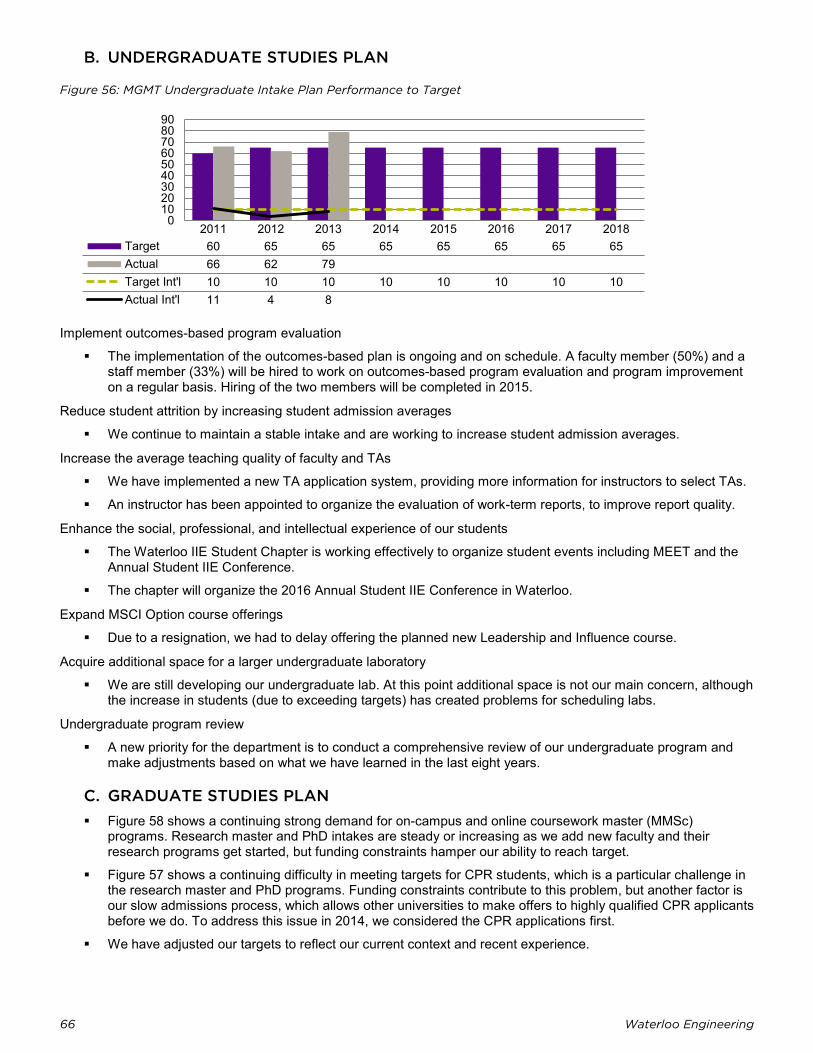
66 Waterloo Engineering
0102030405060708090
B. UNDERGRADUATE STUDIES PLAN
Figure 56: MGMT Undergraduate Intake Plan Performance to Target
2011 2012 2013 2014 2015 2016 2017 2018Target 60 65 65 65 65 65 65 65Actual 66 62 79Target Int'l 10 10 10 10 10 10 10 10Actual Int'l 11 4 8
Implement outcomes-based program evaluation
The implementation of the outcomes-based plan is ongoing and on schedule. A faculty member (50%) and a staff member (33%) will be hired to work on outcomes-based program evaluation and program improvement on a regular basis. Hiring of the two members will be completed in 2015.
Reduce student attrition by increasing student admission averages
We continue to maintain a stable intake and are working to increase student admission averages.
Increase the average teaching quality of faculty and TAs
We have implemented a new TA application system, providing more information for instructors to select TAs.
An instructor has been appointed to organize the evaluation of work-term reports, to improve report quality.
Enhance the social, professional, and intellectual experience of our students
The Waterloo IIE Student Chapter is working effectively to organize student events including MEET and the Annual Student IIE Conference.
The chapter will organize the 2016 Annual Student IIE Conference in Waterloo.
Expand MSCI Option course offerings
Due to a resignation, we had to delay offering the planned new Leadership and Influence course.
Acquire additional space for a larger undergraduate laboratory
We are still developing our undergraduate lab. At this point additional space is not our main concern, although the increase in students (due to exceeding targets) has created problems for scheduling labs.
Undergraduate program review
A new priority for the department is to conduct a comprehensive review of our undergraduate program and make adjustments based on what we have learned in the last eight years.
C. GRADUATE STUDIES PLAN Figure 58 shows a continuing strong demand for on-campus and online coursework master (MMSc)
programs. Research master and PhD intakes are steady or increasing as we add new faculty and their research programs get started, but funding constraints hamper our ability to reach target.
Figure 57 shows a continuing difficulty in meeting targets for CPR students, which is a particular challenge in the research master and PhD programs. Funding constraints contribute to this problem, but another factor is our slow admissions process, which allows other universities to make offers to highly qualified CPR applicants before we do. To address this issue in 2014, we considered the CPR applications first.
We have adjusted our targets to reflect our current context and recent experience.
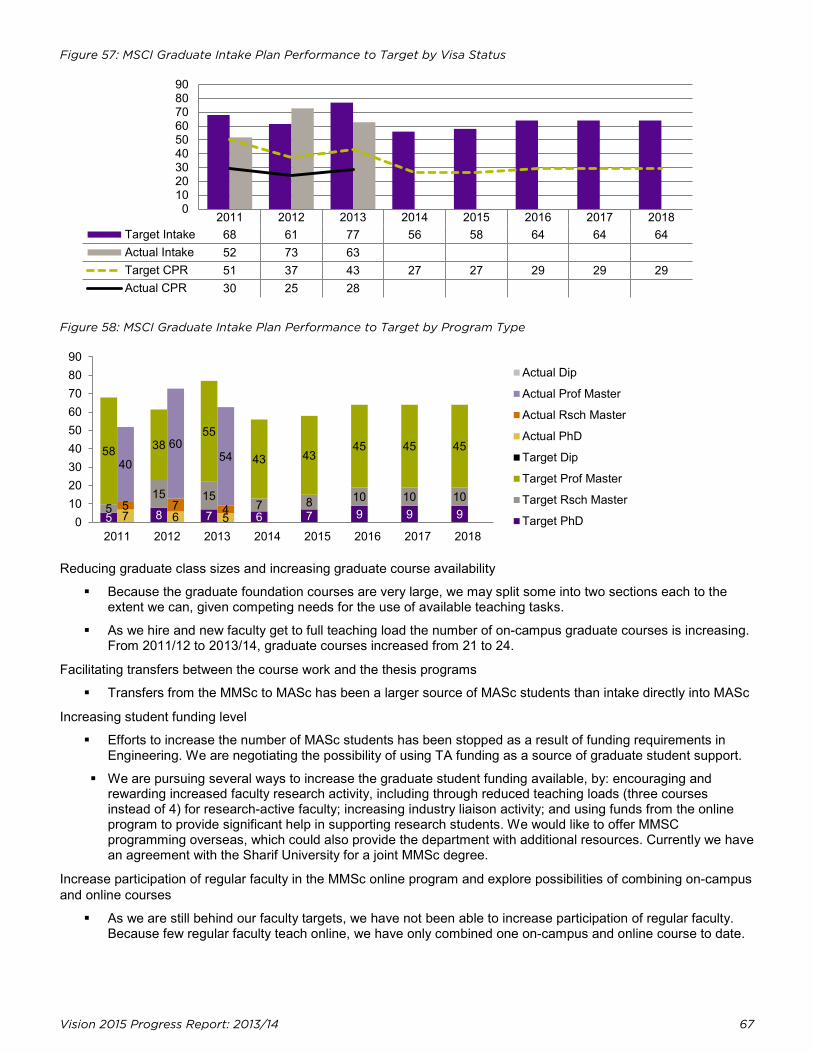
Vision 2015 Progress Report: 2013/14 67
0102030405060708090
Figure 57: MSCI Graduate Intake Plan Performance to Target by Visa Status
2011 2012 2013 2014 2015 2016 2017 2018Target Intake 68 61 77 56 58 64 64 64Actual Intake 52 73 63Target CPR 51 37 43 27 27 29 29 29Actual CPR 30 25 28
Figure 58: MSCI Graduate Intake Plan Performance to Target by Program Type
Reducing graduate class sizes and increasing graduate course availability
Because the graduate foundation courses are very large, we may split some into two sections each to the extent we can, given competing needs for the use of available teaching tasks.
As we hire and new faculty get to full teaching load the number of on-campus graduate courses is increasing. From 2011/12 to 2013/14, graduate courses increased from 21 to 24.
Facilitating transfers between the course work and the thesis programs
Transfers from the MMSc to MASc has been a larger source of MASc students than intake directly into MASc
Increasing student funding level
Efforts to increase the number of MASc students has been stopped as a result of funding requirements in Engineering. We are negotiating the possibility of using TA funding as a source of graduate student support.
We are pursuing several ways to increase the graduate student funding available, by: encouraging and rewarding increased faculty research activity, including through reduced teaching loads (three courses instead of 4) for research-active faculty; increasing industry liaison activity; and using funds from the online program to provide significant help in supporting research students. We would like to offer MMSC programming overseas, which could also provide the department with additional resources. Currently we have an agreement with the Sharif University for a joint MMSc degree.
Increase participation of regular faculty in the MMSc online program and explore possibilities of combining on-campus and online courses
As we are still behind our faculty targets, we have not been able to increase participation of regular faculty. Because few regular faculty teach online, we have only combined one on-campus and online course to date.
5 8 7 6 7 9 9 9 5 15 15
7 8 10 10 10
58 38 55
43 43 45 45 45
7 6 5 5 7 4
40
60 54
2011 2012 2013 2014 2015 2016 2017 20180
102030405060708090
Actual Dip
Actual Prof Master
Actual Rsch Master
Actual PhD
Target Dip
Target Prof Master
Target Rsch Master
Target PhD
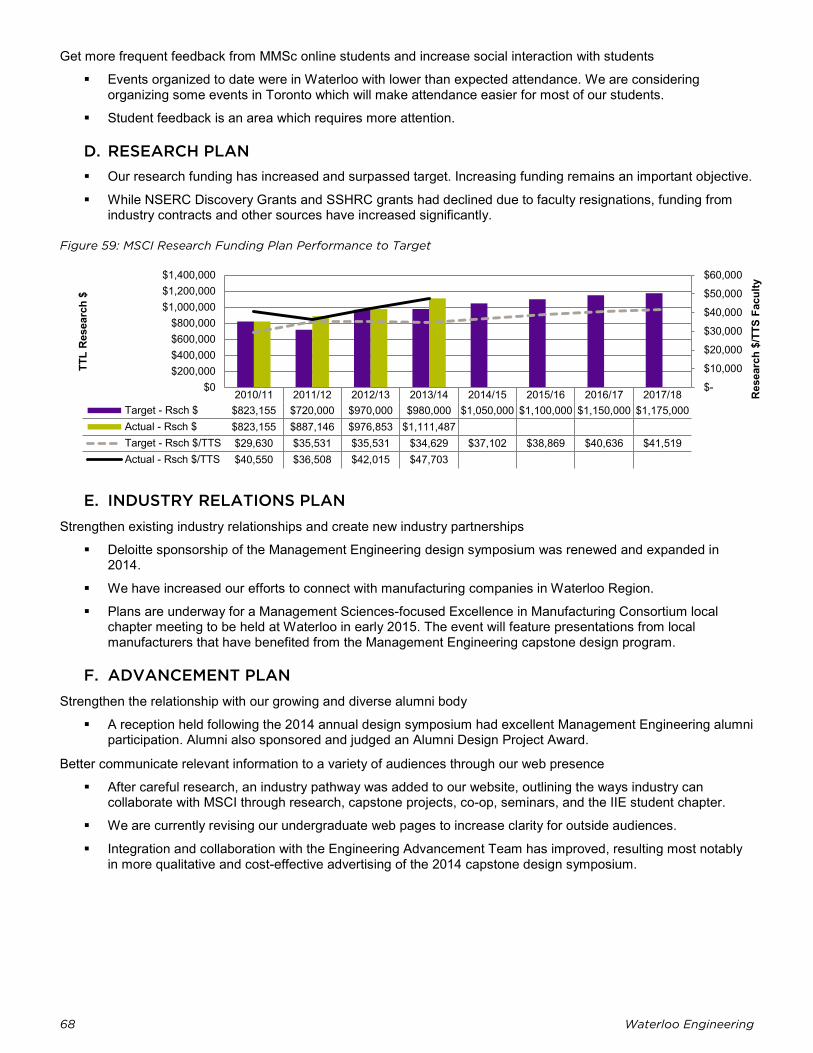
68 Waterloo Engineering
$-
$10,000
$20,000
$30,000
$40,000
$50,000
$60,000
$0$200,000$400,000$600,000$800,000
$1,000,000$1,200,000$1,400,000
Res
earc
h $/
TTS
Facu
lty
TTL
Res
earc
h $
Get more frequent feedback from MMSc online students and increase social interaction with students
Events organized to date were in Waterloo with lower than expected attendance. We are considering organizing some events in Toronto which will make attendance easier for most of our students.
Student feedback is an area which requires more attention.
D. RESEARCH PLAN Our research funding has increased and surpassed target. Increasing funding remains an important objective.
While NSERC Discovery Grants and SSHRC grants had declined due to faculty resignations, funding from industry contracts and other sources have increased significantly.
Figure 59: MSCI Research Funding Plan Performance to Target
2010/11 2011/12 2012/13 2013/14 2014/15 2015/16 2016/17 2017/18Target - Rsch $ $823,155 $720,000 $970,000 $980,000 $1,050,000 $1,100,000 $1,150,000 $1,175,000Actual - Rsch $ $823,155 $887,146 $976,853 $1,111,487Target - Rsch $/TTS $29,630 $35,531 $35,531 $34,629 $37,102 $38,869 $40,636 $41,519Actual - Rsch $/TTS $40,550 $36,508 $42,015 $47,703
E. INDUSTRY RELATIONS PLAN Strengthen existing industry relationships and create new industry partnerships
Deloitte sponsorship of the Management Engineering design symposium was renewed and expanded in 2014.
We have increased our efforts to connect with manufacturing companies in Waterloo Region.
Plans are underway for a Management Sciences-focused Excellence in Manufacturing Consortium local chapter meeting to be held at Waterloo in early 2015. The event will feature presentations from local manufacturers that have benefited from the Management Engineering capstone design program.
F. ADVANCEMENT PLAN Strengthen the relationship with our growing and diverse alumni body
A reception held following the 2014 annual design symposium had excellent Management Engineering alumni participation. Alumni also sponsored and judged an Alumni Design Project Award.
Better communicate relevant information to a variety of audiences through our web presence
After careful research, an industry pathway was added to our website, outlining the ways industry can collaborate with MSCI through research, capstone projects, co-op, seminars, and the IIE student chapter.
We are currently revising our undergraduate web pages to increase clarity for outside audiences.
Integration and collaboration with the Engineering Advancement Team has improved, resulting most notably in more qualitative and cost-effective advertising of the 2014 capstone design symposium.
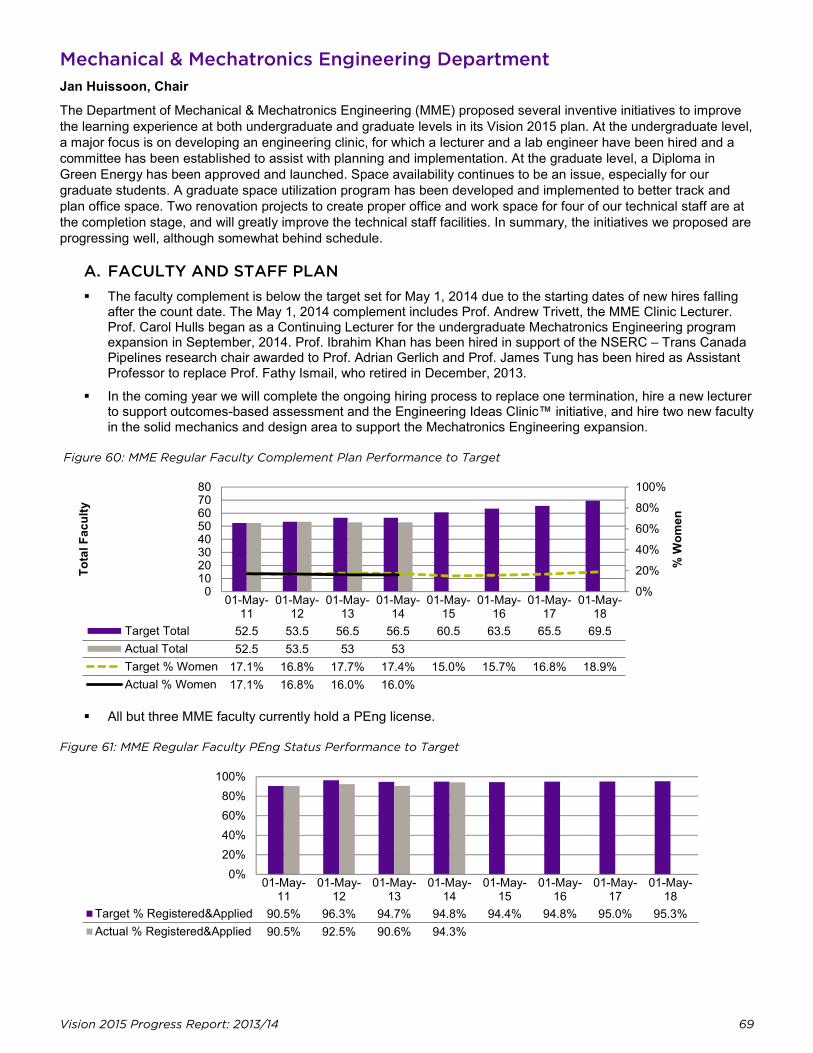
Vision 2015 Progress Report: 2013/14 69
0%
20%
40%
60%
80%
100%
01020304050607080
% W
omen
Tota
l Fac
ulty
0%20%40%60%80%
100%
Mechanical & Mechatronics Engineering Department Jan Huissoon, Chair
The Department of Mechanical & Mechatronics Engineering (MME) proposed several inventive initiatives to improve the learning experience at both undergraduate and graduate levels in its Vision 2015 plan. At the undergraduate level, a major focus is on developing an engineering clinic, for which a lecturer and a lab engineer have been hired and a committee has been established to assist with planning and implementation. At the graduate level, a Diploma in Green Energy has been approved and launched. Space availability continues to be an issue, especially for our graduate students. A graduate space utilization program has been developed and implemented to better track and plan office space. Two renovation projects to create proper office and work space for four of our technical staff are at the completion stage, and will greatly improve the technical staff facilities. In summary, the initiatives we proposed are progressing well, although somewhat behind schedule.
A. FACULTY AND STAFF PLAN The faculty complement is below the target set for May 1, 2014 due to the starting dates of new hires falling
after the count date. The May 1, 2014 complement includes Prof. Andrew Trivett, the MME Clinic Lecturer. Prof. Carol Hulls began as a Continuing Lecturer for the undergraduate Mechatronics Engineering program expansion in September, 2014. Prof. Ibrahim Khan has been hired in support of the NSERC – Trans Canada Pipelines research chair awarded to Prof. Adrian Gerlich and Prof. James Tung has been hired as Assistant Professor to replace Prof. Fathy Ismail, who retired in December, 2013.
In the coming year we will complete the ongoing hiring process to replace one termination, hire a new lecturer to support outcomes-based assessment and the Engineering Ideas Clinic™ initiative, and hire two new faculty in the solid mechanics and design area to support the Mechatronics Engineering expansion.
Figure 60: MME Regular Faculty Complement Plan Performance to Target
01-May-11
01-May-12
01-May-13
01-May-14
01-May-15
01-May-16
01-May-17
01-May-18
Target Total 52.5 53.5 56.5 56.5 60.5 63.5 65.5 69.5Actual Total 52.5 53.5 53 53Target % Women 17.1% 16.8% 17.7% 17.4% 15.0% 15.7% 16.8% 18.9%Actual % Women 17.1% 16.8% 16.0% 16.0%
All but three MME faculty currently hold a PEng license.
Figure 61: MME Regular Faculty PEng Status Performance to Target
01-May-11
01-May-12
01-May-13
01-May-14
01-May-15
01-May-16
01-May-17
01-May-18
Target % Registered&Applied 90.5% 96.3% 94.7% 94.8% 94.4% 94.8% 95.0% 95.3%Actual % Registered&Applied 90.5% 92.5% 90.6% 94.3%
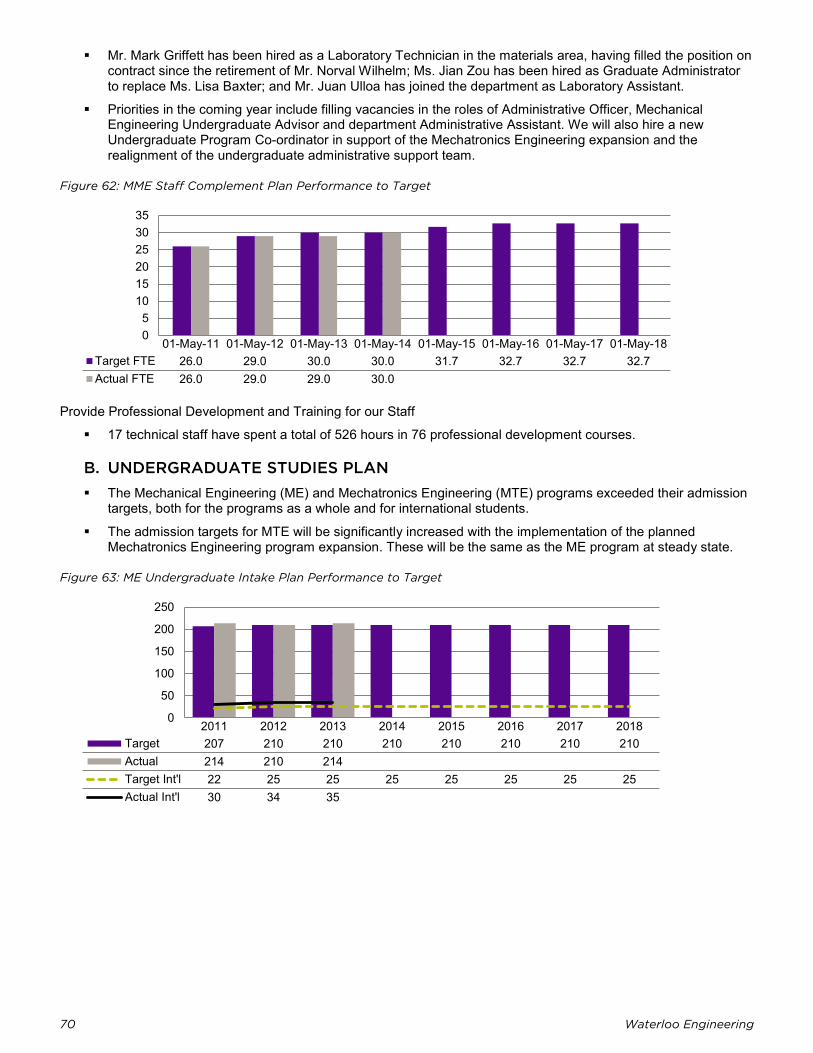
70 Waterloo Engineering
05
101520253035
0
50
100
150
200
250
Mr. Mark Griffett has been hired as a Laboratory Technician in the materials area, having filled the position on contract since the retirement of Mr. Norval Wilhelm; Ms. Jian Zou has been hired as Graduate Administrator to replace Ms. Lisa Baxter; and Mr. Juan Ulloa has joined the department as Laboratory Assistant.
Priorities in the coming year include filling vacancies in the roles of Administrative Officer, Mechanical Engineering Undergraduate Advisor and department Administrative Assistant. We will also hire a new Undergraduate Program Co-ordinator in support of the Mechatronics Engineering expansion and the realignment of the undergraduate administrative support team.
Figure 62: MME Staff Complement Plan Performance to Target
01-May-11 01-May-12 01-May-13 01-May-14 01-May-15 01-May-16 01-May-17 01-May-18Target FTE 26.0 29.0 30.0 30.0 31.7 32.7 32.7 32.7Actual FTE 26.0 29.0 29.0 30.0
Provide Professional Development and Training for our Staff
17 technical staff have spent a total of 526 hours in 76 professional development courses.
B. UNDERGRADUATE STUDIES PLAN The Mechanical Engineering (ME) and Mechatronics Engineering (MTE) programs exceeded their admission
targets, both for the programs as a whole and for international students.
The admission targets for MTE will be significantly increased with the implementation of the planned Mechatronics Engineering program expansion. These will be the same as the ME program at steady state.
Figure 63: ME Undergraduate Intake Plan Performance to Target
2011 2012 2013 2014 2015 2016 2017 2018Target 207 210 210 210 210 210 210 210Actual 214 210 214Target Int'l 22 25 25 25 25 25 25 25Actual Int'l 30 34 35
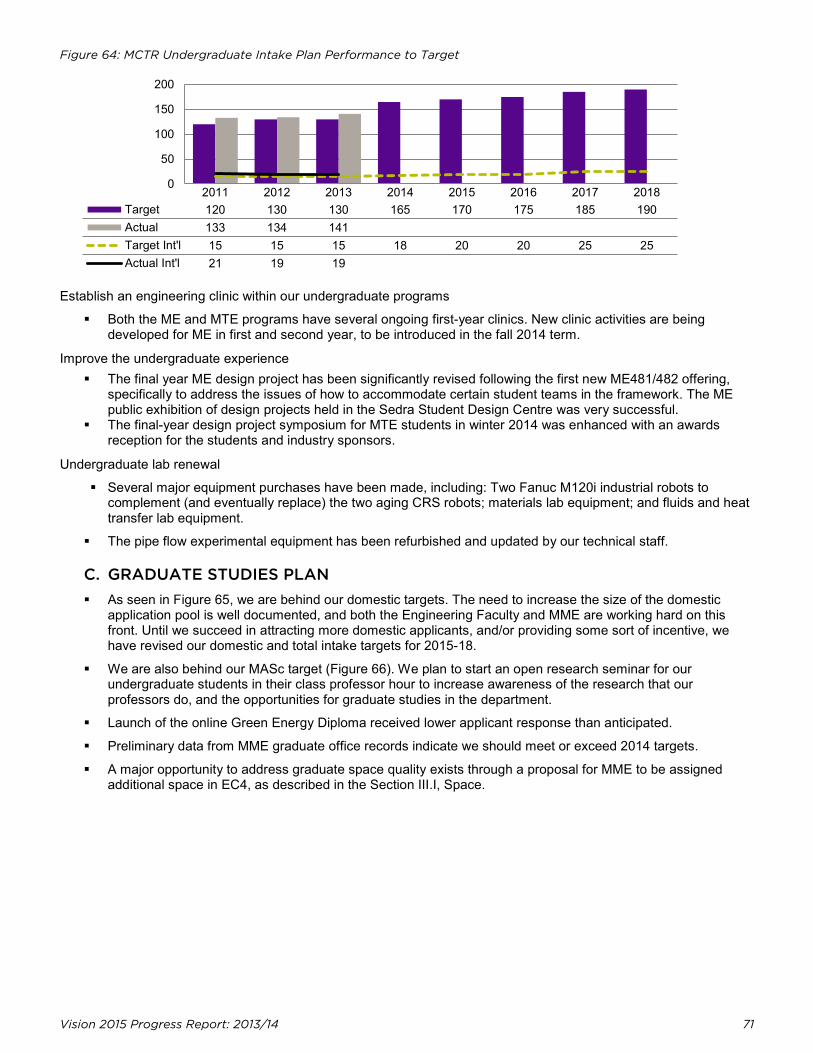
Vision 2015 Progress Report: 2013/14 71
0
50
100
150
200
Figure 64: MCTR Undergraduate Intake Plan Performance to Target
2011 2012 2013 2014 2015 2016 2017 2018Target 120 130 130 165 170 175 185 190Actual 133 134 141Target Int'l 15 15 15 18 20 20 25 25Actual Int'l 21 19 19
Establish an engineering clinic within our undergraduate programs
Both the ME and MTE programs have several ongoing first-year clinics. New clinic activities are being developed for ME in first and second year, to be introduced in the fall 2014 term.
Improve the undergraduate experience The final year ME design project has been significantly revised following the first new ME481/482 offering,
specifically to address the issues of how to accommodate certain student teams in the framework. The ME public exhibition of design projects held in the Sedra Student Design Centre was very successful.
The final-year design project symposium for MTE students in winter 2014 was enhanced with an awards reception for the students and industry sponsors.
Undergraduate lab renewal
Several major equipment purchases have been made, including: Two Fanuc M120i industrial robots to complement (and eventually replace) the two aging CRS robots; materials lab equipment; and fluids and heat transfer lab equipment.
The pipe flow experimental equipment has been refurbished and updated by our technical staff.
C. GRADUATE STUDIES PLAN As seen in Figure 65, we are behind our domestic targets. The need to increase the size of the domestic
application pool is well documented, and both the Engineering Faculty and MME are working hard on this front. Until we succeed in attracting more domestic applicants, and/or providing some sort of incentive, we have revised our domestic and total intake targets for 2015-18.
We are also behind our MASc target (Figure 66). We plan to start an open research seminar for our undergraduate students in their class professor hour to increase awareness of the research that our professors do, and the opportunities for graduate studies in the department.
Launch of the online Green Energy Diploma received lower applicant response than anticipated.
Preliminary data from MME graduate office records indicate we should meet or exceed 2014 targets.
A major opportunity to address graduate space quality exists through a proposal for MME to be assigned additional space in EC4, as described in the Section III.I, Space.
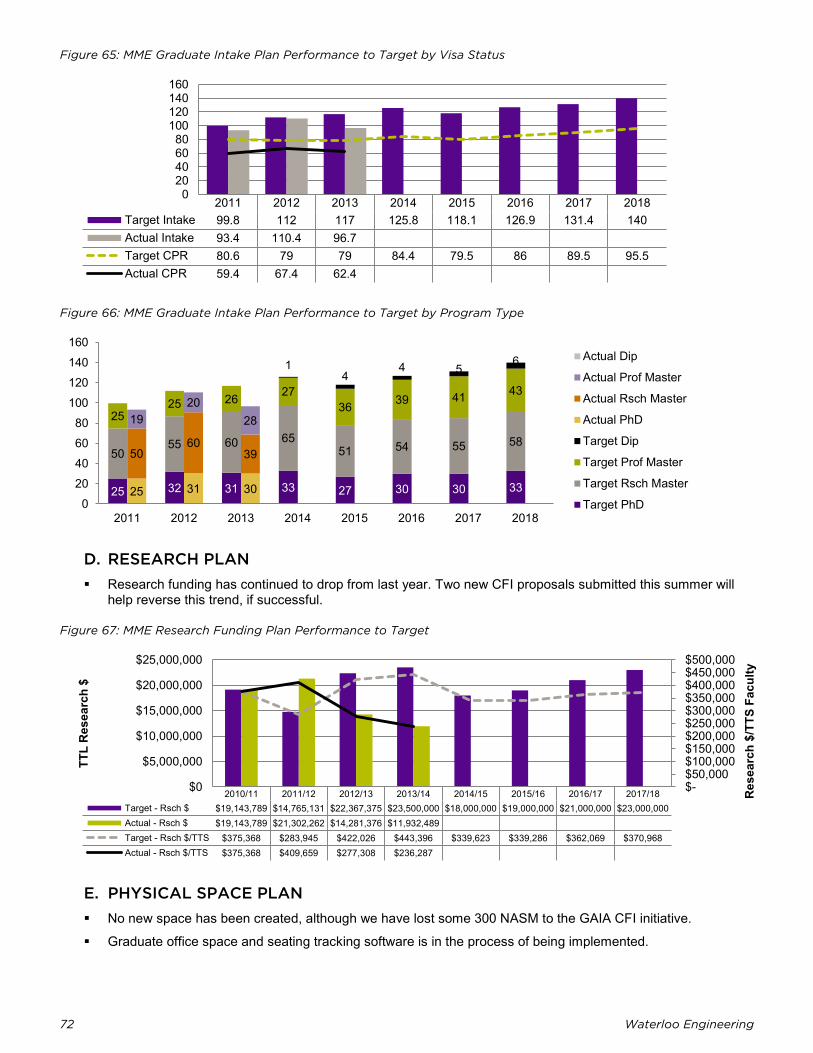
72 Waterloo Engineering
020406080
100120140160
$- $50,000 $100,000 $150,000 $200,000 $250,000 $300,000 $350,000 $400,000 $450,000 $500,000
$0
$5,000,000
$10,000,000
$15,000,000
$20,000,000
$25,000,000
Res
earc
h $/
TTS
Facu
lty
TTL
Res
earc
h $
Figure 65: MME Graduate Intake Plan Performance to Target by Visa Status
2011 2012 2013 2014 2015 2016 2017 2018Target Intake 99.8 112 117 125.8 118.1 126.9 131.4 140Actual Intake 93.4 110.4 96.7Target CPR 80.6 79 79 84.4 79.5 86 89.5 95.5Actual CPR 59.4 67.4 62.4
Figure 66: MME Graduate Intake Plan Performance to Target by Program Type
D. RESEARCH PLAN Research funding has continued to drop from last year. Two new CFI proposals submitted this summer will
help reverse this trend, if successful.
Figure 67: MME Research Funding Plan Performance to Target
2010/11 2011/12 2012/13 2013/14 2014/15 2015/16 2016/17 2017/18Target - Rsch $ $19,143,789 $14,765,131 $22,367,375 $23,500,000 $18,000,000 $19,000,000 $21,000,000 $23,000,000Actual - Rsch $ $19,143,789 $21,302,262 $14,281,376 $11,932,489Target - Rsch $/TTS $375,368 $283,945 $422,026 $443,396 $339,623 $339,286 $362,069 $370,968Actual - Rsch $/TTS $375,368 $409,659 $277,308 $236,287
E. PHYSICAL SPACE PLAN No new space has been created, although we have lost some 300 NASM to the GAIA CFI initiative.
Graduate office space and seating tracking software is in the process of being implemented.
25 32 31 33 27 30 30 33
50 55 60 65
51 54 55 58
25 25 26 27
36 39 41 43
1 4
4 5 6
25 31 30
50 60
39
19 20
28
2011 2012 2013 2014 2015 2016 2017 20180
20406080
100120140160
Actual Dip
Actual Prof Master
Actual Rsch Master
Actual PhD
Target Dip
Target Prof Master
Target Rsch Master
Target PhD
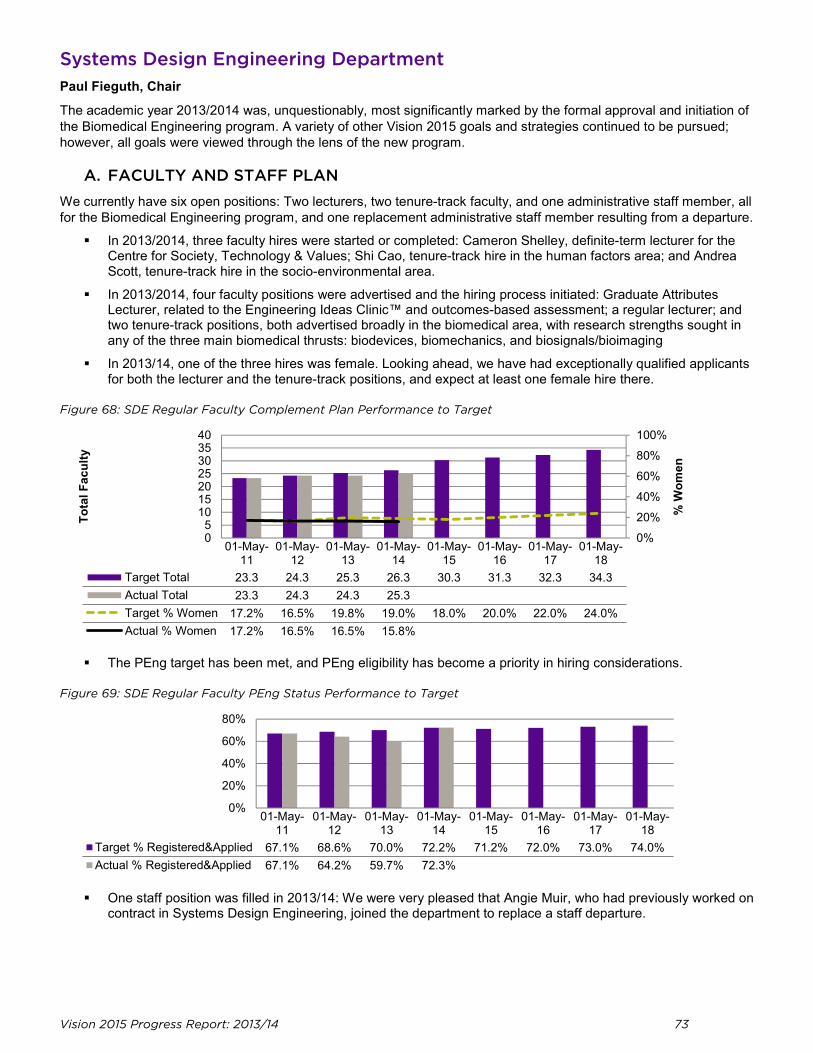
Vision 2015 Progress Report: 2013/14 73
0%
20%
40%
60%
80%
100%
05
10152025303540
% W
omen
Tota
l Fac
ulty
0%
20%
40%
60%
80%
Systems Design Engineering Department Paul Fieguth, Chair
The academic year 2013/2014 was, unquestionably, most significantly marked by the formal approval and initiation of the Biomedical Engineering program. A variety of other Vision 2015 goals and strategies continued to be pursued; however, all goals were viewed through the lens of the new program.
A. FACULTY AND STAFF PLAN We currently have six open positions: Two lecturers, two tenure-track faculty, and one administrative staff member, all for the Biomedical Engineering program, and one replacement administrative staff member resulting from a departure.
In 2013/2014, three faculty hires were started or completed: Cameron Shelley, definite-term lecturer for the Centre for Society, Technology & Values; Shi Cao, tenure-track hire in the human factors area; and Andrea Scott, tenure-track hire in the socio-environmental area.
In 2013/2014, four faculty positions were advertised and the hiring process initiated: Graduate Attributes Lecturer, related to the Engineering Ideas Clinic™ and outcomes-based assessment; a regular lecturer; and two tenure-track positions, both advertised broadly in the biomedical area, with research strengths sought in any of the three main biomedical thrusts: biodevices, biomechanics, and biosignals/bioimaging
In 2013/14, one of the three hires was female. Looking ahead, we have had exceptionally qualified applicants for both the lecturer and the tenure-track positions, and expect at least one female hire there.
Figure 68: SDE Regular Faculty Complement Plan Performance to Target
01-May-11
01-May-12
01-May-13
01-May-14
01-May-15
01-May-16
01-May-17
01-May-18
Target Total 23.3 24.3 25.3 26.3 30.3 31.3 32.3 34.3Actual Total 23.3 24.3 24.3 25.3Target % Women 17.2% 16.5% 19.8% 19.0% 18.0% 20.0% 22.0% 24.0%Actual % Women 17.2% 16.5% 16.5% 15.8%
The PEng target has been met, and PEng eligibility has become a priority in hiring considerations.
Figure 69: SDE Regular Faculty PEng Status Performance to Target
01-May-11
01-May-12
01-May-13
01-May-14
01-May-15
01-May-16
01-May-17
01-May-18
Target % Registered&Applied 67.1% 68.6% 70.0% 72.2% 71.2% 72.0% 73.0% 74.0%Actual % Registered&Applied 67.1% 64.2% 59.7% 72.3%
One staff position was filled in 2013/14: We were very pleased that Angie Muir, who had previously worked on contract in Systems Design Engineering, joined the department to replace a staff departure.
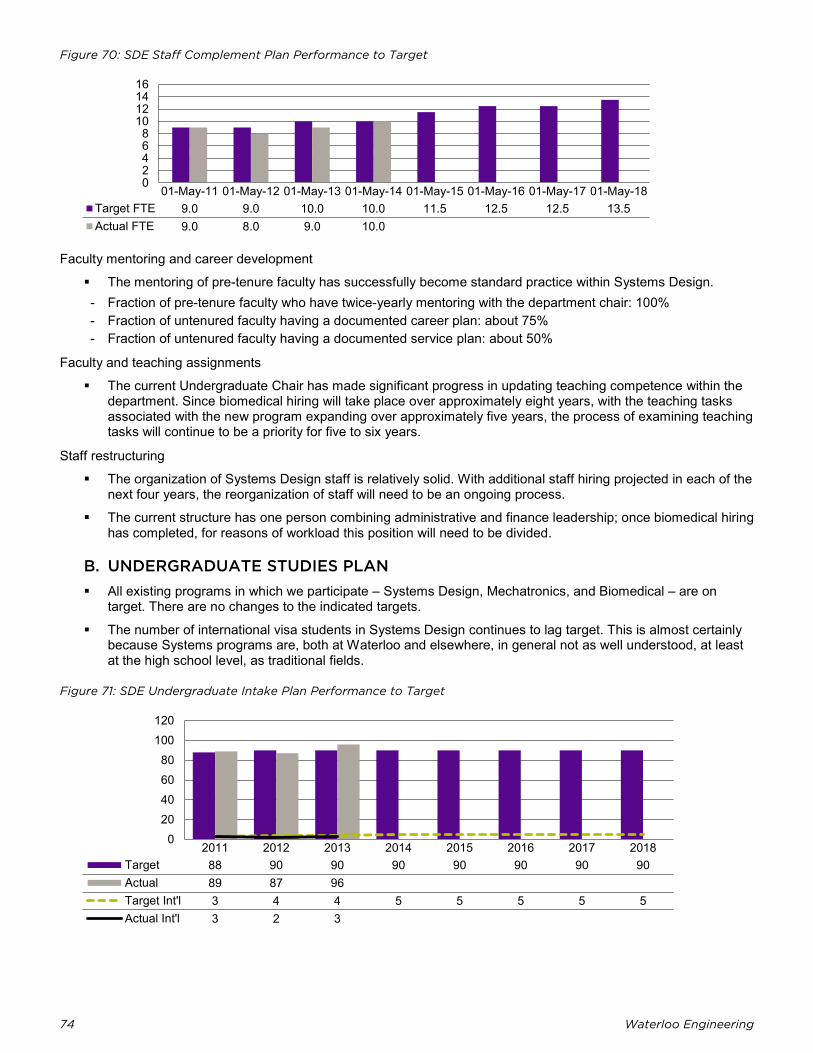
74 Waterloo Engineering
02468
10121416
020406080
100120
Figure 70: SDE Staff Complement Plan Performance to Target
01-May-11 01-May-12 01-May-13 01-May-14 01-May-15 01-May-16 01-May-17 01-May-18Target FTE 9.0 9.0 10.0 10.0 11.5 12.5 12.5 13.5Actual FTE 9.0 8.0 9.0 10.0
Faculty mentoring and career development
The mentoring of pre-tenure faculty has successfully become standard practice within Systems Design. - Fraction of pre-tenure faculty who have twice-yearly mentoring with the department chair: 100% - Fraction of untenured faculty having a documented career plan: about 75% - Fraction of untenured faculty having a documented service plan: about 50%
Faculty and teaching assignments
The current Undergraduate Chair has made significant progress in updating teaching competence within the department. Since biomedical hiring will take place over approximately eight years, with the teaching tasks associated with the new program expanding over approximately five years, the process of examining teaching tasks will continue to be a priority for five to six years.
Staff restructuring
The organization of Systems Design staff is relatively solid. With additional staff hiring projected in each of the next four years, the reorganization of staff will need to be an ongoing process.
The current structure has one person combining administrative and finance leadership; once biomedical hiring has completed, for reasons of workload this position will need to be divided.
B. UNDERGRADUATE STUDIES PLAN All existing programs in which we participate – Systems Design, Mechatronics, and Biomedical – are on
target. There are no changes to the indicated targets.
The number of international visa students in Systems Design continues to lag target. This is almost certainly because Systems programs are, both at Waterloo and elsewhere, in general not as well understood, at least at the high school level, as traditional fields.
Figure 71: SDE Undergraduate Intake Plan Performance to Target
2011 2012 2013 2014 2015 2016 2017 2018Target 88 90 90 90 90 90 90 90Actual 89 87 96Target Int'l 3 4 4 5 5 5 5 5Actual Int'l 3 2 3
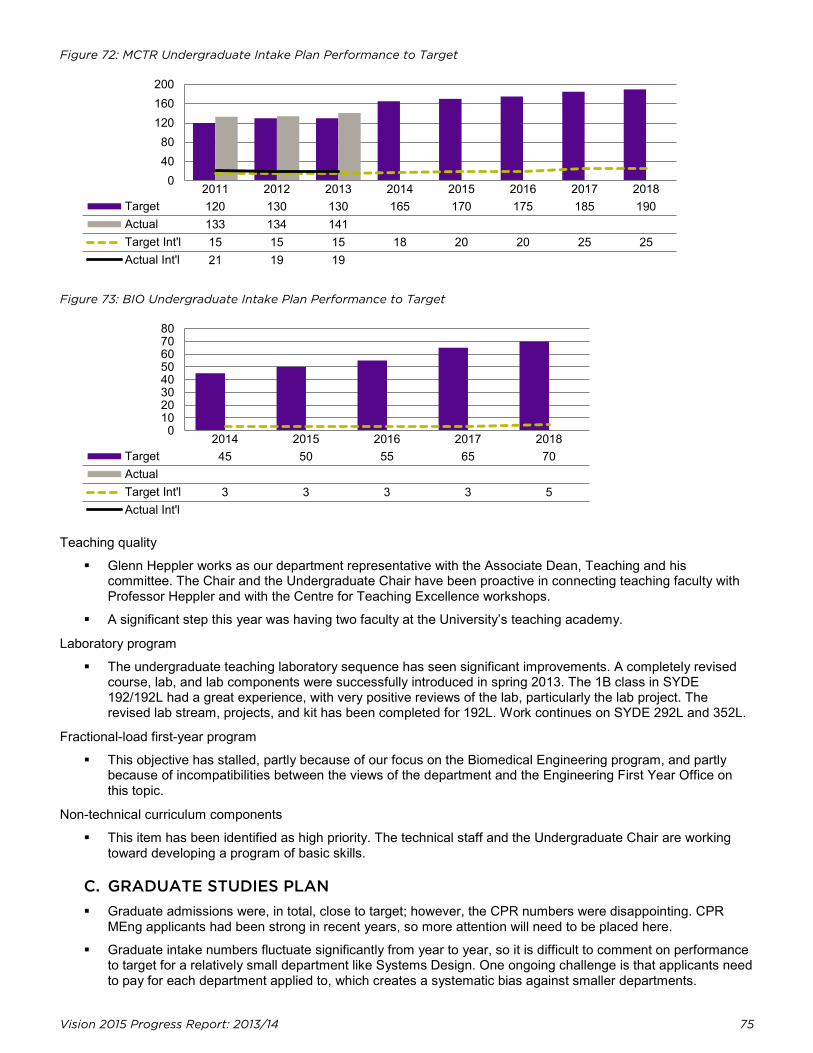
Vision 2015 Progress Report: 2013/14 75
04080
120160200
01020304050607080
Figure 72: MCTR Undergraduate Intake Plan Performance to Target
2011 2012 2013 2014 2015 2016 2017 2018Target 120 130 130 165 170 175 185 190Actual 133 134 141Target Int'l 15 15 15 18 20 20 25 25Actual Int'l 21 19 19
Figure 73: BIO Undergraduate Intake Plan Performance to Target
2014 2015 2016 2017 2018Target 45 50 55 65 70ActualTarget Int'l 3 3 3 3 5Actual Int'l
Teaching quality
Glenn Heppler works as our department representative with the Associate Dean, Teaching and his committee. The Chair and the Undergraduate Chair have been proactive in connecting teaching faculty with Professor Heppler and with the Centre for Teaching Excellence workshops.
A significant step this year was having two faculty at the University’s teaching academy.
Laboratory program
The undergraduate teaching laboratory sequence has seen significant improvements. A completely revised course, lab, and lab components were successfully introduced in spring 2013. The 1B class in SYDE 192/192L had a great experience, with very positive reviews of the lab, particularly the lab project. The revised lab stream, projects, and kit has been completed for 192L. Work continues on SYDE 292L and 352L.
Fractional-load first-year program
This objective has stalled, partly because of our focus on the Biomedical Engineering program, and partly because of incompatibilities between the views of the department and the Engineering First Year Office on this topic.
Non-technical curriculum components
This item has been identified as high priority. The technical staff and the Undergraduate Chair are working toward developing a program of basic skills.
C. GRADUATE STUDIES PLAN Graduate admissions were, in total, close to target; however, the CPR numbers were disappointing. CPR
MEng applicants had been strong in recent years, so more attention will need to be placed here.
Graduate intake numbers fluctuate significantly from year to year, so it is difficult to comment on performance to target for a relatively small department like Systems Design. One ongoing challenge is that applicants need to pay for each department applied to, which creates a systematic bias against smaller departments.
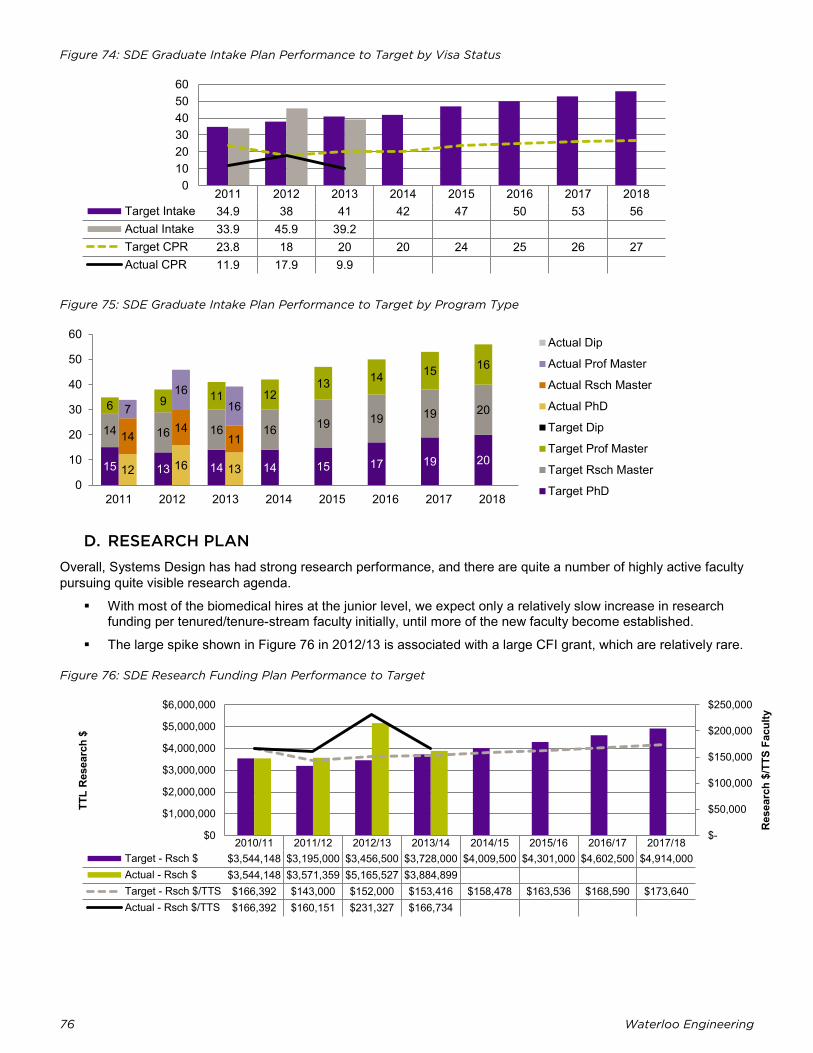
76 Waterloo Engineering
0102030405060
$-
$50,000
$100,000
$150,000
$200,000
$250,000
$0
$1,000,000
$2,000,000
$3,000,000
$4,000,000
$5,000,000
$6,000,000
Res
earc
h $/
TTS
Facu
lty
TTL
Res
earc
h $
Figure 74: SDE Graduate Intake Plan Performance to Target by Visa Status
2011 2012 2013 2014 2015 2016 2017 2018Target Intake 34.9 38 41 42 47 50 53 56Actual Intake 33.9 45.9 39.2Target CPR 23.8 18 20 20 24 25 26 27Actual CPR 11.9 17.9 9.9
Figure 75: SDE Graduate Intake Plan Performance to Target by Program Type
D. RESEARCH PLAN Overall, Systems Design has had strong research performance, and there are quite a number of highly active faculty pursuing quite visible research agenda.
With most of the biomedical hires at the junior level, we expect only a relatively slow increase in research funding per tenured/tenure-stream faculty initially, until more of the new faculty become established.
The large spike shown in Figure 76 in 2012/13 is associated with a large CFI grant, which are relatively rare.
Figure 76: SDE Research Funding Plan Performance to Target
2010/11 2011/12 2012/13 2013/14 2014/15 2015/16 2016/17 2017/18Target - Rsch $ $3,544,148 $3,195,000 $3,456,500 $3,728,000 $4,009,500 $4,301,000 $4,602,500 $4,914,000Actual - Rsch $ $3,544,148 $3,571,359 $5,165,527 $3,884,899Target - Rsch $/TTS $166,392 $143,000 $152,000 $153,416 $158,478 $163,536 $168,590 $173,640Actual - Rsch $/TTS $166,392 $160,151 $231,327 $166,734
15 13 14 14 15 17 19 20
14 16 16 16 19 19 19 20 6 9 11 12 13 14 15 16
12 16 13
14 14
11
7 16
16
2011 2012 2013 2014 2015 2016 2017 20180
10
20
30
40
50
60Actual Dip
Actual Prof Master
Actual Rsch Master
Actual PhD
Target Dip
Target Prof Master
Target Rsch Master
Target PhD
Vision 2015 Progress Report: 2013/14 77
Research directions
This goal is in progress, but requires more work. The Chair has raised the topic and is working to get a number of faculty engaged on longer-term thinking regarding the department and direction, a question associated with the large number of hires made possible by the Biomedical Engineering program.
E. BIOMEDICAL ENGINEERING PLAN The Biomedical Engineering program was approved in December, 2013. Although it launched very last-minute in the applications process, and with no advertising, the program attracted over 500 applicants, over 50% female. A great deal of work remains to be done; however, we are exceptionally pleased with how we have progressed and consider the presence of this program to be a stunning accomplishment of the Vision 2015 plan.
Biomedical Engineering undergraduate program
The program was approved in December, 2013 and the first cohort began studies in September, 2014.
Response from high school students was exceptionally strong, and we would expect that with the promotion and advertising over the past year, the response will be that much stronger in 2014/15.
The next urgency for this program is to identify space for teaching, and research space for new hires. Significant progress has been made in formulating the Engineering 7 floor layout and we are hopeful for the possibility of moving a group into EC4, as described in Section III.I, Space.
Biomedical Engineering graduate program
Much of the department’s energy and priorities focus on the undergraduate Biomedical Engineering program, and the graduate program is not a priority for the time being. As additional faculty are hired, with related research and graduate student goals, the need to consider a graduate program will increase.
F. DESIGN PLAN Design is central to the Systems Design Engineering program, and is also a passion of the current Department Chair and Undergraduate Chair. Nevertheless, the workload associated with the Biomedical Engineering program has made progress on the design sequence challenging. This remains a very high priority; however, there is only modest progress to report.
Design sequence
2013/14 saw a much tighter integration between graphics (101L) and design (161), a development which we believe to be very positive, and re-enforcing prototyping in design and 3D printing.
We have made progress in more clearly developing and defining objectives for second-year design courses.
Design symposia
The symposia have run well in the past few years, but have lacked energy and have become stale. The department needs to put more creative energy into the symposium, creating high expectations of quality among students, and a greater degree of involvement among faculty. This is a project planned for 2014/15.
Design support
Design support was successfully developed in 2013/14 for a dynamics design project in spring 2014.
Significant planning has taken place for space renovation with respect to design, with progress expected in 2014/15.
G. ADVANCEMENT PLAN There have been only very limited advancement related activities in the department; however, the Department
Chair has worked to support advancement in alumni events and alumni visits in Toronto, Boston and Ottawa.
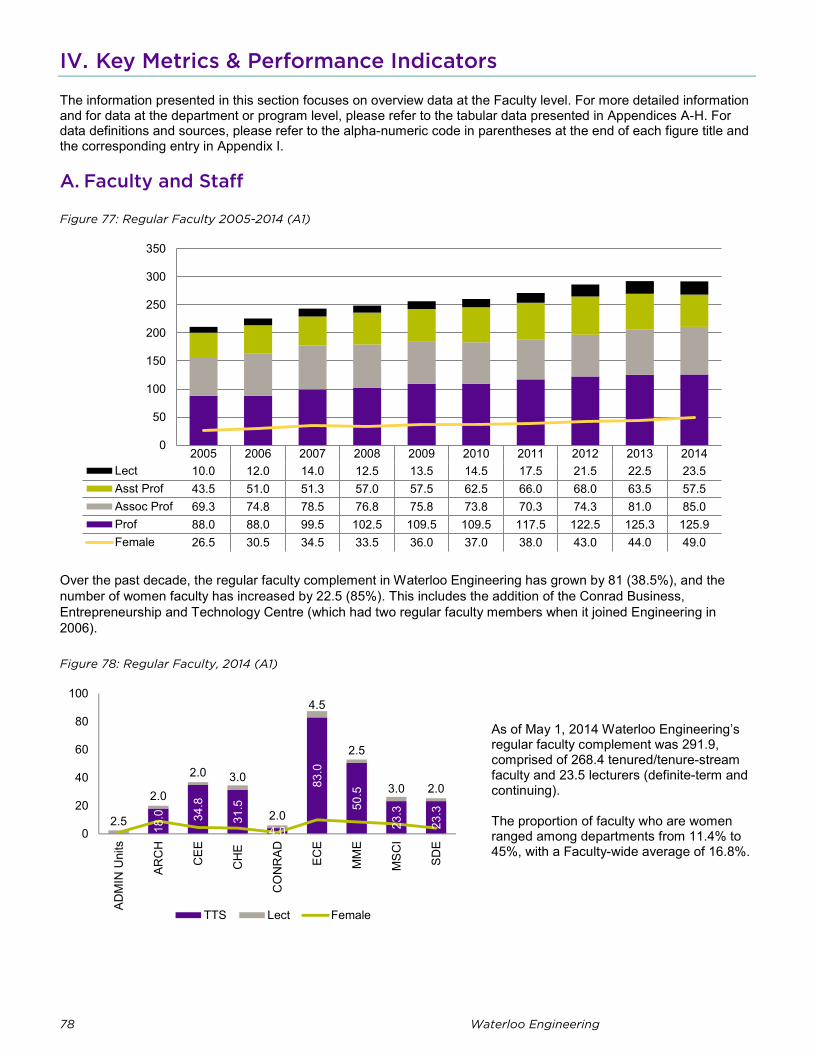
78 Waterloo Engineering
0
50
100
150
200
250
300
350
IV. Key Metrics & Performance Indicators
The information presented in this section focuses on overview data at the Faculty level. For more detailed information and for data at the department or program level, please refer to the tabular data presented in Appendices A-H. For data definitions and sources, please refer to the alpha-numeric code in parentheses at the end of each figure title and the corresponding entry in Appendix I.
A. Faculty and Staff
Figure 77: Regular Faculty 2005-2014 (A1)
2005 2006 2007 2008 2009 2010 2011 2012 2013 2014Lect 10.0 12.0 14.0 12.5 13.5 14.5 17.5 21.5 22.5 23.5Asst Prof 43.5 51.0 51.3 57.0 57.5 62.5 66.0 68.0 63.5 57.5Assoc Prof 69.3 74.8 78.5 76.8 75.8 73.8 70.3 74.3 81.0 85.0Prof 88.0 88.0 99.5 102.5 109.5 109.5 117.5 122.5 125.3 125.9Female 26.5 30.5 34.5 33.5 36.0 37.0 38.0 43.0 44.0 49.0
Over the past decade, the regular faculty complement in Waterloo Engineering has grown by 81 (38.5%), and the number of women faculty has increased by 22.5 (85%). This includes the addition of the Conrad Business, Entrepreneurship and Technology Centre (which had two regular faculty members when it joined Engineering in 2006).
Figure 78: Regular Faculty, 2014 (A1)
As of May 1, 2014 Waterloo Engineering’s regular faculty complement was 291.9, comprised of 268.4 tenured/tenure-stream faculty and 23.5 lecturers (definite-term and continuing).
The proportion of faculty who are women ranged among departments from 11.4% to 45%, with a Faculty-wide average of 16.8%.
18.0
34.8
31.5
4.0
83.0
50.5
23.3
23.3
2.5
2.0
2.0 3.0
2.0
4.5
2.5
3.0 2.0
0
20
40
60
80
100
ADM
IN U
nits
ARC
H
CEE
CH
E
CO
NR
AD ECE
MM
E
MSC
I
SDE
TTS Lect Female
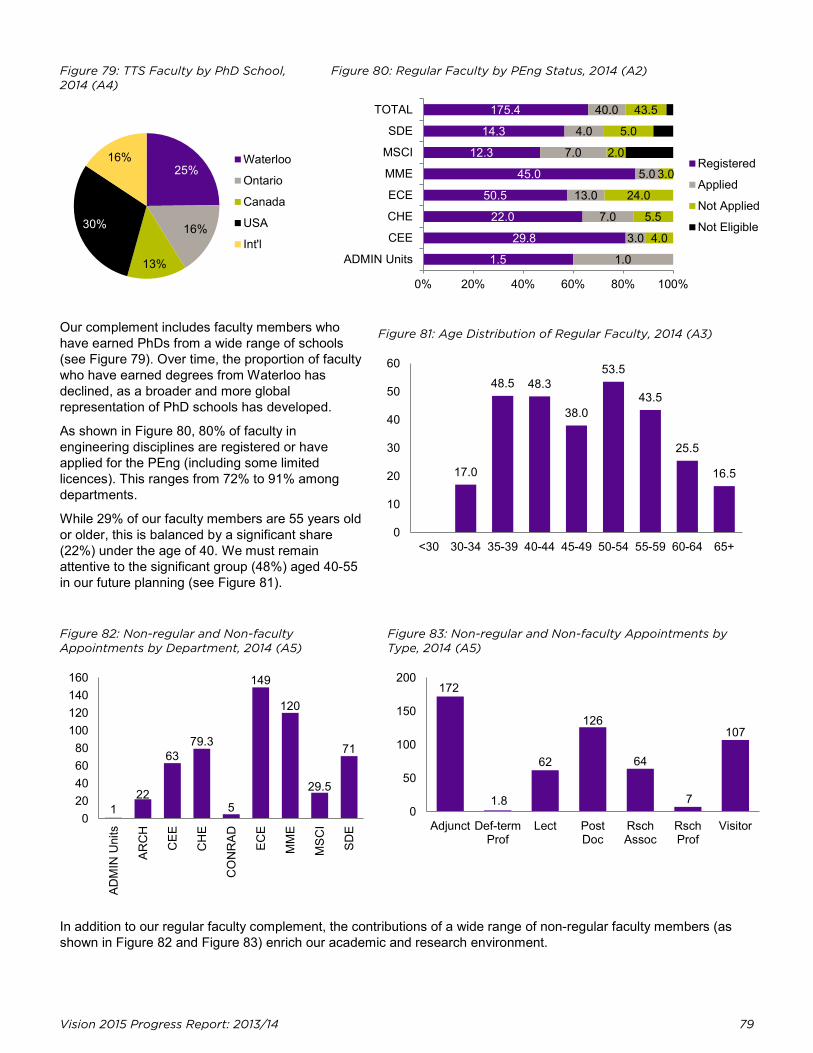
Vision 2015 Progress Report: 2013/14 79
Figure 79: TTS Faculty by PhD School, 2014 (A4)
Figure 80: Regular Faculty by PEng Status, 2014 (A2)
Our complement includes faculty members who have earned PhDs from a wide range of schools (see Figure 79). Over time, the proportion of faculty who have earned degrees from Waterloo has declined, as a broader and more global representation of PhD schools has developed.
As shown in Figure 80, 80% of faculty in engineering disciplines are registered or have applied for the PEng (including some limited licences). This ranges from 72% to 91% among departments.
While 29% of our faculty members are 55 years old or older, this is balanced by a significant share (22%) under the age of 40. We must remain attentive to the significant group (48%) aged 40-55 in our future planning (see Figure 81).
Figure 81: Age Distribution of Regular Faculty, 2014 (A3)
Figure 82: Non-regular and Non-faculty Appointments by Department, 2014 (A5)
Figure 83: Non-regular and Non-faculty Appointments by Type, 2014 (A5)
In addition to our regular faculty complement, the contributions of a wide range of non-regular faculty members (as shown in Figure 82 and Figure 83) enrich our academic and research environment.
25%
16%
13%
30%
16% Waterloo
Ontario
Canada
USA
Int'l1.5
29.8
22.0
50.5
45.0
12.3
14.3
175.4
1.0
3.0
7.0
13.0
5.0
7.0
4.0
40.0
4.0
5.5
24.0
3.0
2.0
5.0
43.5
0% 20% 40% 60% 80% 100%
ADMIN Units
CEE
CHE
ECE
MME
MSCI
SDE
TOTAL
Registered
Applied
Not Applied
Not Eligible
17.0
48.5 48.3
38.0
53.5
43.5
25.5
16.5
0
10
20
30
40
50
60
<30 30-34 35-39 40-44 45-49 50-54 55-59 60-64 65+
1 22
63 79.3
5
149
120
29.5
71
020406080
100120140160
ADM
IN U
nits
ARC
H
CEE
CH
E
CO
NR
AD ECE
MM
E
MSC
I
SDE
172
1.8
62
126
64
7
107
0
50
100
150
200
Adjunct Def-termProf
Lect PostDoc
RschAssoc
RschProf
Visitor
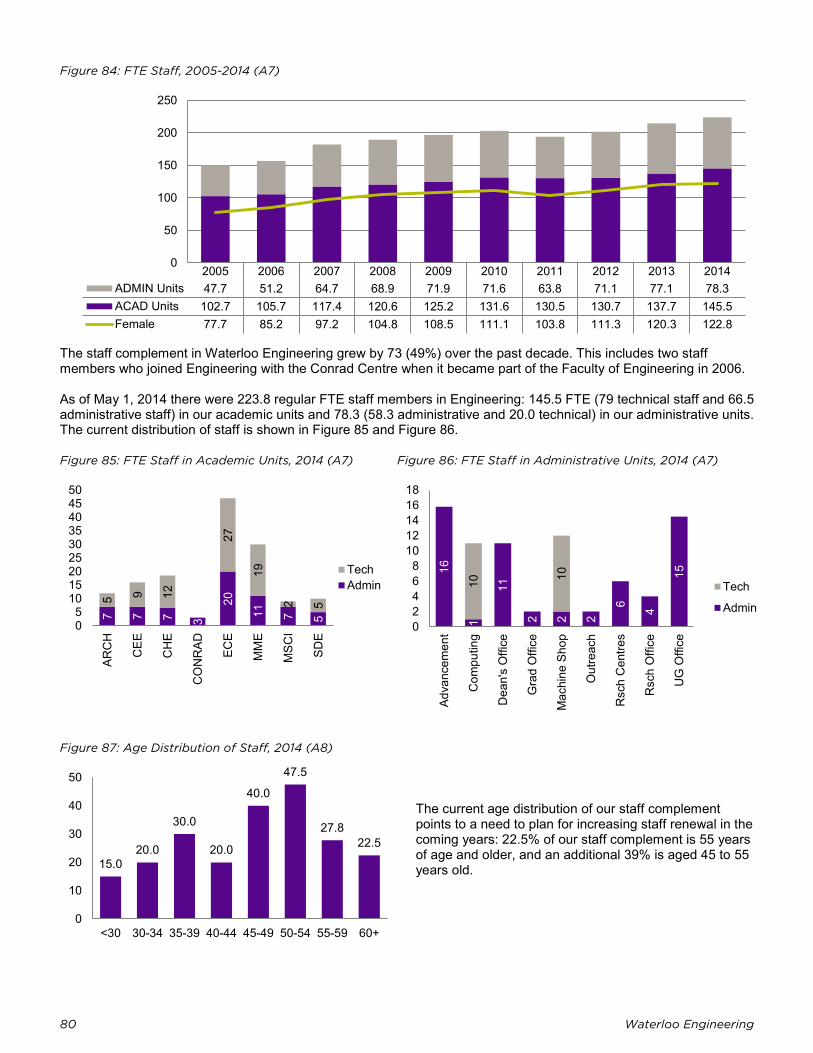
80 Waterloo Engineering
0
50
100
150
200
250
Figure 84: FTE Staff, 2005-2014 (A7)
2005 2006 2007 2008 2009 2010 2011 2012 2013 2014ADMIN Units 47.7 51.2 64.7 68.9 71.9 71.6 63.8 71.1 77.1 78.3ACAD Units 102.7 105.7 117.4 120.6 125.2 131.6 130.5 130.7 137.7 145.5Female 77.7 85.2 97.2 104.8 108.5 111.1 103.8 111.3 120.3 122.8
The staff complement in Waterloo Engineering grew by 73 (49%) over the past decade. This includes two staff members who joined Engineering with the Conrad Centre when it became part of the Faculty of Engineering in 2006.
As of May 1, 2014 there were 223.8 regular FTE staff members in Engineering: 145.5 FTE (79 technical staff and 66.5 administrative staff) in our academic units and 78.3 (58.3 administrative and 20.0 technical) in our administrative units. The current distribution of staff is shown in Figure 85 and Figure 86.
Figure 85: FTE Staff in Academic Units, 2014 (A7) Figure 86: FTE Staff in Administrative Units, 2014 (A7)
Figure 87: Age Distribution of Staff, 2014 (A8)
The current age distribution of our staff complement points to a need to plan for increasing staff renewal in the coming years: 22.5% of our staff complement is 55 years of age and older, and an additional 39% is aged 45 to 55 years old.
7 7 7 3
20
11
7 5
5 9 12
27
19
2 5
05
101520253035404550
ARC
H
CEE
CH
E
CO
NR
AD ECE
MM
E
MSC
I
SDE
TechAdmin
16
1
11
2 2 2
6 4
15
10 10
02468
1012141618
Adva
ncem
ent
Com
putin
g
Dea
n's
Offi
ce
Gra
d O
ffice
Mac
hine
Sho
p
Out
reac
h
Rsc
h C
entre
s
Rsc
h O
ffice
UG
Offi
ce
Tech
Admin
15.0 20.0
30.0
20.0
40.0
47.5
27.8 22.5
0
10
20
30
40
50
<30 30-34 35-39 40-44 45-49 50-54 55-59 60+
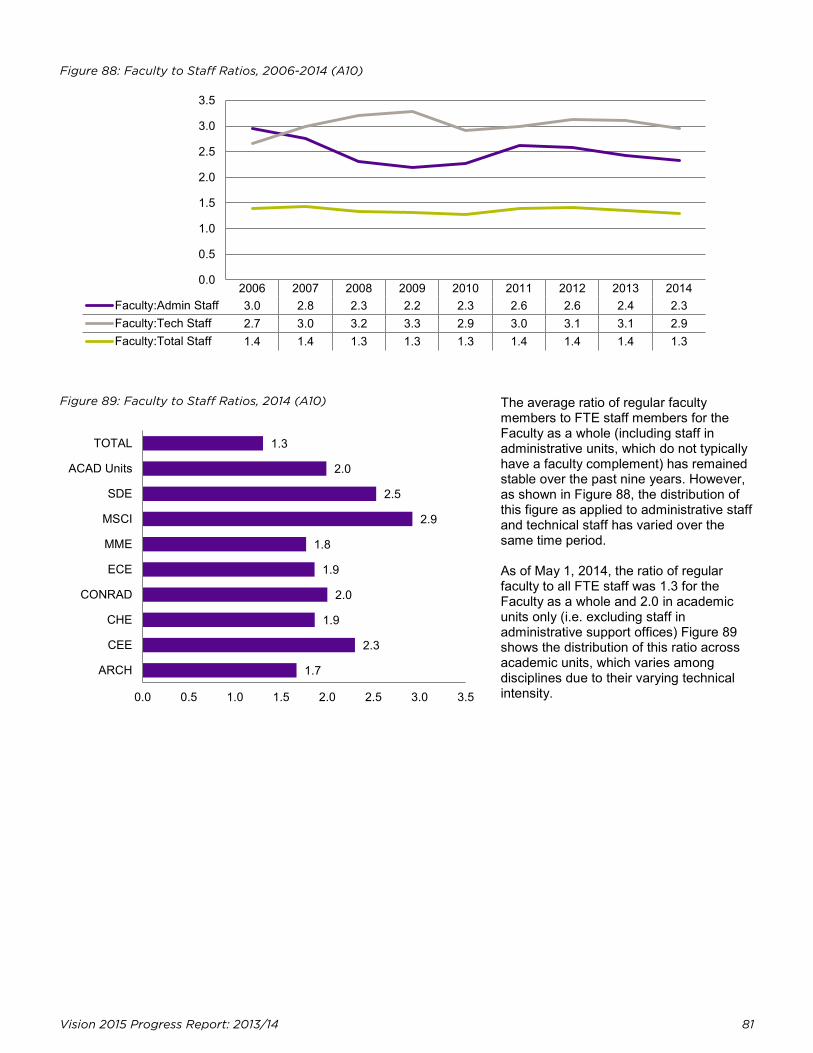
Vision 2015 Progress Report: 2013/14 81
0.0
0.5
1.0
1.5
2.0
2.5
3.0
3.5
Figure 88: Faculty to Staff Ratios, 2006-2014 (A10)
2006 2007 2008 2009 2010 2011 2012 2013 2014Faculty:Admin Staff 3.0 2.8 2.3 2.2 2.3 2.6 2.6 2.4 2.3Faculty:Tech Staff 2.7 3.0 3.2 3.3 2.9 3.0 3.1 3.1 2.9Faculty:Total Staff 1.4 1.4 1.3 1.3 1.3 1.4 1.4 1.4 1.3
Figure 89: Faculty to Staff Ratios, 2014 (A10) The average ratio of regular faculty members to FTE staff members for the Faculty as a whole (including staff in administrative units, which do not typically have a faculty complement) has remained stable over the past nine years. However, as shown in Figure 88, the distribution of this figure as applied to administrative staff and technical staff has varied over the same time period.
As of May 1, 2014, the ratio of regular faculty to all FTE staff was 1.3 for the Faculty as a whole and 2.0 in academic units only (i.e. excluding staff in administrative support offices) Figure 89 shows the distribution of this ratio across academic units, which varies among disciplines due to their varying technical intensity.
1.7
2.3
1.9
2.0
1.9
1.8
2.9
2.5
2.0
1.3
0.0 0.5 1.0 1.5 2.0 2.5 3.0 3.5
ARCH
CEE
CHE
CONRAD
ECE
MME
MSCI
SDE
ACAD Units
TOTAL
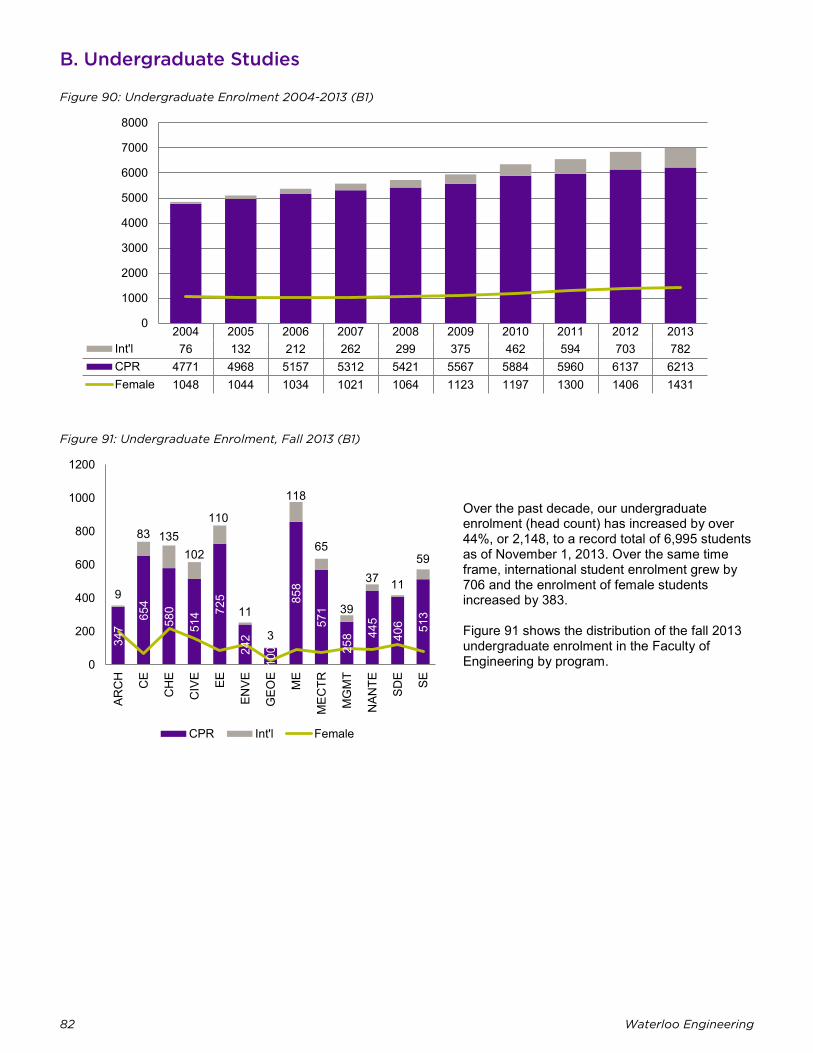
82 Waterloo Engineering
0
1000
2000
3000
4000
5000
6000
7000
8000
B. Undergraduate Studies
Figure 90: Undergraduate Enrolment 2004-2013 (B1)
2004 2005 2006 2007 2008 2009 2010 2011 2012 2013Int'l 76 132 212 262 299 375 462 594 703 782CPR 4771 4968 5157 5312 5421 5567 5884 5960 6137 6213Female 1048 1044 1034 1021 1064 1123 1197 1300 1406 1431
Figure 91: Undergraduate Enrolment, Fall 2013 (B1)
Over the past decade, our undergraduate enrolment (head count) has increased by over 44%, or 2,148, to a record total of 6,995 students as of November 1, 2013. Over the same time frame, international student enrolment grew by 706 and the enrolment of female students increased by 383.
Figure 91 shows the distribution of the fall 2013 undergraduate enrolment in the Faculty of Engineering by program.
347
654
580
514 72
5
242
100
858
571
258 44
5
406 51
3
9
83 135 102
110
11
3
118
65
39
37 11
59
0
200
400
600
800
1000
1200
ARC
H CE
CH
E
CIV
E EE
ENVE
GEO
E
ME
MEC
TR
MG
MT
NAN
TE
SDE SE
CPR Int'l Female
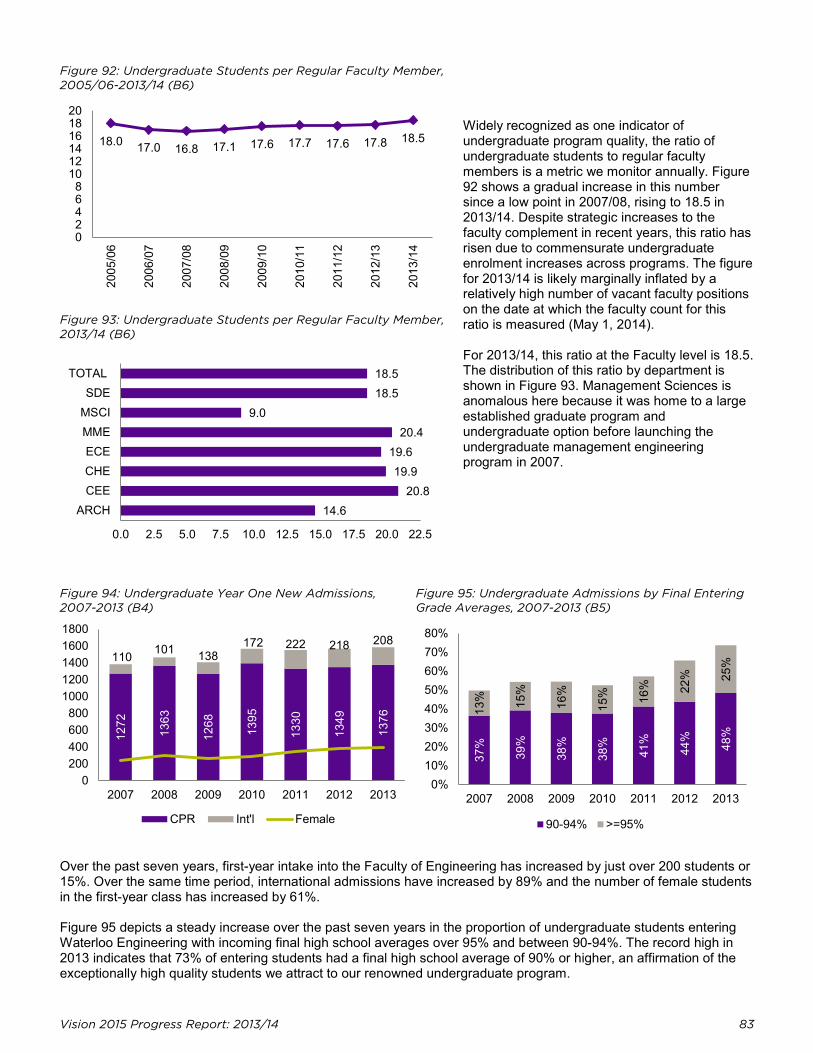
Vision 2015 Progress Report: 2013/14 83
Figure 92: Undergraduate Students per Regular Faculty Member, 2005/06-2013/14 (B6)
Widely recognized as one indicator of undergraduate program quality, the ratio of undergraduate students to regular faculty members is a metric we monitor annually. Figure 92 shows a gradual increase in this number since a low point in 2007/08, rising to 18.5 in 2013/14. Despite strategic increases to the faculty complement in recent years, this ratio has risen due to commensurate undergraduate enrolment increases across programs. The figure for 2013/14 is likely marginally inflated by a relatively high number of vacant faculty positions on the date at which the faculty count for this ratio is measured (May 1, 2014).
For 2013/14, this ratio at the Faculty level is 18.5. The distribution of this ratio by department is shown in Figure 93. Management Sciences is anomalous here because it was home to a large established graduate program and undergraduate option before launching the undergraduate management engineering program in 2007.
Figure 93: Undergraduate Students per Regular Faculty Member, 2013/14 (B6)
Figure 94: Undergraduate Year One New Admissions, 2007-2013 (B4)
Figure 95: Undergraduate Admissions by Final Entering Grade Averages, 2007-2013 (B5)
Over the past seven years, first-year intake into the Faculty of Engineering has increased by just over 200 students or 15%. Over the same time period, international admissions have increased by 89% and the number of female students in the first-year class has increased by 61%.
Figure 95 depicts a steady increase over the past seven years in the proportion of undergraduate students entering Waterloo Engineering with incoming final high school averages over 95% and between 90-94%. The record high in 2013 indicates that 73% of entering students had a final high school average of 90% or higher, an affirmation of the exceptionally high quality students we attract to our renowned undergraduate program.
18.0 17.0 16.8 17.1 17.6 17.7 17.6 17.8 18.5
02468
101214161820
2005
/06
2006
/07
2007
/08
2008
/09
2009
/10
2010
/11
2011
/12
2012
/13
2013
/14
14.6 20.8
19.9 19.6
20.4 9.0
18.5 18.5
0.0 2.5 5.0 7.5 10.0 12.5 15.0 17.5 20.0 22.5
ARCHCEECHEECEMMEMSCISDE
TOTAL
1272
1363
1268
1395
1330
1349
1376
110 101 138 172 222 218 208
0200400600800
10001200140016001800
2007 2008 2009 2010 2011 2012 2013
CPR Int'l Female
37%
39%
38%
38%
41%
44%
48%
13%
15%
16%
15%
16%
22%
25%
0%10%20%30%40%50%60%70%80%
2007 2008 2009 2010 2011 2012 2013
90-94% >=95%
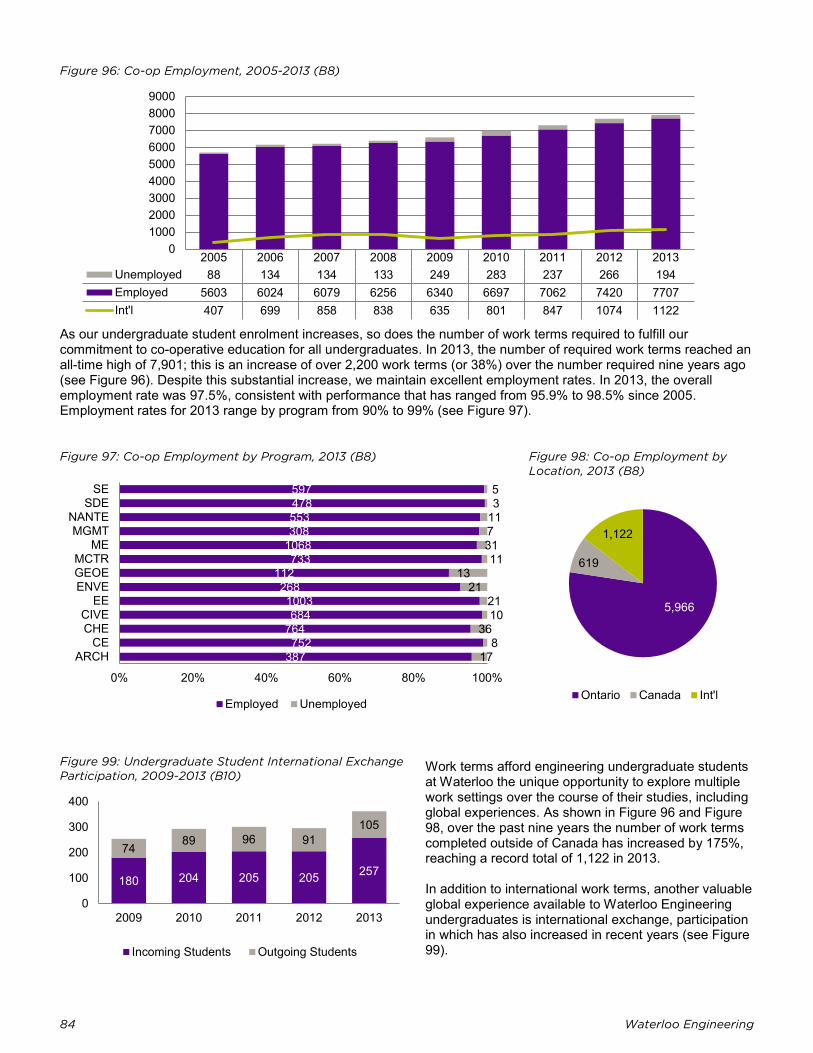
84 Waterloo Engineering
0100020003000400050006000700080009000
Figure 96: Co-op Employment, 2005-2013 (B8)
2005 2006 2007 2008 2009 2010 2011 2012 2013Unemployed 88 134 134 133 249 283 237 266 194Employed 5603 6024 6079 6256 6340 6697 7062 7420 7707Int'l 407 699 858 838 635 801 847 1074 1122
As our undergraduate student enrolment increases, so does the number of work terms required to fulfill our commitment to co-operative education for all undergraduates. In 2013, the number of required work terms reached an all-time high of 7,901; this is an increase of over 2,200 work terms (or 38%) over the number required nine years ago (see Figure 96). Despite this substantial increase, we maintain excellent employment rates. In 2013, the overall employment rate was 97.5%, consistent with performance that has ranged from 95.9% to 98.5% since 2005. Employment rates for 2013 range by program from 90% to 99% (see Figure 97).
Figure 97: Co-op Employment by Program, 2013 (B8) Figure 98: Co-op Employment by Location, 2013 (B8)
Figure 99: Undergraduate Student International Exchange Participation, 2009-2013 (B10)
Work terms afford engineering undergraduate students at Waterloo the unique opportunity to explore multiple work settings over the course of their studies, including global experiences. As shown in Figure 96 and Figure 98, over the past nine years the number of work terms completed outside of Canada has increased by 175%, reaching a record total of 1,122 in 2013.
In addition to international work terms, another valuable global experience available to Waterloo Engineering undergraduates is international exchange, participation in which has also increased in recent years (see Figure 99).
387 752
764 684
1003 268
112 733
1068 308 553 478 597
17 8
36 10 21
21 13
11 31 7 11 3 5
0% 20% 40% 60% 80% 100%
ARCHCE
CHECIVE
EEENVEGEOEMCTR
MEMGMT
NANTESDE
SE
Employed Unemployed
5,966
619
1,122
Ontario Canada Int'l
180 204 205 205 257
74 89 96 91 105
0
100
200
300
400
2009 2010 2011 2012 2013
Incoming Students Outgoing Students
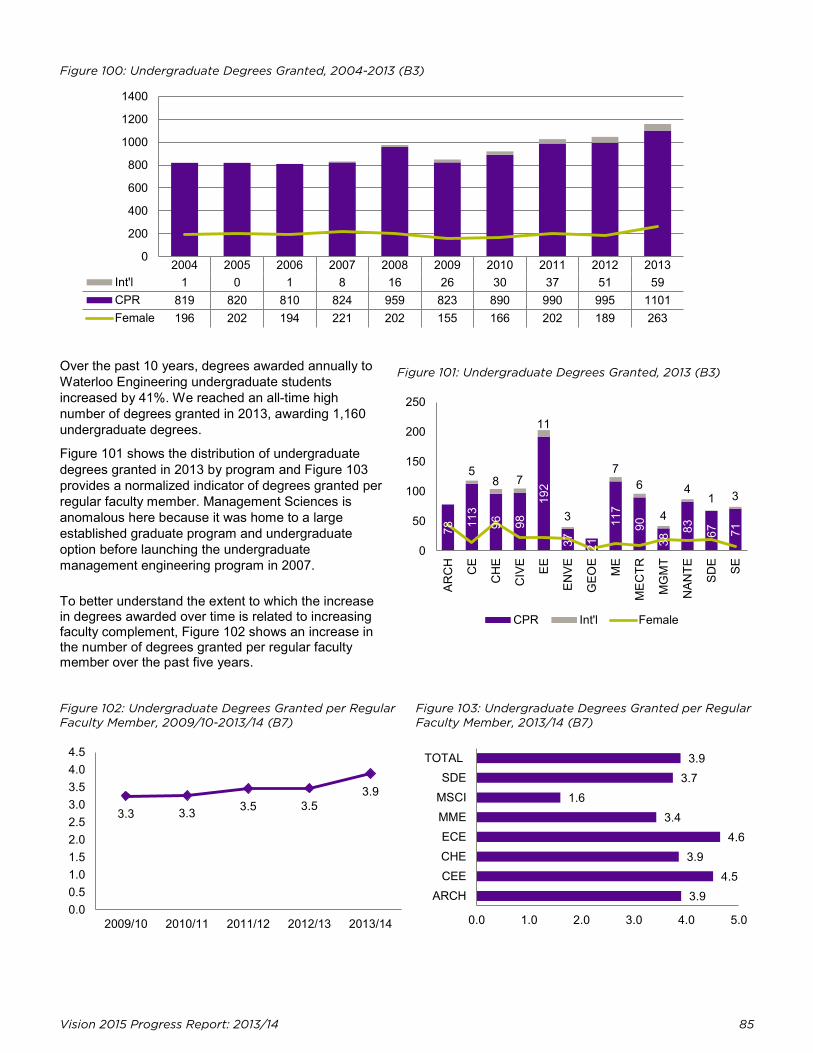
Vision 2015 Progress Report: 2013/14 85
0
200
400
600
800
1000
1200
1400
Figure 100: Undergraduate Degrees Granted, 2004-2013 (B3)
2004 2005 2006 2007 2008 2009 2010 2011 2012 2013Int'l 1 0 1 8 16 26 30 37 51 59CPR 819 820 810 824 959 823 890 990 995 1101Female 196 202 194 221 202 155 166 202 189 263
Over the past 10 years, degrees awarded annually to Waterloo Engineering undergraduate students increased by 41%. We reached an all-time high number of degrees granted in 2013, awarding 1,160 undergraduate degrees.
Figure 101 shows the distribution of undergraduate degrees granted in 2013 by program and Figure 103 provides a normalized indicator of degrees granted per regular faculty member. Management Sciences is anomalous here because it was home to a large established graduate program and undergraduate option before launching the undergraduate management engineering program in 2007.
To better understand the extent to which the increase in degrees awarded over time is related to increasing faculty complement, Figure 102 shows an increase in the number of degrees granted per regular faculty member over the past five years.
Figure 101: Undergraduate Degrees Granted, 2013 (B3)
Figure 102: Undergraduate Degrees Granted per Regular Faculty Member, 2009/10-2013/14 (B7)
Figure 103: Undergraduate Degrees Granted per Regular Faculty Member, 2013/14 (B7)
78 11
3
96
98
192
37
21
117
90
38 83
67
71
5 8 7
11
3
7 6
4
4 1 3
0
50
100
150
200
250
ARC
H CE
CH
E
CIV
E EE
ENVE
GEO
E
ME
MEC
TR
MG
MT
NAN
TE
SDE SE
CPR Int'l Female
3.3 3.3 3.5 3.5 3.9
0.00.51.01.52.02.53.03.54.04.5
2009/10 2010/11 2011/12 2012/13 2013/14
3.9 4.5
3.9 4.6
3.4 1.6
3.7 3.9
0.0 1.0 2.0 3.0 4.0 5.0
ARCHCEECHEECEMMEMSCISDE
TOTAL
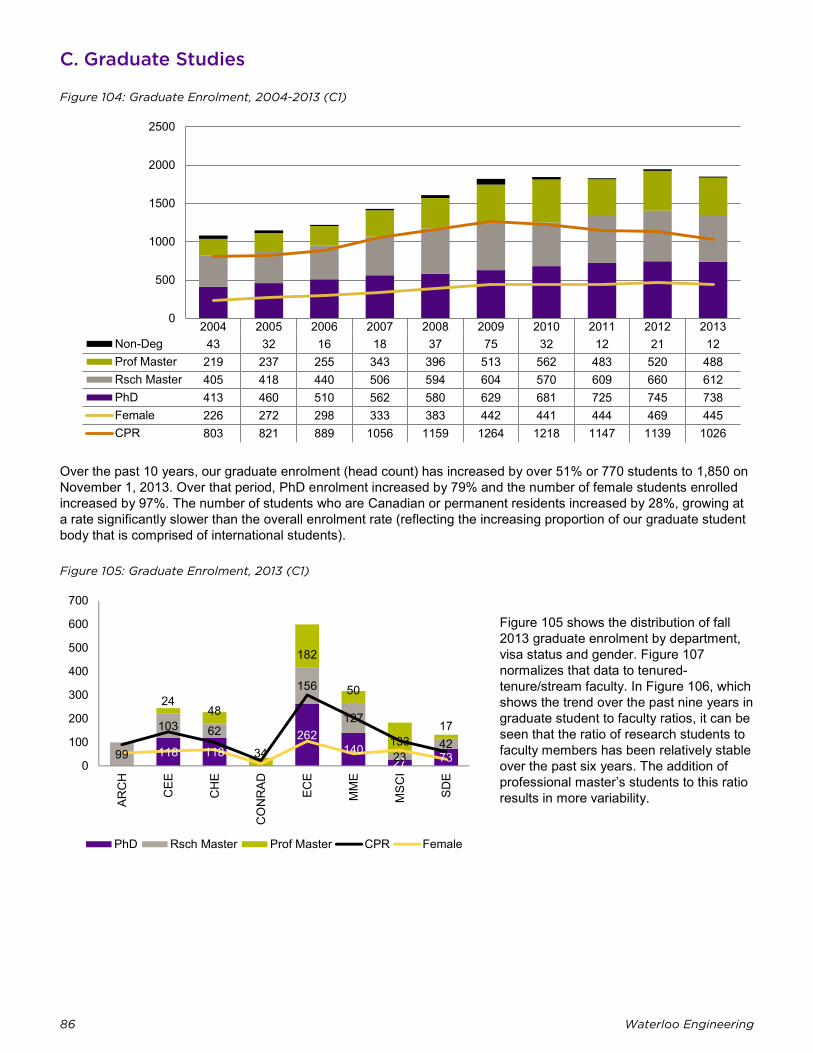
86 Waterloo Engineering
0
500
1000
1500
2000
2500
C. Graduate Studies
Figure 104: Graduate Enrolment, 2004-2013 (C1)
2004 2005 2006 2007 2008 2009 2010 2011 2012 2013Non-Deg 43 32 16 18 37 75 32 12 21 12Prof Master 219 237 255 343 396 513 562 483 520 488Rsch Master 405 418 440 506 594 604 570 609 660 612PhD 413 460 510 562 580 629 681 725 745 738Female 226 272 298 333 383 442 441 444 469 445CPR 803 821 889 1056 1159 1264 1218 1147 1139 1026
Over the past 10 years, our graduate enrolment (head count) has increased by over 51% or 770 students to 1,850 on November 1, 2013. Over that period, PhD enrolment increased by 79% and the number of female students enrolled increased by 97%. The number of students who are Canadian or permanent residents increased by 28%, growing at a rate significantly slower than the overall enrolment rate (reflecting the increasing proportion of our graduate student body that is comprised of international students).
Figure 105: Graduate Enrolment, 2013 (C1)
Figure 105 shows the distribution of fall 2013 graduate enrolment by department, visa status and gender. Figure 107 normalizes that data to tenured-tenure/stream faculty. In Figure 106, which shows the trend over the past nine years in graduate student to faculty ratios, it can be seen that the ratio of research students to faculty members has been relatively stable over the past six years. The addition of professional master’s students to this ratio results in more variability.
118 118 262
140 27 73 99
103 62
156
127
23 42
24 48
34
182
50
133 17
0
100
200
300
400
500
600
700
ARC
H
CEE
CH
E
CO
NR
AD ECE
MM
E
MSC
I
SDE
PhD Rsch Master Prof Master CPR Female
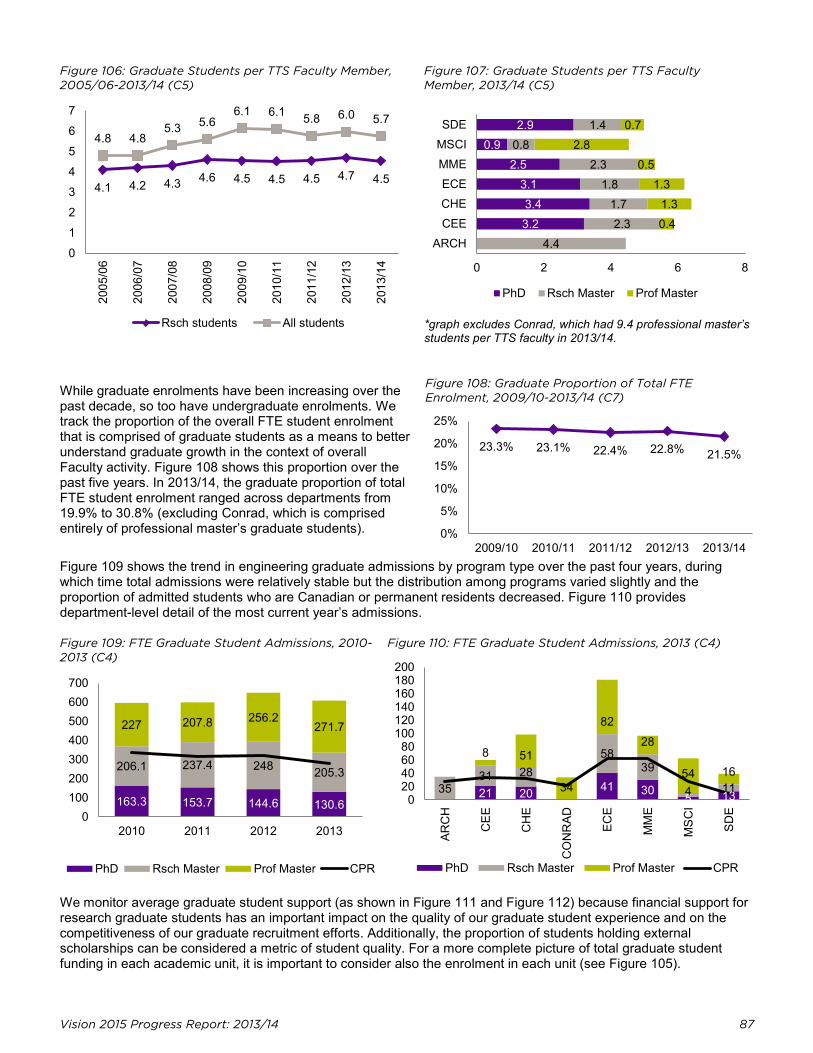
Vision 2015 Progress Report: 2013/14 87
Figure 106: Graduate Students per TTS Faculty Member, 2005/06-2013/14 (C5)
Figure 107: Graduate Students per TTS Faculty Member, 2013/14 (C5)
*graph excludes Conrad, which had 9.4 professional master’s students per TTS faculty in 2013/14.
While graduate enrolments have been increasing over the past decade, so too have undergraduate enrolments. We track the proportion of the overall FTE student enrolment that is comprised of graduate students as a means to better understand graduate growth in the context of overall Faculty activity. Figure 108 shows this proportion over the past five years. In 2013/14, the graduate proportion of total FTE student enrolment ranged across departments from 19.9% to 30.8% (excluding Conrad, which is comprised entirely of professional master’s graduate students).
Figure 108: Graduate Proportion of Total FTE Enrolment, 2009/10-2013/14 (C7)
Figure 109 shows the trend in engineering graduate admissions by program type over the past four years, during which time total admissions were relatively stable but the distribution among programs varied slightly and the proportion of admitted students who are Canadian or permanent residents decreased. Figure 110 provides department-level detail of the most current year’s admissions.
Figure 109: FTE Graduate Student Admissions, 2010-2013 (C4)
Figure 110: FTE Graduate Student Admissions, 2013 (C4)
We monitor average graduate student support (as shown in Figure 111 and Figure 112) because financial support for research graduate students has an important impact on the quality of our graduate student experience and on the competitiveness of our graduate recruitment efforts. Additionally, the proportion of students holding external scholarships can be considered a metric of student quality. For a more complete picture of total graduate student funding in each academic unit, it is important to consider also the enrolment in each unit (see Figure 105).
4.1 4.2 4.3 4.6 4.5 4.5 4.5 4.7 4.5
4.8 4.8 5.3 5.6
6.1 6.1 5.8 6.0 5.7
01234567
2005
/06
2006
/07
2007
/08
2008
/09
2009
/10
2010
/11
2011
/12
2012
/13
2013
/14
Rsch students All students
3.2 3.4
3.1 2.5
0.9 2.9
4.4 2.3
1.7 1.8
2.3 0.8
1.4
0.4 1.3
1.3 0.5
2.8 0.7
0 2 4 6 8
ARCHCEECHEECEMMEMSCISDE
PhD Rsch Master Prof Master
23.3% 23.1% 22.4% 22.8% 21.5%
0%
5%
10%
15%
20%
25%
2009/10 2010/11 2011/12 2012/13 2013/14
163.3 153.7 144.6 130.6
206.1 237.4 248 205.3
227 207.8 256.2 271.7
0100200300400500600700
2010 2011 2012 2013
PhD Rsch Master Prof Master CPR
21 20 41 30 5 13 35
31 28 58
39
4 11
8 51
34
82 28
54 16
020406080
100120140160180200
ARC
H
CEE
CH
E
CO
NR
AD ECE
MM
E
MSC
I
SDE
PhD Rsch Master Prof Master CPR
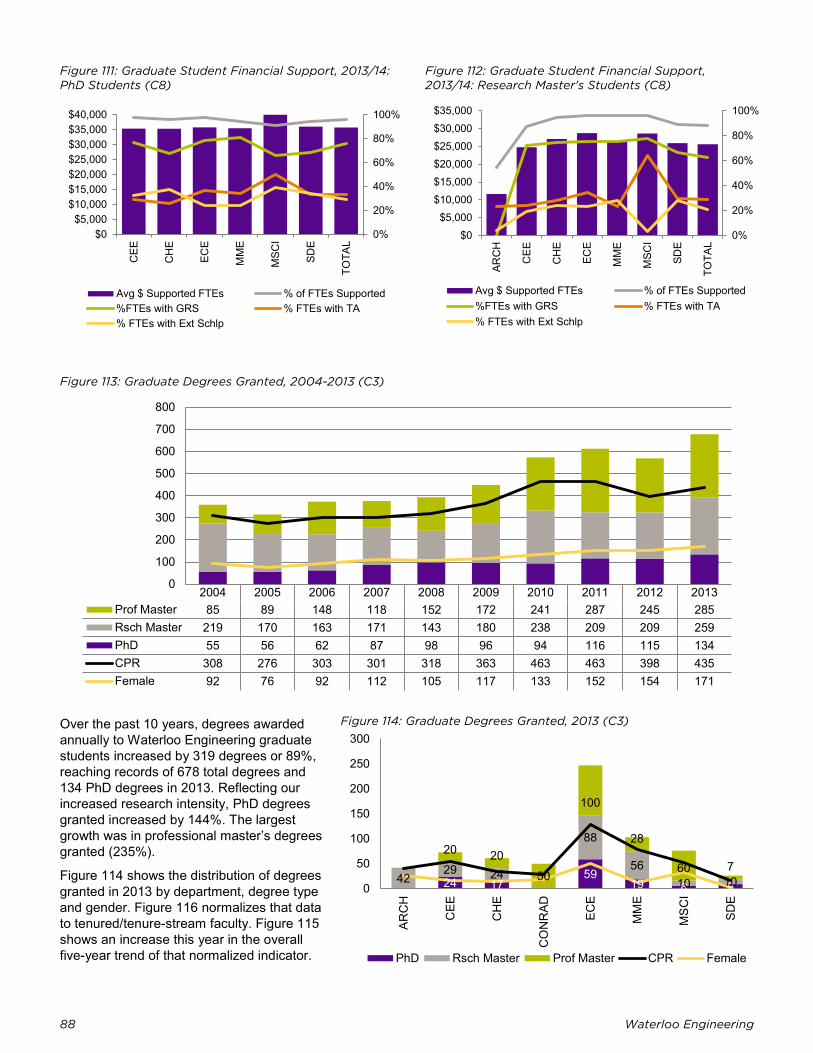
88 Waterloo Engineering
0
100
200
300
400
500
600
700
800
Figure 111: Graduate Student Financial Support, 2013/14: PhD Students (C8)
Figure 112: Graduate Student Financial Support, 2013/14: Research Master's Students (C8)
Figure 113: Graduate Degrees Granted, 2004-2013 (C3)
2004 2005 2006 2007 2008 2009 2010 2011 2012 2013Prof Master 85 89 148 118 152 172 241 287 245 285Rsch Master 219 170 163 171 143 180 238 209 209 259PhD 55 56 62 87 98 96 94 116 115 134CPR 308 276 303 301 318 363 463 463 398 435Female 92 76 92 112 105 117 133 152 154 171
Over the past 10 years, degrees awarded annually to Waterloo Engineering graduate students increased by 319 degrees or 89%, reaching records of 678 total degrees and 134 PhD degrees in 2013. Reflecting our increased research intensity, PhD degrees granted increased by 144%. The largest growth was in professional master’s degrees granted (235%).
Figure 114 shows the distribution of degrees granted in 2013 by department, degree type and gender. Figure 116 normalizes that data to tenured/tenure-stream faculty. Figure 115 shows an increase this year in the overall five-year trend of that normalized indicator.
Figure 114: Graduate Degrees Granted, 2013 (C3)
0%
20%
40%
60%
80%
100%
$0$5,000
$10,000$15,000$20,000$25,000$30,000$35,000$40,000
CEE
CH
E
ECE
MM
E
MSC
I
SDE
TOTA
L
Avg $ Supported FTEs % of FTEs Supported%FTEs with GRS % FTEs with TA% FTEs with Ext Schlp
0%
20%
40%
60%
80%
100%
$0$5,000
$10,000$15,000$20,000$25,000$30,000$35,000
ARC
H
CEE
CH
E
ECE
MM
E
MSC
I
SDE
TOTA
L
Avg $ Supported FTEs % of FTEs Supported%FTEs with GRS % FTEs with TA% FTEs with Ext Schlp
24 17 59
19 6 9 42
29 24
88
56 10 10
20 20
50
100
28
60 7
0
50
100
150
200
250
300
ARC
H
CEE
CH
E
CO
NR
AD ECE
MM
E
MSC
I
SDE
PhD Rsch Master Prof Master CPR Female
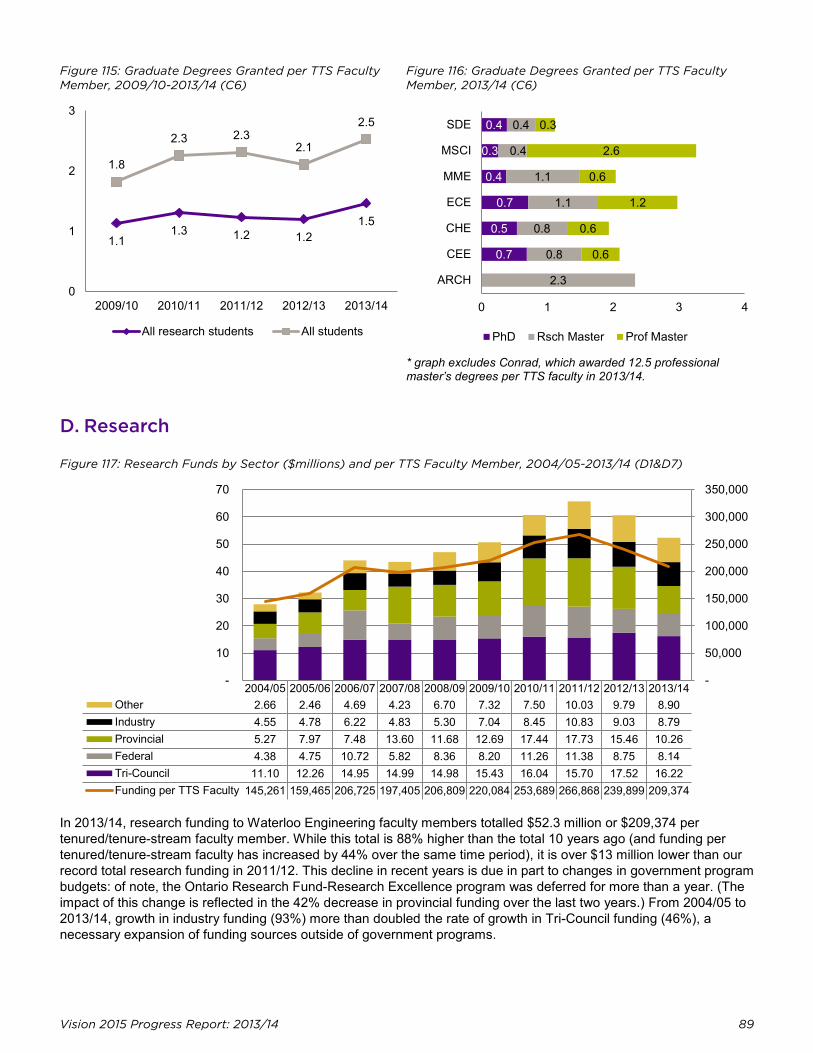
Vision 2015 Progress Report: 2013/14 89
-
50,000
100,000
150,000
200,000
250,000
300,000
350,000
-
10
20
30
40
50
60
70
Figure 115: Graduate Degrees Granted per TTS Faculty Member, 2009/10-2013/14 (C6)
Figure 116: Graduate Degrees Granted per TTS Faculty Member, 2013/14 (C6)
* graph excludes Conrad, which awarded 12.5 professional master’s degrees per TTS faculty in 2013/14.
D. Research
Figure 117: Research Funds by Sector ($millions) and per TTS Faculty Member, 2004/05-2013/14 (D1&D7)
2004/05 2005/06 2006/07 2007/08 2008/09 2009/10 2010/11 2011/12 2012/13 2013/14Other 2.66 2.46 4.69 4.23 6.70 7.32 7.50 10.03 9.79 8.90Industry 4.55 4.78 6.22 4.83 5.30 7.04 8.45 10.83 9.03 8.79Provincial 5.27 7.97 7.48 13.60 11.68 12.69 17.44 17.73 15.46 10.26Federal 4.38 4.75 10.72 5.82 8.36 8.20 11.26 11.38 8.75 8.14Tri-Council 11.10 12.26 14.95 14.99 14.98 15.43 16.04 15.70 17.52 16.22Funding per TTS Faculty 145,261 159,465 206,725 197,405 206,809 220,084 253,689 266,868 239,899 209,374
In 2013/14, research funding to Waterloo Engineering faculty members totalled $52.3 million or $209,374 per tenured/tenure-stream faculty member. While this total is 88% higher than the total 10 years ago (and funding per tenured/tenure-stream faculty has increased by 44% over the same time period), it is over $13 million lower than our record total research funding in 2011/12. This decline in recent years is due in part to changes in government program budgets: of note, the Ontario Research Fund-Research Excellence program was deferred for more than a year. (The impact of this change is reflected in the 42% decrease in provincial funding over the last two years.) From 2004/05 to 2013/14, growth in industry funding (93%) more than doubled the rate of growth in Tri-Council funding (46%), a necessary expansion of funding sources outside of government programs.
1.1 1.3 1.2 1.2
1.5
1.8
2.3 2.3 2.1
2.5
0
1
2
3
2009/10 2010/11 2011/12 2012/13 2013/14
All research students All students
0.7
0.5
0.7
0.4
0.3
0.4
2.3
0.8
0.8
1.1
1.1
0.4
0.4
0.6
0.6
1.2
0.6
2.6
0.3
0 1 2 3 4
ARCH
CEE
CHE
ECE
MME
MSCI
SDE
PhD Rsch Master Prof Master
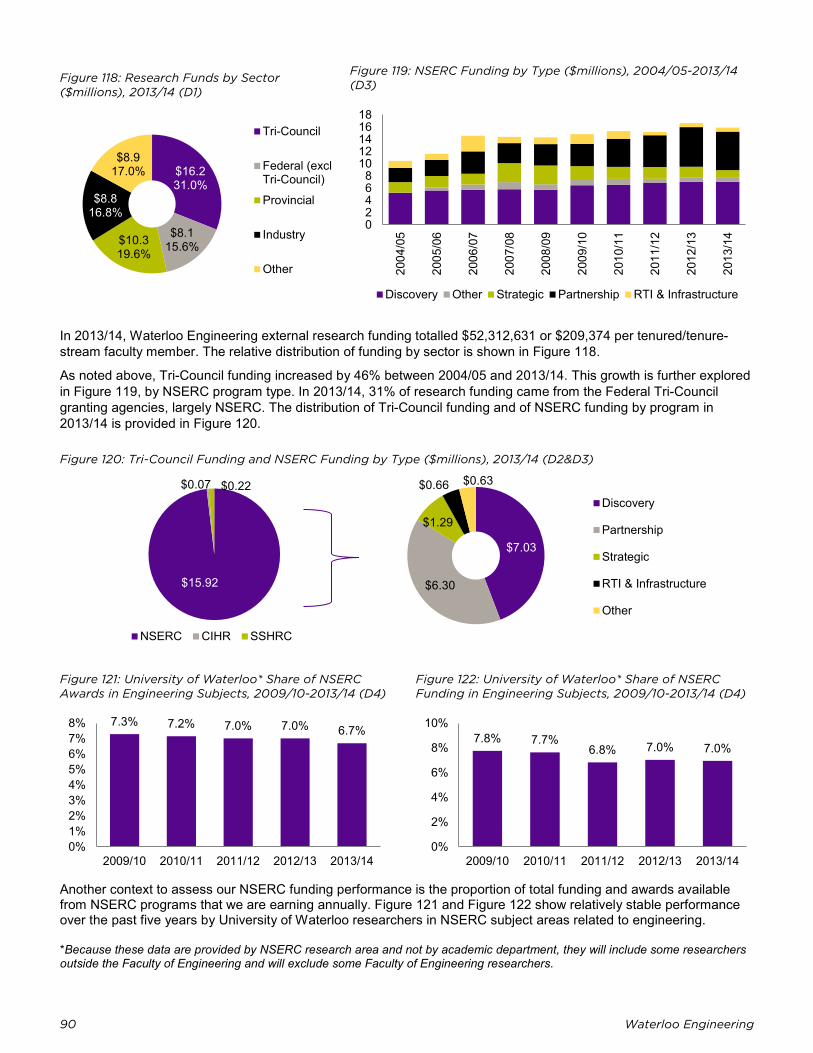
90 Waterloo Engineering
Figure 118: Research Funds by Sector ($millions), 2013/14 (D1)
Figure 119: NSERC Funding by Type ($millions), 2004/05-2013/14 (D3)
In 2013/14, Waterloo Engineering external research funding totalled $52,312,631 or $209,374 per tenured/tenure-stream faculty member. The relative distribution of funding by sector is shown in Figure 118.
As noted above, Tri-Council funding increased by 46% between 2004/05 and 2013/14. This growth is further explored in Figure 119, by NSERC program type. In 2013/14, 31% of research funding came from the Federal Tri-Council granting agencies, largely NSERC. The distribution of Tri-Council funding and of NSERC funding by program in 2013/14 is provided in Figure 120.
Figure 120: Tri-Council Funding and NSERC Funding by Type ($millions), 2013/14 (D2&D3)
Figure 121: University of Waterloo* Share of NSERC Awards in Engineering Subjects, 2009/10-2013/14 (D4)
*Because these data are provided by NSERC research area and not by academic department, they will include some researchers outside the Faculty of Engineering and will exclude some Faculty of Engineering researchers.
Figure 122: University of Waterloo* Share of NSERC Funding in Engineering Subjects, 2009/10-2013/14 (D4)
Another context to assess our NSERC funding performance is the proportion of total funding and awards available from NSERC programs that we are earning annually. Figure 121 and Figure 122 show relatively stable performance over the past five years by University of Waterloo researchers in NSERC subject areas related to engineering.
$16.2 31.0%
$8.1 15.6% $10.3
19.6%
$8.8 16.8%
$8.9 17.0%
Tri-Council
Federal (exclTri-Council)
Provincial
Industry
Other
02468
1012141618
2004
/05
2005
/06
2006
/07
2007
/08
2008
/09
2009
/10
2010
/11
2011
/12
2012
/13
2013
/14
Discovery Other Strategic Partnership RTI & Infrastructure
$15.92
$0.07 $0.22
NSERC CIHR SSHRC
$7.03
$6.30
$1.29
$0.66 $0.63
Discovery
Partnership
Strategic
RTI & Infrastructure
Other
7.3% 7.2% 7.0% 7.0% 6.7%
0%1%2%3%4%5%6%7%8%
2009/10 2010/11 2011/12 2012/13 2013/14
7.8% 7.7% 6.8% 7.0% 7.0%
0%
2%
4%
6%
8%
10%
2009/10 2010/11 2011/12 2012/13 2013/14
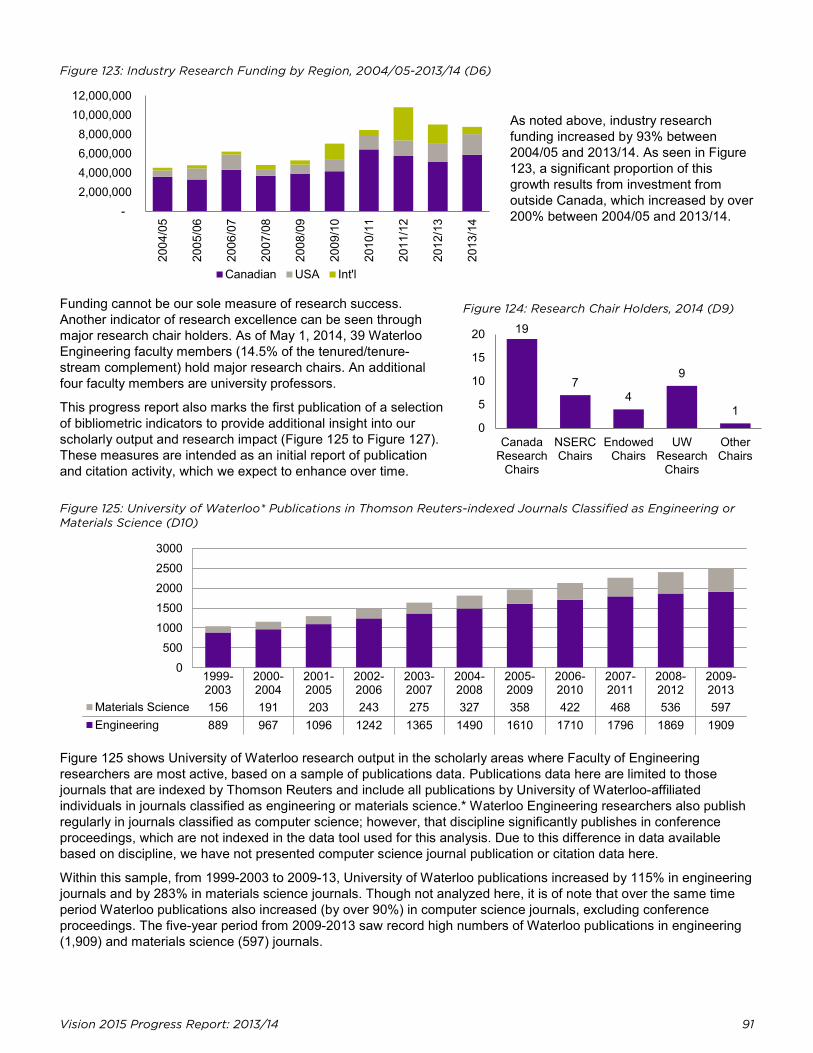
Vision 2015 Progress Report: 2013/14 91
0500
10001500200025003000
Figure 123: Industry Research Funding by Region, 2004/05-2013/14 (D6)
As noted above, industry research funding increased by 93% between 2004/05 and 2013/14. As seen in Figure 123, a significant proportion of this growth results from investment from outside Canada, which increased by over 200% between 2004/05 and 2013/14.
Funding cannot be our sole measure of research success. Another indicator of research excellence can be seen through major research chair holders. As of May 1, 2014, 39 Waterloo Engineering faculty members (14.5% of the tenured/tenure-stream complement) hold major research chairs. An additional four faculty members are university professors.
This progress report also marks the first publication of a selection of bibliometric indicators to provide additional insight into our scholarly output and research impact (Figure 125 to Figure 127). These measures are intended as an initial report of publication and citation activity, which we expect to enhance over time.
Figure 124: Research Chair Holders, 2014 (D9)
Figure 125: University of Waterloo* Publications in Thomson Reuters-indexed Journals Classified as Engineering or Materials Science (D10)
1999-2003
2000-2004
2001-2005
2002-2006
2003-2007
2004-2008
2005-2009
2006-2010
2007-2011
2008-2012
2009-2013
Materials Science 156 191 203 243 275 327 358 422 468 536 597Engineering 889 967 1096 1242 1365 1490 1610 1710 1796 1869 1909
Figure 125 shows University of Waterloo research output in the scholarly areas where Faculty of Engineering researchers are most active, based on a sample of publications data. Publications data here are limited to those journals that are indexed by Thomson Reuters and include all publications by University of Waterloo-affiliated individuals in journals classified as engineering or materials science.* Waterloo Engineering researchers also publish regularly in journals classified as computer science; however, that discipline significantly publishes in conference proceedings, which are not indexed in the data tool used for this analysis. Due to this difference in data available based on discipline, we have not presented computer science journal publication or citation data here.
Within this sample, from 1999-2003 to 2009-13, University of Waterloo publications increased by 115% in engineering journals and by 283% in materials science journals. Though not analyzed here, it is of note that over the same time period Waterloo publications also increased (by over 90%) in computer science journals, excluding conference proceedings. The five-year period from 2009-2013 saw record high numbers of Waterloo publications in engineering (1,909) and materials science (597) journals.
- 2,000,000 4,000,000 6,000,000 8,000,000
10,000,000 12,000,000
2004
/05
2005
/06
2006
/07
2007
/08
2008
/09
2009
/10
2010
/11
2011
/12
2012
/13
2013
/14
Canadian USA Int'l
19
7 4
9
1 0
5
10
15
20
CanadaResearch
Chairs
NSERCChairs
EndowedChairs
UWResearch
Chairs
OtherChairs
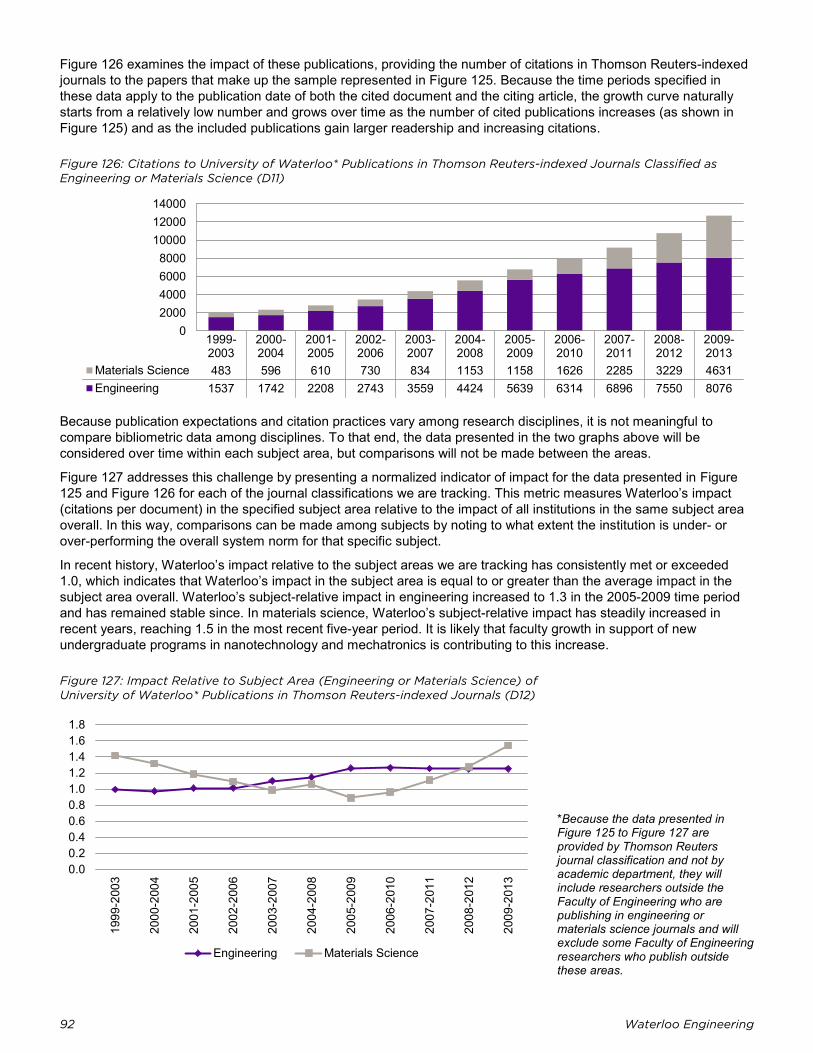
92 Waterloo Engineering
02000400060008000
100001200014000
Figure 126 examines the impact of these publications, providing the number of citations in Thomson Reuters-indexed journals to the papers that make up the sample represented in Figure 125. Because the time periods specified in these data apply to the publication date of both the cited document and the citing article, the growth curve naturally starts from a relatively low number and grows over time as the number of cited publications increases (as shown in Figure 125) and as the included publications gain larger readership and increasing citations.
Figure 126: Citations to University of Waterloo* Publications in Thomson Reuters-indexed Journals Classified as Engineering or Materials Science (D11)
1999-2003
2000-2004
2001-2005
2002-2006
2003-2007
2004-2008
2005-2009
2006-2010
2007-2011
2008-2012
2009-2013
Materials Science 483 596 610 730 834 1153 1158 1626 2285 3229 4631Engineering 1537 1742 2208 2743 3559 4424 5639 6314 6896 7550 8076
Because publication expectations and citation practices vary among research disciplines, it is not meaningful to compare bibliometric data among disciplines. To that end, the data presented in the two graphs above will be considered over time within each subject area, but comparisons will not be made between the areas.
Figure 127 addresses this challenge by presenting a normalized indicator of impact for the data presented in Figure 125 and Figure 126 for each of the journal classifications we are tracking. This metric measures Waterloo’s impact (citations per document) in the specified subject area relative to the impact of all institutions in the same subject area overall. In this way, comparisons can be made among subjects by noting to what extent the institution is under- or over-performing the overall system norm for that specific subject.
In recent history, Waterloo’s impact relative to the subject areas we are tracking has consistently met or exceeded 1.0, which indicates that Waterloo’s impact in the subject area is equal to or greater than the average impact in the subject area overall. Waterloo’s subject-relative impact in engineering increased to 1.3 in the 2005-2009 time period and has remained stable since. In materials science, Waterloo’s subject-relative impact has steadily increased in recent years, reaching 1.5 in the most recent five-year period. It is likely that faculty growth in support of new undergraduate programs in nanotechnology and mechatronics is contributing to this increase.
Figure 127: Impact Relative to Subject Area (Engineering or Materials Science) of University of Waterloo* Publications in Thomson Reuters-indexed Journals (D12)
*Because the data presented in Figure 125 to Figure 127 are provided by Thomson Reuters journal classification and not by academic department, they will include researchers outside the Faculty of Engineering who are publishing in engineering or materials science journals and will exclude some Faculty of Engineering researchers who publish outside these areas.
0.00.20.40.60.81.01.21.41.61.8
1999
-200
3
2000
-200
4
2001
-200
5
2002
-200
6
2003
-200
7
2004
-200
8
2005
-200
9
2006
-201
0
2007
-201
1
2008
-201
2
2009
-201
3
Engineering Materials Science
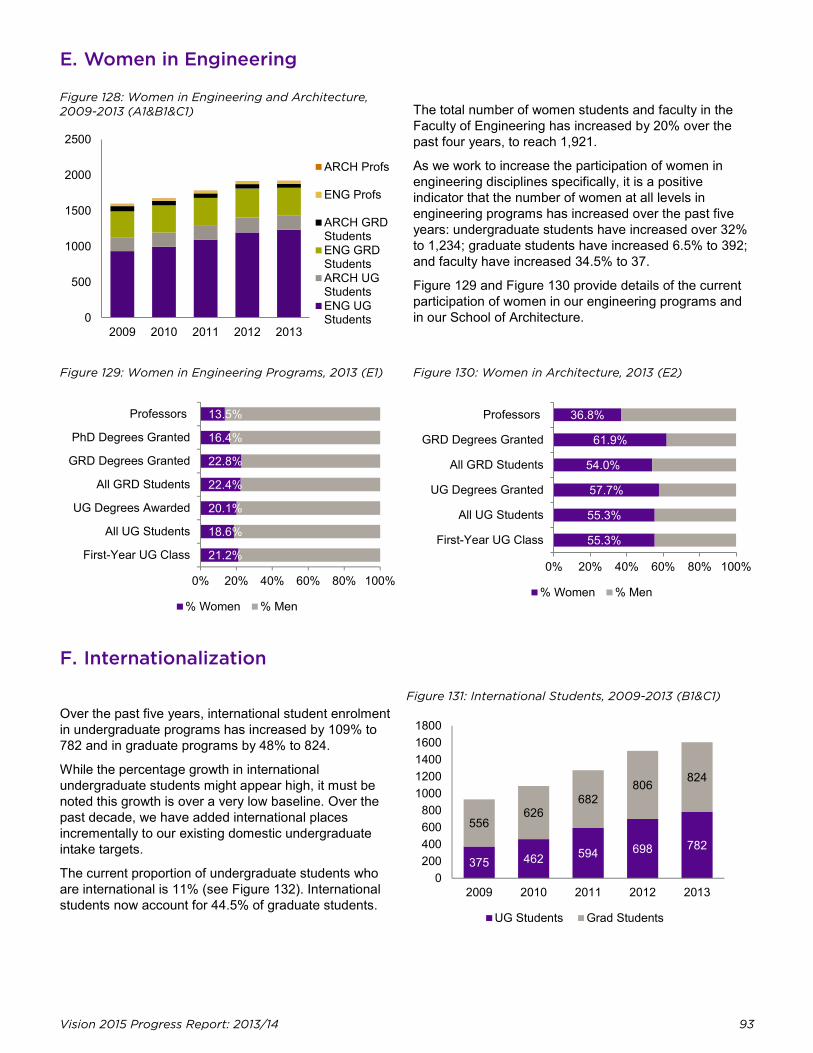
Vision 2015 Progress Report: 2013/14 93
E. Women in Engineering
Figure 128: Women in Engineering and Architecture, 2009-2013 (A1&B1&C1) The total number of women students and faculty in the
Faculty of Engineering has increased by 20% over the past four years, to reach 1,921.
As we work to increase the participation of women in engineering disciplines specifically, it is a positive indicator that the number of women at all levels in engineering programs has increased over the past five years: undergraduate students have increased over 32% to 1,234; graduate students have increased 6.5% to 392; and faculty have increased 34.5% to 37.
Figure 129 and Figure 130 provide details of the current participation of women in our engineering programs and in our School of Architecture.
Figure 129: Women in Engineering Programs, 2013 (E1) Figure 130: Women in Architecture, 2013 (E2)
F. Internationalization
Over the past five years, international student enrolment in undergraduate programs has increased by 109% to 782 and in graduate programs by 48% to 824.
While the percentage growth in international undergraduate students might appear high, it must be noted this growth is over a very low baseline. Over the past decade, we have added international places incrementally to our existing domestic undergraduate intake targets.
The current proportion of undergraduate students who are international is 11% (see Figure 132). International students now account for 44.5% of graduate students.
Figure 131: International Students, 2009-2013 (B1&C1)
0
500
1000
1500
2000
2500
2009 2010 2011 2012 2013
ARCH Profs
ENG Profs
ARCH GRDStudentsENG GRDStudentsARCH UGStudentsENG UGStudents
21.2%
18.6%
20.1%
22.4%
22.8%
16.4%
13.5%
0% 20% 40% 60% 80% 100%
First-Year UG Class
All UG Students
UG Degrees Awarded
All GRD Students
GRD Degrees Granted
PhD Degrees Granted
Professors
% Women % Men
55.3%
55.3%
57.7%
54.0%
61.9%
36.8%
0% 20% 40% 60% 80% 100%
First-Year UG Class
All UG Students
UG Degrees Granted
All GRD Students
GRD Degrees Granted
Professors
% Women % Men
375 462 594 698 782
556 626
682 806 824
0200400600800
10001200140016001800
2009 2010 2011 2012 2013
UG Students Grad Students
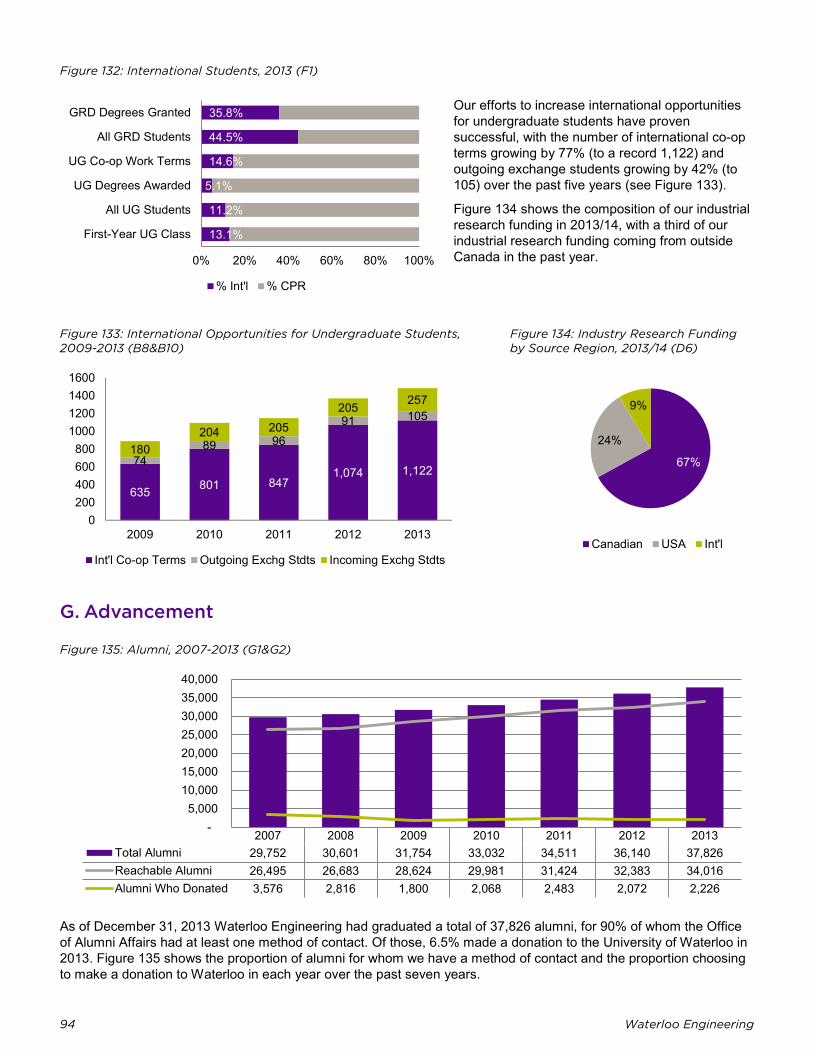
94 Waterloo Engineering
- 5,000
10,000 15,000 20,000 25,000 30,000 35,000 40,000
Figure 132: International Students, 2013 (F1)
Our efforts to increase international opportunities for undergraduate students have proven successful, with the number of international co-op terms growing by 77% (to a record 1,122) and outgoing exchange students growing by 42% (to 105) over the past five years (see Figure 133).
Figure 134 shows the composition of our industrial research funding in 2013/14, with a third of our industrial research funding coming from outside Canada in the past year.
Figure 133: International Opportunities for Undergraduate Students, 2009-2013 (B8&B10)
Figure 134: Industry Research Funding by Source Region, 2013/14 (D6)
G. Advancement
Figure 135: Alumni, 2007-2013 (G1&G2)
2007 2008 2009 2010 2011 2012 2013Total Alumni 29,752 30,601 31,754 33,032 34,511 36,140 37,826Reachable Alumni 26,495 26,683 28,624 29,981 31,424 32,383 34,016Alumni Who Donated 3,576 2,816 1,800 2,068 2,483 2,072 2,226
As of December 31, 2013 Waterloo Engineering had graduated a total of 37,826 alumni, for 90% of whom the Office of Alumni Affairs had at least one method of contact. Of those, 6.5% made a donation to the University of Waterloo in 2013. Figure 135 shows the proportion of alumni for whom we have a method of contact and the proportion choosing to make a donation to Waterloo in each year over the past seven years.
13.1%
11.2%
5.1%
14.6%
44.5%
35.8%
0% 20% 40% 60% 80% 100%
First-Year UG Class
All UG Students
UG Degrees Awarded
UG Co-op Work Terms
All GRD Students
GRD Degrees Granted
% Int'l % CPR
635 801 847 1,074 1,122
74 89 96
91 105
180 204 205
205 257
0200400600800
1000120014001600
2009 2010 2011 2012 2013
Int'l Co-op Terms Outgoing Exchg Stdts Incoming Exchg Stdts
67%
24%
9%
Canadian USA Int'l
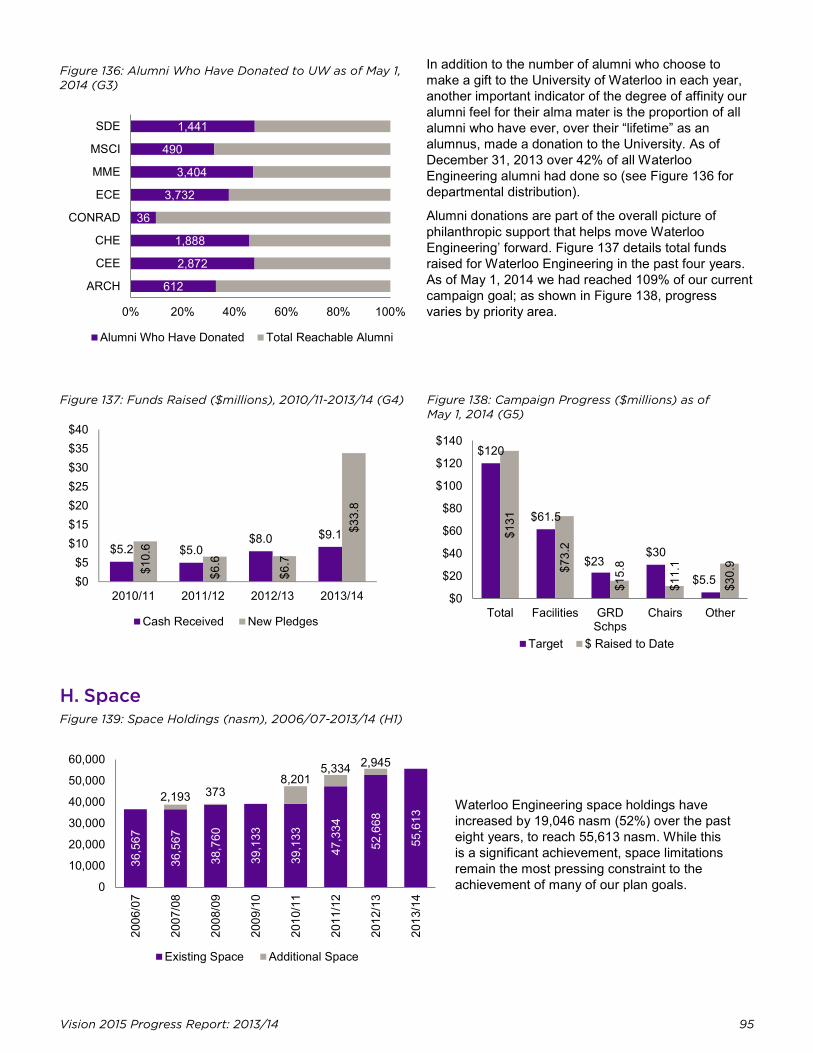
Vision 2015 Progress Report: 2013/14 95
Figure 136: Alumni Who Have Donated to UW as of May 1, 2014 (G3)
In addition to the number of alumni who choose to make a gift to the University of Waterloo in each year, another important indicator of the degree of affinity our alumni feel for their alma mater is the proportion of all alumni who have ever, over their “lifetime” as an alumnus, made a donation to the University. As of December 31, 2013 over 42% of all Waterloo Engineering alumni had done so (see Figure 136 for departmental distribution).
Alumni donations are part of the overall picture of philanthropic support that helps move Waterloo Engineering’ forward. Figure 137 details total funds raised for Waterloo Engineering in the past four years. As of May 1, 2014 we had reached 109% of our current campaign goal; as shown in Figure 138, progress varies by priority area.
Figure 137: Funds Raised ($millions), 2010/11-2013/14 (G4) Figure 138: Campaign Progress ($millions) as of May 1, 2014 (G5)
H. Space Figure 139: Space Holdings (nasm), 2006/07-2013/14 (H1)
Waterloo Engineering space holdings have increased by 19,046 nasm (52%) over the past eight years, to reach 55,613 nasm. While this is a significant achievement, space limitations remain the most pressing constraint to the achievement of many of our plan goals.
612
2,872
1,888
36
3,732
3,404
490
1,441
0% 20% 40% 60% 80% 100%
ARCH
CEE
CHE
CONRAD
ECE
MME
MSCI
SDE
Alumni Who Have Donated Total Reachable Alumni
$5.2 $5.0 $8.0 $9.1
$10.
6
$6.6
$6.7
$33.
8
$0$5
$10$15$20$25$30$35$40
2010/11 2011/12 2012/13 2013/14
Cash Received New Pledges
$120
$61.5
$23 $30
$5.5
$131
$73.
2
$15.
8
$11.
1
$30.
9
$0
$20
$40
$60
$80
$100
$120
$140
Total Facilities GRDSchps
Chairs Other
Target $ Raised to Date
36,5
67
36,5
67
38,7
60
39,1
33
39,1
33
47,3
34
52,6
68
55,6
13
2,193 373 8,201
5,334 2,945
0
10,000
20,000
30,000
40,000
50,000
60,000
2006
/07
2007
/08
2008
/09
2009
/10
2010
/11
2011
/12
2012
/13
2013
/14
Existing Space Additional Space
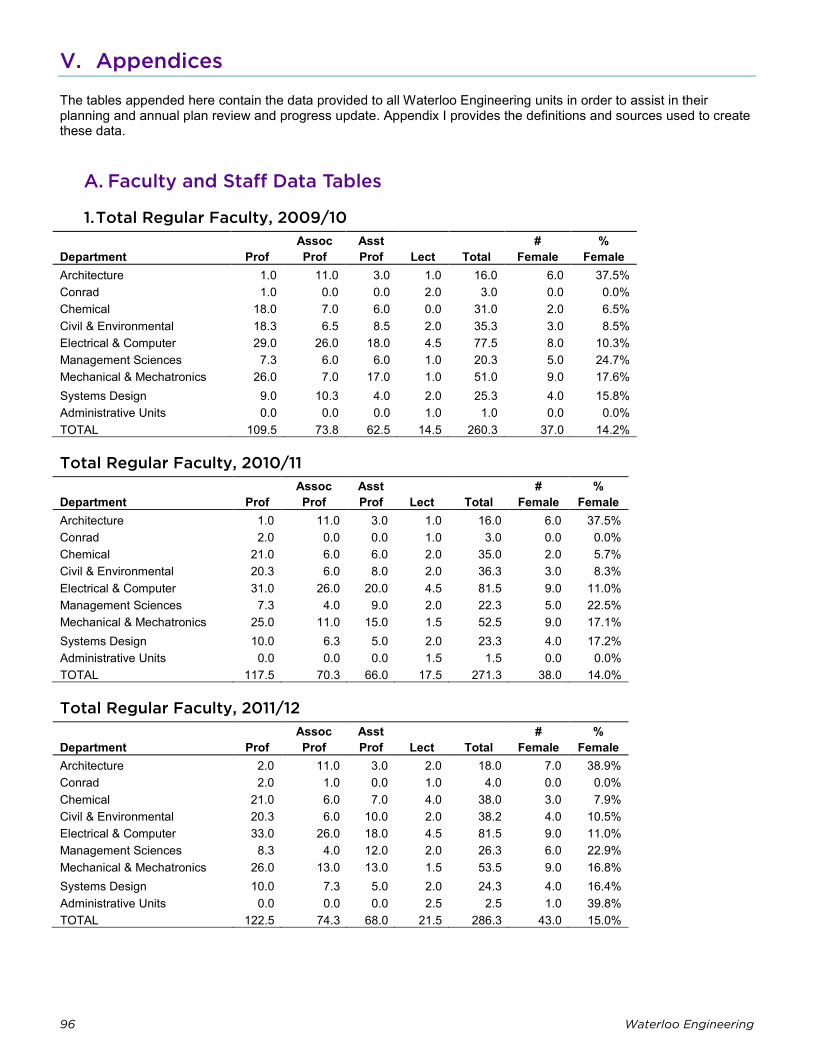
96 Waterloo Engineering
V. Appendices
The tables appended here contain the data provided to all Waterloo Engineering units in order to assist in their planning and annual plan review and progress update. Appendix I provides the definitions and sources used to create these data.
A. Faculty and Staff Data Tables
1. Total Regular Faculty, 2009/10
Department Prof Assoc Prof
Asst Prof Lect Total
# Female
% Female
Architecture 1.0 11.0 3.0 1.0 16.0 6.0 37.5% Conrad 1.0 0.0 0.0 2.0 3.0 0.0 0.0% Chemical 18.0 7.0 6.0 0.0 31.0 2.0 6.5% Civil & Environmental 18.3 6.5 8.5 2.0 35.3 3.0 8.5% Electrical & Computer 29.0 26.0 18.0 4.5 77.5 8.0 10.3% Management Sciences 7.3 6.0 6.0 1.0 20.3 5.0 24.7% Mechanical & Mechatronics 26.0 7.0 17.0 1.0 51.0 9.0 17.6% Systems Design 9.0 10.3 4.0 2.0 25.3 4.0 15.8% Administrative Units 0.0 0.0 0.0 1.0 1.0 0.0 0.0% TOTAL 109.5 73.8 62.5 14.5 260.3 37.0 14.2%
Total Regular Faculty, 2010/11
Department Prof Assoc Prof
Asst Prof Lect Total
# Female
% Female
Architecture 1.0 11.0 3.0 1.0 16.0 6.0 37.5% Conrad 2.0 0.0 0.0 1.0 3.0 0.0 0.0% Chemical 21.0 6.0 6.0 2.0 35.0 2.0 5.7% Civil & Environmental 20.3 6.0 8.0 2.0 36.3 3.0 8.3% Electrical & Computer 31.0 26.0 20.0 4.5 81.5 9.0 11.0% Management Sciences 7.3 4.0 9.0 2.0 22.3 5.0 22.5% Mechanical & Mechatronics 25.0 11.0 15.0 1.5 52.5 9.0 17.1% Systems Design 10.0 6.3 5.0 2.0 23.3 4.0 17.2% Administrative Units 0.0 0.0 0.0 1.5 1.5 0.0 0.0% TOTAL 117.5 70.3 66.0 17.5 271.3 38.0 14.0%
Total Regular Faculty, 2011/12
Department Prof Assoc Prof
Asst Prof Lect Total
# Female
% Female
Architecture 2.0 11.0 3.0 2.0 18.0 7.0 38.9% Conrad 2.0 1.0 0.0 1.0 4.0 0.0 0.0% Chemical 21.0 6.0 7.0 4.0 38.0 3.0 7.9% Civil & Environmental 20.3 6.0 10.0 2.0 38.2 4.0 10.5% Electrical & Computer 33.0 26.0 18.0 4.5 81.5 9.0 11.0% Management Sciences 8.3 4.0 12.0 2.0 26.3 6.0 22.9% Mechanical & Mechatronics 26.0 13.0 13.0 1.5 53.5 9.0 16.8% Systems Design 10.0 7.3 5.0 2.0 24.3 4.0 16.4% Administrative Units 0.0 0.0 0.0 2.5 2.5 1.0 39.8% TOTAL 122.5 74.3 68.0 21.5 286.3 43.0 15.0%
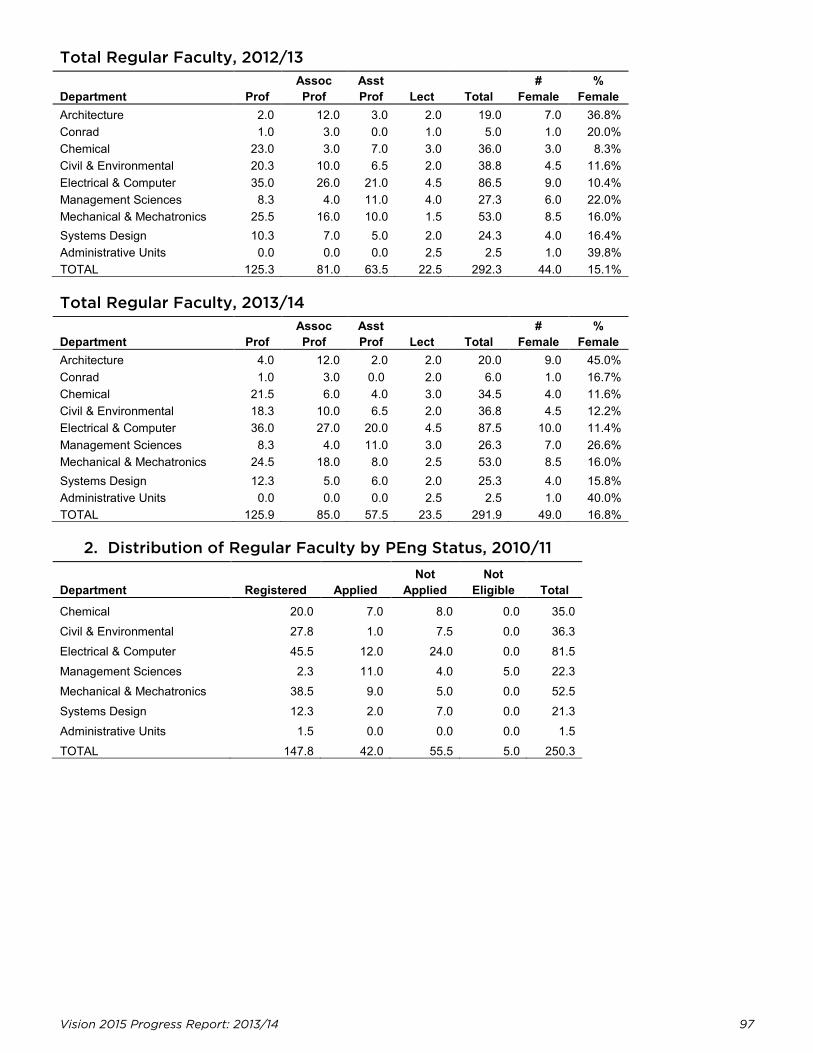
Vision 2015 Progress Report: 2013/14 97
Total Regular Faculty, 2012/13
Department Prof Assoc Prof
Asst Prof Lect Total
# Female
% Female
Architecture 2.0 12.0 3.0 2.0 19.0 7.0 36.8% Conrad 1.0 3.0 0.0 1.0 5.0 1.0 20.0% Chemical 23.0 3.0 7.0 3.0 36.0 3.0 8.3% Civil & Environmental 20.3 10.0 6.5 2.0 38.8 4.5 11.6% Electrical & Computer 35.0 26.0 21.0 4.5 86.5 9.0 10.4% Management Sciences 8.3 4.0 11.0 4.0 27.3 6.0 22.0% Mechanical & Mechatronics 25.5 16.0 10.0 1.5 53.0 8.5 16.0% Systems Design 10.3 7.0 5.0 2.0 24.3 4.0 16.4% Administrative Units 0.0 0.0 0.0 2.5 2.5 1.0 39.8% TOTAL 125.3 81.0 63.5 22.5 292.3 44.0 15.1%
Total Regular Faculty, 2013/14
Department Prof Assoc Prof
Asst Prof Lect Total
# Female
% Female
Architecture 4.0 12.0 2.0 2.0 20.0 9.0 45.0% Conrad 1.0 3.0 0.0 2.0 6.0 1.0 16.7% Chemical 21.5 6.0 4.0 3.0 34.5 4.0 11.6% Civil & Environmental 18.3 10.0 6.5 2.0 36.8 4.5 12.2% Electrical & Computer 36.0 27.0 20.0 4.5 87.5 10.0 11.4% Management Sciences 8.3 4.0 11.0 3.0 26.3 7.0 26.6% Mechanical & Mechatronics 24.5 18.0 8.0 2.5 53.0 8.5 16.0% Systems Design 12.3 5.0 6.0 2.0 25.3 4.0 15.8% Administrative Units 0.0 0.0 0.0 2.5 2.5 1.0 40.0% TOTAL 125.9 85.0 57.5 23.5 291.9 49.0 16.8%
2. Distribution of Regular Faculty by PEng Status, 2010/11
Department Registered Applied Not
Applied Not
Eligible Total Chemical 20.0 7.0 8.0 0.0 35.0 Civil & Environmental 27.8 1.0 7.5 0.0 36.3 Electrical & Computer 45.5 12.0 24.0 0.0 81.5 Management Sciences 2.3 11.0 4.0 5.0 22.3 Mechanical & Mechatronics 38.5 9.0 5.0 0.0 52.5 Systems Design 12.3 2.0 7.0 0.0 21.3 Administrative Units 1.5 0.0 0.0 0.0 1.5 TOTAL 147.8 42.0 55.5 5.0 250.3
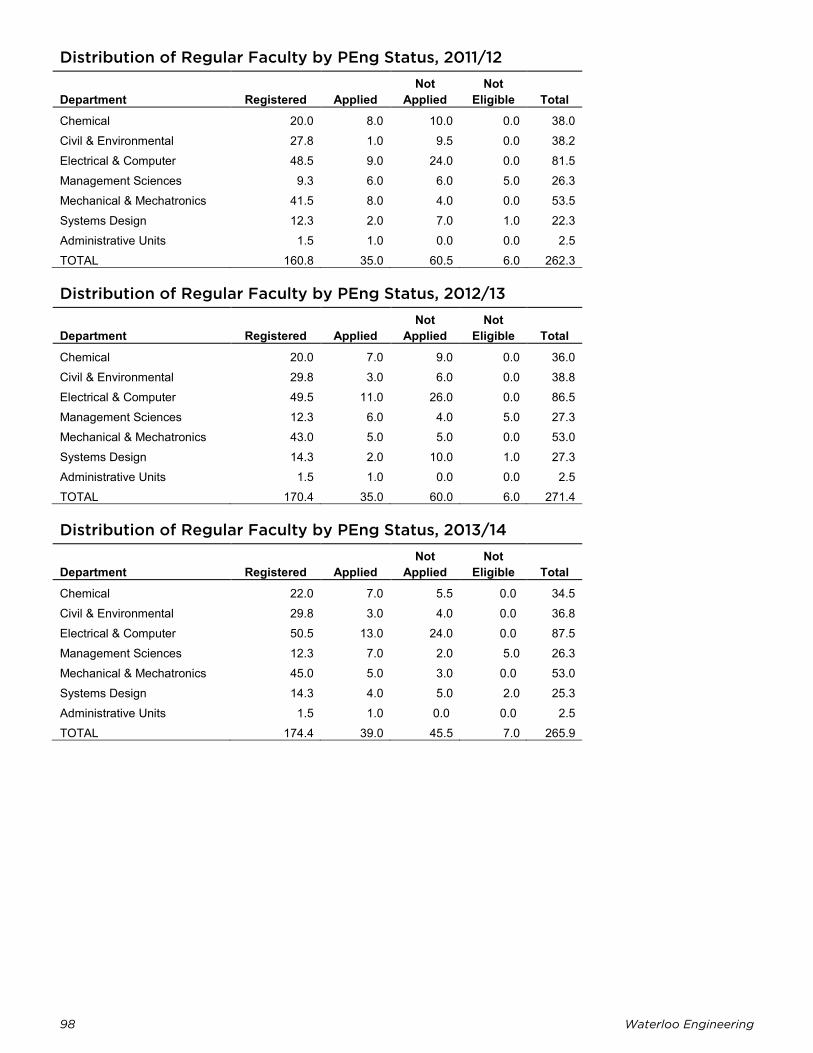
98 Waterloo Engineering
Distribution of Regular Faculty by PEng Status, 2011/12
Department Registered Applied Not
Applied Not
Eligible Total Chemical 20.0 8.0 10.0 0.0 38.0 Civil & Environmental 27.8 1.0 9.5 0.0 38.2 Electrical & Computer 48.5 9.0 24.0 0.0 81.5 Management Sciences 9.3 6.0 6.0 5.0 26.3 Mechanical & Mechatronics 41.5 8.0 4.0 0.0 53.5 Systems Design 12.3 2.0 7.0 1.0 22.3 Administrative Units 1.5 1.0 0.0 0.0 2.5 TOTAL 160.8 35.0 60.5 6.0 262.3
Distribution of Regular Faculty by PEng Status, 2012/13
Department Registered Applied Not
Applied Not
Eligible Total Chemical 20.0 7.0 9.0 0.0 36.0 Civil & Environmental 29.8 3.0 6.0 0.0 38.8 Electrical & Computer 49.5 11.0 26.0 0.0 86.5 Management Sciences 12.3 6.0 4.0 5.0 27.3 Mechanical & Mechatronics 43.0 5.0 5.0 0.0 53.0 Systems Design 14.3 2.0 10.0 1.0 27.3 Administrative Units 1.5 1.0 0.0 0.0 2.5 TOTAL 170.4 35.0 60.0 6.0 271.4
Distribution of Regular Faculty by PEng Status, 2013/14
Department Registered Applied Not
Applied Not
Eligible Total Chemical 22.0 7.0 5.5 0.0 34.5 Civil & Environmental 29.8 3.0 4.0 0.0 36.8 Electrical & Computer 50.5 13.0 24.0 0.0 87.5 Management Sciences 12.3 7.0 2.0 5.0 26.3 Mechanical & Mechatronics 45.0 5.0 3.0 0.0 53.0 Systems Design 14.3 4.0 5.0 2.0 25.3 Administrative Units 1.5 1.0 0.0 0.0 2.5 TOTAL 174.4 39.0 45.5 7.0 265.9
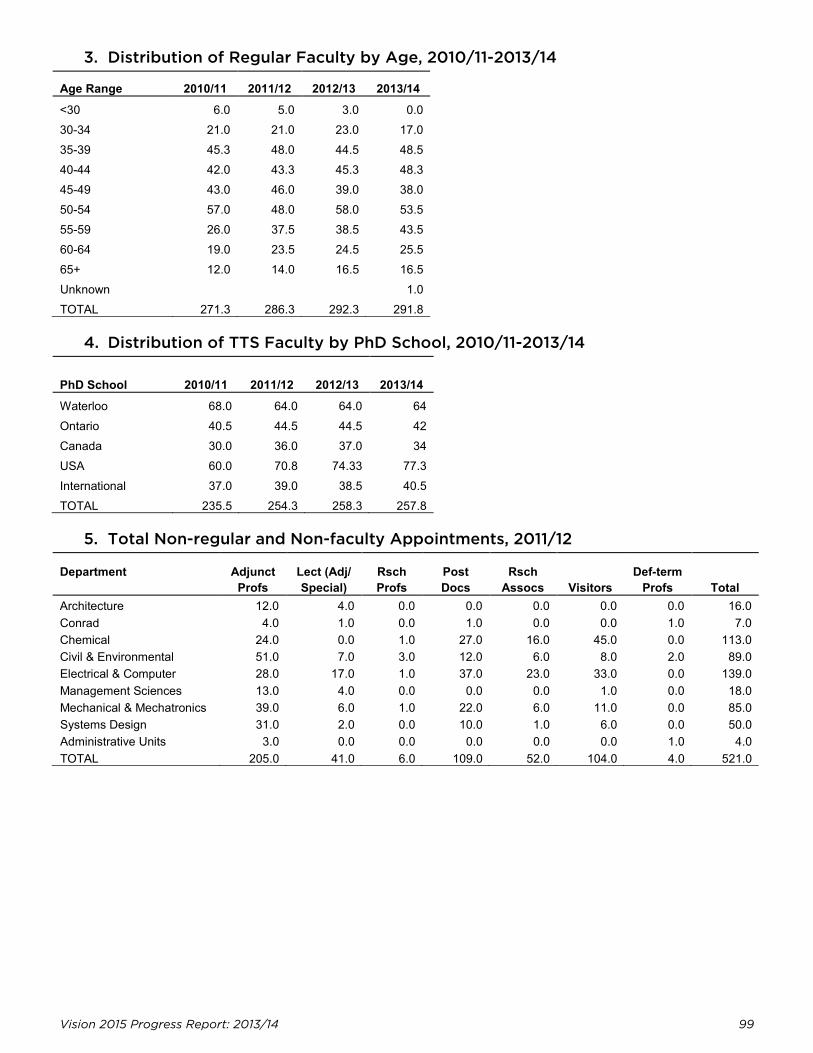
Vision 2015 Progress Report: 2013/14 99
3. Distribution of Regular Faculty by Age, 2010/11-2013/14
Age Range 2010/11 2011/12 2012/13 2013/14 <30 6.0 5.0 3.0 0.0 30-34 21.0 21.0 23.0 17.0 35-39 45.3 48.0 44.5 48.5 40-44 42.0 43.3 45.3 48.3 45-49 43.0 46.0 39.0 38.0 50-54 57.0 48.0 58.0 53.5 55-59 26.0 37.5 38.5 43.5 60-64 19.0 23.5 24.5 25.5 65+ 12.0 14.0 16.5 16.5 Unknown 1.0 TOTAL 271.3 286.3 292.3 291.8
4. Distribution of TTS Faculty by PhD School, 2010/11-2013/14
PhD School 2010/11 2011/12 2012/13 2013/14 Waterloo 68.0 64.0 64.0 64 Ontario 40.5 44.5 44.5 42 Canada 30.0 36.0 37.0 34 USA 60.0 70.8 74.33 77.3 International 37.0 39.0 38.5 40.5 TOTAL 235.5 254.3 258.3 257.8
5. Total Non-regular and Non-faculty Appointments, 2011/12
Department Adjunct Profs
Lect (Adj/ Special)
Rsch Profs
Post Docs
Rsch Assocs Visitors
Def-term Profs Total
Architecture 12.0 4.0 0.0 0.0 0.0 0.0 0.0 16.0 Conrad 4.0 1.0 0.0 1.0 0.0 0.0 1.0 7.0 Chemical 24.0 0.0 1.0 27.0 16.0 45.0 0.0 113.0 Civil & Environmental 51.0 7.0 3.0 12.0 6.0 8.0 2.0 89.0 Electrical & Computer 28.0 17.0 1.0 37.0 23.0 33.0 0.0 139.0 Management Sciences 13.0 4.0 0.0 0.0 0.0 1.0 0.0 18.0 Mechanical & Mechatronics 39.0 6.0 1.0 22.0 6.0 11.0 0.0 85.0 Systems Design 31.0 2.0 0.0 10.0 1.0 6.0 0.0 50.0 Administrative Units 3.0 0.0 0.0 0.0 0.0 0.0 1.0 4.0 TOTAL 205.0 41.0 6.0 109.0 52.0 104.0 4.0 521.0
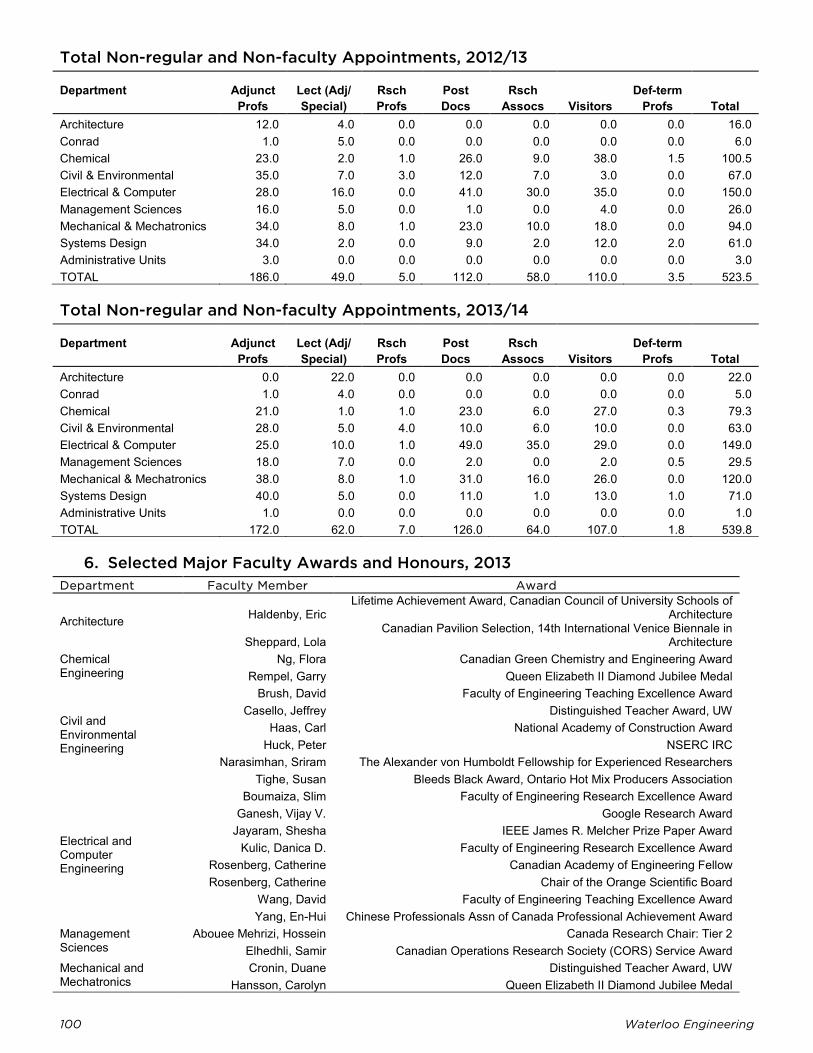
100 Waterloo Engineering
Total Non-regular and Non-faculty Appointments, 2012/13
Department Adjunct Profs
Lect (Adj/ Special)
Rsch Profs
Post Docs
Rsch Assocs Visitors
Def-term Profs Total
Architecture 12.0 4.0 0.0 0.0 0.0 0.0 0.0 16.0 Conrad 1.0 5.0 0.0 0.0 0.0 0.0 0.0 6.0 Chemical 23.0 2.0 1.0 26.0 9.0 38.0 1.5 100.5 Civil & Environmental 35.0 7.0 3.0 12.0 7.0 3.0 0.0 67.0 Electrical & Computer 28.0 16.0 0.0 41.0 30.0 35.0 0.0 150.0 Management Sciences 16.0 5.0 0.0 1.0 0.0 4.0 0.0 26.0 Mechanical & Mechatronics 34.0 8.0 1.0 23.0 10.0 18.0 0.0 94.0 Systems Design 34.0 2.0 0.0 9.0 2.0 12.0 2.0 61.0 Administrative Units 3.0 0.0 0.0 0.0 0.0 0.0 0.0 3.0 TOTAL 186.0 49.0 5.0 112.0 58.0 110.0 3.5 523.5
Total Non-regular and Non-faculty Appointments, 2013/14
Department Adjunct Profs
Lect (Adj/ Special)
Rsch Profs
Post Docs
Rsch Assocs Visitors
Def-term Profs Total
Architecture 0.0 22.0 0.0 0.0 0.0 0.0 0.0 22.0 Conrad 1.0 4.0 0.0 0.0 0.0 0.0 0.0 5.0 Chemical 21.0 1.0 1.0 23.0 6.0 27.0 0.3 79.3 Civil & Environmental 28.0 5.0 4.0 10.0 6.0 10.0 0.0 63.0 Electrical & Computer 25.0 10.0 1.0 49.0 35.0 29.0 0.0 149.0 Management Sciences 18.0 7.0 0.0 2.0 0.0 2.0 0.5 29.5 Mechanical & Mechatronics 38.0 8.0 1.0 31.0 16.0 26.0 0.0 120.0 Systems Design 40.0 5.0 0.0 11.0 1.0 13.0 1.0 71.0 Administrative Units 1.0 0.0 0.0 0.0 0.0 0.0 0.0 1.0 TOTAL 172.0 62.0 7.0 126.0 64.0 107.0 1.8 539.8
6. Selected Major Faculty Awards and Honours, 2013 Department Faculty Member Award
Architecture Haldenby, Eric Lifetime Achievement Award, Canadian Council of University Schools of
Architecture
Sheppard, Lola Canadian Pavilion Selection, 14th International Venice Biennale in
Architecture Chemical Engineering
Ng, Flora Canadian Green Chemistry and Engineering Award Rempel, Garry Queen Elizabeth II Diamond Jubilee Medal
Civil and Environmental Engineering
Brush, David Faculty of Engineering Teaching Excellence Award Casello, Jeffrey Distinguished Teacher Award, UW
Haas, Carl National Academy of Construction Award Huck, Peter NSERC IRC
Narasimhan, Sriram The Alexander von Humboldt Fellowship for Experienced Researchers Tighe, Susan Bleeds Black Award, Ontario Hot Mix Producers Association
Electrical and Computer Engineering
Boumaiza, Slim Faculty of Engineering Research Excellence Award Ganesh, Vijay V. Google Research Award
Jayaram, Shesha IEEE James R. Melcher Prize Paper Award Kulic, Danica D. Faculty of Engineering Research Excellence Award
Rosenberg, Catherine Canadian Academy of Engineering Fellow Rosenberg, Catherine Chair of the Orange Scientific Board
Wang, David Faculty of Engineering Teaching Excellence Award Yang, En-Hui Chinese Professionals Assn of Canada Professional Achievement Award
Management Sciences
Abouee Mehrizi, Hossein Canada Research Chair: Tier 2 Elhedhli, Samir Canadian Operations Research Society (CORS) Service Award
Mechanical and Mechatronics
Cronin, Duane Distinguished Teacher Award, UW Hansson, Carolyn Queen Elizabeth II Diamond Jubilee Medal
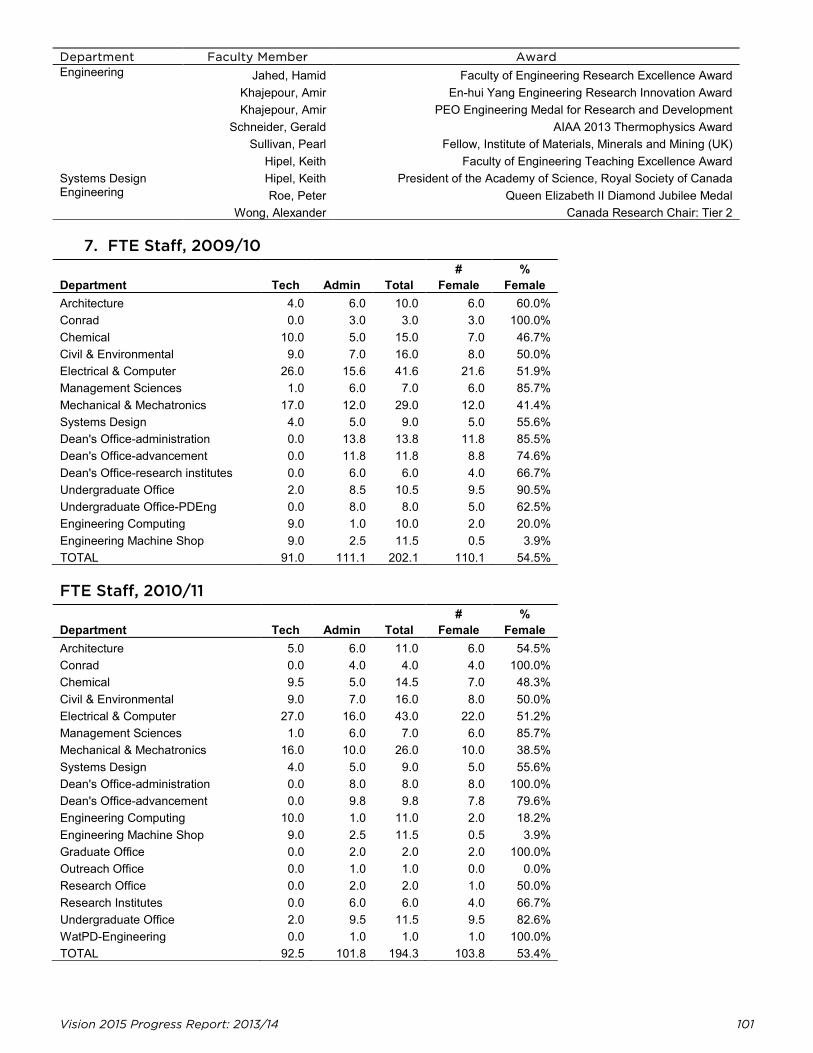
Department Faculty Member Award
Vision 2015 Progress Report: 2013/14 101
Engineering Jahed, Hamid Faculty of Engineering Research Excellence Award Khajepour, Amir En-hui Yang Engineering Research Innovation Award Khajepour, Amir PEO Engineering Medal for Research and Development
Schneider, Gerald AIAA 2013 Thermophysics Award Sullivan, Pearl Fellow, Institute of Materials, Minerals and Mining (UK)
Systems Design Engineering
Hipel, Keith Faculty of Engineering Teaching Excellence Award Hipel, Keith President of the Academy of Science, Royal Society of Canada Roe, Peter Queen Elizabeth II Diamond Jubilee Medal
Wong, Alexander Canada Research Chair: Tier 2
7. FTE Staff, 2009/10
Department Tech Admin Total #
Female %
Female Architecture 4.0 6.0 10.0 6.0 60.0% Conrad 0.0 3.0 3.0 3.0 100.0% Chemical 10.0 5.0 15.0 7.0 46.7% Civil & Environmental 9.0 7.0 16.0 8.0 50.0% Electrical & Computer 26.0 15.6 41.6 21.6 51.9% Management Sciences 1.0 6.0 7.0 6.0 85.7% Mechanical & Mechatronics 17.0 12.0 29.0 12.0 41.4% Systems Design 4.0 5.0 9.0 5.0 55.6% Dean's Office-administration 0.0 13.8 13.8 11.8 85.5% Dean's Office-advancement 0.0 11.8 11.8 8.8 74.6% Dean's Office-research institutes 0.0 6.0 6.0 4.0 66.7% Undergraduate Office 2.0 8.5 10.5 9.5 90.5% Undergraduate Office-PDEng 0.0 8.0 8.0 5.0 62.5% Engineering Computing 9.0 1.0 10.0 2.0 20.0% Engineering Machine Shop 9.0 2.5 11.5 0.5 3.9% TOTAL 91.0 111.1 202.1 110.1 54.5%
FTE Staff, 2010/11
Department Tech Admin Total #
Female %
Female Architecture 5.0 6.0 11.0 6.0 54.5% Conrad 0.0 4.0 4.0 4.0 100.0% Chemical 9.5 5.0 14.5 7.0 48.3% Civil & Environmental 9.0 7.0 16.0 8.0 50.0% Electrical & Computer 27.0 16.0 43.0 22.0 51.2% Management Sciences 1.0 6.0 7.0 6.0 85.7% Mechanical & Mechatronics 16.0 10.0 26.0 10.0 38.5% Systems Design 4.0 5.0 9.0 5.0 55.6% Dean's Office-administration 0.0 8.0 8.0 8.0 100.0% Dean's Office-advancement 0.0 9.8 9.8 7.8 79.6% Engineering Computing 10.0 1.0 11.0 2.0 18.2% Engineering Machine Shop 9.0 2.5 11.5 0.5 3.9% Graduate Office 0.0 2.0 2.0 2.0 100.0% Outreach Office 0.0 1.0 1.0 0.0 0.0% Research Office 0.0 2.0 2.0 1.0 50.0% Research Institutes 0.0 6.0 6.0 4.0 66.7% Undergraduate Office 2.0 9.5 11.5 9.5 82.6% WatPD-Engineering 0.0 1.0 1.0 1.0 100.0% TOTAL 92.5 101.8 194.3 103.8 53.4%
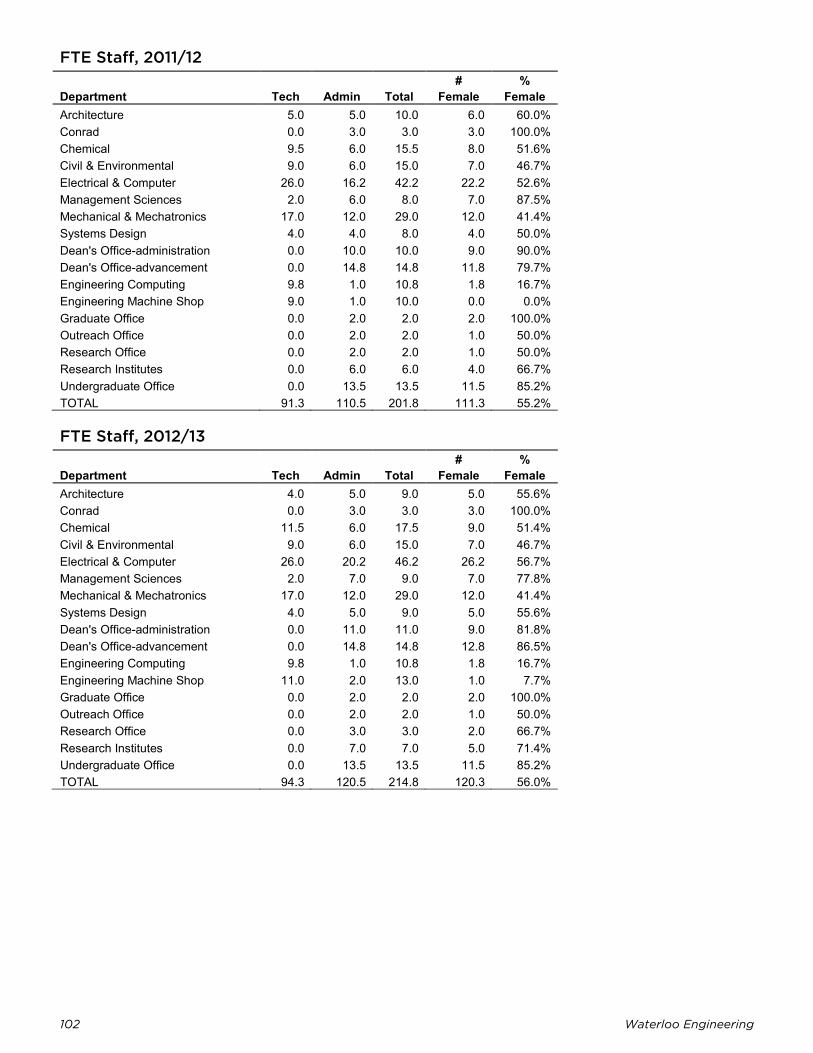
102 Waterloo Engineering
FTE Staff, 2011/12
Department Tech Admin Total #
Female %
Female Architecture 5.0 5.0 10.0 6.0 60.0% Conrad 0.0 3.0 3.0 3.0 100.0% Chemical 9.5 6.0 15.5 8.0 51.6% Civil & Environmental 9.0 6.0 15.0 7.0 46.7% Electrical & Computer 26.0 16.2 42.2 22.2 52.6% Management Sciences 2.0 6.0 8.0 7.0 87.5% Mechanical & Mechatronics 17.0 12.0 29.0 12.0 41.4% Systems Design 4.0 4.0 8.0 4.0 50.0% Dean's Office-administration 0.0 10.0 10.0 9.0 90.0% Dean's Office-advancement 0.0 14.8 14.8 11.8 79.7% Engineering Computing 9.8 1.0 10.8 1.8 16.7% Engineering Machine Shop 9.0 1.0 10.0 0.0 0.0% Graduate Office 0.0 2.0 2.0 2.0 100.0% Outreach Office 0.0 2.0 2.0 1.0 50.0% Research Office 0.0 2.0 2.0 1.0 50.0% Research Institutes 0.0 6.0 6.0 4.0 66.7% Undergraduate Office 0.0 13.5 13.5 11.5 85.2% TOTAL 91.3 110.5 201.8 111.3 55.2%
FTE Staff, 2012/13
Department Tech Admin Total #
Female %
Female Architecture 4.0 5.0 9.0 5.0 55.6% Conrad 0.0 3.0 3.0 3.0 100.0% Chemical 11.5 6.0 17.5 9.0 51.4% Civil & Environmental 9.0 6.0 15.0 7.0 46.7% Electrical & Computer 26.0 20.2 46.2 26.2 56.7% Management Sciences 2.0 7.0 9.0 7.0 77.8% Mechanical & Mechatronics 17.0 12.0 29.0 12.0 41.4% Systems Design 4.0 5.0 9.0 5.0 55.6% Dean's Office-administration 0.0 11.0 11.0 9.0 81.8% Dean's Office-advancement 0.0 14.8 14.8 12.8 86.5% Engineering Computing 9.8 1.0 10.8 1.8 16.7% Engineering Machine Shop 11.0 2.0 13.0 1.0 7.7% Graduate Office 0.0 2.0 2.0 2.0 100.0% Outreach Office 0.0 2.0 2.0 1.0 50.0% Research Office 0.0 3.0 3.0 2.0 66.7% Research Institutes 0.0 7.0 7.0 5.0 71.4% Undergraduate Office 0.0 13.5 13.5 11.5 85.2% TOTAL 94.3 120.5 214.8 120.3 56.0%
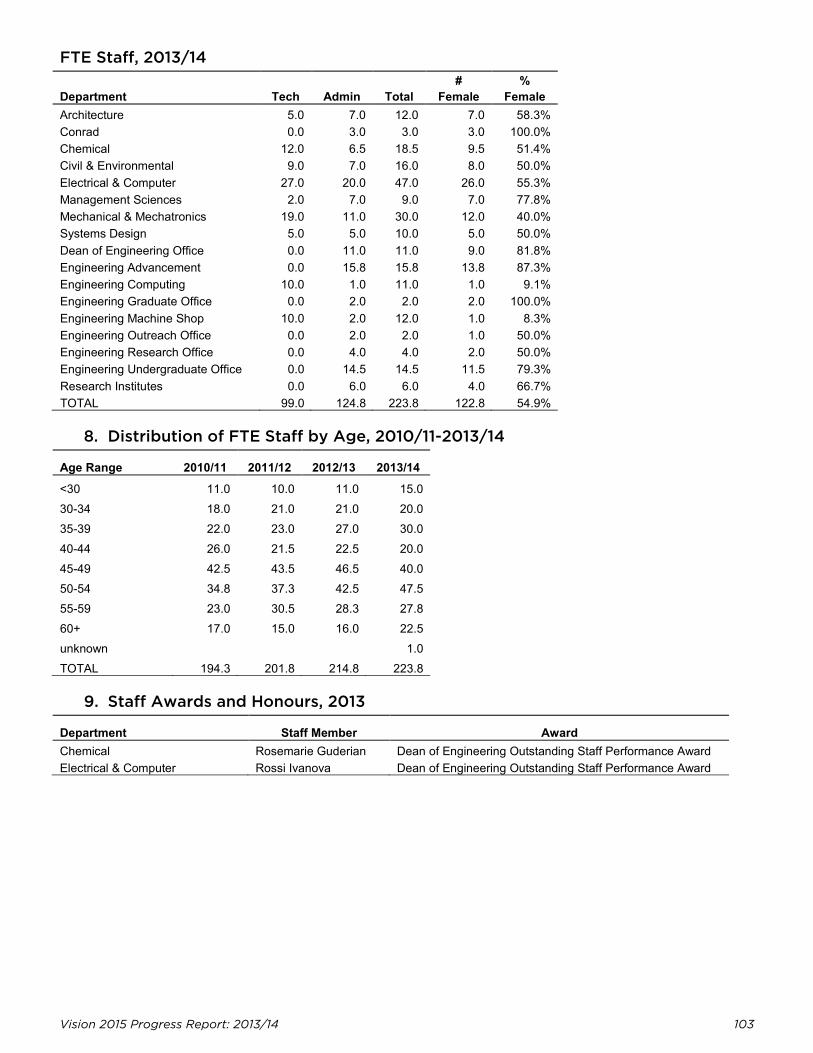
Vision 2015 Progress Report: 2013/14 103
FTE Staff, 2013/14
Department Tech Admin Total #
Female %
Female Architecture 5.0 7.0 12.0 7.0 58.3% Conrad 0.0 3.0 3.0 3.0 100.0% Chemical 12.0 6.5 18.5 9.5 51.4% Civil & Environmental 9.0 7.0 16.0 8.0 50.0% Electrical & Computer 27.0 20.0 47.0 26.0 55.3% Management Sciences 2.0 7.0 9.0 7.0 77.8% Mechanical & Mechatronics 19.0 11.0 30.0 12.0 40.0% Systems Design 5.0 5.0 10.0 5.0 50.0% Dean of Engineering Office 0.0 11.0 11.0 9.0 81.8% Engineering Advancement 0.0 15.8 15.8 13.8 87.3% Engineering Computing 10.0 1.0 11.0 1.0 9.1% Engineering Graduate Office 0.0 2.0 2.0 2.0 100.0% Engineering Machine Shop 10.0 2.0 12.0 1.0 8.3% Engineering Outreach Office 0.0 2.0 2.0 1.0 50.0% Engineering Research Office 0.0 4.0 4.0 2.0 50.0% Engineering Undergraduate Office 0.0 14.5 14.5 11.5 79.3% Research Institutes 0.0 6.0 6.0 4.0 66.7% TOTAL 99.0 124.8 223.8 122.8 54.9%
8. Distribution of FTE Staff by Age, 2010/11-2013/14
Age Range 2010/11 2011/12 2012/13 2013/14 <30 11.0 10.0 11.0 15.0 30-34 18.0 21.0 21.0 20.0 35-39 22.0 23.0 27.0 30.0 40-44 26.0 21.5 22.5 20.0 45-49 42.5 43.5 46.5 40.0 50-54 34.8 37.3 42.5 47.5 55-59 23.0 30.5 28.3 27.8 60+ 17.0 15.0 16.0 22.5 unknown 1.0 TOTAL 194.3 201.8 214.8 223.8
9. Staff Awards and Honours, 2013
Department Staff Member Award Chemical Rosemarie Guderian Dean of Engineering Outstanding Staff Performance Award Electrical & Computer Rossi Ivanova Dean of Engineering Outstanding Staff Performance Award
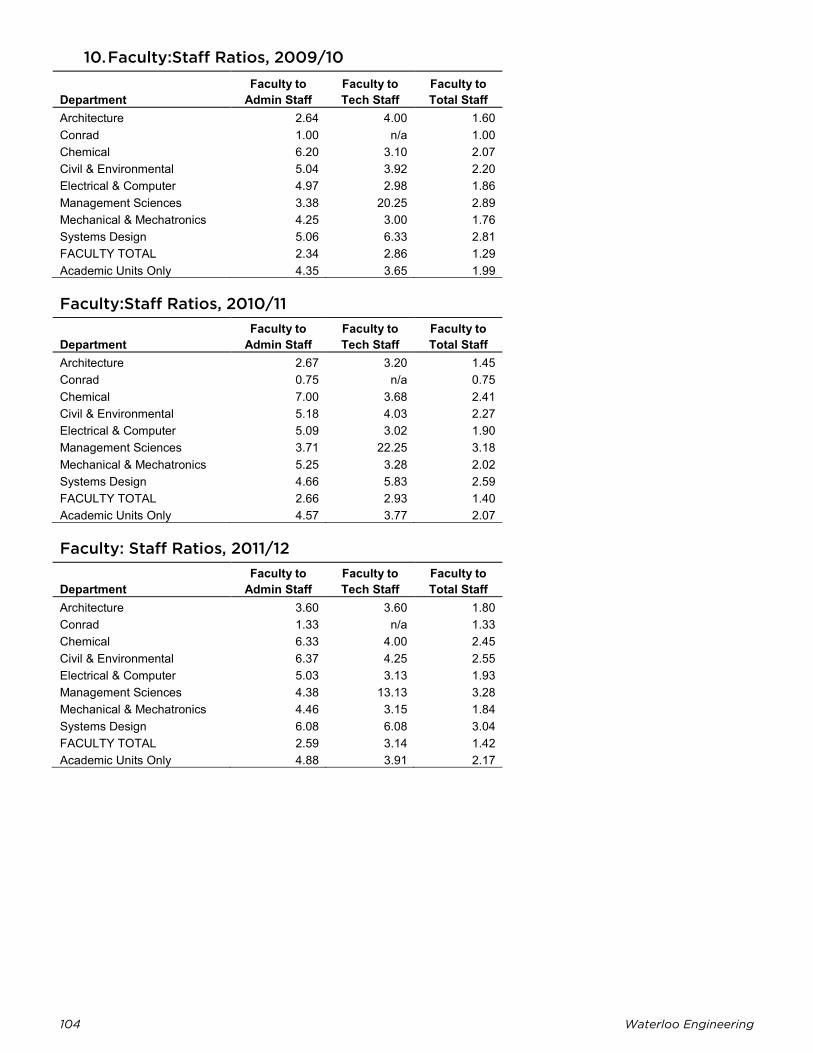
104 Waterloo Engineering
10. Faculty:Staff Ratios, 2009/10
Department Faculty to
Admin Staff Faculty to Tech Staff
Faculty to Total Staff
Architecture 2.64 4.00 1.60 Conrad 1.00 n/a 1.00 Chemical 6.20 3.10 2.07 Civil & Environmental 5.04 3.92 2.20 Electrical & Computer 4.97 2.98 1.86 Management Sciences 3.38 20.25 2.89 Mechanical & Mechatronics 4.25 3.00 1.76 Systems Design 5.06 6.33 2.81 FACULTY TOTAL 2.34 2.86 1.29 Academic Units Only 4.35 3.65 1.99
Faculty:Staff Ratios, 2010/11
Department Faculty to
Admin Staff Faculty to Tech Staff
Faculty to Total Staff
Architecture 2.67 3.20 1.45 Conrad 0.75 n/a 0.75 Chemical 7.00 3.68 2.41 Civil & Environmental 5.18 4.03 2.27 Electrical & Computer 5.09 3.02 1.90 Management Sciences 3.71 22.25 3.18 Mechanical & Mechatronics 5.25 3.28 2.02 Systems Design 4.66 5.83 2.59 FACULTY TOTAL 2.66 2.93 1.40 Academic Units Only 4.57 3.77 2.07
Faculty: Staff Ratios, 2011/12
Department Faculty to
Admin Staff Faculty to Tech Staff
Faculty to Total Staff
Architecture 3.60 3.60 1.80 Conrad 1.33 n/a 1.33 Chemical 6.33 4.00 2.45 Civil & Environmental 6.37 4.25 2.55 Electrical & Computer 5.03 3.13 1.93 Management Sciences 4.38 13.13 3.28 Mechanical & Mechatronics 4.46 3.15 1.84 Systems Design 6.08 6.08 3.04 FACULTY TOTAL 2.59 3.14 1.42 Academic Units Only 4.88 3.91 2.17
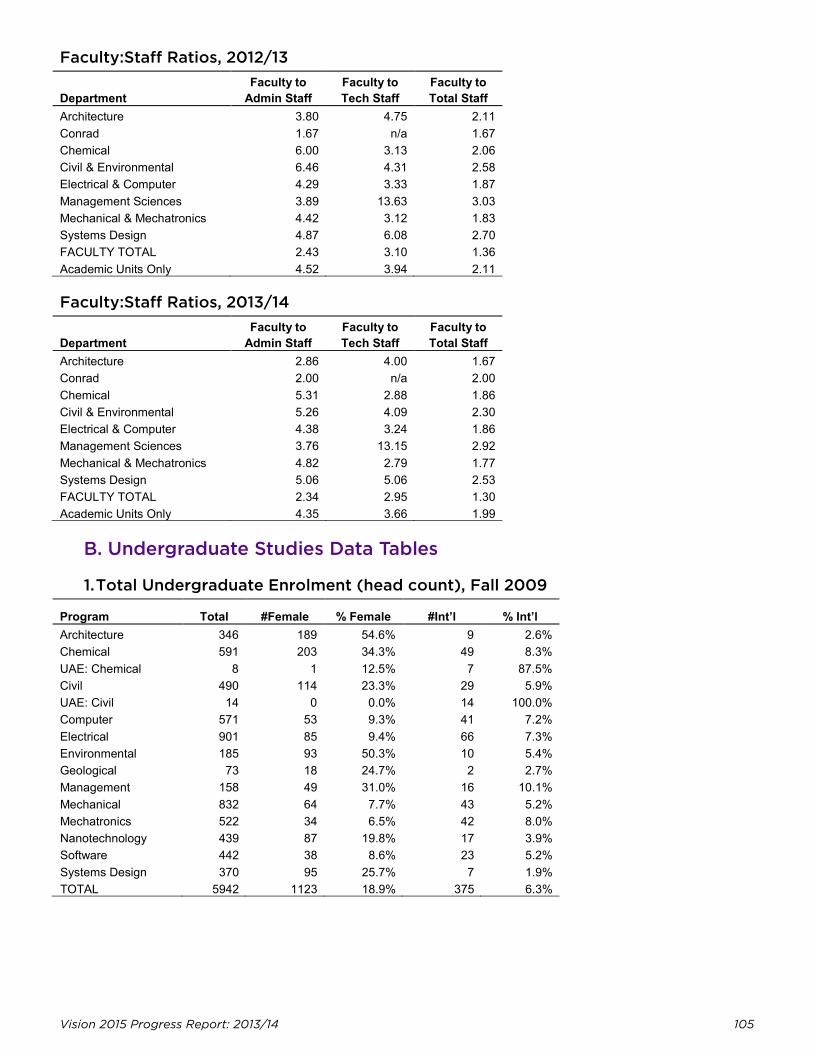
Vision 2015 Progress Report: 2013/14 105
Faculty:Staff Ratios, 2012/13
Department Faculty to
Admin Staff Faculty to Tech Staff
Faculty to Total Staff
Architecture 3.80 4.75 2.11 Conrad 1.67 n/a 1.67 Chemical 6.00 3.13 2.06 Civil & Environmental 6.46 4.31 2.58 Electrical & Computer 4.29 3.33 1.87 Management Sciences 3.89 13.63 3.03 Mechanical & Mechatronics 4.42 3.12 1.83 Systems Design 4.87 6.08 2.70 FACULTY TOTAL 2.43 3.10 1.36 Academic Units Only 4.52 3.94 2.11
Faculty:Staff Ratios, 2013/14
Department Faculty to
Admin Staff Faculty to Tech Staff
Faculty to Total Staff
Architecture 2.86 4.00 1.67 Conrad 2.00 n/a 2.00 Chemical 5.31 2.88 1.86 Civil & Environmental 5.26 4.09 2.30 Electrical & Computer 4.38 3.24 1.86 Management Sciences 3.76 13.15 2.92 Mechanical & Mechatronics 4.82 2.79 1.77 Systems Design 5.06 5.06 2.53 FACULTY TOTAL 2.34 2.95 1.30 Academic Units Only 4.35 3.66 1.99
B. Undergraduate Studies Data Tables
1. Total Undergraduate Enrolment (head count), Fall 2009
Program Total #Female % Female #Int’l % Int’l Architecture 346 189 54.6% 9 2.6% Chemical 591 203 34.3% 49 8.3% UAE: Chemical 8 1 12.5% 7 87.5% Civil 490 114 23.3% 29 5.9% UAE: Civil 14 0 0.0% 14 100.0% Computer 571 53 9.3% 41 7.2% Electrical 901 85 9.4% 66 7.3% Environmental 185 93 50.3% 10 5.4% Geological 73 18 24.7% 2 2.7% Management 158 49 31.0% 16 10.1% Mechanical 832 64 7.7% 43 5.2% Mechatronics 522 34 6.5% 42 8.0% Nanotechnology 439 87 19.8% 17 3.9% Software 442 38 8.6% 23 5.2% Systems Design 370 95 25.7% 7 1.9% TOTAL 5942 1123 18.9% 375 6.3%
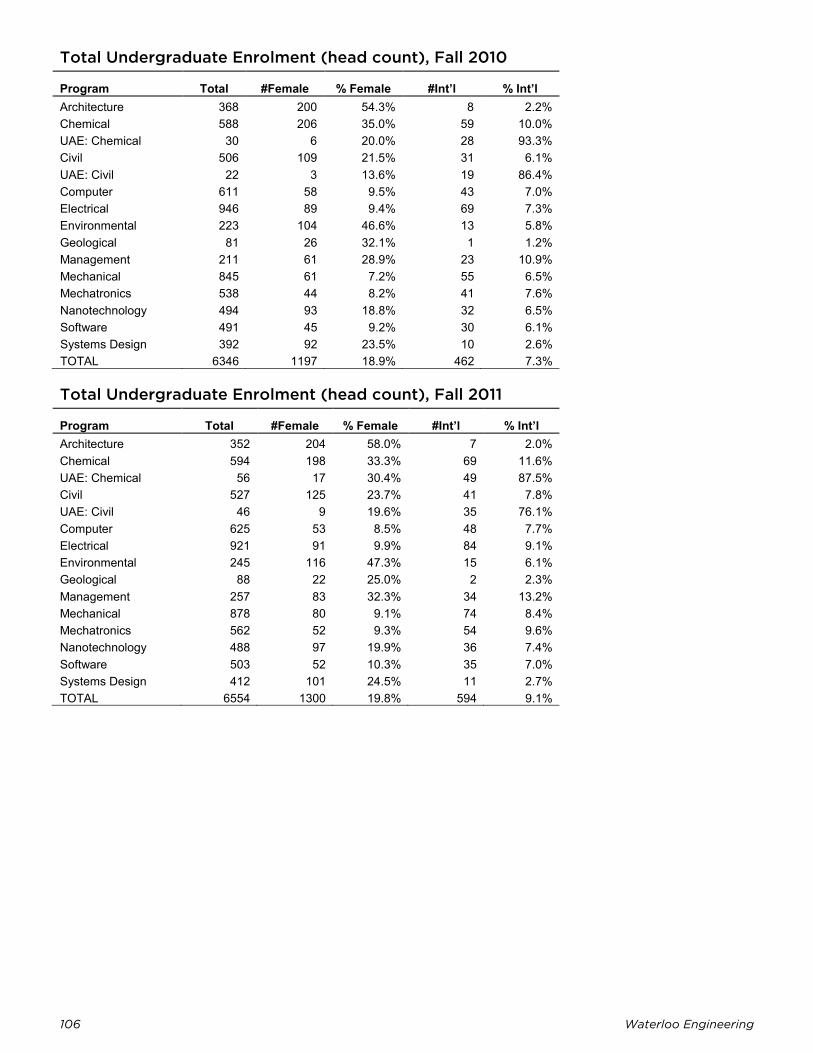
106 Waterloo Engineering
Total Undergraduate Enrolment (head count), Fall 2010
Program Total #Female % Female #Int’l % Int’l Architecture 368 200 54.3% 8 2.2% Chemical 588 206 35.0% 59 10.0% UAE: Chemical 30 6 20.0% 28 93.3% Civil 506 109 21.5% 31 6.1% UAE: Civil 22 3 13.6% 19 86.4% Computer 611 58 9.5% 43 7.0% Electrical 946 89 9.4% 69 7.3% Environmental 223 104 46.6% 13 5.8% Geological 81 26 32.1% 1 1.2% Management 211 61 28.9% 23 10.9% Mechanical 845 61 7.2% 55 6.5% Mechatronics 538 44 8.2% 41 7.6% Nanotechnology 494 93 18.8% 32 6.5% Software 491 45 9.2% 30 6.1% Systems Design 392 92 23.5% 10 2.6% TOTAL 6346 1197 18.9% 462 7.3%
Total Undergraduate Enrolment (head count), Fall 2011
Program Total #Female % Female #Int’l % Int’l Architecture 352 204 58.0% 7 2.0% Chemical 594 198 33.3% 69 11.6% UAE: Chemical 56 17 30.4% 49 87.5% Civil 527 125 23.7% 41 7.8% UAE: Civil 46 9 19.6% 35 76.1% Computer 625 53 8.5% 48 7.7% Electrical 921 91 9.9% 84 9.1% Environmental 245 116 47.3% 15 6.1% Geological 88 22 25.0% 2 2.3% Management 257 83 32.3% 34 13.2% Mechanical 878 80 9.1% 74 8.4% Mechatronics 562 52 9.3% 54 9.6% Nanotechnology 488 97 19.9% 36 7.4% Software 503 52 10.3% 35 7.0% Systems Design 412 101 24.5% 11 2.7% TOTAL 6554 1300 19.8% 594 9.1%
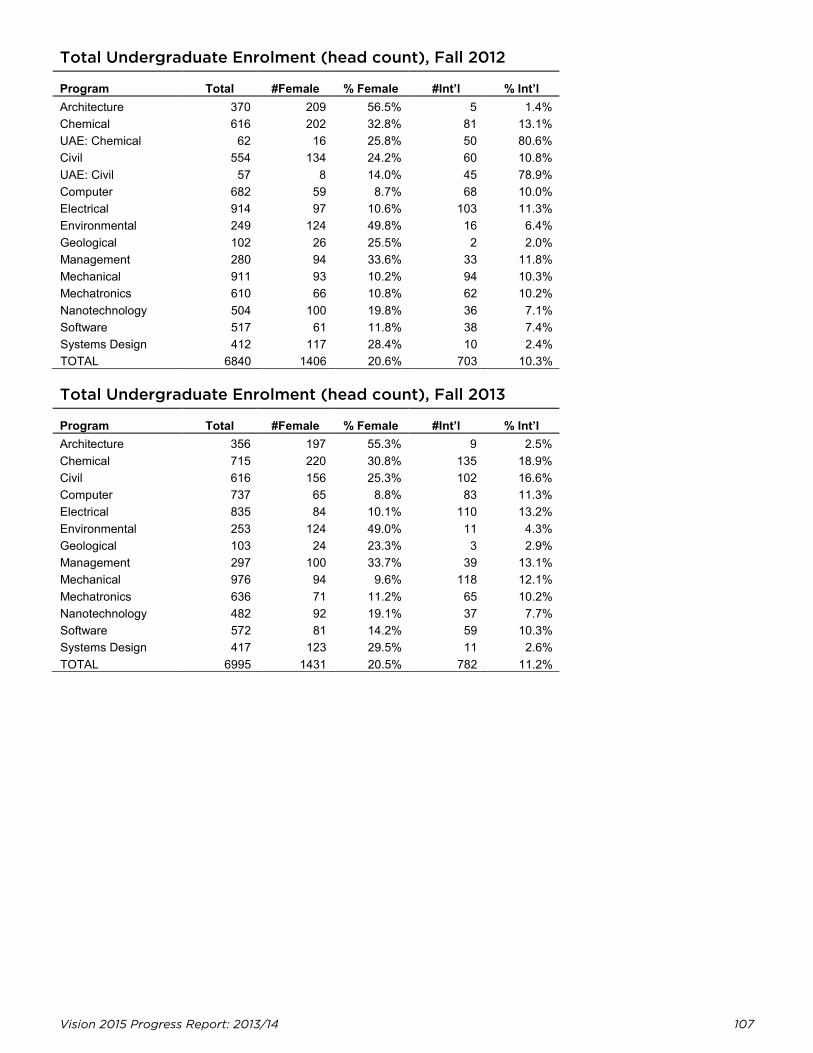
Vision 2015 Progress Report: 2013/14 107
Total Undergraduate Enrolment (head count), Fall 2012
Program Total #Female % Female #Int’l % Int’l Architecture 370 209 56.5% 5 1.4% Chemical 616 202 32.8% 81 13.1% UAE: Chemical 62 16 25.8% 50 80.6% Civil 554 134 24.2% 60 10.8% UAE: Civil 57 8 14.0% 45 78.9% Computer 682 59 8.7% 68 10.0% Electrical 914 97 10.6% 103 11.3% Environmental 249 124 49.8% 16 6.4% Geological 102 26 25.5% 2 2.0% Management 280 94 33.6% 33 11.8% Mechanical 911 93 10.2% 94 10.3% Mechatronics 610 66 10.8% 62 10.2% Nanotechnology 504 100 19.8% 36 7.1% Software 517 61 11.8% 38 7.4% Systems Design 412 117 28.4% 10 2.4% TOTAL 6840 1406 20.6% 703 10.3%
Total Undergraduate Enrolment (head count), Fall 2013
Program Total #Female % Female #Int’l % Int’l Architecture 356 197 55.3% 9 2.5% Chemical 715 220 30.8% 135 18.9% Civil 616 156 25.3% 102 16.6% Computer 737 65 8.8% 83 11.3% Electrical 835 84 10.1% 110 13.2% Environmental 253 124 49.0% 11 4.3% Geological 103 24 23.3% 3 2.9% Management 297 100 33.7% 39 13.1% Mechanical 976 94 9.6% 118 12.1% Mechatronics 636 71 11.2% 65 10.2% Nanotechnology 482 92 19.1% 37 7.7% Software 572 81 14.2% 59 10.3% Systems Design 417 123 29.5% 11 2.6% TOTAL 6995 1431 20.5% 782 11.2%
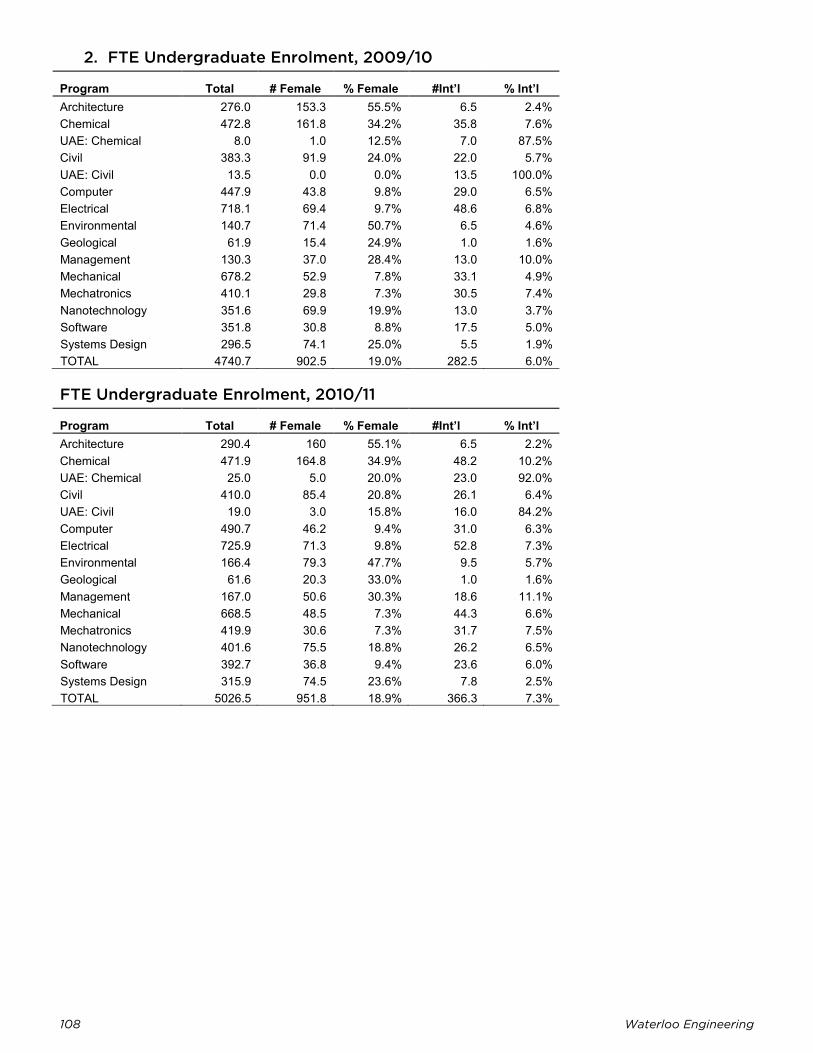
108 Waterloo Engineering
2. FTE Undergraduate Enrolment, 2009/10
Program Total # Female % Female #Int’l % Int’l Architecture 276.0 153.3 55.5% 6.5 2.4% Chemical 472.8 161.8 34.2% 35.8 7.6% UAE: Chemical 8.0 1.0 12.5% 7.0 87.5% Civil 383.3 91.9 24.0% 22.0 5.7% UAE: Civil 13.5 0.0 0.0% 13.5 100.0% Computer 447.9 43.8 9.8% 29.0 6.5% Electrical 718.1 69.4 9.7% 48.6 6.8% Environmental 140.7 71.4 50.7% 6.5 4.6% Geological 61.9 15.4 24.9% 1.0 1.6% Management 130.3 37.0 28.4% 13.0 10.0% Mechanical 678.2 52.9 7.8% 33.1 4.9% Mechatronics 410.1 29.8 7.3% 30.5 7.4% Nanotechnology 351.6 69.9 19.9% 13.0 3.7% Software 351.8 30.8 8.8% 17.5 5.0% Systems Design 296.5 74.1 25.0% 5.5 1.9% TOTAL 4740.7 902.5 19.0% 282.5 6.0%
FTE Undergraduate Enrolment, 2010/11
Program Total # Female % Female #Int’l % Int’l Architecture 290.4 160 55.1% 6.5 2.2% Chemical 471.9 164.8 34.9% 48.2 10.2% UAE: Chemical 25.0 5.0 20.0% 23.0 92.0% Civil 410.0 85.4 20.8% 26.1 6.4% UAE: Civil 19.0 3.0 15.8% 16.0 84.2% Computer 490.7 46.2 9.4% 31.0 6.3% Electrical 725.9 71.3 9.8% 52.8 7.3% Environmental 166.4 79.3 47.7% 9.5 5.7% Geological 61.6 20.3 33.0% 1.0 1.6% Management 167.0 50.6 30.3% 18.6 11.1% Mechanical 668.5 48.5 7.3% 44.3 6.6% Mechatronics 419.9 30.6 7.3% 31.7 7.5% Nanotechnology 401.6 75.5 18.8% 26.2 6.5% Software 392.7 36.8 9.4% 23.6 6.0% Systems Design 315.9 74.5 23.6% 7.8 2.5% TOTAL 5026.5 951.8 18.9% 366.3 7.3%
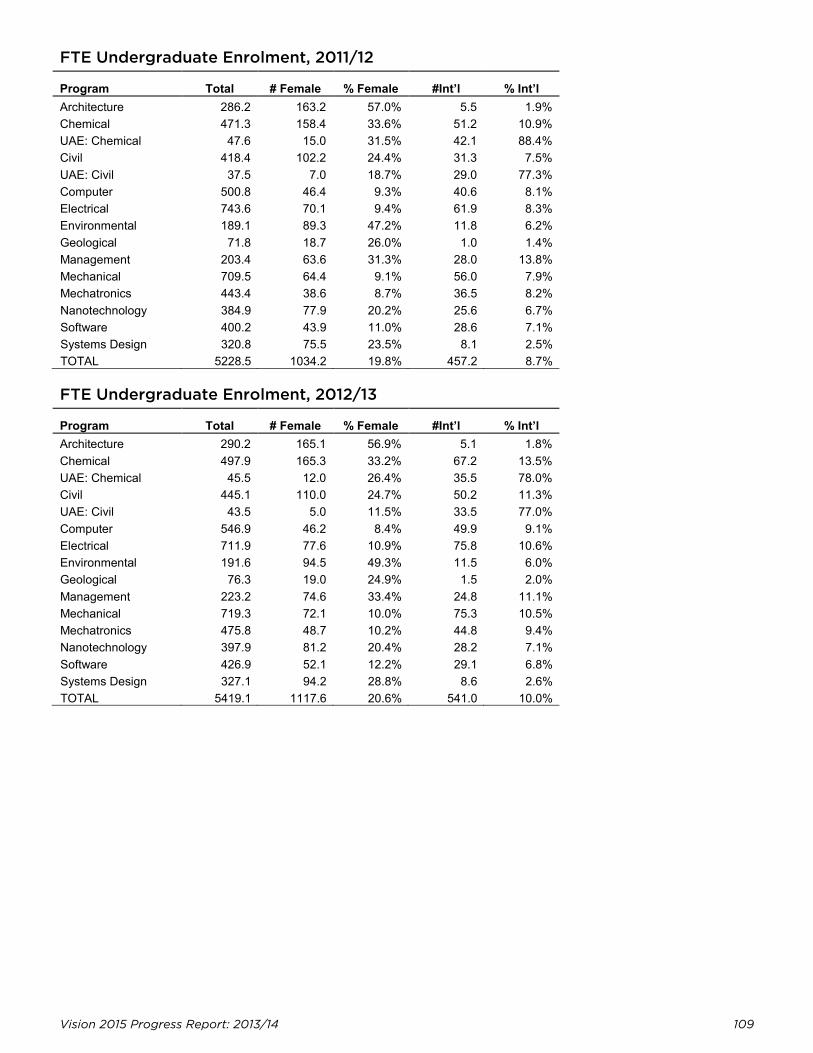
Vision 2015 Progress Report: 2013/14 109
FTE Undergraduate Enrolment, 2011/12
Program Total # Female % Female #Int’l % Int’l Architecture 286.2 163.2 57.0% 5.5 1.9% Chemical 471.3 158.4 33.6% 51.2 10.9% UAE: Chemical 47.6 15.0 31.5% 42.1 88.4% Civil 418.4 102.2 24.4% 31.3 7.5% UAE: Civil 37.5 7.0 18.7% 29.0 77.3% Computer 500.8 46.4 9.3% 40.6 8.1% Electrical 743.6 70.1 9.4% 61.9 8.3% Environmental 189.1 89.3 47.2% 11.8 6.2% Geological 71.8 18.7 26.0% 1.0 1.4% Management 203.4 63.6 31.3% 28.0 13.8% Mechanical 709.5 64.4 9.1% 56.0 7.9% Mechatronics 443.4 38.6 8.7% 36.5 8.2% Nanotechnology 384.9 77.9 20.2% 25.6 6.7% Software 400.2 43.9 11.0% 28.6 7.1% Systems Design 320.8 75.5 23.5% 8.1 2.5% TOTAL 5228.5 1034.2 19.8% 457.2 8.7%
FTE Undergraduate Enrolment, 2012/13
Program Total # Female % Female #Int’l % Int’l Architecture 290.2 165.1 56.9% 5.1 1.8% Chemical 497.9 165.3 33.2% 67.2 13.5% UAE: Chemical 45.5 12.0 26.4% 35.5 78.0% Civil 445.1 110.0 24.7% 50.2 11.3% UAE: Civil 43.5 5.0 11.5% 33.5 77.0% Computer 546.9 46.2 8.4% 49.9 9.1% Electrical 711.9 77.6 10.9% 75.8 10.6% Environmental 191.6 94.5 49.3% 11.5 6.0% Geological 76.3 19.0 24.9% 1.5 2.0% Management 223.2 74.6 33.4% 24.8 11.1% Mechanical 719.3 72.1 10.0% 75.3 10.5% Mechatronics 475.8 48.7 10.2% 44.8 9.4% Nanotechnology 397.9 81.2 20.4% 28.2 7.1% Software 426.9 52.1 12.2% 29.1 6.8% Systems Design 327.1 94.2 28.8% 8.6 2.6% TOTAL 5419.1 1117.6 20.6% 541.0 10.0%
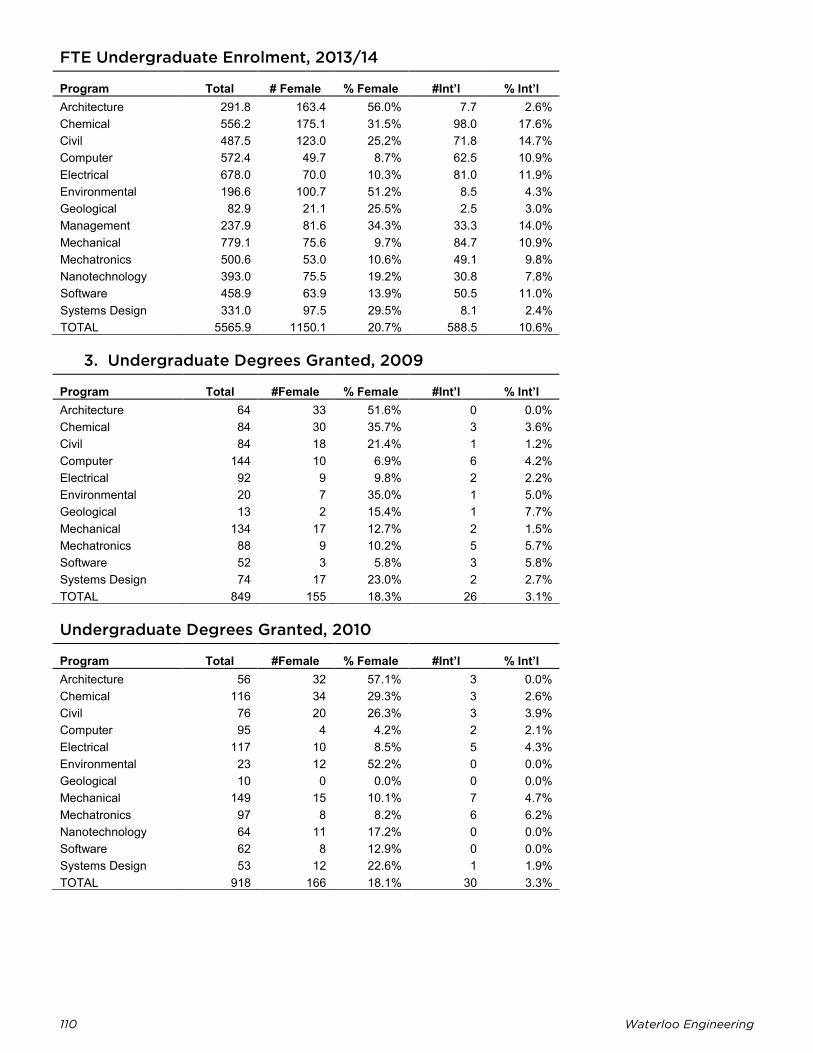
110 Waterloo Engineering
FTE Undergraduate Enrolment, 2013/14
Program Total # Female % Female #Int’l % Int’l Architecture 291.8 163.4 56.0% 7.7 2.6% Chemical 556.2 175.1 31.5% 98.0 17.6% Civil 487.5 123.0 25.2% 71.8 14.7% Computer 572.4 49.7 8.7% 62.5 10.9% Electrical 678.0 70.0 10.3% 81.0 11.9% Environmental 196.6 100.7 51.2% 8.5 4.3% Geological 82.9 21.1 25.5% 2.5 3.0% Management 237.9 81.6 34.3% 33.3 14.0% Mechanical 779.1 75.6 9.7% 84.7 10.9% Mechatronics 500.6 53.0 10.6% 49.1 9.8% Nanotechnology 393.0 75.5 19.2% 30.8 7.8% Software 458.9 63.9 13.9% 50.5 11.0% Systems Design 331.0 97.5 29.5% 8.1 2.4% TOTAL 5565.9 1150.1 20.7% 588.5 10.6%
3. Undergraduate Degrees Granted, 2009
Program Total #Female % Female #Int’l % Int’l Architecture 64 33 51.6% 0 0.0% Chemical 84 30 35.7% 3 3.6% Civil 84 18 21.4% 1 1.2% Computer 144 10 6.9% 6 4.2% Electrical 92 9 9.8% 2 2.2% Environmental 20 7 35.0% 1 5.0% Geological 13 2 15.4% 1 7.7% Mechanical 134 17 12.7% 2 1.5% Mechatronics 88 9 10.2% 5 5.7% Software 52 3 5.8% 3 5.8% Systems Design 74 17 23.0% 2 2.7% TOTAL 849 155 18.3% 26 3.1%
Undergraduate Degrees Granted, 2010
Program Total #Female % Female #Int’l % Int’l Architecture 56 32 57.1% 3 0.0% Chemical 116 34 29.3% 3 2.6% Civil 76 20 26.3% 3 3.9% Computer 95 4 4.2% 2 2.1% Electrical 117 10 8.5% 5 4.3% Environmental 23 12 52.2% 0 0.0% Geological 10 0 0.0% 0 0.0% Mechanical 149 15 10.1% 7 4.7% Mechatronics 97 8 8.2% 6 6.2% Nanotechnology 64 11 17.2% 0 0.0% Software 62 8 12.9% 0 0.0% Systems Design 53 12 22.6% 1 1.9% TOTAL 918 166 18.1% 30 3.3%
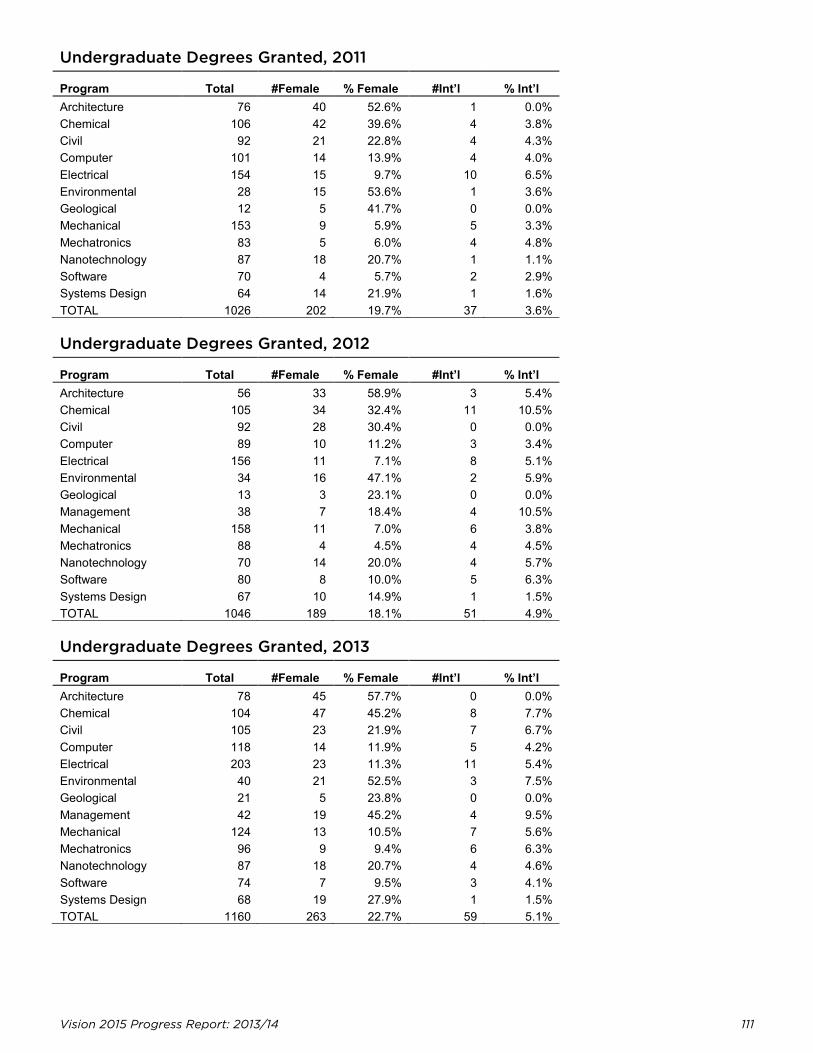
Vision 2015 Progress Report: 2013/14 111
Undergraduate Degrees Granted, 2011
Program Total #Female % Female #Int’l % Int’l Architecture 76 40 52.6% 1 0.0% Chemical 106 42 39.6% 4 3.8% Civil 92 21 22.8% 4 4.3% Computer 101 14 13.9% 4 4.0% Electrical 154 15 9.7% 10 6.5% Environmental 28 15 53.6% 1 3.6% Geological 12 5 41.7% 0 0.0% Mechanical 153 9 5.9% 5 3.3% Mechatronics 83 5 6.0% 4 4.8% Nanotechnology 87 18 20.7% 1 1.1% Software 70 4 5.7% 2 2.9% Systems Design 64 14 21.9% 1 1.6% TOTAL 1026 202 19.7% 37 3.6%
Undergraduate Degrees Granted, 2012
Program Total #Female % Female #Int’l % Int’l Architecture 56 33 58.9% 3 5.4% Chemical 105 34 32.4% 11 10.5% Civil 92 28 30.4% 0 0.0% Computer 89 10 11.2% 3 3.4% Electrical 156 11 7.1% 8 5.1% Environmental 34 16 47.1% 2 5.9% Geological 13 3 23.1% 0 0.0% Management 38 7 18.4% 4 10.5% Mechanical 158 11 7.0% 6 3.8% Mechatronics 88 4 4.5% 4 4.5% Nanotechnology 70 14 20.0% 4 5.7% Software 80 8 10.0% 5 6.3% Systems Design 67 10 14.9% 1 1.5% TOTAL 1046 189 18.1% 51 4.9%
Undergraduate Degrees Granted, 2013
Program Total #Female % Female #Int’l % Int’l Architecture 78 45 57.7% 0 0.0% Chemical 104 47 45.2% 8 7.7% Civil 105 23 21.9% 7 6.7% Computer 118 14 11.9% 5 4.2% Electrical 203 23 11.3% 11 5.4% Environmental 40 21 52.5% 3 7.5% Geological 21 5 23.8% 0 0.0% Management 42 19 45.2% 4 9.5% Mechanical 124 13 10.5% 7 5.6% Mechatronics 96 9 9.4% 6 6.3% Nanotechnology 87 18 20.7% 4 4.6% Software 74 7 9.5% 3 4.1% Systems Design 68 19 27.9% 1 1.5% TOTAL 1160 263 22.7% 59 5.1%
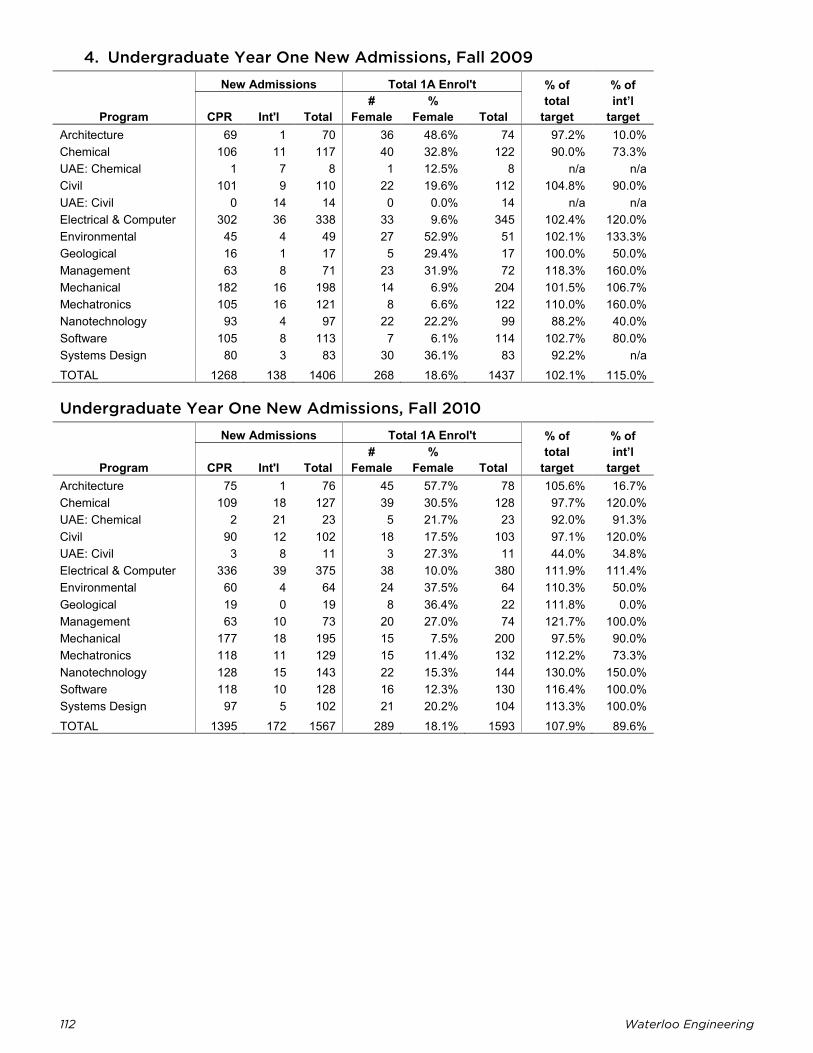
112 Waterloo Engineering
4. Undergraduate Year One New Admissions, Fall 2009
Program
New Admissions Total 1A Enrol't % of total
target
% of int’l
target CPR Int'l Total #
Female %
Female Total Architecture 69 1 70 36 48.6% 74 97.2% 10.0% Chemical 106 11 117 40 32.8% 122 90.0% 73.3% UAE: Chemical 1 7 8 1 12.5% 8 n/a n/a Civil 101 9 110 22 19.6% 112 104.8% 90.0% UAE: Civil 0 14 14 0 0.0% 14 n/a n/a Electrical & Computer 302 36 338 33 9.6% 345 102.4% 120.0% Environmental 45 4 49 27 52.9% 51 102.1% 133.3% Geological 16 1 17 5 29.4% 17 100.0% 50.0% Management 63 8 71 23 31.9% 72 118.3% 160.0% Mechanical 182 16 198 14 6.9% 204 101.5% 106.7% Mechatronics 105 16 121 8 6.6% 122 110.0% 160.0% Nanotechnology 93 4 97 22 22.2% 99 88.2% 40.0% Software 105 8 113 7 6.1% 114 102.7% 80.0% Systems Design 80 3 83 30 36.1% 83 92.2% n/a TOTAL 1268 138 1406 268 18.6% 1437 102.1% 115.0%
Undergraduate Year One New Admissions, Fall 2010
Program
New Admissions Total 1A Enrol't % of total
target
% of int’l
target CPR Int'l Total #
Female %
Female Total Architecture 75 1 76 45 57.7% 78 105.6% 16.7% Chemical 109 18 127 39 30.5% 128 97.7% 120.0% UAE: Chemical 2 21 23 5 21.7% 23 92.0% 91.3% Civil 90 12 102 18 17.5% 103 97.1% 120.0% UAE: Civil 3 8 11 3 27.3% 11 44.0% 34.8% Electrical & Computer 336 39 375 38 10.0% 380 111.9% 111.4% Environmental 60 4 64 24 37.5% 64 110.3% 50.0% Geological 19 0 19 8 36.4% 22 111.8% 0.0% Management 63 10 73 20 27.0% 74 121.7% 100.0% Mechanical 177 18 195 15 7.5% 200 97.5% 90.0% Mechatronics 118 11 129 15 11.4% 132 112.2% 73.3% Nanotechnology 128 15 143 22 15.3% 144 130.0% 150.0% Software 118 10 128 16 12.3% 130 116.4% 100.0% Systems Design 97 5 102 21 20.2% 104 113.3% 100.0% TOTAL 1395 172 1567 289 18.1% 1593 107.9% 89.6%
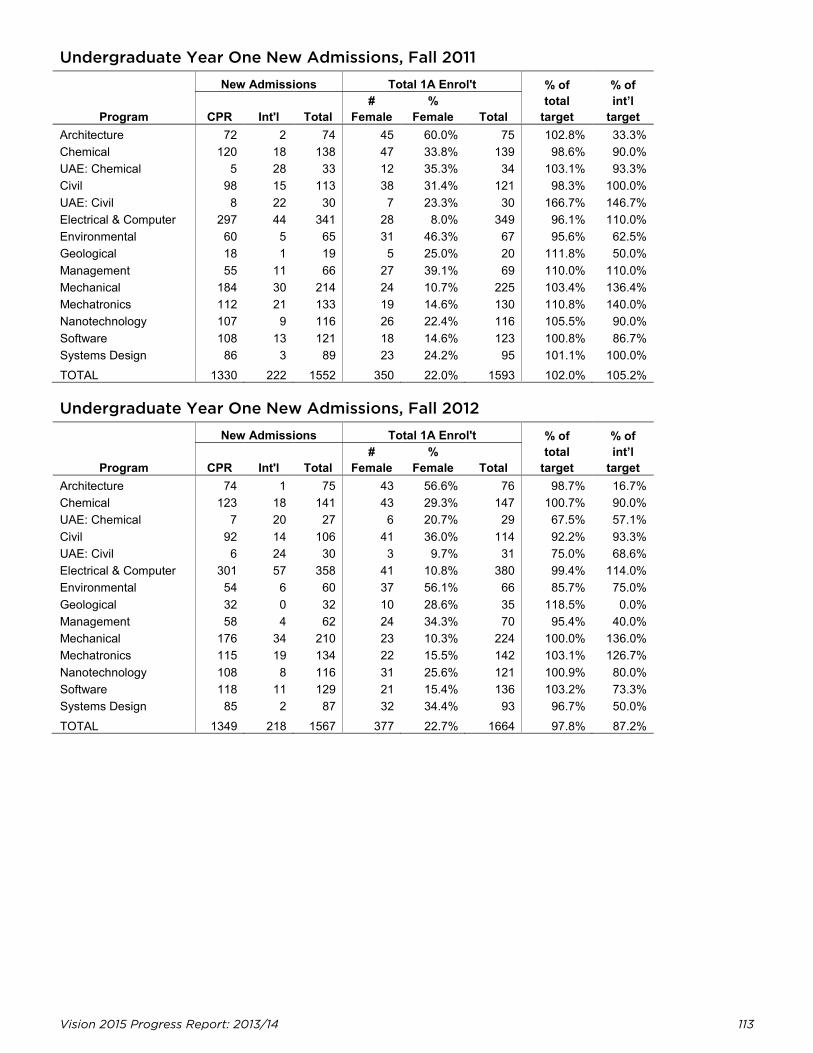
Vision 2015 Progress Report: 2013/14 113
Undergraduate Year One New Admissions, Fall 2011
Program
New Admissions Total 1A Enrol't % of total
target
% of int’l
target CPR Int'l Total #
Female %
Female Total Architecture 72 2 74 45 60.0% 75 102.8% 33.3% Chemical 120 18 138 47 33.8% 139 98.6% 90.0% UAE: Chemical 5 28 33 12 35.3% 34 103.1% 93.3% Civil 98 15 113 38 31.4% 121 98.3% 100.0% UAE: Civil 8 22 30 7 23.3% 30 166.7% 146.7% Electrical & Computer 297 44 341 28 8.0% 349 96.1% 110.0% Environmental 60 5 65 31 46.3% 67 95.6% 62.5% Geological 18 1 19 5 25.0% 20 111.8% 50.0% Management 55 11 66 27 39.1% 69 110.0% 110.0% Mechanical 184 30 214 24 10.7% 225 103.4% 136.4% Mechatronics 112 21 133 19 14.6% 130 110.8% 140.0% Nanotechnology 107 9 116 26 22.4% 116 105.5% 90.0% Software 108 13 121 18 14.6% 123 100.8% 86.7% Systems Design 86 3 89 23 24.2% 95 101.1% 100.0% TOTAL 1330 222 1552 350 22.0% 1593 102.0% 105.2%
Undergraduate Year One New Admissions, Fall 2012
Program
New Admissions Total 1A Enrol't % of total
target
% of int’l
target CPR Int'l Total #
Female %
Female Total Architecture 74 1 75 43 56.6% 76 98.7% 16.7% Chemical 123 18 141 43 29.3% 147 100.7% 90.0% UAE: Chemical 7 20 27 6 20.7% 29 67.5% 57.1% Civil 92 14 106 41 36.0% 114 92.2% 93.3% UAE: Civil 6 24 30 3 9.7% 31 75.0% 68.6% Electrical & Computer 301 57 358 41 10.8% 380 99.4% 114.0% Environmental 54 6 60 37 56.1% 66 85.7% 75.0% Geological 32 0 32 10 28.6% 35 118.5% 0.0% Management 58 4 62 24 34.3% 70 95.4% 40.0% Mechanical 176 34 210 23 10.3% 224 100.0% 136.0% Mechatronics 115 19 134 22 15.5% 142 103.1% 126.7% Nanotechnology 108 8 116 31 25.6% 121 100.9% 80.0% Software 118 11 129 21 15.4% 136 103.2% 73.3% Systems Design 85 2 87 32 34.4% 93 96.7% 50.0% TOTAL 1349 218 1567 377 22.7% 1664 97.8% 87.2%
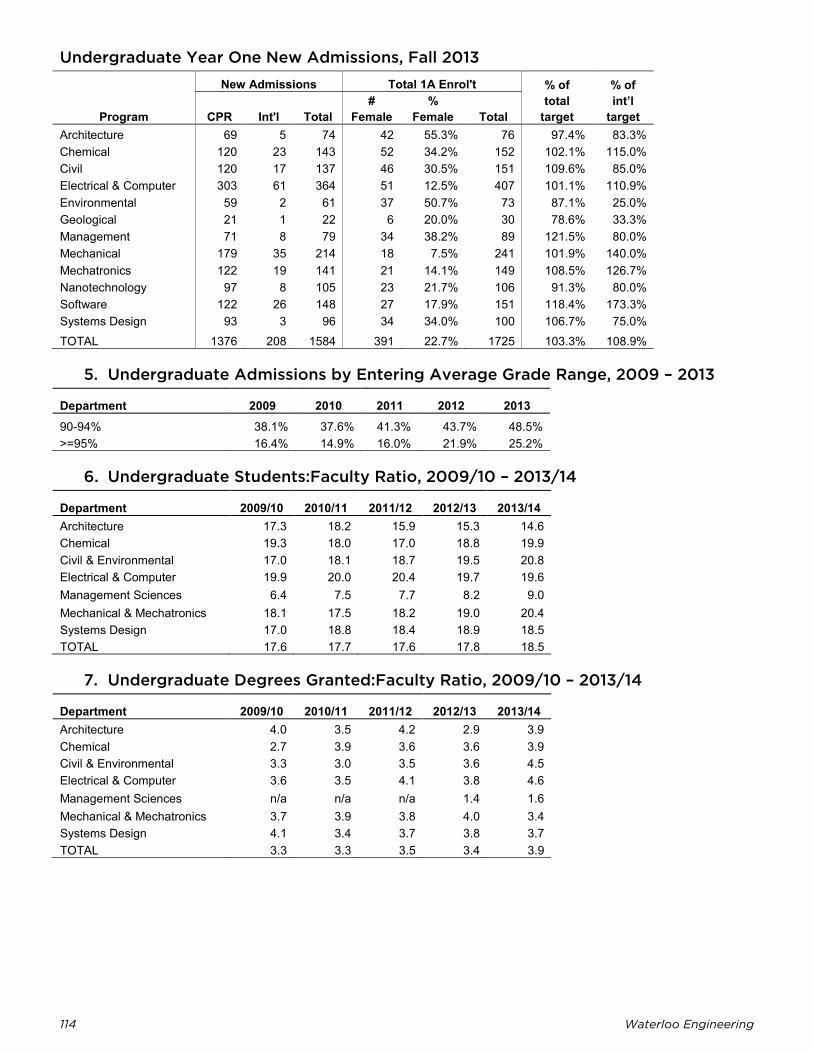
114 Waterloo Engineering
Undergraduate Year One New Admissions, Fall 2013
Program
New Admissions Total 1A Enrol't % of total
target
% of int’l
target CPR Int'l Total #
Female %
Female Total Architecture 69 5 74 42 55.3% 76 97.4% 83.3% Chemical 120 23 143 52 34.2% 152 102.1% 115.0% Civil 120 17 137 46 30.5% 151 109.6% 85.0% Electrical & Computer 303 61 364 51 12.5% 407 101.1% 110.9% Environmental 59 2 61 37 50.7% 73 87.1% 25.0% Geological 21 1 22 6 20.0% 30 78.6% 33.3% Management 71 8 79 34 38.2% 89 121.5% 80.0% Mechanical 179 35 214 18 7.5% 241 101.9% 140.0% Mechatronics 122 19 141 21 14.1% 149 108.5% 126.7% Nanotechnology 97 8 105 23 21.7% 106 91.3% 80.0% Software 122 26 148 27 17.9% 151 118.4% 173.3% Systems Design 93 3 96 34 34.0% 100 106.7% 75.0% TOTAL 1376 208 1584 391 22.7% 1725 103.3% 108.9%
5. Undergraduate Admissions by Entering Average Grade Range, 2009 – 2013
Department 2009 2010 2011 2012 2013 90-94% 38.1% 37.6% 41.3% 43.7% 48.5% >=95% 16.4% 14.9% 16.0% 21.9% 25.2%
6. Undergraduate Students:Faculty Ratio, 2009/10 – 2013/14
Department 2009/10 2010/11 2011/12 2012/13 2013/14 Architecture 17.3 18.2 15.9 15.3 14.6 Chemical 19.3 18.0 17.0 18.8 19.9 Civil & Environmental 17.0 18.1 18.7 19.5 20.8 Electrical & Computer 19.9 20.0 20.4 19.7 19.6 Management Sciences 6.4 7.5 7.7 8.2 9.0 Mechanical & Mechatronics 18.1 17.5 18.2 19.0 20.4 Systems Design 17.0 18.8 18.4 18.9 18.5 TOTAL 17.6 17.7 17.6 17.8 18.5
7. Undergraduate Degrees Granted:Faculty Ratio, 2009/10 – 2013/14
Department 2009/10 2010/11 2011/12 2012/13 2013/14 Architecture 4.0 3.5 4.2 2.9 3.9 Chemical 2.7 3.9 3.6 3.6 3.9 Civil & Environmental 3.3 3.0 3.5 3.6 4.5 Electrical & Computer 3.6 3.5 4.1 3.8 4.6 Management Sciences n/a n/a n/a 1.4 1.6 Mechanical & Mechatronics 3.7 3.9 3.8 4.0 3.4 Systems Design 4.1 3.4 3.7 3.8 3.7 TOTAL 3.3 3.3 3.5 3.4 3.9
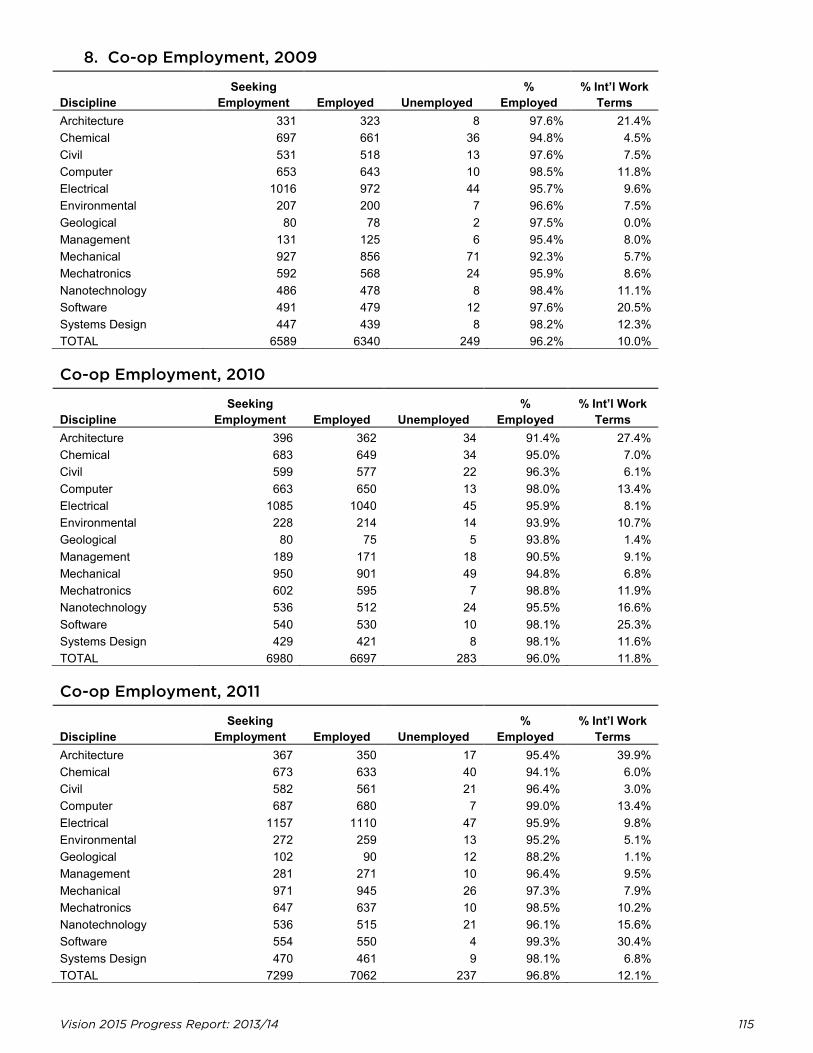
Vision 2015 Progress Report: 2013/14 115
8. Co-op Employment, 2009
Discipline Seeking
Employment Employed Unemployed %
Employed % Int’l Work
Terms Architecture 331 323 8 97.6% 21.4% Chemical 697 661 36 94.8% 4.5% Civil 531 518 13 97.6% 7.5% Computer 653 643 10 98.5% 11.8% Electrical 1016 972 44 95.7% 9.6% Environmental 207 200 7 96.6% 7.5% Geological 80 78 2 97.5% 0.0% Management 131 125 6 95.4% 8.0% Mechanical 927 856 71 92.3% 5.7% Mechatronics 592 568 24 95.9% 8.6% Nanotechnology 486 478 8 98.4% 11.1% Software 491 479 12 97.6% 20.5% Systems Design 447 439 8 98.2% 12.3% TOTAL 6589 6340 249 96.2% 10.0%
Co-op Employment, 2010
Discipline Seeking
Employment Employed Unemployed %
Employed % Int’l Work
Terms Architecture 396 362 34 91.4% 27.4% Chemical 683 649 34 95.0% 7.0% Civil 599 577 22 96.3% 6.1% Computer 663 650 13 98.0% 13.4% Electrical 1085 1040 45 95.9% 8.1% Environmental 228 214 14 93.9% 10.7% Geological 80 75 5 93.8% 1.4% Management 189 171 18 90.5% 9.1% Mechanical 950 901 49 94.8% 6.8% Mechatronics 602 595 7 98.8% 11.9% Nanotechnology 536 512 24 95.5% 16.6% Software 540 530 10 98.1% 25.3% Systems Design 429 421 8 98.1% 11.6% TOTAL 6980 6697 283 96.0% 11.8%
Co-op Employment, 2011
Discipline Seeking
Employment Employed Unemployed %
Employed % Int’l Work
Terms Architecture 367 350 17 95.4% 39.9% Chemical 673 633 40 94.1% 6.0% Civil 582 561 21 96.4% 3.0% Computer 687 680 7 99.0% 13.4% Electrical 1157 1110 47 95.9% 9.8% Environmental 272 259 13 95.2% 5.1% Geological 102 90 12 88.2% 1.1% Management 281 271 10 96.4% 9.5% Mechanical 971 945 26 97.3% 7.9% Mechatronics 647 637 10 98.5% 10.2% Nanotechnology 536 515 21 96.1% 15.6% Software 554 550 4 99.3% 30.4% Systems Design 470 461 9 98.1% 6.8% TOTAL 7299 7062 237 96.8% 12.1%
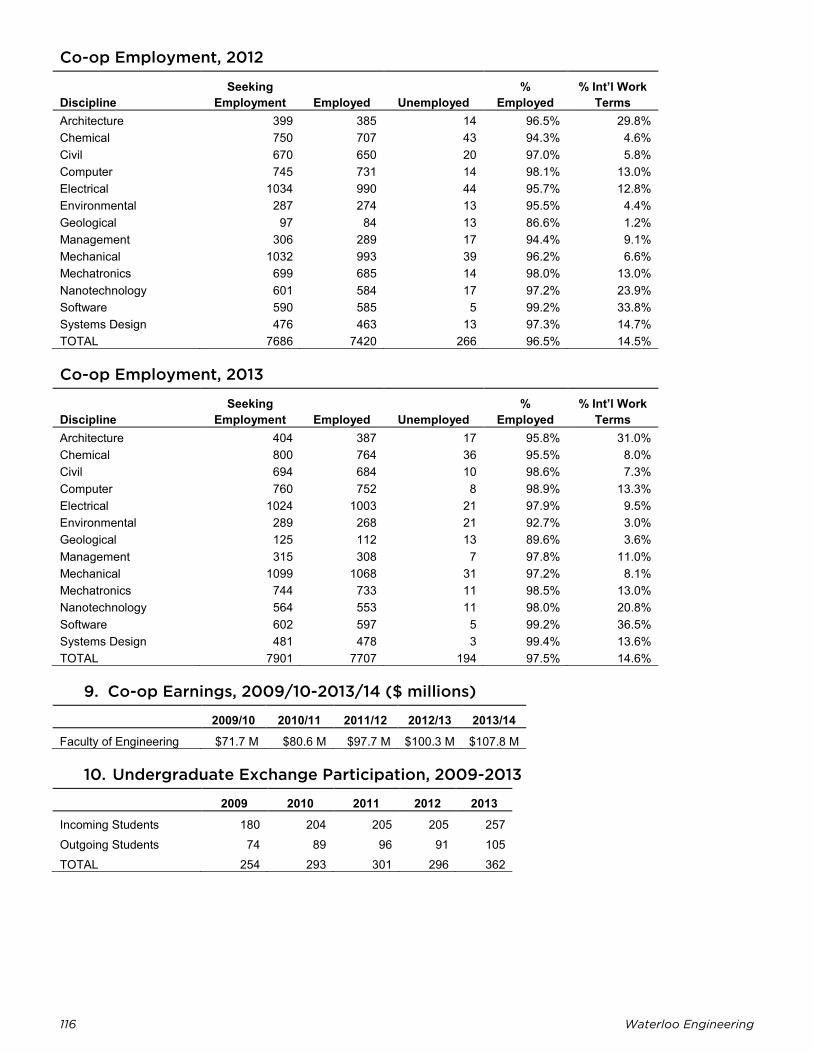
116 Waterloo Engineering
Co-op Employment, 2012
Discipline Seeking
Employment Employed Unemployed %
Employed % Int’l Work
Terms Architecture 399 385 14 96.5% 29.8% Chemical 750 707 43 94.3% 4.6% Civil 670 650 20 97.0% 5.8% Computer 745 731 14 98.1% 13.0% Electrical 1034 990 44 95.7% 12.8% Environmental 287 274 13 95.5% 4.4% Geological 97 84 13 86.6% 1.2% Management 306 289 17 94.4% 9.1% Mechanical 1032 993 39 96.2% 6.6% Mechatronics 699 685 14 98.0% 13.0% Nanotechnology 601 584 17 97.2% 23.9% Software 590 585 5 99.2% 33.8% Systems Design 476 463 13 97.3% 14.7% TOTAL 7686 7420 266 96.5% 14.5%
Co-op Employment, 2013
Discipline Seeking
Employment Employed Unemployed %
Employed % Int’l Work
Terms Architecture 404 387 17 95.8% 31.0% Chemical 800 764 36 95.5% 8.0% Civil 694 684 10 98.6% 7.3% Computer 760 752 8 98.9% 13.3% Electrical 1024 1003 21 97.9% 9.5% Environmental 289 268 21 92.7% 3.0% Geological 125 112 13 89.6% 3.6% Management 315 308 7 97.8% 11.0% Mechanical 1099 1068 31 97.2% 8.1% Mechatronics 744 733 11 98.5% 13.0% Nanotechnology 564 553 11 98.0% 20.8% Software 602 597 5 99.2% 36.5% Systems Design 481 478 3 99.4% 13.6% TOTAL 7901 7707 194 97.5% 14.6%
9. Co-op Earnings, 2009/10-2013/14 ($ millions)
2009/10 2010/11 2011/12 2012/13 2013/14 Faculty of Engineering $71.7 M $80.6 M $97.7 M $100.3 M $107.8 M
10. Undergraduate Exchange Participation, 2009-2013
2009 2010 2011 2012 2013 Incoming Students 180 204 205 205 257 Outgoing Students 74 89 96 91 105 TOTAL 254 293 301 296 362
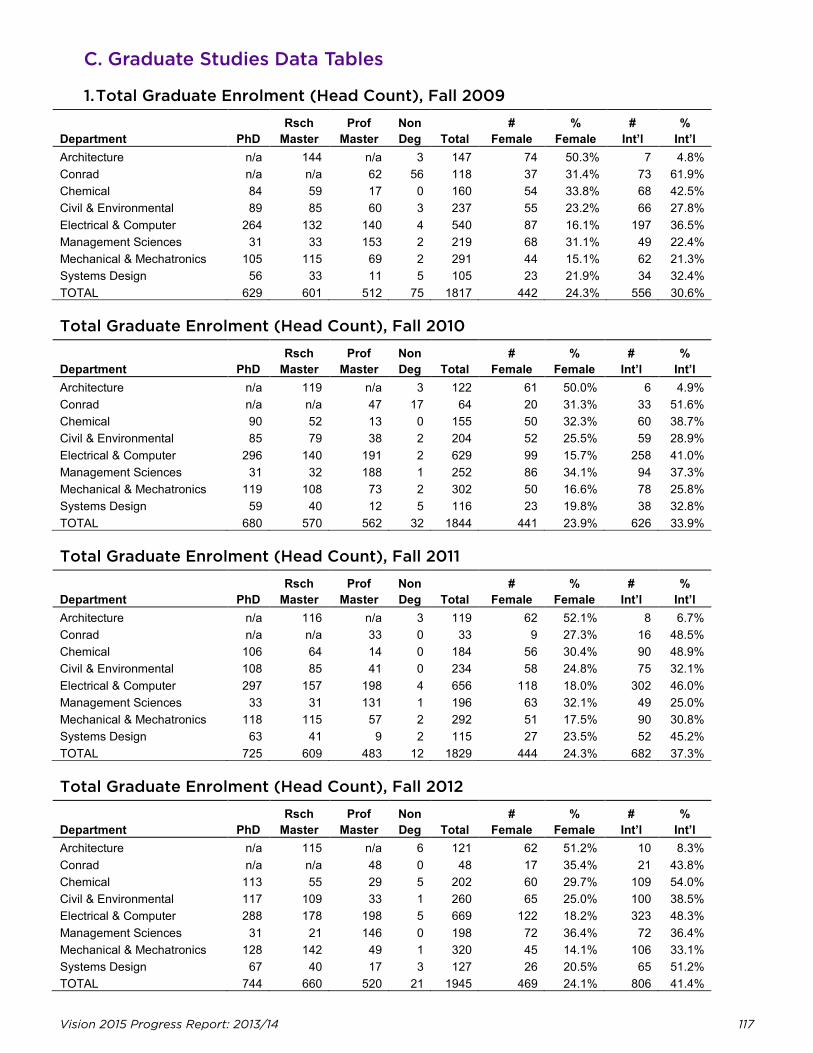
Vision 2015 Progress Report: 2013/14 117
C. Graduate Studies Data Tables
1. Total Graduate Enrolment (Head Count), Fall 2009
Department PhD Rsch
Master Prof
Master Non Deg Total
# Female
% Female
# Int’l
% Int’l
Architecture n/a 144 n/a 3 147 74 50.3% 7 4.8% Conrad n/a n/a 62 56 118 37 31.4% 73 61.9% Chemical 84 59 17 0 160 54 33.8% 68 42.5% Civil & Environmental 89 85 60 3 237 55 23.2% 66 27.8% Electrical & Computer 264 132 140 4 540 87 16.1% 197 36.5% Management Sciences 31 33 153 2 219 68 31.1% 49 22.4% Mechanical & Mechatronics 105 115 69 2 291 44 15.1% 62 21.3% Systems Design 56 33 11 5 105 23 21.9% 34 32.4% TOTAL 629 601 512 75 1817 442 24.3% 556 30.6%
Total Graduate Enrolment (Head Count), Fall 2010
Department PhD Rsch
Master Prof
Master Non Deg Total
# Female
% Female
# Int’l
% Int’l
Architecture n/a 119 n/a 3 122 61 50.0% 6 4.9% Conrad n/a n/a 47 17 64 20 31.3% 33 51.6% Chemical 90 52 13 0 155 50 32.3% 60 38.7% Civil & Environmental 85 79 38 2 204 52 25.5% 59 28.9% Electrical & Computer 296 140 191 2 629 99 15.7% 258 41.0% Management Sciences 31 32 188 1 252 86 34.1% 94 37.3% Mechanical & Mechatronics 119 108 73 2 302 50 16.6% 78 25.8% Systems Design 59 40 12 5 116 23 19.8% 38 32.8% TOTAL 680 570 562 32 1844 441 23.9% 626 33.9%
Total Graduate Enrolment (Head Count), Fall 2011
Department PhD Rsch
Master Prof
Master Non Deg Total
# Female
% Female
# Int’l
% Int’l
Architecture n/a 116 n/a 3 119 62 52.1% 8 6.7% Conrad n/a n/a 33 0 33 9 27.3% 16 48.5% Chemical 106 64 14 0 184 56 30.4% 90 48.9% Civil & Environmental 108 85 41 0 234 58 24.8% 75 32.1% Electrical & Computer 297 157 198 4 656 118 18.0% 302 46.0% Management Sciences 33 31 131 1 196 63 32.1% 49 25.0% Mechanical & Mechatronics 118 115 57 2 292 51 17.5% 90 30.8% Systems Design 63 41 9 2 115 27 23.5% 52 45.2% TOTAL 725 609 483 12 1829 444 24.3% 682 37.3%
Total Graduate Enrolment (Head Count), Fall 2012
Department PhD Rsch
Master Prof
Master Non Deg Total
# Female
% Female
# Int’l
% Int’l
Architecture n/a 115 n/a 6 121 62 51.2% 10 8.3% Conrad n/a n/a 48 0 48 17 35.4% 21 43.8% Chemical 113 55 29 5 202 60 29.7% 109 54.0% Civil & Environmental 117 109 33 1 260 65 25.0% 100 38.5% Electrical & Computer 288 178 198 5 669 122 18.2% 323 48.3% Management Sciences 31 21 146 0 198 72 36.4% 72 36.4% Mechanical & Mechatronics 128 142 49 1 320 45 14.1% 106 33.1% Systems Design 67 40 17 3 127 26 20.5% 65 51.2% TOTAL 744 660 520 21 1945 469 24.1% 806 41.4%
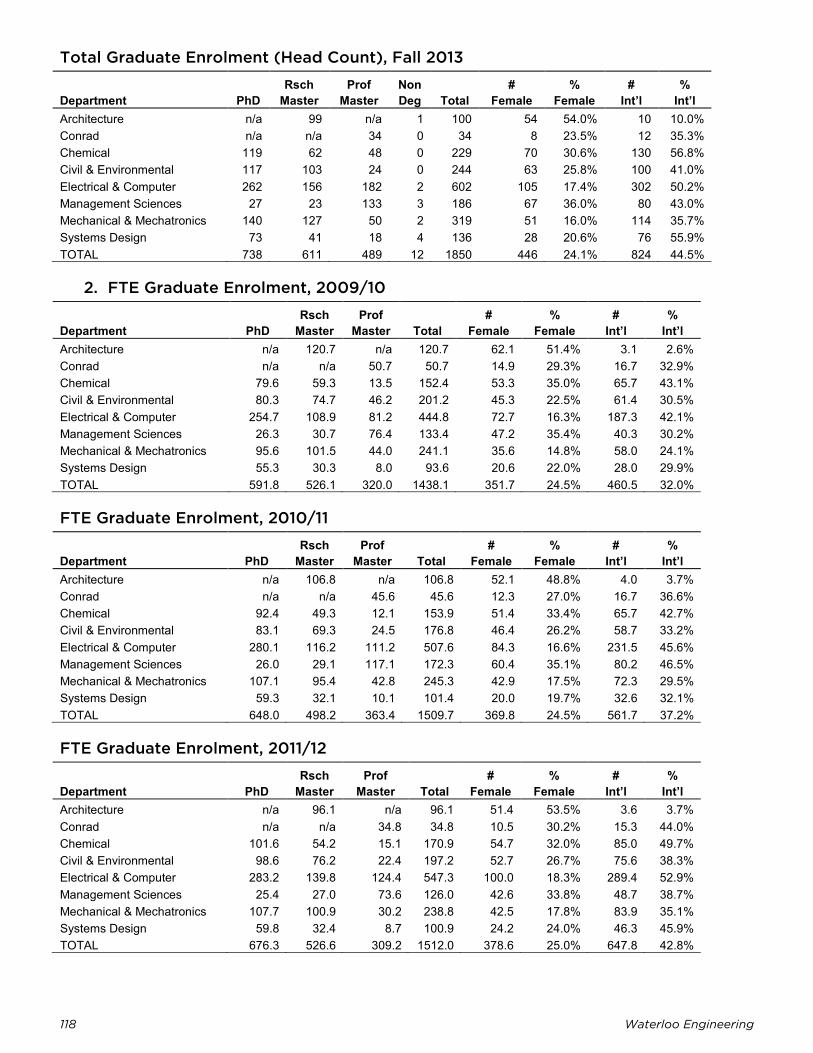
118 Waterloo Engineering
Total Graduate Enrolment (Head Count), Fall 2013
Department PhD Rsch
Master Prof
Master Non Deg Total
# Female
% Female
# Int’l
% Int’l
Architecture n/a 99 n/a 1 100 54 54.0% 10 10.0% Conrad n/a n/a 34 0 34 8 23.5% 12 35.3% Chemical 119 62 48 0 229 70 30.6% 130 56.8% Civil & Environmental 117 103 24 0 244 63 25.8% 100 41.0% Electrical & Computer 262 156 182 2 602 105 17.4% 302 50.2% Management Sciences 27 23 133 3 186 67 36.0% 80 43.0% Mechanical & Mechatronics 140 127 50 2 319 51 16.0% 114 35.7% Systems Design 73 41 18 4 136 28 20.6% 76 55.9% TOTAL 738 611 489 12 1850 446 24.1% 824 44.5%
2. FTE Graduate Enrolment, 2009/10
Department PhD Rsch
Master Prof
Master Total #
Female %
Female #
Int’l %
Int’l Architecture n/a 120.7 n/a 120.7 62.1 51.4% 3.1 2.6% Conrad n/a n/a 50.7 50.7 14.9 29.3% 16.7 32.9% Chemical 79.6 59.3 13.5 152.4 53.3 35.0% 65.7 43.1% Civil & Environmental 80.3 74.7 46.2 201.2 45.3 22.5% 61.4 30.5% Electrical & Computer 254.7 108.9 81.2 444.8 72.7 16.3% 187.3 42.1% Management Sciences 26.3 30.7 76.4 133.4 47.2 35.4% 40.3 30.2% Mechanical & Mechatronics 95.6 101.5 44.0 241.1 35.6 14.8% 58.0 24.1% Systems Design 55.3 30.3 8.0 93.6 20.6 22.0% 28.0 29.9% TOTAL 591.8 526.1 320.0 1438.1 351.7 24.5% 460.5 32.0%
FTE Graduate Enrolment, 2010/11
Department PhD Rsch
Master Prof
Master Total #
Female %
Female #
Int’l %
Int’l Architecture n/a 106.8 n/a 106.8 52.1 48.8% 4.0 3.7% Conrad n/a n/a 45.6 45.6 12.3 27.0% 16.7 36.6% Chemical 92.4 49.3 12.1 153.9 51.4 33.4% 65.7 42.7% Civil & Environmental 83.1 69.3 24.5 176.8 46.4 26.2% 58.7 33.2% Electrical & Computer 280.1 116.2 111.2 507.6 84.3 16.6% 231.5 45.6% Management Sciences 26.0 29.1 117.1 172.3 60.4 35.1% 80.2 46.5% Mechanical & Mechatronics 107.1 95.4 42.8 245.3 42.9 17.5% 72.3 29.5% Systems Design 59.3 32.1 10.1 101.4 20.0 19.7% 32.6 32.1% TOTAL 648.0 498.2 363.4 1509.7 369.8 24.5% 561.7 37.2%
FTE Graduate Enrolment, 2011/12
Department PhD Rsch
Master Prof
Master Total #
Female %
Female #
Int’l %
Int’l Architecture n/a 96.1 n/a 96.1 51.4 53.5% 3.6 3.7% Conrad n/a n/a 34.8 34.8 10.5 30.2% 15.3 44.0% Chemical 101.6 54.2 15.1 170.9 54.7 32.0% 85.0 49.7% Civil & Environmental 98.6 76.2 22.4 197.2 52.7 26.7% 75.6 38.3% Electrical & Computer 283.2 139.8 124.4 547.3 100.0 18.3% 289.4 52.9% Management Sciences 25.4 27.0 73.6 126.0 42.6 33.8% 48.7 38.7% Mechanical & Mechatronics 107.7 100.9 30.2 238.8 42.5 17.8% 83.9 35.1% Systems Design 59.8 32.4 8.7 100.9 24.2 24.0% 46.3 45.9% TOTAL 676.3 526.6 309.2 1512.0 378.6 25.0% 647.8 42.8%
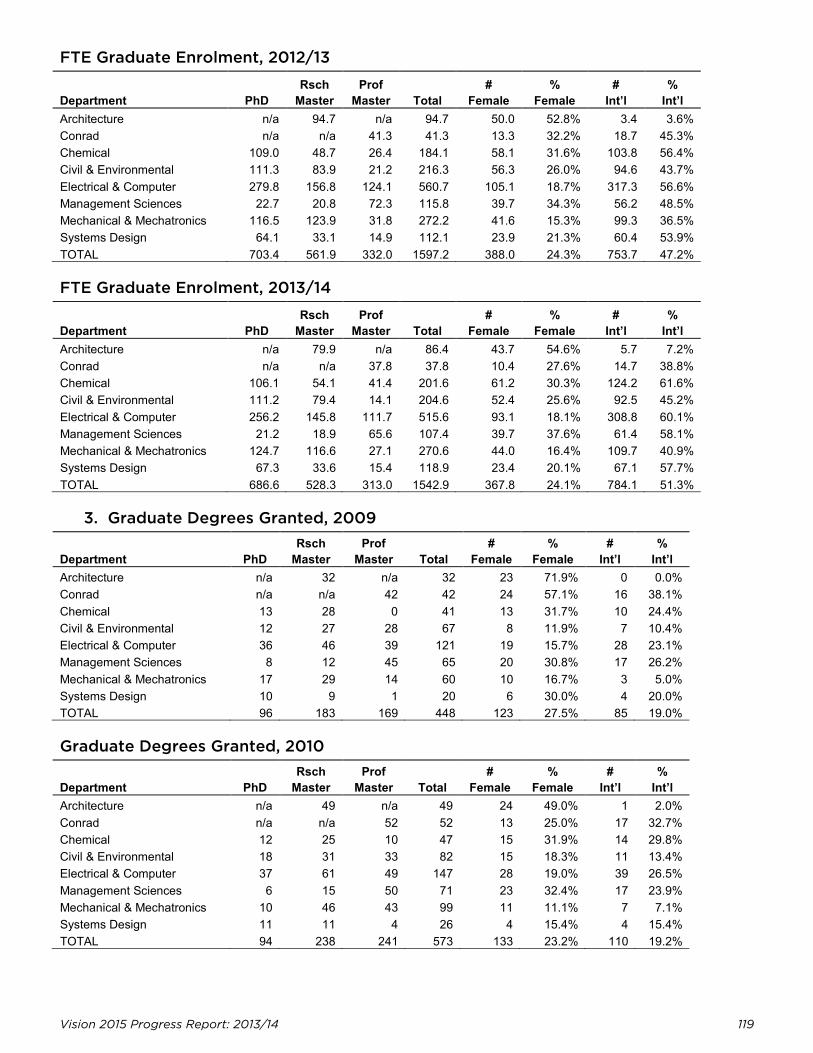
Vision 2015 Progress Report: 2013/14 119
FTE Graduate Enrolment, 2012/13
Department PhD Rsch
Master Prof
Master Total #
Female %
Female #
Int’l %
Int’l Architecture n/a 94.7 n/a 94.7 50.0 52.8% 3.4 3.6% Conrad n/a n/a 41.3 41.3 13.3 32.2% 18.7 45.3% Chemical 109.0 48.7 26.4 184.1 58.1 31.6% 103.8 56.4% Civil & Environmental 111.3 83.9 21.2 216.3 56.3 26.0% 94.6 43.7% Electrical & Computer 279.8 156.8 124.1 560.7 105.1 18.7% 317.3 56.6% Management Sciences 22.7 20.8 72.3 115.8 39.7 34.3% 56.2 48.5% Mechanical & Mechatronics 116.5 123.9 31.8 272.2 41.6 15.3% 99.3 36.5% Systems Design 64.1 33.1 14.9 112.1 23.9 21.3% 60.4 53.9% TOTAL 703.4 561.9 332.0 1597.2 388.0 24.3% 753.7 47.2%
FTE Graduate Enrolment, 2013/14
Department PhD Rsch
Master Prof
Master Total #
Female %
Female #
Int’l %
Int’l Architecture n/a 79.9 n/a 86.4 43.7 54.6% 5.7 7.2% Conrad n/a n/a 37.8 37.8 10.4 27.6% 14.7 38.8% Chemical 106.1 54.1 41.4 201.6 61.2 30.3% 124.2 61.6% Civil & Environmental 111.2 79.4 14.1 204.6 52.4 25.6% 92.5 45.2% Electrical & Computer 256.2 145.8 111.7 515.6 93.1 18.1% 308.8 60.1% Management Sciences 21.2 18.9 65.6 107.4 39.7 37.6% 61.4 58.1% Mechanical & Mechatronics 124.7 116.6 27.1 270.6 44.0 16.4% 109.7 40.9% Systems Design 67.3 33.6 15.4 118.9 23.4 20.1% 67.1 57.7% TOTAL 686.6 528.3 313.0 1542.9 367.8 24.1% 784.1 51.3%
3. Graduate Degrees Granted, 2009
Department PhD Rsch
Master Prof
Master Total #
Female %
Female #
Int’l %
Int’l Architecture n/a 32 n/a 32 23 71.9% 0 0.0% Conrad n/a n/a 42 42 24 57.1% 16 38.1% Chemical 13 28 0 41 13 31.7% 10 24.4% Civil & Environmental 12 27 28 67 8 11.9% 7 10.4% Electrical & Computer 36 46 39 121 19 15.7% 28 23.1% Management Sciences 8 12 45 65 20 30.8% 17 26.2% Mechanical & Mechatronics 17 29 14 60 10 16.7% 3 5.0% Systems Design 10 9 1 20 6 30.0% 4 20.0% TOTAL 96 183 169 448 123 27.5% 85 19.0%
Graduate Degrees Granted, 2010
Department PhD Rsch
Master Prof
Master Total #
Female %
Female #
Int’l %
Int’l Architecture n/a 49 n/a 49 24 49.0% 1 2.0% Conrad n/a n/a 52 52 13 25.0% 17 32.7% Chemical 12 25 10 47 15 31.9% 14 29.8% Civil & Environmental 18 31 33 82 15 18.3% 11 13.4% Electrical & Computer 37 61 49 147 28 19.0% 39 26.5% Management Sciences 6 15 50 71 23 32.4% 17 23.9% Mechanical & Mechatronics 10 46 43 99 11 11.1% 7 7.1% Systems Design 11 11 4 26 4 15.4% 4 15.4% TOTAL 94 238 241 573 133 23.2% 110 19.2%
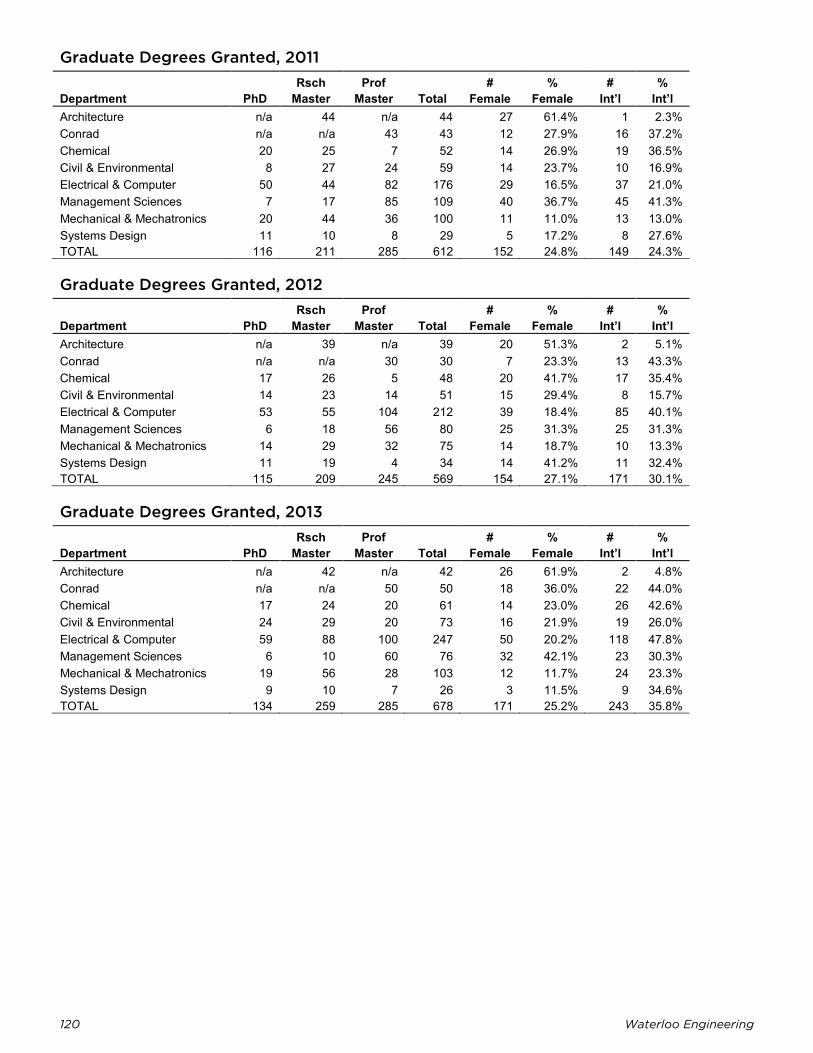
120 Waterloo Engineering
Graduate Degrees Granted, 2011
Department PhD Rsch
Master Prof
Master Total #
Female %
Female #
Int’l %
Int’l Architecture n/a 44 n/a 44 27 61.4% 1 2.3% Conrad n/a n/a 43 43 12 27.9% 16 37.2% Chemical 20 25 7 52 14 26.9% 19 36.5% Civil & Environmental 8 27 24 59 14 23.7% 10 16.9% Electrical & Computer 50 44 82 176 29 16.5% 37 21.0% Management Sciences 7 17 85 109 40 36.7% 45 41.3% Mechanical & Mechatronics 20 44 36 100 11 11.0% 13 13.0% Systems Design 11 10 8 29 5 17.2% 8 27.6% TOTAL 116 211 285 612 152 24.8% 149 24.3%
Graduate Degrees Granted, 2012
Department PhD Rsch
Master Prof
Master Total #
Female %
Female #
Int’l %
Int’l Architecture n/a 39 n/a 39 20 51.3% 2 5.1% Conrad n/a n/a 30 30 7 23.3% 13 43.3% Chemical 17 26 5 48 20 41.7% 17 35.4% Civil & Environmental 14 23 14 51 15 29.4% 8 15.7% Electrical & Computer 53 55 104 212 39 18.4% 85 40.1% Management Sciences 6 18 56 80 25 31.3% 25 31.3% Mechanical & Mechatronics 14 29 32 75 14 18.7% 10 13.3% Systems Design 11 19 4 34 14 41.2% 11 32.4% TOTAL 115 209 245 569 154 27.1% 171 30.1%
Graduate Degrees Granted, 2013
Department PhD Rsch
Master Prof
Master Total #
Female %
Female #
Int’l %
Int’l Architecture n/a 42 n/a 42 26 61.9% 2 4.8% Conrad n/a n/a 50 50 18 36.0% 22 44.0% Chemical 17 24 20 61 14 23.0% 26 42.6% Civil & Environmental 24 29 20 73 16 21.9% 19 26.0% Electrical & Computer 59 88 100 247 50 20.2% 118 47.8% Management Sciences 6 10 60 76 32 42.1% 23 30.3% Mechanical & Mechatronics 19 56 28 103 12 11.7% 24 23.3% Systems Design 9 10 7 26 3 11.5% 9 34.6% TOTAL 134 259 285 678 171 25.2% 243 35.8%
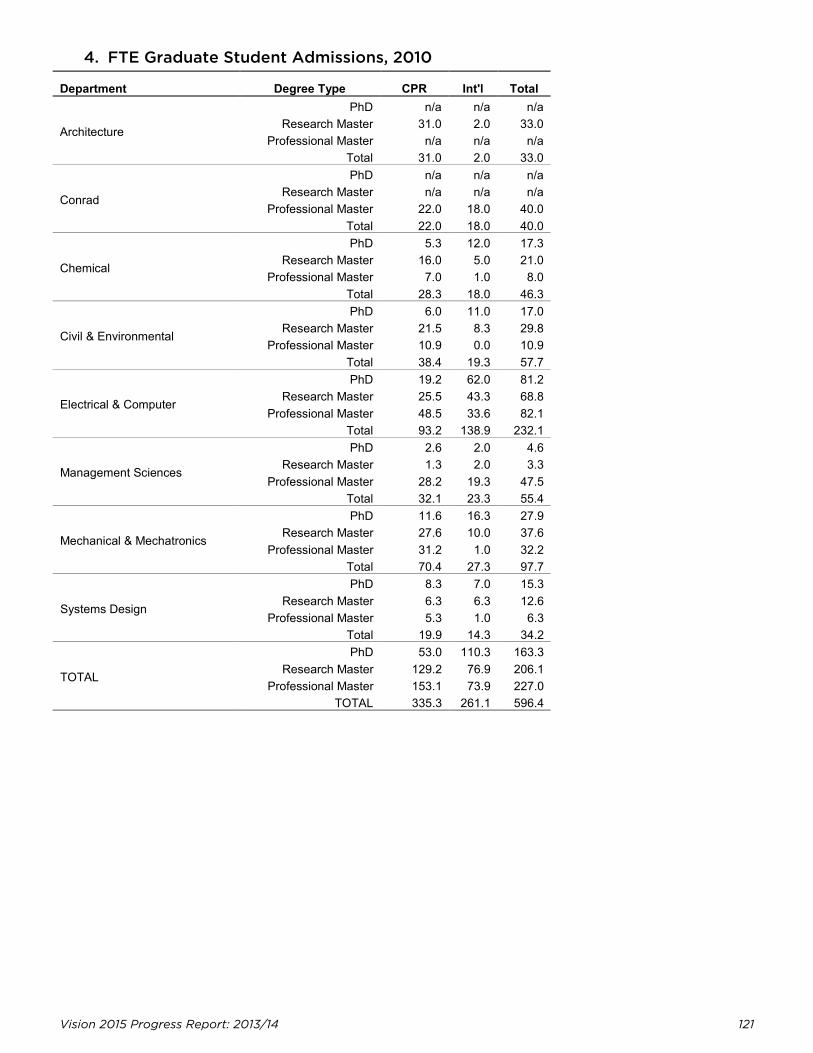
Vision 2015 Progress Report: 2013/14 121
4. FTE Graduate Student Admissions, 2010
Department Degree Type CPR Int'l Total
Architecture
PhD n/a n/a n/a Research Master 31.0 2.0 33.0
Professional Master n/a n/a n/a Total 31.0 2.0 33.0
Conrad
PhD n/a n/a n/a Research Master n/a n/a n/a
Professional Master 22.0 18.0 40.0 Total 22.0 18.0 40.0
Chemical
PhD 5.3 12.0 17.3 Research Master 16.0 5.0 21.0
Professional Master 7.0 1.0 8.0 Total 28.3 18.0 46.3
Civil & Environmental
PhD 6.0 11.0 17.0 Research Master 21.5 8.3 29.8
Professional Master 10.9 0.0 10.9 Total 38.4 19.3 57.7
Electrical & Computer
PhD 19.2 62.0 81.2 Research Master 25.5 43.3 68.8
Professional Master 48.5 33.6 82.1 Total 93.2 138.9 232.1
Management Sciences
PhD 2.6 2.0 4.6 Research Master 1.3 2.0 3.3
Professional Master 28.2 19.3 47.5 Total 32.1 23.3 55.4
Mechanical & Mechatronics
PhD 11.6 16.3 27.9 Research Master 27.6 10.0 37.6
Professional Master 31.2 1.0 32.2 Total 70.4 27.3 97.7
Systems Design
PhD 8.3 7.0 15.3 Research Master 6.3 6.3 12.6
Professional Master 5.3 1.0 6.3 Total 19.9 14.3 34.2
TOTAL
PhD 53.0 110.3 163.3 Research Master 129.2 76.9 206.1
Professional Master 153.1 73.9 227.0 TOTAL 335.3 261.1 596.4
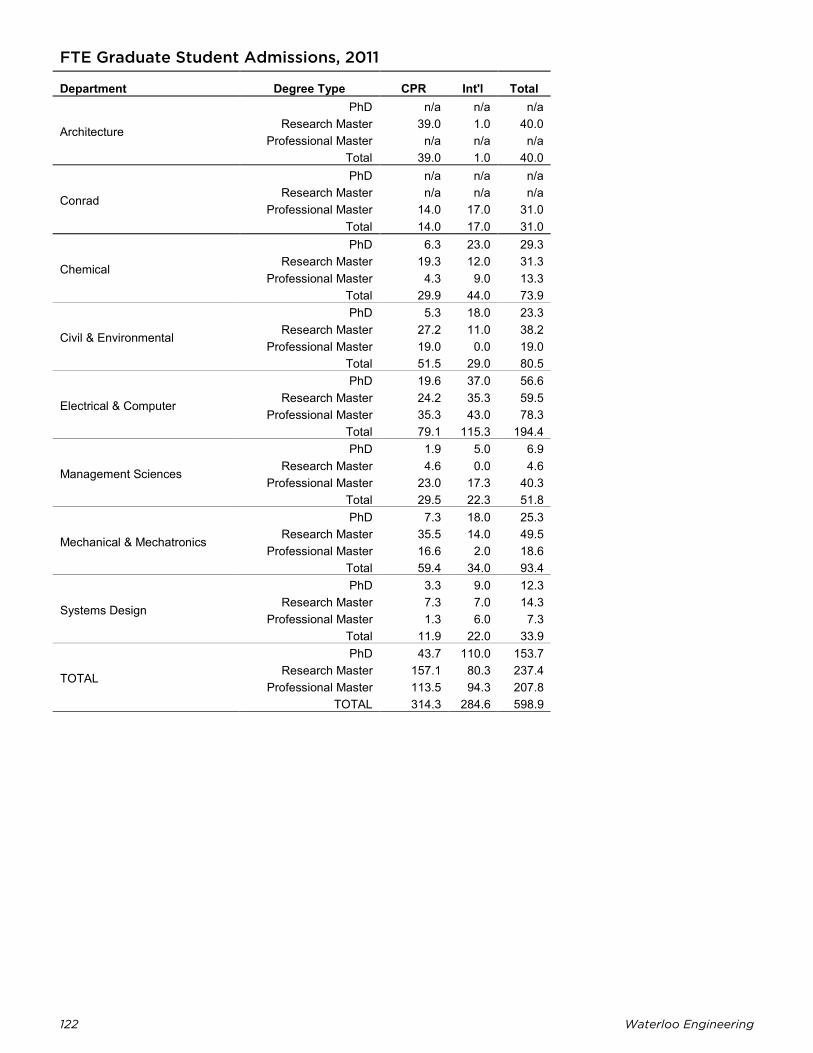
122 Waterloo Engineering
FTE Graduate Student Admissions, 2011
Department Degree Type CPR Int'l Total
Architecture
PhD n/a n/a n/a Research Master 39.0 1.0 40.0
Professional Master n/a n/a n/a Total 39.0 1.0 40.0
Conrad
PhD n/a n/a n/a Research Master n/a n/a n/a
Professional Master 14.0 17.0 31.0 Total 14.0 17.0 31.0
Chemical
PhD 6.3 23.0 29.3 Research Master 19.3 12.0 31.3
Professional Master 4.3 9.0 13.3 Total 29.9 44.0 73.9
Civil & Environmental
PhD 5.3 18.0 23.3 Research Master 27.2 11.0 38.2
Professional Master 19.0 0.0 19.0 Total 51.5 29.0 80.5
Electrical & Computer
PhD 19.6 37.0 56.6 Research Master 24.2 35.3 59.5
Professional Master 35.3 43.0 78.3 Total 79.1 115.3 194.4
Management Sciences
PhD 1.9 5.0 6.9 Research Master 4.6 0.0 4.6
Professional Master 23.0 17.3 40.3 Total 29.5 22.3 51.8
Mechanical & Mechatronics
PhD 7.3 18.0 25.3 Research Master 35.5 14.0 49.5
Professional Master 16.6 2.0 18.6 Total 59.4 34.0 93.4
Systems Design
PhD 3.3 9.0 12.3 Research Master 7.3 7.0 14.3
Professional Master 1.3 6.0 7.3 Total 11.9 22.0 33.9
TOTAL
PhD 43.7 110.0 153.7 Research Master 157.1 80.3 237.4
Professional Master 113.5 94.3 207.8 TOTAL 314.3 284.6 598.9
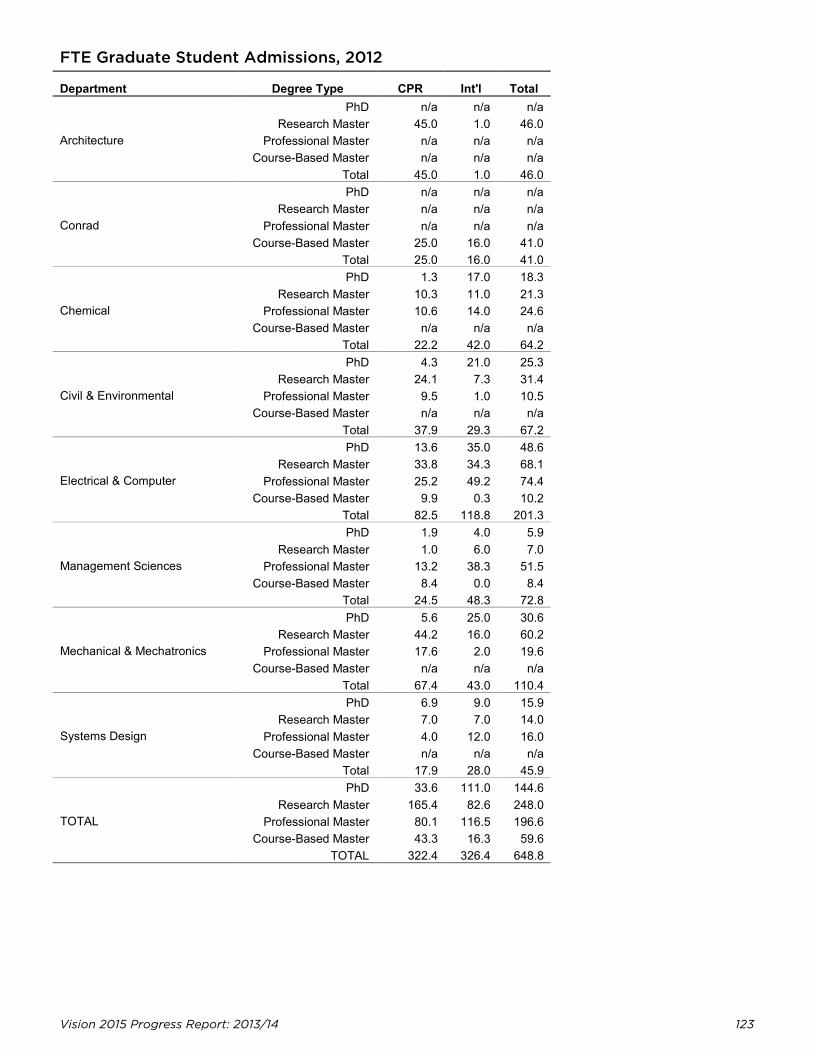
Vision 2015 Progress Report: 2013/14 123
FTE Graduate Student Admissions, 2012
Department Degree Type CPR Int'l Total
Architecture
PhD n/a n/a n/a Research Master 45.0 1.0 46.0
Professional Master n/a n/a n/a Course-Based Master n/a n/a n/a
Total 45.0 1.0 46.0
Conrad
PhD n/a n/a n/a Research Master n/a n/a n/a
Professional Master n/a n/a n/a Course-Based Master 25.0 16.0 41.0
Total 25.0 16.0 41.0
Chemical
PhD 1.3 17.0 18.3 Research Master 10.3 11.0 21.3
Professional Master 10.6 14.0 24.6 Course-Based Master n/a n/a n/a
Total 22.2 42.0 64.2
Civil & Environmental
PhD 4.3 21.0 25.3 Research Master 24.1 7.3 31.4
Professional Master 9.5 1.0 10.5 Course-Based Master n/a n/a n/a
Total 37.9 29.3 67.2
Electrical & Computer
PhD 13.6 35.0 48.6 Research Master 33.8 34.3 68.1
Professional Master 25.2 49.2 74.4 Course-Based Master 9.9 0.3 10.2
Total 82.5 118.8 201.3
Management Sciences
PhD 1.9 4.0 5.9 Research Master 1.0 6.0 7.0
Professional Master 13.2 38.3 51.5 Course-Based Master 8.4 0.0 8.4
Total 24.5 48.3 72.8
Mechanical & Mechatronics
PhD 5.6 25.0 30.6 Research Master 44.2 16.0 60.2
Professional Master 17.6 2.0 19.6 Course-Based Master n/a n/a n/a
Total 67.4 43.0 110.4
Systems Design
PhD 6.9 9.0 15.9 Research Master 7.0 7.0 14.0
Professional Master 4.0 12.0 16.0 Course-Based Master n/a n/a n/a
Total 17.9 28.0 45.9
TOTAL
PhD 33.6 111.0 144.6 Research Master 165.4 82.6 248.0
Professional Master 80.1 116.5 196.6 Course-Based Master 43.3 16.3 59.6
TOTAL 322.4 326.4 648.8
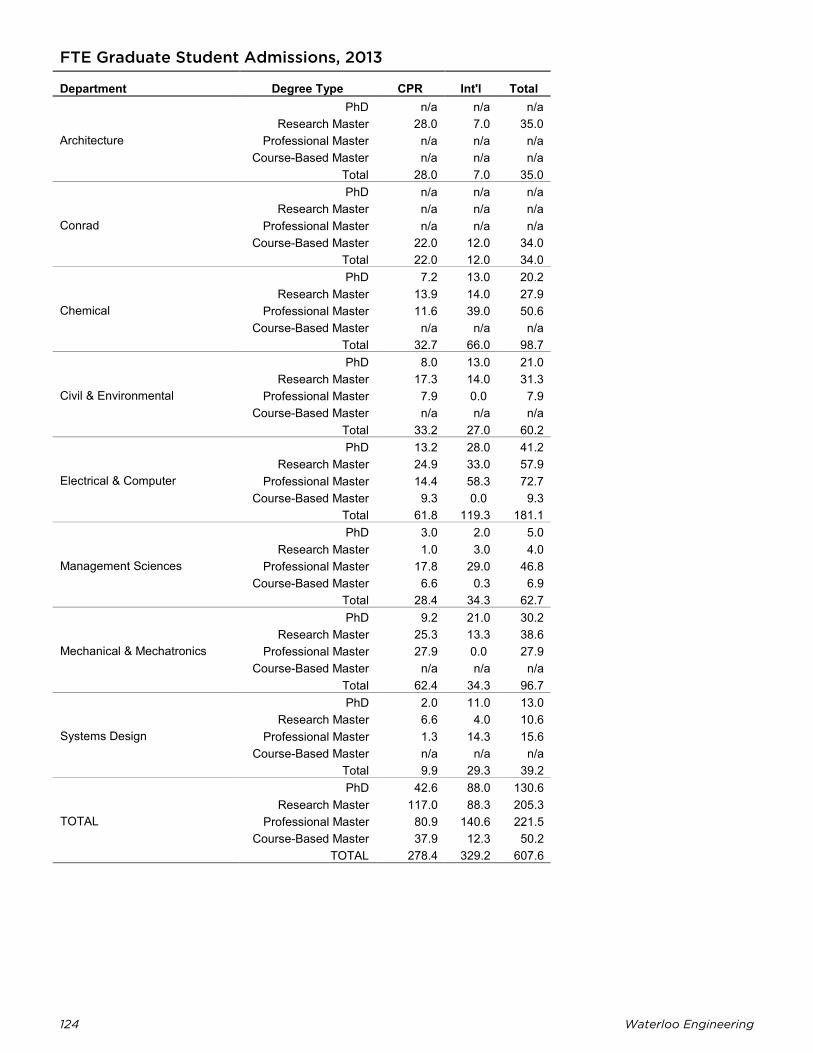
124 Waterloo Engineering
FTE Graduate Student Admissions, 2013
Department Degree Type CPR Int'l Total
Architecture
PhD n/a n/a n/a Research Master 28.0 7.0 35.0
Professional Master n/a n/a n/a Course-Based Master n/a n/a n/a
Total 28.0 7.0 35.0
Conrad
PhD n/a n/a n/a Research Master n/a n/a n/a
Professional Master n/a n/a n/a Course-Based Master 22.0 12.0 34.0
Total 22.0 12.0 34.0
Chemical
PhD 7.2 13.0 20.2 Research Master 13.9 14.0 27.9
Professional Master 11.6 39.0 50.6 Course-Based Master n/a n/a n/a
Total 32.7 66.0 98.7
Civil & Environmental
PhD 8.0 13.0 21.0 Research Master 17.3 14.0 31.3
Professional Master 7.9 0.0 7.9 Course-Based Master n/a n/a n/a
Total 33.2 27.0 60.2
Electrical & Computer
PhD 13.2 28.0 41.2 Research Master 24.9 33.0 57.9
Professional Master 14.4 58.3 72.7 Course-Based Master 9.3 0.0 9.3
Total 61.8 119.3 181.1
Management Sciences
PhD 3.0 2.0 5.0 Research Master 1.0 3.0 4.0
Professional Master 17.8 29.0 46.8 Course-Based Master 6.6 0.3 6.9
Total 28.4 34.3 62.7
Mechanical & Mechatronics
PhD 9.2 21.0 30.2 Research Master 25.3 13.3 38.6
Professional Master 27.9 0.0 27.9 Course-Based Master n/a n/a n/a
Total 62.4 34.3 96.7
Systems Design
PhD 2.0 11.0 13.0 Research Master 6.6 4.0 10.6
Professional Master 1.3 14.3 15.6 Course-Based Master n/a n/a n/a
Total 9.9 29.3 39.2
TOTAL
PhD 42.6 88.0 130.6 Research Master 117.0 88.3 205.3
Professional Master 80.9 140.6 221.5 Course-Based Master 37.9 12.3 50.2
TOTAL 278.4 329.2 607.6
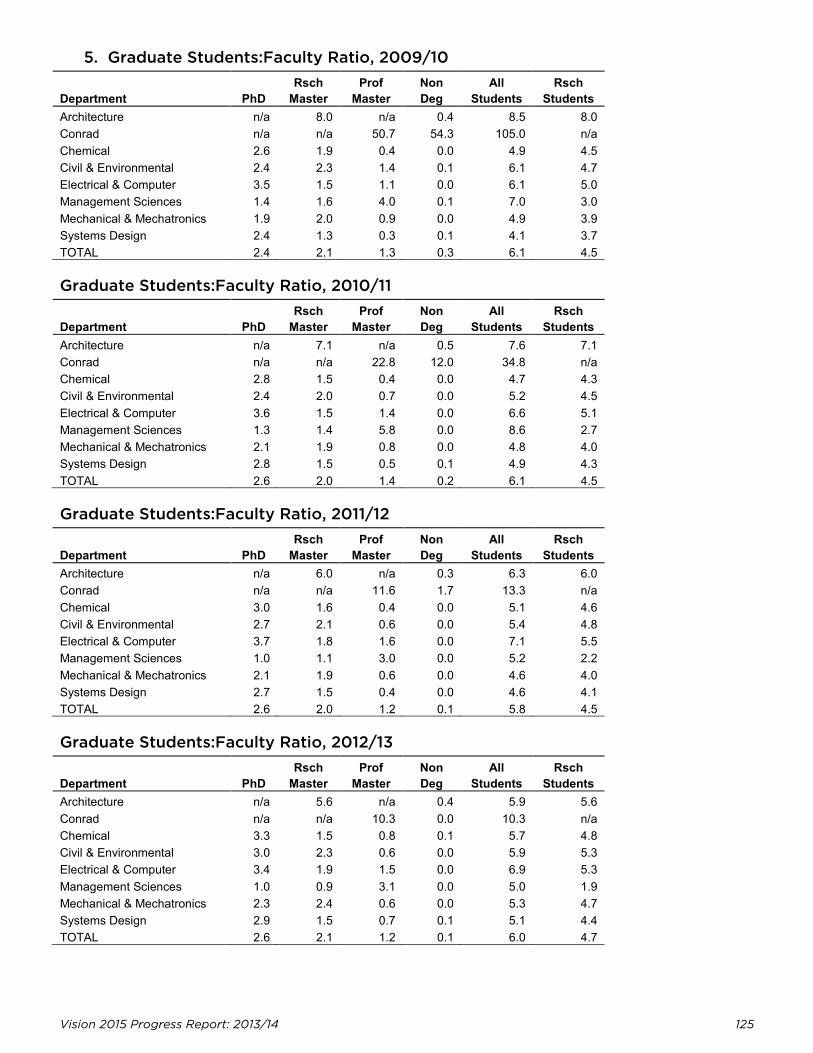
Vision 2015 Progress Report: 2013/14 125
5. Graduate Students:Faculty Ratio, 2009/10
Department PhD Rsch
Master Prof
Master Non Deg
All Students
Rsch Students
Architecture n/a 8.0 n/a 0.4 8.5 8.0 Conrad n/a n/a 50.7 54.3 105.0 n/a Chemical 2.6 1.9 0.4 0.0 4.9 4.5 Civil & Environmental 2.4 2.3 1.4 0.1 6.1 4.7 Electrical & Computer 3.5 1.5 1.1 0.0 6.1 5.0 Management Sciences 1.4 1.6 4.0 0.1 7.0 3.0 Mechanical & Mechatronics 1.9 2.0 0.9 0.0 4.9 3.9 Systems Design 2.4 1.3 0.3 0.1 4.1 3.7 TOTAL 2.4 2.1 1.3 0.3 6.1 4.5
Graduate Students:Faculty Ratio, 2010/11
Department PhD Rsch
Master Prof
Master Non Deg
All Students
Rsch Students
Architecture n/a 7.1 n/a 0.5 7.6 7.1 Conrad n/a n/a 22.8 12.0 34.8 n/a Chemical 2.8 1.5 0.4 0.0 4.7 4.3 Civil & Environmental 2.4 2.0 0.7 0.0 5.2 4.5 Electrical & Computer 3.6 1.5 1.4 0.0 6.6 5.1 Management Sciences 1.3 1.4 5.8 0.0 8.6 2.7 Mechanical & Mechatronics 2.1 1.9 0.8 0.0 4.8 4.0 Systems Design 2.8 1.5 0.5 0.1 4.9 4.3 TOTAL 2.6 2.0 1.4 0.2 6.1 4.5
Graduate Students:Faculty Ratio, 2011/12
Department PhD Rsch
Master Prof
Master Non Deg
All Students
Rsch Students
Architecture n/a 6.0 n/a 0.3 6.3 6.0 Conrad n/a n/a 11.6 1.7 13.3 n/a Chemical 3.0 1.6 0.4 0.0 5.1 4.6 Civil & Environmental 2.7 2.1 0.6 0.0 5.4 4.8 Electrical & Computer 3.7 1.8 1.6 0.0 7.1 5.5 Management Sciences 1.0 1.1 3.0 0.0 5.2 2.2 Mechanical & Mechatronics 2.1 1.9 0.6 0.0 4.6 4.0 Systems Design 2.7 1.5 0.4 0.0 4.6 4.1 TOTAL 2.6 2.0 1.2 0.1 5.8 4.5
Graduate Students:Faculty Ratio, 2012/13
Department PhD Rsch
Master Prof
Master Non Deg
All Students
Rsch Students
Architecture n/a 5.6 n/a 0.4 5.9 5.6 Conrad n/a n/a 10.3 0.0 10.3 n/a Chemical 3.3 1.5 0.8 0.1 5.7 4.8 Civil & Environmental 3.0 2.3 0.6 0.0 5.9 5.3 Electrical & Computer 3.4 1.9 1.5 0.0 6.9 5.3 Management Sciences 1.0 0.9 3.1 0.0 5.0 1.9 Mechanical & Mechatronics 2.3 2.4 0.6 0.0 5.3 4.7 Systems Design 2.9 1.5 0.7 0.1 5.1 4.4 TOTAL 2.6 2.1 1.2 0.1 6.0 4.7
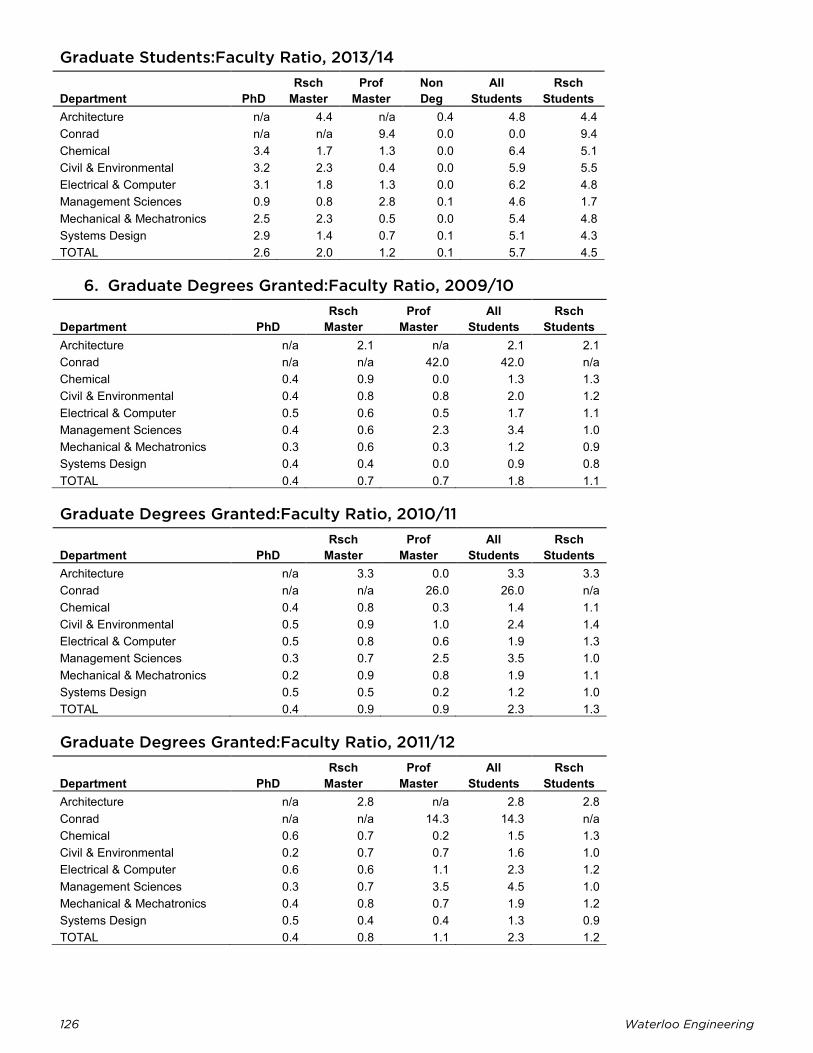
126 Waterloo Engineering
Graduate Students:Faculty Ratio, 2013/14
Department PhD Rsch
Master Prof
Master Non Deg
All Students
Rsch Students
Architecture n/a 4.4 n/a 0.4 4.8 4.4 Conrad n/a n/a 9.4 0.0 0.0 9.4 Chemical 3.4 1.7 1.3 0.0 6.4 5.1 Civil & Environmental 3.2 2.3 0.4 0.0 5.9 5.5 Electrical & Computer 3.1 1.8 1.3 0.0 6.2 4.8 Management Sciences 0.9 0.8 2.8 0.1 4.6 1.7 Mechanical & Mechatronics 2.5 2.3 0.5 0.0 5.4 4.8 Systems Design 2.9 1.4 0.7 0.1 5.1 4.3 TOTAL 2.6 2.0 1.2 0.1 5.7 4.5
6. Graduate Degrees Granted:Faculty Ratio, 2009/10
Department PhD Rsch
Master Prof
Master All
Students Rsch
Students Architecture n/a 2.1 n/a 2.1 2.1 Conrad n/a n/a 42.0 42.0 n/a Chemical 0.4 0.9 0.0 1.3 1.3 Civil & Environmental 0.4 0.8 0.8 2.0 1.2 Electrical & Computer 0.5 0.6 0.5 1.7 1.1 Management Sciences 0.4 0.6 2.3 3.4 1.0 Mechanical & Mechatronics 0.3 0.6 0.3 1.2 0.9 Systems Design 0.4 0.4 0.0 0.9 0.8 TOTAL 0.4 0.7 0.7 1.8 1.1
Graduate Degrees Granted:Faculty Ratio, 2010/11
Department PhD Rsch
Master Prof
Master All
Students Rsch
Students Architecture n/a 3.3 0.0 3.3 3.3 Conrad n/a n/a 26.0 26.0 n/a Chemical 0.4 0.8 0.3 1.4 1.1 Civil & Environmental 0.5 0.9 1.0 2.4 1.4 Electrical & Computer 0.5 0.8 0.6 1.9 1.3 Management Sciences 0.3 0.7 2.5 3.5 1.0 Mechanical & Mechatronics 0.2 0.9 0.8 1.9 1.1 Systems Design 0.5 0.5 0.2 1.2 1.0 TOTAL 0.4 0.9 0.9 2.3 1.3
Graduate Degrees Granted:Faculty Ratio, 2011/12
Department PhD Rsch
Master Prof
Master All
Students Rsch
Students Architecture n/a 2.8 n/a 2.8 2.8 Conrad n/a n/a 14.3 14.3 n/a Chemical 0.6 0.7 0.2 1.5 1.3 Civil & Environmental 0.2 0.7 0.7 1.6 1.0 Electrical & Computer 0.6 0.6 1.1 2.3 1.2 Management Sciences 0.3 0.7 3.5 4.5 1.0 Mechanical & Mechatronics 0.4 0.8 0.7 1.9 1.2 Systems Design 0.5 0.4 0.4 1.3 0.9 TOTAL 0.4 0.8 1.1 2.3 1.2
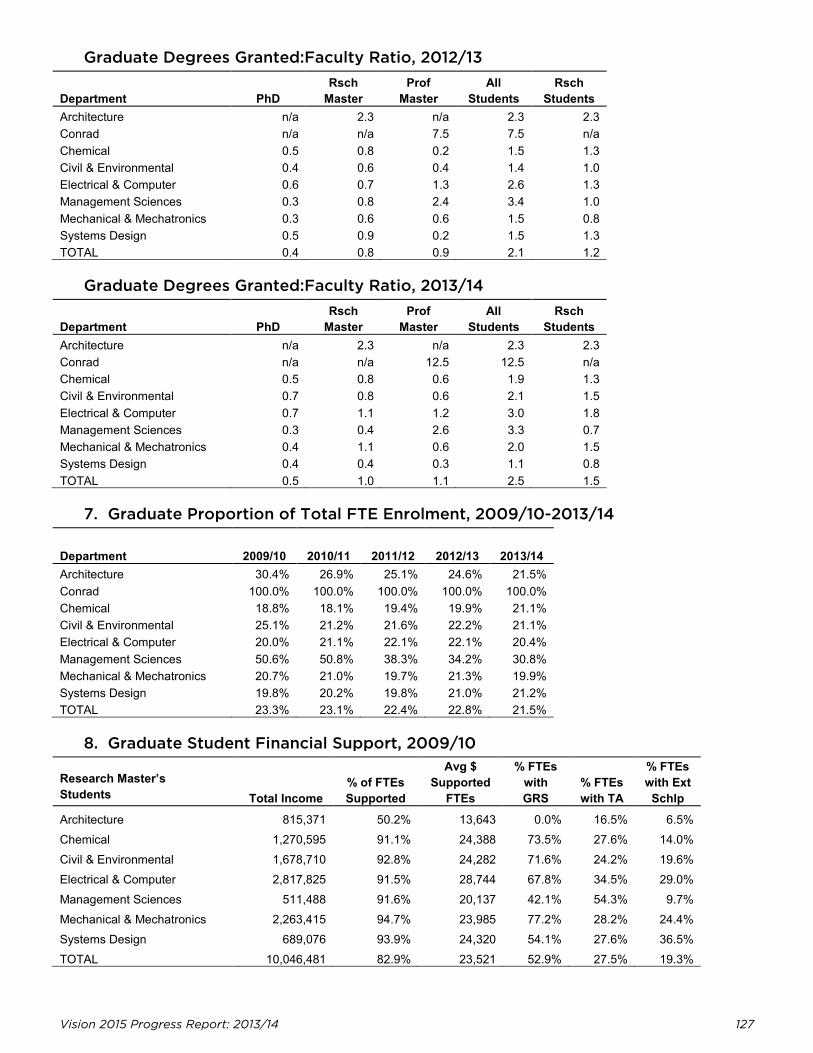
Vision 2015 Progress Report: 2013/14 127
Graduate Degrees Granted:Faculty Ratio, 2012/13
Department PhD Rsch
Master Prof
Master All
Students Rsch
Students Architecture n/a 2.3 n/a 2.3 2.3 Conrad n/a n/a 7.5 7.5 n/a Chemical 0.5 0.8 0.2 1.5 1.3 Civil & Environmental 0.4 0.6 0.4 1.4 1.0 Electrical & Computer 0.6 0.7 1.3 2.6 1.3 Management Sciences 0.3 0.8 2.4 3.4 1.0 Mechanical & Mechatronics 0.3 0.6 0.6 1.5 0.8 Systems Design 0.5 0.9 0.2 1.5 1.3 TOTAL 0.4 0.8 0.9 2.1 1.2
Graduate Degrees Granted:Faculty Ratio, 2013/14
Department PhD Rsch
Master Prof
Master All
Students Rsch
Students Architecture n/a 2.3 n/a 2.3 2.3 Conrad n/a n/a 12.5 12.5 n/a Chemical 0.5 0.8 0.6 1.9 1.3 Civil & Environmental 0.7 0.8 0.6 2.1 1.5 Electrical & Computer 0.7 1.1 1.2 3.0 1.8 Management Sciences 0.3 0.4 2.6 3.3 0.7 Mechanical & Mechatronics 0.4 1.1 0.6 2.0 1.5 Systems Design 0.4 0.4 0.3 1.1 0.8 TOTAL 0.5 1.0 1.1 2.5 1.5
7. Graduate Proportion of Total FTE Enrolment, 2009/10-2013/14
Department 2009/10 2010/11 2011/12 2012/13 2013/14 Architecture 30.4% 26.9% 25.1% 24.6% 21.5% Conrad 100.0% 100.0% 100.0% 100.0% 100.0% Chemical 18.8% 18.1% 19.4% 19.9% 21.1% Civil & Environmental 25.1% 21.2% 21.6% 22.2% 21.1% Electrical & Computer 20.0% 21.1% 22.1% 22.1% 20.4% Management Sciences 50.6% 50.8% 38.3% 34.2% 30.8% Mechanical & Mechatronics 20.7% 21.0% 19.7% 21.3% 19.9% Systems Design 19.8% 20.2% 19.8% 21.0% 21.2% TOTAL 23.3% 23.1% 22.4% 22.8% 21.5%
8. Graduate Student Financial Support, 2009/10
Research Master’s Students Total Income
% of FTEs Supported
Avg $ Supported
FTEs
% FTEs with GRS
% FTEs with TA
% FTEs with Ext
Schlp Architecture 815,371 50.2% 13,643 0.0% 16.5% 6.5% Chemical 1,270,595 91.1% 24,388 73.5% 27.6% 14.0% Civil & Environmental 1,678,710 92.8% 24,282 71.6% 24.2% 19.6% Electrical & Computer 2,817,825 91.5% 28,744 67.8% 34.5% 29.0% Management Sciences 511,488 91.6% 20,137 42.1% 54.3% 9.7% Mechanical & Mechatronics 2,263,415 94.7% 23,985 77.2% 28.2% 24.4% Systems Design 689,076 93.9% 24,320 54.1% 27.6% 36.5% TOTAL 10,046,481 82.9% 23,521 52.9% 27.5% 19.3%
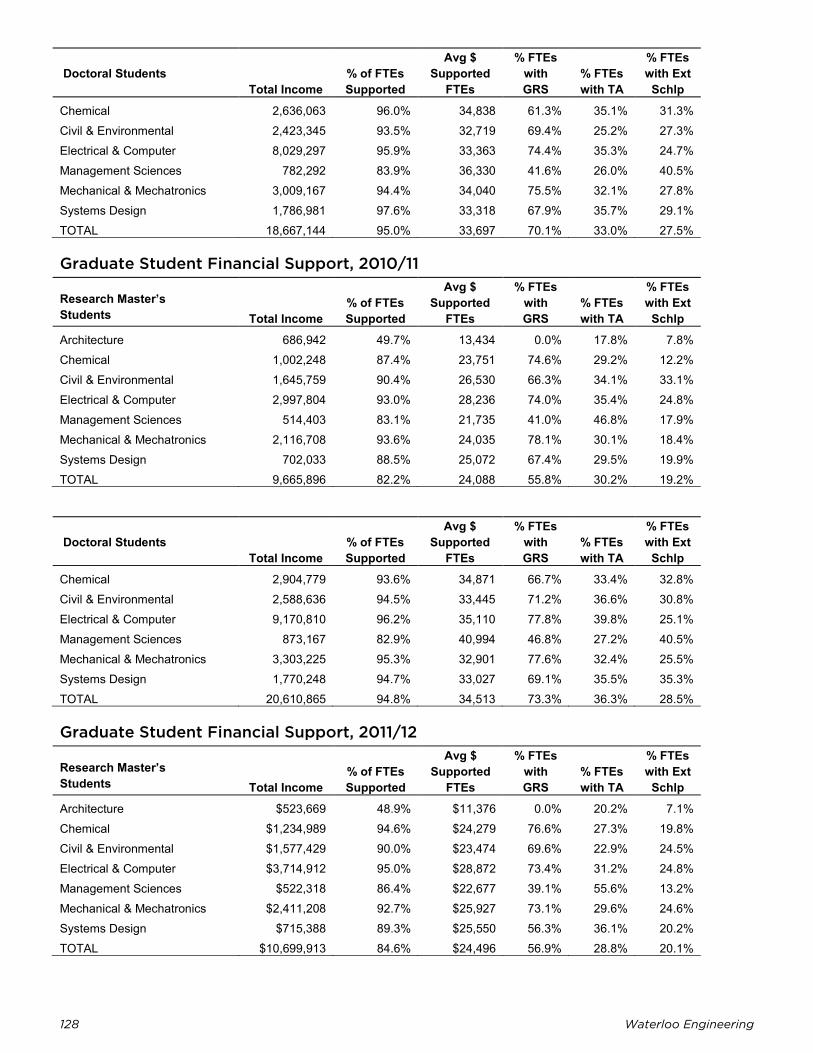
128 Waterloo Engineering
Doctoral Students Total Income
% of FTEs Supported
Avg $ Supported
FTEs
% FTEs with GRS
% FTEs with TA
% FTEs with Ext
Schlp Chemical 2,636,063 96.0% 34,838 61.3% 35.1% 31.3% Civil & Environmental 2,423,345 93.5% 32,719 69.4% 25.2% 27.3% Electrical & Computer 8,029,297 95.9% 33,363 74.4% 35.3% 24.7% Management Sciences 782,292 83.9% 36,330 41.6% 26.0% 40.5% Mechanical & Mechatronics 3,009,167 94.4% 34,040 75.5% 32.1% 27.8% Systems Design 1,786,981 97.6% 33,318 67.9% 35.7% 29.1% TOTAL 18,667,144 95.0% 33,697 70.1% 33.0% 27.5%
Graduate Student Financial Support, 2010/11
Research Master’s Students Total Income
% of FTEs Supported
Avg $ Supported
FTEs
% FTEs with GRS
% FTEs with TA
% FTEs with Ext
Schlp Architecture 686,942 49.7% 13,434 0.0% 17.8% 7.8% Chemical 1,002,248 87.4% 23,751 74.6% 29.2% 12.2% Civil & Environmental 1,645,759 90.4% 26,530 66.3% 34.1% 33.1% Electrical & Computer 2,997,804 93.0% 28,236 74.0% 35.4% 24.8% Management Sciences 514,403 83.1% 21,735 41.0% 46.8% 17.9% Mechanical & Mechatronics 2,116,708 93.6% 24,035 78.1% 30.1% 18.4% Systems Design 702,033 88.5% 25,072 67.4% 29.5% 19.9% TOTAL 9,665,896 82.2% 24,088 55.8% 30.2% 19.2%
Doctoral Students Total Income
% of FTEs Supported
Avg $ Supported
FTEs
% FTEs with GRS
% FTEs with TA
% FTEs with Ext
Schlp Chemical 2,904,779 93.6% 34,871 66.7% 33.4% 32.8% Civil & Environmental 2,588,636 94.5% 33,445 71.2% 36.6% 30.8% Electrical & Computer 9,170,810 96.2% 35,110 77.8% 39.8% 25.1% Management Sciences 873,167 82.9% 40,994 46.8% 27.2% 40.5% Mechanical & Mechatronics 3,303,225 95.3% 32,901 77.6% 32.4% 25.5% Systems Design 1,770,248 94.7% 33,027 69.1% 35.5% 35.3% TOTAL 20,610,865 94.8% 34,513 73.3% 36.3% 28.5%
Graduate Student Financial Support, 2011/12
Research Master’s Students Total Income
% of FTEs Supported
Avg $ Supported
FTEs
% FTEs with GRS
% FTEs with TA
% FTEs with Ext
Schlp Architecture $523,669 48.9% $11,376 0.0% 20.2% 7.1% Chemical $1,234,989 94.6% $24,279 76.6% 27.3% 19.8% Civil & Environmental $1,577,429 90.0% $23,474 69.6% 22.9% 24.5% Electrical & Computer $3,714,912 95.0% $28,872 73.4% 31.2% 24.8% Management Sciences $522,318 86.4% $22,677 39.1% 55.6% 13.2% Mechanical & Mechatronics $2,411,208 92.7% $25,927 73.1% 29.6% 24.6% Systems Design $715,388 89.3% $25,550 56.3% 36.1% 20.2% TOTAL $10,699,913 84.6% $24,496 56.9% 28.8% 20.1%
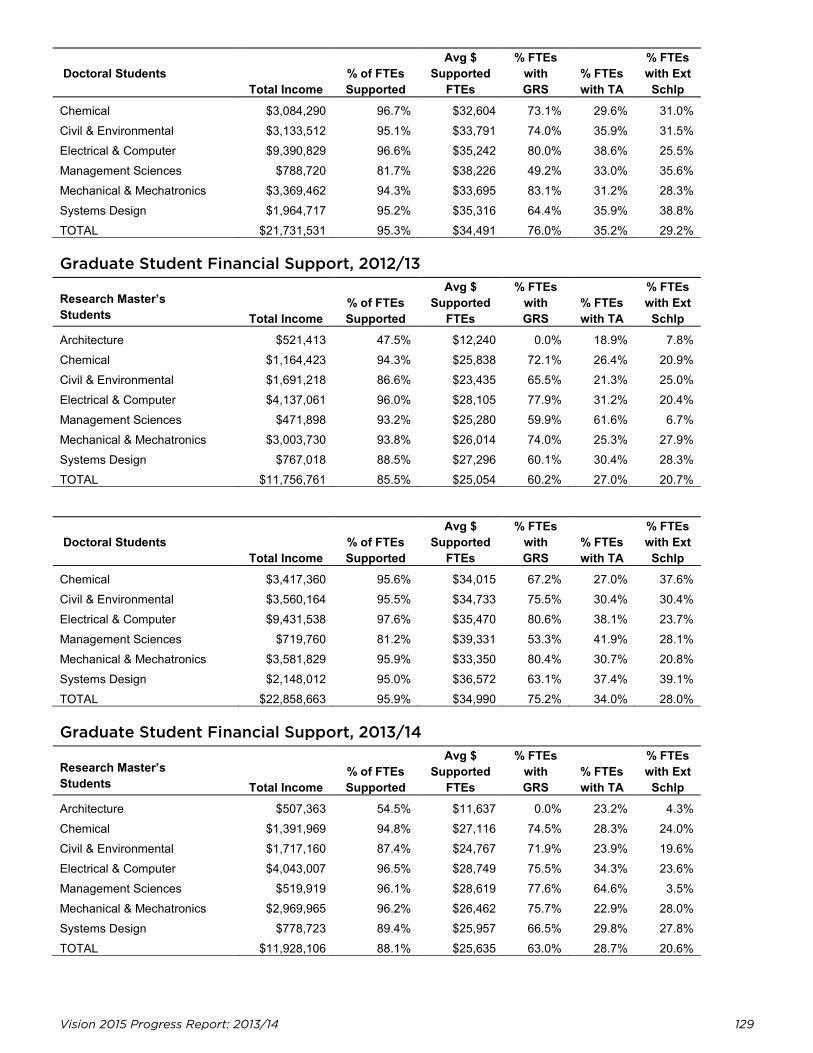
Vision 2015 Progress Report: 2013/14 129
Doctoral Students Total Income
% of FTEs Supported
Avg $ Supported
FTEs
% FTEs with GRS
% FTEs with TA
% FTEs with Ext
Schlp Chemical $3,084,290 96.7% $32,604 73.1% 29.6% 31.0% Civil & Environmental $3,133,512 95.1% $33,791 74.0% 35.9% 31.5% Electrical & Computer $9,390,829 96.6% $35,242 80.0% 38.6% 25.5% Management Sciences $788,720 81.7% $38,226 49.2% 33.0% 35.6% Mechanical & Mechatronics $3,369,462 94.3% $33,695 83.1% 31.2% 28.3% Systems Design $1,964,717 95.2% $35,316 64.4% 35.9% 38.8% TOTAL $21,731,531 95.3% $34,491 76.0% 35.2% 29.2%
Graduate Student Financial Support, 2012/13
Research Master’s Students Total Income
% of FTEs Supported
Avg $ Supported
FTEs
% FTEs with GRS
% FTEs with TA
% FTEs with Ext
Schlp Architecture $521,413 47.5% $12,240 0.0% 18.9% 7.8% Chemical $1,164,423 94.3% $25,838 72.1% 26.4% 20.9% Civil & Environmental $1,691,218 86.6% $23,435 65.5% 21.3% 25.0% Electrical & Computer $4,137,061 96.0% $28,105 77.9% 31.2% 20.4% Management Sciences $471,898 93.2% $25,280 59.9% 61.6% 6.7% Mechanical & Mechatronics $3,003,730 93.8% $26,014 74.0% 25.3% 27.9% Systems Design $767,018 88.5% $27,296 60.1% 30.4% 28.3% TOTAL $11,756,761 85.5% $25,054 60.2% 27.0% 20.7%
Doctoral Students Total Income
% of FTEs Supported
Avg $ Supported
FTEs
% FTEs with GRS
% FTEs with TA
% FTEs with Ext
Schlp Chemical $3,417,360 95.6% $34,015 67.2% 27.0% 37.6% Civil & Environmental $3,560,164 95.5% $34,733 75.5% 30.4% 30.4% Electrical & Computer $9,431,538 97.6% $35,470 80.6% 38.1% 23.7% Management Sciences $719,760 81.2% $39,331 53.3% 41.9% 28.1% Mechanical & Mechatronics $3,581,829 95.9% $33,350 80.4% 30.7% 20.8% Systems Design $2,148,012 95.0% $36,572 63.1% 37.4% 39.1% TOTAL $22,858,663 95.9% $34,990 75.2% 34.0% 28.0%
Graduate Student Financial Support, 2013/14
Research Master’s Students Total Income
% of FTEs Supported
Avg $ Supported
FTEs
% FTEs with GRS
% FTEs with TA
% FTEs with Ext
Schlp Architecture $507,363 54.5% $11,637 0.0% 23.2% 4.3% Chemical $1,391,969 94.8% $27,116 74.5% 28.3% 24.0% Civil & Environmental $1,717,160 87.4% $24,767 71.9% 23.9% 19.6% Electrical & Computer $4,043,007 96.5% $28,749 75.5% 34.3% 23.6% Management Sciences $519,919 96.1% $28,619 77.6% 64.6% 3.5% Mechanical & Mechatronics $2,969,965 96.2% $26,462 75.7% 22.9% 28.0% Systems Design $778,723 89.4% $25,957 66.5% 29.8% 27.8% TOTAL $11,928,106 88.1% $25,635 63.0% 28.7% 20.6%
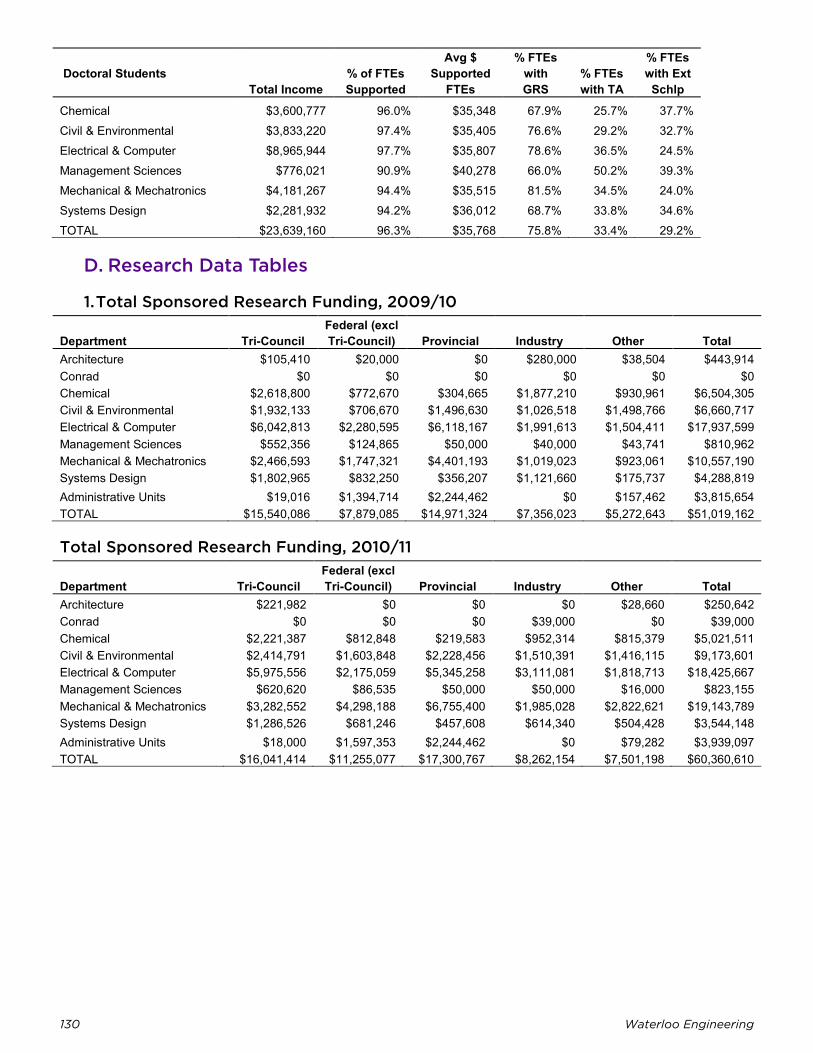
130 Waterloo Engineering
Doctoral Students Total Income
% of FTEs Supported
Avg $ Supported
FTEs
% FTEs with GRS
% FTEs with TA
% FTEs with Ext
Schlp Chemical $3,600,777 96.0% $35,348 67.9% 25.7% 37.7% Civil & Environmental $3,833,220 97.4% $35,405 76.6% 29.2% 32.7% Electrical & Computer $8,965,944 97.7% $35,807 78.6% 36.5% 24.5% Management Sciences $776,021 90.9% $40,278 66.0% 50.2% 39.3% Mechanical & Mechatronics $4,181,267 94.4% $35,515 81.5% 34.5% 24.0% Systems Design $2,281,932 94.2% $36,012 68.7% 33.8% 34.6% TOTAL $23,639,160 96.3% $35,768 75.8% 33.4% 29.2%
D. Research Data Tables
1. Total Sponsored Research Funding, 2009/10
Department Tri-Council Federal (excl Tri-Council) Provincial Industry Other Total
Architecture $105,410 $20,000 $0 $280,000 $38,504 $443,914 Conrad $0 $0 $0 $0 $0 $0 Chemical $2,618,800 $772,670 $304,665 $1,877,210 $930,961 $6,504,305 Civil & Environmental $1,932,133 $706,670 $1,496,630 $1,026,518 $1,498,766 $6,660,717 Electrical & Computer $6,042,813 $2,280,595 $6,118,167 $1,991,613 $1,504,411 $17,937,599 Management Sciences $552,356 $124,865 $50,000 $40,000 $43,741 $810,962 Mechanical & Mechatronics $2,466,593 $1,747,321 $4,401,193 $1,019,023 $923,061 $10,557,190 Systems Design $1,802,965 $832,250 $356,207 $1,121,660 $175,737 $4,288,819 Administrative Units $19,016 $1,394,714 $2,244,462 $0 $157,462 $3,815,654 TOTAL $15,540,086 $7,879,085 $14,971,324 $7,356,023 $5,272,643 $51,019,162
Total Sponsored Research Funding, 2010/11
Department Tri-Council Federal (excl Tri-Council) Provincial Industry Other Total
Architecture $221,982 $0 $0 $0 $28,660 $250,642 Conrad $0 $0 $0 $39,000 $0 $39,000 Chemical $2,221,387 $812,848 $219,583 $952,314 $815,379 $5,021,511 Civil & Environmental $2,414,791 $1,603,848 $2,228,456 $1,510,391 $1,416,115 $9,173,601 Electrical & Computer $5,975,556 $2,175,059 $5,345,258 $3,111,081 $1,818,713 $18,425,667 Management Sciences $620,620 $86,535 $50,000 $50,000 $16,000 $823,155 Mechanical & Mechatronics $3,282,552 $4,298,188 $6,755,400 $1,985,028 $2,822,621 $19,143,789 Systems Design $1,286,526 $681,246 $457,608 $614,340 $504,428 $3,544,148 Administrative Units $18,000 $1,597,353 $2,244,462 $0 $79,282 $3,939,097 TOTAL $16,041,414 $11,255,077 $17,300,767 $8,262,154 $7,501,198 $60,360,610
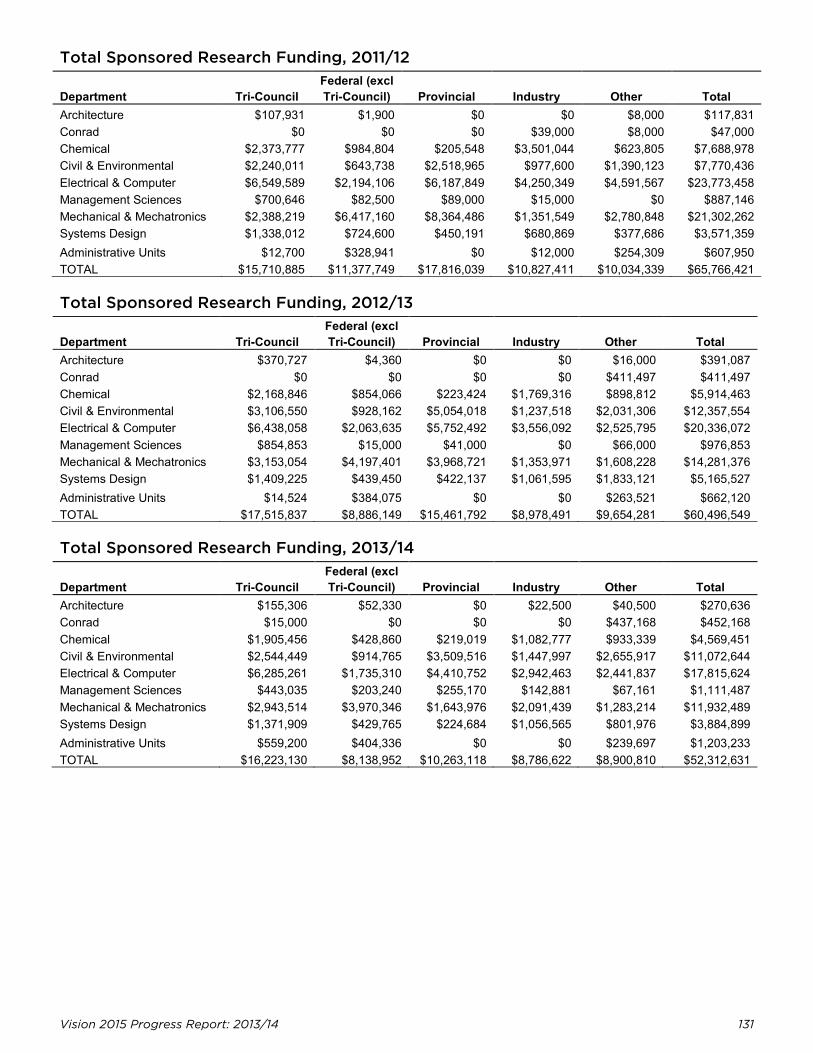
Vision 2015 Progress Report: 2013/14 131
Total Sponsored Research Funding, 2011/12
Department Tri-Council Federal (excl Tri-Council) Provincial Industry Other Total
Architecture $107,931 $1,900 $0 $0 $8,000 $117,831 Conrad $0 $0 $0 $39,000 $8,000 $47,000 Chemical $2,373,777 $984,804 $205,548 $3,501,044 $623,805 $7,688,978 Civil & Environmental $2,240,011 $643,738 $2,518,965 $977,600 $1,390,123 $7,770,436 Electrical & Computer $6,549,589 $2,194,106 $6,187,849 $4,250,349 $4,591,567 $23,773,458 Management Sciences $700,646 $82,500 $89,000 $15,000 $0 $887,146 Mechanical & Mechatronics $2,388,219 $6,417,160 $8,364,486 $1,351,549 $2,780,848 $21,302,262 Systems Design $1,338,012 $724,600 $450,191 $680,869 $377,686 $3,571,359 Administrative Units $12,700 $328,941 $0 $12,000 $254,309 $607,950 TOTAL $15,710,885 $11,377,749 $17,816,039 $10,827,411 $10,034,339 $65,766,421
Total Sponsored Research Funding, 2012/13
Department Tri-Council Federal (excl Tri-Council) Provincial Industry Other Total
Architecture $370,727 $4,360 $0 $0 $16,000 $391,087 Conrad $0 $0 $0 $0 $411,497 $411,497 Chemical $2,168,846 $854,066 $223,424 $1,769,316 $898,812 $5,914,463 Civil & Environmental $3,106,550 $928,162 $5,054,018 $1,237,518 $2,031,306 $12,357,554 Electrical & Computer $6,438,058 $2,063,635 $5,752,492 $3,556,092 $2,525,795 $20,336,072 Management Sciences $854,853 $15,000 $41,000 $0 $66,000 $976,853 Mechanical & Mechatronics $3,153,054 $4,197,401 $3,968,721 $1,353,971 $1,608,228 $14,281,376 Systems Design $1,409,225 $439,450 $422,137 $1,061,595 $1,833,121 $5,165,527 Administrative Units $14,524 $384,075 $0 $0 $263,521 $662,120 TOTAL $17,515,837 $8,886,149 $15,461,792 $8,978,491 $9,654,281 $60,496,549
Total Sponsored Research Funding, 2013/14
Department Tri-Council Federal (excl Tri-Council) Provincial Industry Other Total
Architecture $155,306 $52,330 $0 $22,500 $40,500 $270,636 Conrad $15,000 $0 $0 $0 $437,168 $452,168 Chemical $1,905,456 $428,860 $219,019 $1,082,777 $933,339 $4,569,451 Civil & Environmental $2,544,449 $914,765 $3,509,516 $1,447,997 $2,655,917 $11,072,644 Electrical & Computer $6,285,261 $1,735,310 $4,410,752 $2,942,463 $2,441,837 $17,815,624 Management Sciences $443,035 $203,240 $255,170 $142,881 $67,161 $1,111,487 Mechanical & Mechatronics $2,943,514 $3,970,346 $1,643,976 $2,091,439 $1,283,214 $11,932,489 Systems Design $1,371,909 $429,765 $224,684 $1,056,565 $801,976 $3,884,899 Administrative Units $559,200 $404,336 $0 $0 $239,697 $1,203,233 TOTAL $16,223,130 $8,138,952 $10,263,118 $8,786,622 $8,900,810 $52,312,631
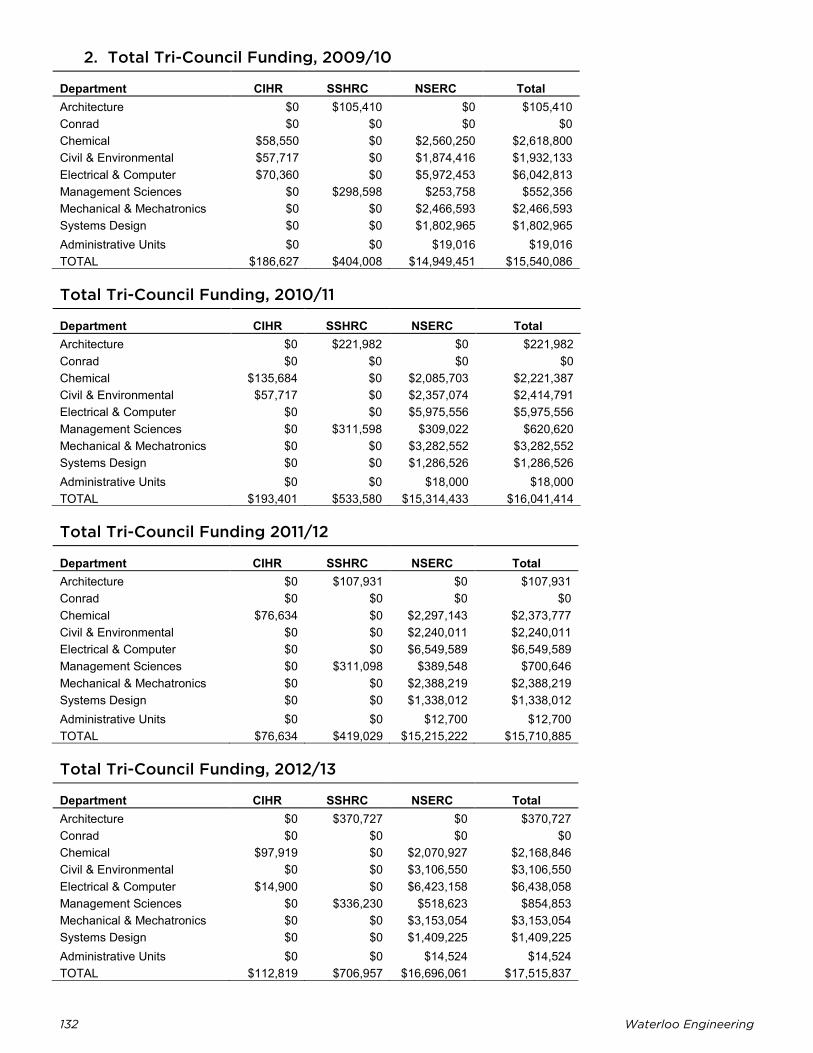
132 Waterloo Engineering
2. Total Tri-Council Funding, 2009/10
Department CIHR SSHRC NSERC Total Architecture $0 $105,410 $0 $105,410 Conrad $0 $0 $0 $0 Chemical $58,550 $0 $2,560,250 $2,618,800 Civil & Environmental $57,717 $0 $1,874,416 $1,932,133 Electrical & Computer $70,360 $0 $5,972,453 $6,042,813 Management Sciences $0 $298,598 $253,758 $552,356 Mechanical & Mechatronics $0 $0 $2,466,593 $2,466,593 Systems Design $0 $0 $1,802,965 $1,802,965 Administrative Units $0 $0 $19,016 $19,016 TOTAL $186,627 $404,008 $14,949,451 $15,540,086
Total Tri-Council Funding, 2010/11
Department CIHR SSHRC NSERC Total Architecture $0 $221,982 $0 $221,982 Conrad $0 $0 $0 $0 Chemical $135,684 $0 $2,085,703 $2,221,387 Civil & Environmental $57,717 $0 $2,357,074 $2,414,791 Electrical & Computer $0 $0 $5,975,556 $5,975,556 Management Sciences $0 $311,598 $309,022 $620,620 Mechanical & Mechatronics $0 $0 $3,282,552 $3,282,552 Systems Design $0 $0 $1,286,526 $1,286,526 Administrative Units $0 $0 $18,000 $18,000 TOTAL $193,401 $533,580 $15,314,433 $16,041,414
Total Tri-Council Funding 2011/12
Department CIHR SSHRC NSERC Total Architecture $0 $107,931 $0 $107,931 Conrad $0 $0 $0 $0 Chemical $76,634 $0 $2,297,143 $2,373,777 Civil & Environmental $0 $0 $2,240,011 $2,240,011 Electrical & Computer $0 $0 $6,549,589 $6,549,589 Management Sciences $0 $311,098 $389,548 $700,646 Mechanical & Mechatronics $0 $0 $2,388,219 $2,388,219 Systems Design $0 $0 $1,338,012 $1,338,012 Administrative Units $0 $0 $12,700 $12,700 TOTAL $76,634 $419,029 $15,215,222 $15,710,885
Total Tri-Council Funding, 2012/13
Department CIHR SSHRC NSERC Total Architecture $0 $370,727 $0 $370,727 Conrad $0 $0 $0 $0 Chemical $97,919 $0 $2,070,927 $2,168,846 Civil & Environmental $0 $0 $3,106,550 $3,106,550 Electrical & Computer $14,900 $0 $6,423,158 $6,438,058 Management Sciences $0 $336,230 $518,623 $854,853 Mechanical & Mechatronics $0 $0 $3,153,054 $3,153,054 Systems Design $0 $0 $1,409,225 $1,409,225 Administrative Units $0 $0 $14,524 $14,524 TOTAL $112,819 $706,957 $16,696,061 $17,515,837
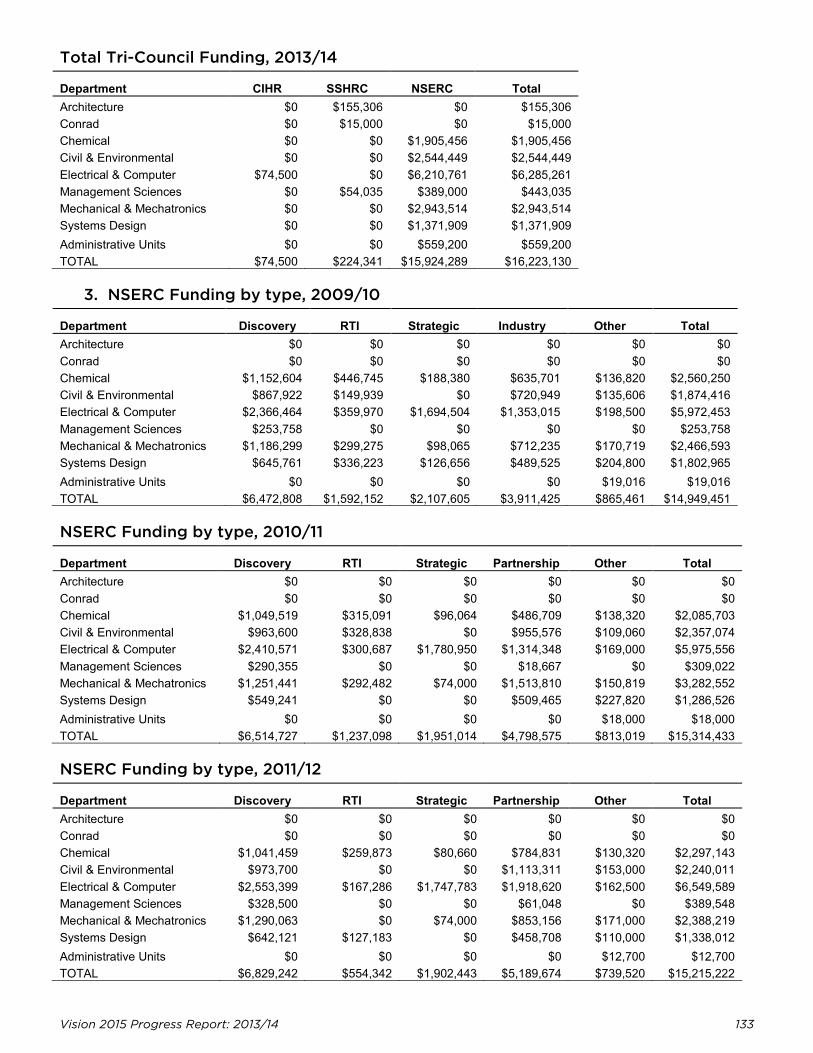
Vision 2015 Progress Report: 2013/14 133
Total Tri-Council Funding, 2013/14
Department CIHR SSHRC NSERC Total Architecture $0 $155,306 $0 $155,306 Conrad $0 $15,000 $0 $15,000 Chemical $0 $0 $1,905,456 $1,905,456 Civil & Environmental $0 $0 $2,544,449 $2,544,449 Electrical & Computer $74,500 $0 $6,210,761 $6,285,261 Management Sciences $0 $54,035 $389,000 $443,035 Mechanical & Mechatronics $0 $0 $2,943,514 $2,943,514 Systems Design $0 $0 $1,371,909 $1,371,909 Administrative Units $0 $0 $559,200 $559,200 TOTAL $74,500 $224,341 $15,924,289 $16,223,130
3. NSERC Funding by type, 2009/10
Department Discovery RTI Strategic Industry Other Total Architecture $0 $0 $0 $0 $0 $0 Conrad $0 $0 $0 $0 $0 $0 Chemical $1,152,604 $446,745 $188,380 $635,701 $136,820 $2,560,250 Civil & Environmental $867,922 $149,939 $0 $720,949 $135,606 $1,874,416 Electrical & Computer $2,366,464 $359,970 $1,694,504 $1,353,015 $198,500 $5,972,453 Management Sciences $253,758 $0 $0 $0 $0 $253,758 Mechanical & Mechatronics $1,186,299 $299,275 $98,065 $712,235 $170,719 $2,466,593 Systems Design $645,761 $336,223 $126,656 $489,525 $204,800 $1,802,965 Administrative Units $0 $0 $0 $0 $19,016 $19,016 TOTAL $6,472,808 $1,592,152 $2,107,605 $3,911,425 $865,461 $14,949,451
NSERC Funding by type, 2010/11
Department Discovery RTI Strategic Partnership Other Total Architecture $0 $0 $0 $0 $0 $0 Conrad $0 $0 $0 $0 $0 $0 Chemical $1,049,519 $315,091 $96,064 $486,709 $138,320 $2,085,703 Civil & Environmental $963,600 $328,838 $0 $955,576 $109,060 $2,357,074 Electrical & Computer $2,410,571 $300,687 $1,780,950 $1,314,348 $169,000 $5,975,556 Management Sciences $290,355 $0 $0 $18,667 $0 $309,022 Mechanical & Mechatronics $1,251,441 $292,482 $74,000 $1,513,810 $150,819 $3,282,552 Systems Design $549,241 $0 $0 $509,465 $227,820 $1,286,526 Administrative Units $0 $0 $0 $0 $18,000 $18,000 TOTAL $6,514,727 $1,237,098 $1,951,014 $4,798,575 $813,019 $15,314,433
NSERC Funding by type, 2011/12
Department Discovery RTI Strategic Partnership Other Total Architecture $0 $0 $0 $0 $0 $0 Conrad $0 $0 $0 $0 $0 $0 Chemical $1,041,459 $259,873 $80,660 $784,831 $130,320 $2,297,143 Civil & Environmental $973,700 $0 $0 $1,113,311 $153,000 $2,240,011 Electrical & Computer $2,553,399 $167,286 $1,747,783 $1,918,620 $162,500 $6,549,589 Management Sciences $328,500 $0 $0 $61,048 $0 $389,548 Mechanical & Mechatronics $1,290,063 $0 $74,000 $853,156 $171,000 $2,388,219 Systems Design $642,121 $127,183 $0 $458,708 $110,000 $1,338,012 Administrative Units $0 $0 $0 $0 $12,700 $12,700 TOTAL $6,829,242 $554,342 $1,902,443 $5,189,674 $739,520 $15,215,222
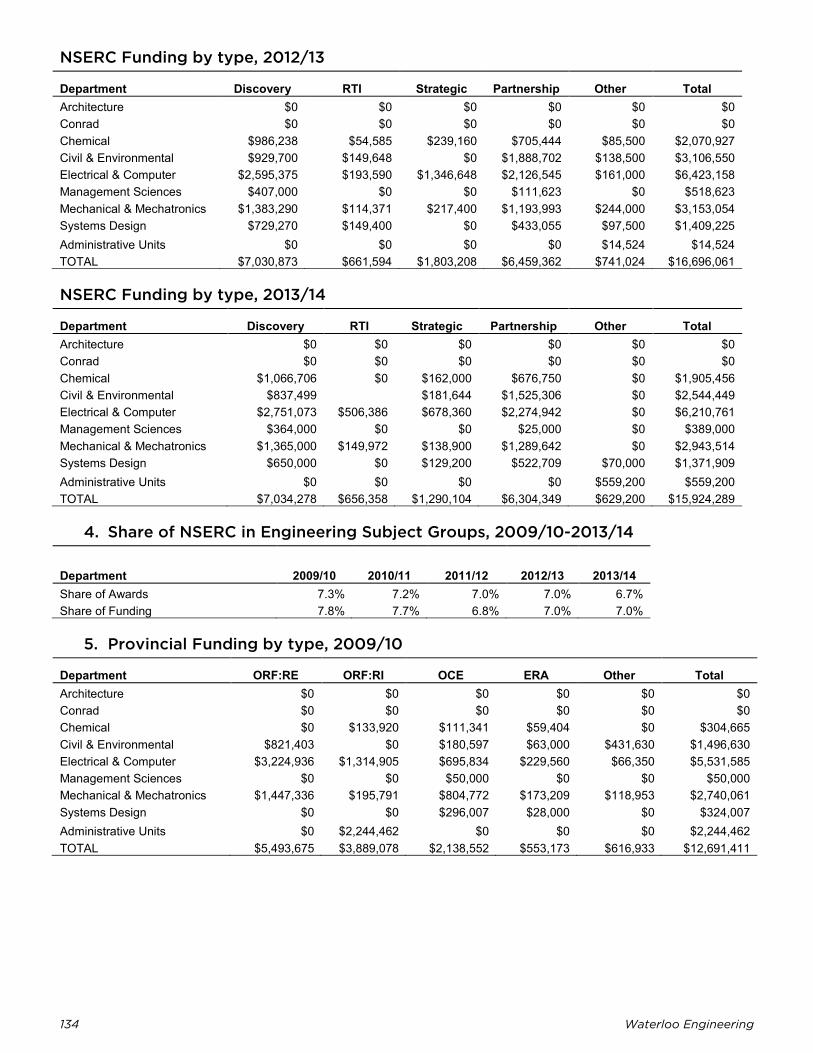
134 Waterloo Engineering
NSERC Funding by type, 2012/13
Department Discovery RTI Strategic Partnership Other Total Architecture $0 $0 $0 $0 $0 $0 Conrad $0 $0 $0 $0 $0 $0 Chemical $986,238 $54,585 $239,160 $705,444 $85,500 $2,070,927 Civil & Environmental $929,700 $149,648 $0 $1,888,702 $138,500 $3,106,550 Electrical & Computer $2,595,375 $193,590 $1,346,648 $2,126,545 $161,000 $6,423,158 Management Sciences $407,000 $0 $0 $111,623 $0 $518,623 Mechanical & Mechatronics $1,383,290 $114,371 $217,400 $1,193,993 $244,000 $3,153,054 Systems Design $729,270 $149,400 $0 $433,055 $97,500 $1,409,225 Administrative Units $0 $0 $0 $0 $14,524 $14,524 TOTAL $7,030,873 $661,594 $1,803,208 $6,459,362 $741,024 $16,696,061
NSERC Funding by type, 2013/14
Department Discovery RTI Strategic Partnership Other Total Architecture $0 $0 $0 $0 $0 $0 Conrad $0 $0 $0 $0 $0 $0 Chemical $1,066,706 $0 $162,000 $676,750 $0 $1,905,456 Civil & Environmental $837,499 $181,644 $1,525,306 $0 $2,544,449 Electrical & Computer $2,751,073 $506,386 $678,360 $2,274,942 $0 $6,210,761 Management Sciences $364,000 $0 $0 $25,000 $0 $389,000 Mechanical & Mechatronics $1,365,000 $149,972 $138,900 $1,289,642 $0 $2,943,514 Systems Design $650,000 $0 $129,200 $522,709 $70,000 $1,371,909 Administrative Units $0 $0 $0 $0 $559,200 $559,200 TOTAL $7,034,278 $656,358 $1,290,104 $6,304,349 $629,200 $15,924,289
4. Share of NSERC in Engineering Subject Groups, 2009/10-2013/14
Department 2009/10 2010/11 2011/12 2012/13 2013/14 Share of Awards 7.3% 7.2% 7.0% 7.0% 6.7% Share of Funding 7.8% 7.7% 6.8% 7.0% 7.0%
5. Provincial Funding by type, 2009/10
Department ORF:RE ORF:RI OCE ERA Other Total Architecture $0 $0 $0 $0 $0 $0 Conrad $0 $0 $0 $0 $0 $0 Chemical $0 $133,920 $111,341 $59,404 $0 $304,665 Civil & Environmental $821,403 $0 $180,597 $63,000 $431,630 $1,496,630 Electrical & Computer $3,224,936 $1,314,905 $695,834 $229,560 $66,350 $5,531,585 Management Sciences $0 $0 $50,000 $0 $0 $50,000 Mechanical & Mechatronics $1,447,336 $195,791 $804,772 $173,209 $118,953 $2,740,061 Systems Design $0 $0 $296,007 $28,000 $0 $324,007 Administrative Units $0 $2,244,462 $0 $0 $0 $2,244,462 TOTAL $5,493,675 $3,889,078 $2,138,552 $553,173 $616,933 $12,691,411
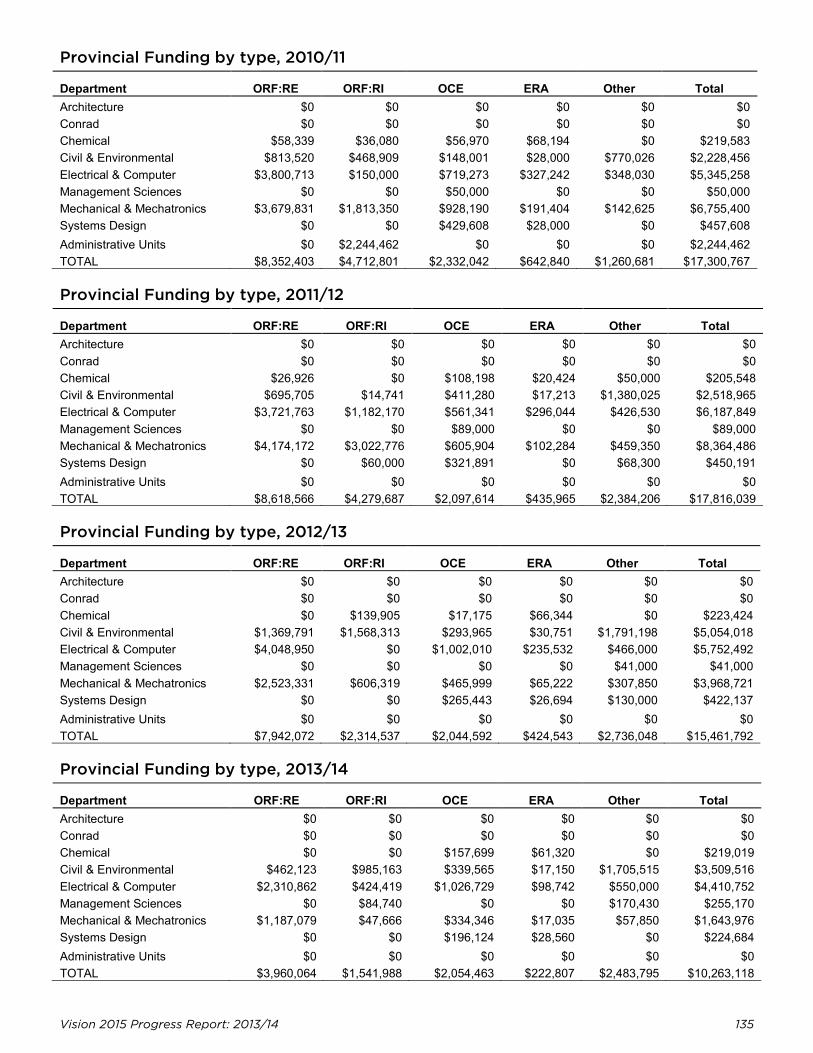
Vision 2015 Progress Report: 2013/14 135
Provincial Funding by type, 2010/11
Department ORF:RE ORF:RI OCE ERA Other Total Architecture $0 $0 $0 $0 $0 $0 Conrad $0 $0 $0 $0 $0 $0 Chemical $58,339 $36,080 $56,970 $68,194 $0 $219,583 Civil & Environmental $813,520 $468,909 $148,001 $28,000 $770,026 $2,228,456 Electrical & Computer $3,800,713 $150,000 $719,273 $327,242 $348,030 $5,345,258 Management Sciences $0 $0 $50,000 $0 $0 $50,000 Mechanical & Mechatronics $3,679,831 $1,813,350 $928,190 $191,404 $142,625 $6,755,400 Systems Design $0 $0 $429,608 $28,000 $0 $457,608 Administrative Units $0 $2,244,462 $0 $0 $0 $2,244,462 TOTAL $8,352,403 $4,712,801 $2,332,042 $642,840 $1,260,681 $17,300,767
Provincial Funding by type, 2011/12
Department ORF:RE ORF:RI OCE ERA Other Total Architecture $0 $0 $0 $0 $0 $0 Conrad $0 $0 $0 $0 $0 $0 Chemical $26,926 $0 $108,198 $20,424 $50,000 $205,548 Civil & Environmental $695,705 $14,741 $411,280 $17,213 $1,380,025 $2,518,965 Electrical & Computer $3,721,763 $1,182,170 $561,341 $296,044 $426,530 $6,187,849 Management Sciences $0 $0 $89,000 $0 $0 $89,000 Mechanical & Mechatronics $4,174,172 $3,022,776 $605,904 $102,284 $459,350 $8,364,486 Systems Design $0 $60,000 $321,891 $0 $68,300 $450,191 Administrative Units $0 $0 $0 $0 $0 $0 TOTAL $8,618,566 $4,279,687 $2,097,614 $435,965 $2,384,206 $17,816,039
Provincial Funding by type, 2012/13
Department ORF:RE ORF:RI OCE ERA Other Total Architecture $0 $0 $0 $0 $0 $0 Conrad $0 $0 $0 $0 $0 $0 Chemical $0 $139,905 $17,175 $66,344 $0 $223,424 Civil & Environmental $1,369,791 $1,568,313 $293,965 $30,751 $1,791,198 $5,054,018 Electrical & Computer $4,048,950 $0 $1,002,010 $235,532 $466,000 $5,752,492 Management Sciences $0 $0 $0 $0 $41,000 $41,000 Mechanical & Mechatronics $2,523,331 $606,319 $465,999 $65,222 $307,850 $3,968,721 Systems Design $0 $0 $265,443 $26,694 $130,000 $422,137 Administrative Units $0 $0 $0 $0 $0 $0 TOTAL $7,942,072 $2,314,537 $2,044,592 $424,543 $2,736,048 $15,461,792
Provincial Funding by type, 2013/14
Department ORF:RE ORF:RI OCE ERA Other Total Architecture $0 $0 $0 $0 $0 $0 Conrad $0 $0 $0 $0 $0 $0 Chemical $0 $0 $157,699 $61,320 $0 $219,019 Civil & Environmental $462,123 $985,163 $339,565 $17,150 $1,705,515 $3,509,516 Electrical & Computer $2,310,862 $424,419 $1,026,729 $98,742 $550,000 $4,410,752 Management Sciences $0 $84,740 $0 $0 $170,430 $255,170 Mechanical & Mechatronics $1,187,079 $47,666 $334,346 $17,035 $57,850 $1,643,976 Systems Design $0 $0 $196,124 $28,560 $0 $224,684 Administrative Units $0 $0 $0 $0 $0 $0 TOTAL $3,960,064 $1,541,988 $2,054,463 $222,807 $2,483,795 $10,263,118
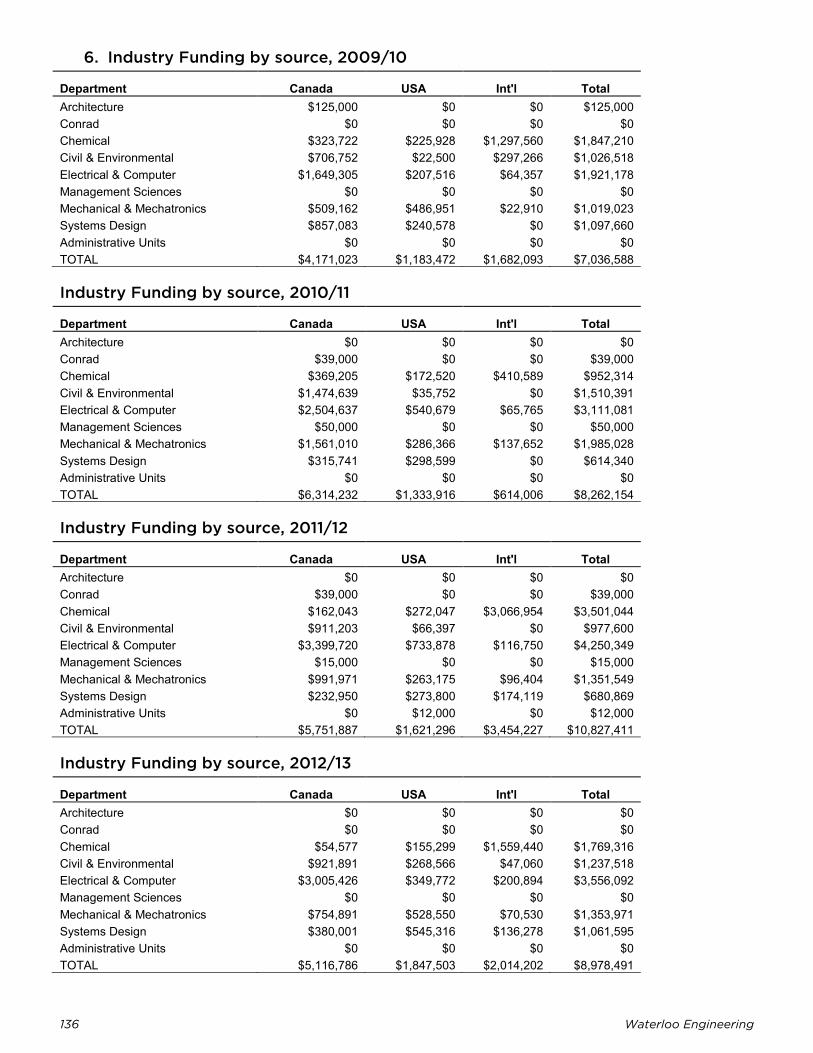
136 Waterloo Engineering
6. Industry Funding by source, 2009/10
Department Canada USA Int'l Total Architecture $125,000 $0 $0 $125,000 Conrad $0 $0 $0 $0 Chemical $323,722 $225,928 $1,297,560 $1,847,210 Civil & Environmental $706,752 $22,500 $297,266 $1,026,518 Electrical & Computer $1,649,305 $207,516 $64,357 $1,921,178 Management Sciences $0 $0 $0 $0 Mechanical & Mechatronics $509,162 $486,951 $22,910 $1,019,023 Systems Design $857,083 $240,578 $0 $1,097,660 Administrative Units $0 $0 $0 $0 TOTAL $4,171,023 $1,183,472 $1,682,093 $7,036,588
Industry Funding by source, 2010/11
Department Canada USA Int'l Total Architecture $0 $0 $0 $0 Conrad $39,000 $0 $0 $39,000 Chemical $369,205 $172,520 $410,589 $952,314 Civil & Environmental $1,474,639 $35,752 $0 $1,510,391 Electrical & Computer $2,504,637 $540,679 $65,765 $3,111,081 Management Sciences $50,000 $0 $0 $50,000 Mechanical & Mechatronics $1,561,010 $286,366 $137,652 $1,985,028 Systems Design $315,741 $298,599 $0 $614,340 Administrative Units $0 $0 $0 $0 TOTAL $6,314,232 $1,333,916 $614,006 $8,262,154
Industry Funding by source, 2011/12
Department Canada USA Int'l Total Architecture $0 $0 $0 $0 Conrad $39,000 $0 $0 $39,000 Chemical $162,043 $272,047 $3,066,954 $3,501,044 Civil & Environmental $911,203 $66,397 $0 $977,600 Electrical & Computer $3,399,720 $733,878 $116,750 $4,250,349 Management Sciences $15,000 $0 $0 $15,000 Mechanical & Mechatronics $991,971 $263,175 $96,404 $1,351,549 Systems Design $232,950 $273,800 $174,119 $680,869 Administrative Units $0 $12,000 $0 $12,000 TOTAL $5,751,887 $1,621,296 $3,454,227 $10,827,411
Industry Funding by source, 2012/13
Department Canada USA Int'l Total Architecture $0 $0 $0 $0 Conrad $0 $0 $0 $0 Chemical $54,577 $155,299 $1,559,440 $1,769,316 Civil & Environmental $921,891 $268,566 $47,060 $1,237,518 Electrical & Computer $3,005,426 $349,772 $200,894 $3,556,092 Management Sciences $0 $0 $0 $0 Mechanical & Mechatronics $754,891 $528,550 $70,530 $1,353,971 Systems Design $380,001 $545,316 $136,278 $1,061,595 Administrative Units $0 $0 $0 $0 TOTAL $5,116,786 $1,847,503 $2,014,202 $8,978,491
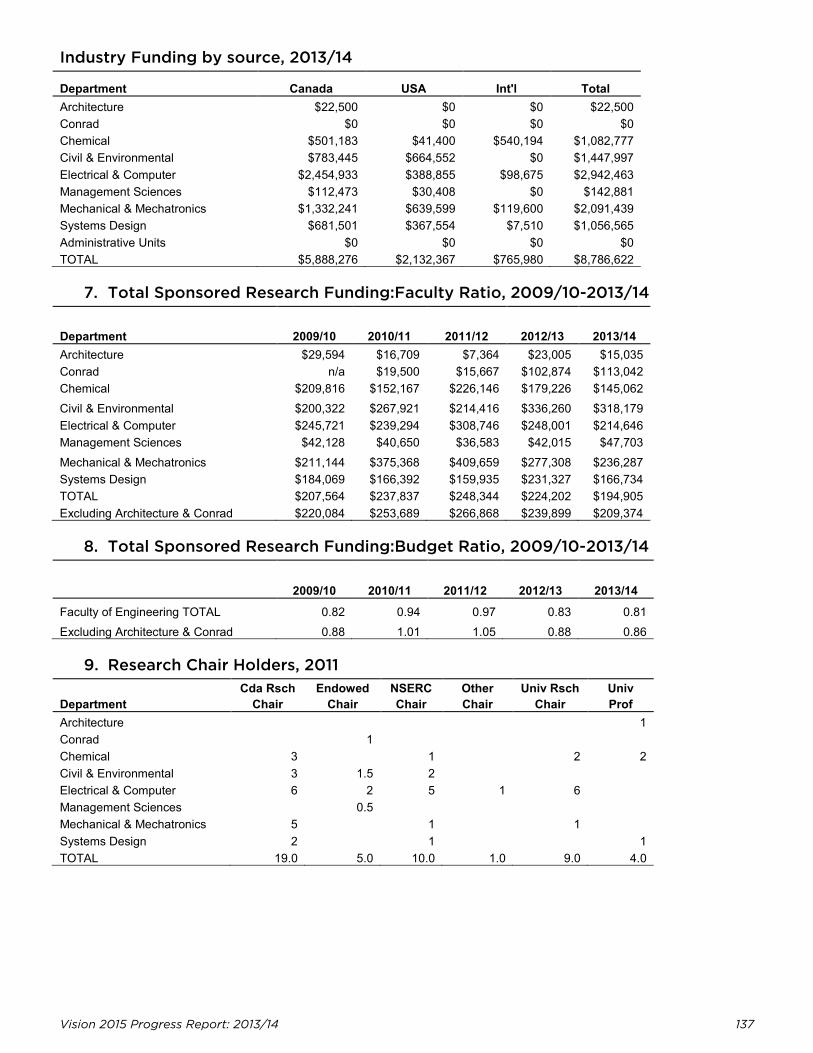
Vision 2015 Progress Report: 2013/14 137
Industry Funding by source, 2013/14
Department Canada USA Int'l Total Architecture $22,500 $0 $0 $22,500 Conrad $0 $0 $0 $0 Chemical $501,183 $41,400 $540,194 $1,082,777 Civil & Environmental $783,445 $664,552 $0 $1,447,997 Electrical & Computer $2,454,933 $388,855 $98,675 $2,942,463 Management Sciences $112,473 $30,408 $0 $142,881 Mechanical & Mechatronics $1,332,241 $639,599 $119,600 $2,091,439 Systems Design $681,501 $367,554 $7,510 $1,056,565 Administrative Units $0 $0 $0 $0 TOTAL $5,888,276 $2,132,367 $765,980 $8,786,622
7. Total Sponsored Research Funding:Faculty Ratio, 2009/10-2013/14
Department 2009/10 2010/11 2011/12 2012/13 2013/14 Architecture $29,594 $16,709 $7,364 $23,005 $15,035 Conrad n/a $19,500 $15,667 $102,874 $113,042 Chemical $209,816 $152,167 $226,146 $179,226 $145,062 Civil & Environmental $200,322 $267,921 $214,416 $336,260 $318,179 Electrical & Computer $245,721 $239,294 $308,746 $248,001 $214,646 Management Sciences $42,128 $40,650 $36,583 $42,015 $47,703 Mechanical & Mechatronics $211,144 $375,368 $409,659 $277,308 $236,287 Systems Design $184,069 $166,392 $159,935 $231,327 $166,734 TOTAL $207,564 $237,837 $248,344 $224,202 $194,905 Excluding Architecture & Conrad $220,084 $253,689 $266,868 $239,899 $209,374
8. Total Sponsored Research Funding:Budget Ratio, 2009/10-2013/14
2009/10 2010/11 2011/12 2012/13 2013/14 Faculty of Engineering TOTAL 0.82 0.94 0.97 0.83 0.81 Excluding Architecture & Conrad 0.88 1.01 1.05 0.88 0.86
9. Research Chair Holders, 2011
Department Cda Rsch
Chair Endowed
Chair NSERC Chair
Other Chair
Univ Rsch Chair
Univ Prof
Architecture 1 Conrad 1 Chemical 3 1 2 2 Civil & Environmental 3 1.5 2 Electrical & Computer 6 2 5 1 6 Management Sciences 0.5 Mechanical & Mechatronics 5 1 1 Systems Design 2 1 1 TOTAL 19.0 5.0 10.0 1.0 9.0 4.0
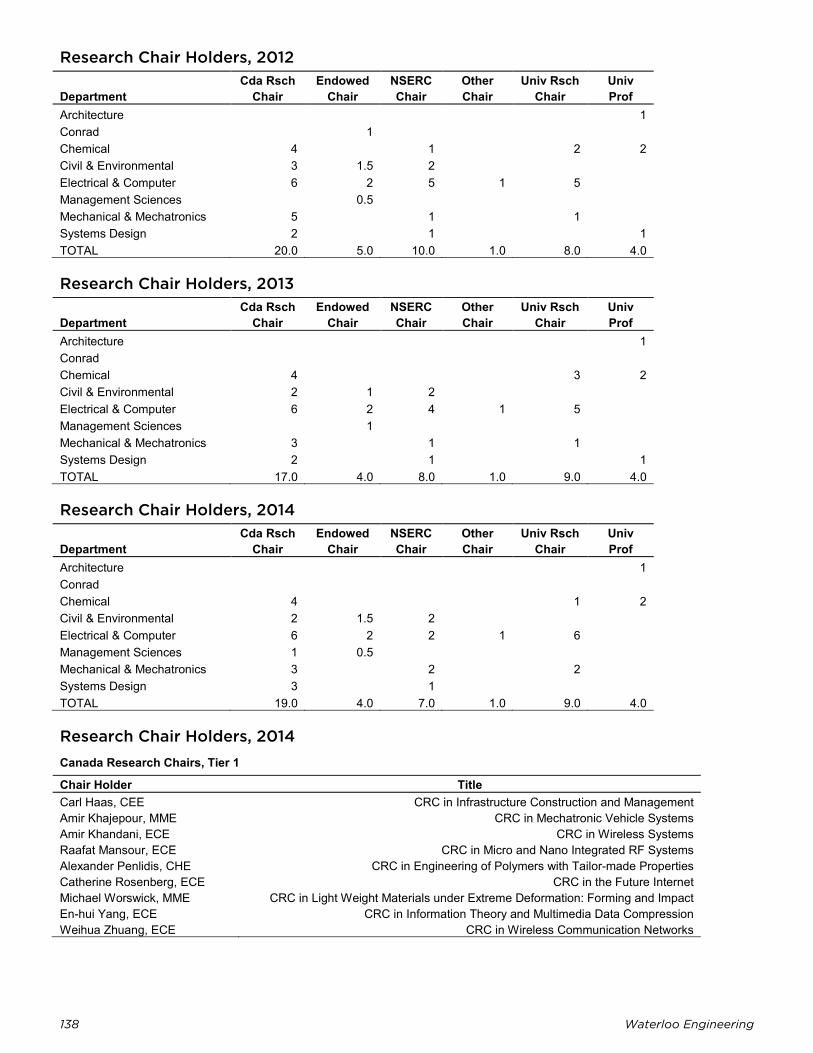
138 Waterloo Engineering
Research Chair Holders, 2012
Department Cda Rsch
Chair Endowed
Chair NSERC Chair
Other Chair
Univ Rsch Chair
Univ Prof
Architecture 1 Conrad 1 Chemical 4 1 2 2 Civil & Environmental 3 1.5 2 Electrical & Computer 6 2 5 1 5 Management Sciences 0.5 Mechanical & Mechatronics 5 1 1 Systems Design 2 1 1 TOTAL 20.0 5.0 10.0 1.0 8.0 4.0
Research Chair Holders, 2013
Department Cda Rsch
Chair Endowed
Chair NSERC Chair
Other Chair
Univ Rsch Chair
Univ Prof
Architecture 1 Conrad Chemical 4 3 2 Civil & Environmental 2 1 2 Electrical & Computer 6 2 4 1 5 Management Sciences 1 Mechanical & Mechatronics 3 1 1 Systems Design 2 1 1 TOTAL 17.0 4.0 8.0 1.0 9.0 4.0
Research Chair Holders, 2014
Department Cda Rsch
Chair Endowed
Chair NSERC Chair
Other Chair
Univ Rsch Chair
Univ Prof
Architecture 1 Conrad Chemical 4 1 2 Civil & Environmental 2 1.5 2 Electrical & Computer 6 2 2 1 6 Management Sciences 1 0.5 Mechanical & Mechatronics 3 2 2 Systems Design 3 1 TOTAL 19.0 4.0 7.0 1.0 9.0 4.0
Research Chair Holders, 2014 Canada Research Chairs, Tier 1
Chair Holder Title Carl Haas, CEE CRC in Infrastructure Construction and Management Amir Khajepour, MME CRC in Mechatronic Vehicle Systems Amir Khandani, ECE CRC in Wireless Systems Raafat Mansour, ECE CRC in Micro and Nano Integrated RF Systems Alexander Penlidis, CHE CRC in Engineering of Polymers with Tailor-made Properties Catherine Rosenberg, ECE CRC in the Future Internet Michael Worswick, MME CRC in Light Weight Materials under Extreme Deformation: Forming and Impact En-hui Yang, ECE CRC in Information Theory and Multimedia Data Compression Weihua Zhuang, ECE CRC in Wireless Communication Networks
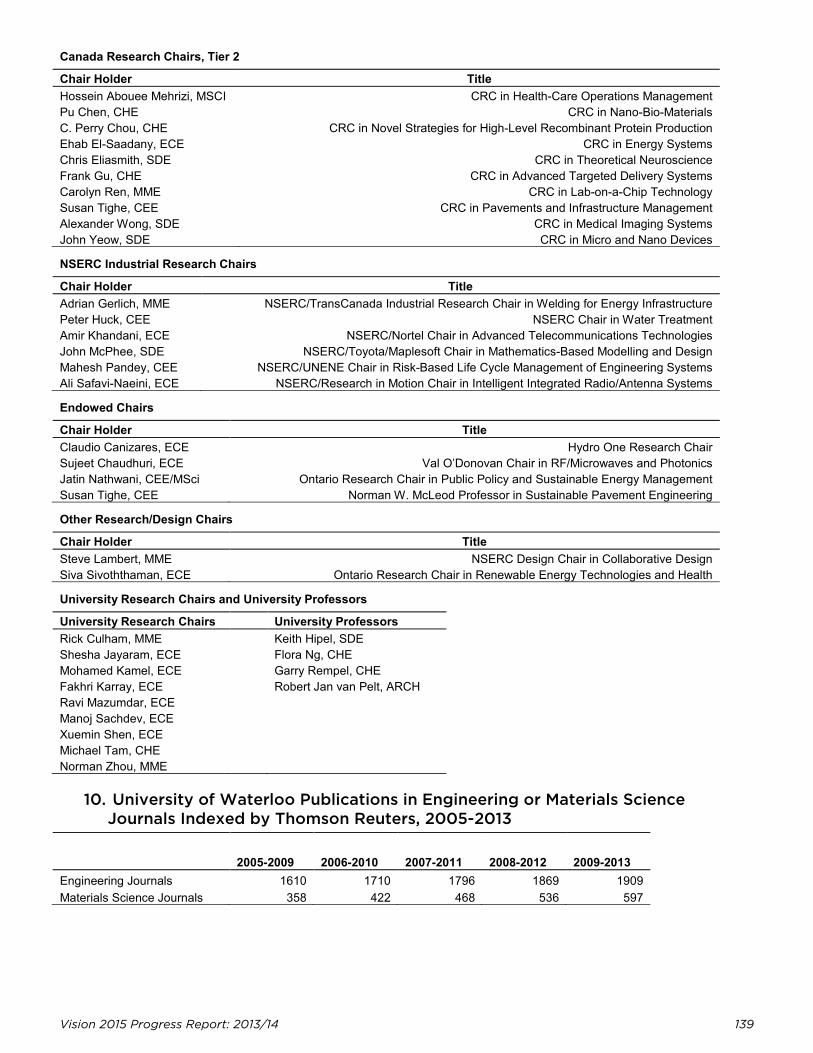
Vision 2015 Progress Report: 2013/14 139
Canada Research Chairs, Tier 2
Chair Holder Title Hossein Abouee Mehrizi, MSCI CRC in Health-Care Operations Management Pu Chen, CHE CRC in Nano-Bio-Materials C. Perry Chou, CHE CRC in Novel Strategies for High-Level Recombinant Protein Production Ehab El-Saadany, ECE CRC in Energy Systems Chris Eliasmith, SDE CRC in Theoretical Neuroscience Frank Gu, CHE CRC in Advanced Targeted Delivery Systems Carolyn Ren, MME CRC in Lab-on-a-Chip Technology Susan Tighe, CEE CRC in Pavements and Infrastructure Management Alexander Wong, SDE CRC in Medical Imaging Systems John Yeow, SDE CRC in Micro and Nano Devices
NSERC Industrial Research Chairs
Chair Holder Title Adrian Gerlich, MME NSERC/TransCanada Industrial Research Chair in Welding for Energy Infrastructure Peter Huck, CEE NSERC Chair in Water Treatment Amir Khandani, ECE NSERC/Nortel Chair in Advanced Telecommunications Technologies John McPhee, SDE NSERC/Toyota/Maplesoft Chair in Mathematics-Based Modelling and Design Mahesh Pandey, CEE NSERC/UNENE Chair in Risk-Based Life Cycle Management of Engineering Systems Ali Safavi-Naeini, ECE NSERC/Research in Motion Chair in Intelligent Integrated Radio/Antenna Systems
Endowed Chairs
Chair Holder Title Claudio Canizares, ECE Hydro One Research Chair Sujeet Chaudhuri, ECE Val O’Donovan Chair in RF/Microwaves and Photonics Jatin Nathwani, CEE/MSci Ontario Research Chair in Public Policy and Sustainable Energy Management Susan Tighe, CEE Norman W. McLeod Professor in Sustainable Pavement Engineering
Other Research/Design Chairs
Chair Holder Title Steve Lambert, MME NSERC Design Chair in Collaborative Design Siva Sivoththaman, ECE Ontario Research Chair in Renewable Energy Technologies and Health
University Research Chairs and University Professors
University Research Chairs University Professors Rick Culham, MME Shesha Jayaram, ECE Mohamed Kamel, ECE Fakhri Karray, ECE Ravi Mazumdar, ECE Manoj Sachdev, ECE Xuemin Shen, ECE Michael Tam, CHE Norman Zhou, MME
Keith Hipel, SDE Flora Ng, CHE Garry Rempel, CHE Robert Jan van Pelt, ARCH
10. University of Waterloo Publications in Engineering or Materials Science Journals Indexed by Thomson Reuters, 2005-2013
2005-2009 2006-2010 2007-2011 2008-2012 2009-2013 Engineering Journals 1610 1710 1796 1869 1909 Materials Science Journals 358 422 468 536 597
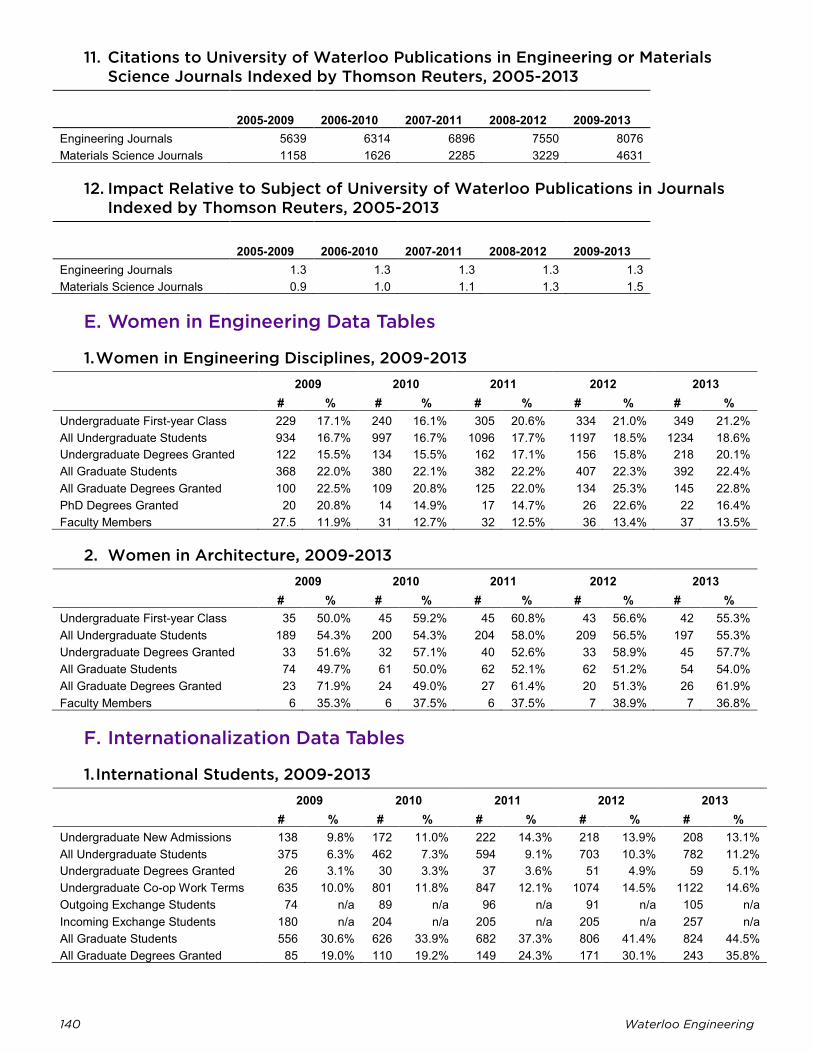
140 Waterloo Engineering
11. Citations to University of Waterloo Publications in Engineering or Materials Science Journals Indexed by Thomson Reuters, 2005-2013
2005-2009 2006-2010 2007-2011 2008-2012 2009-2013 Engineering Journals 5639 6314 6896 7550 8076 Materials Science Journals 1158 1626 2285 3229 4631
12. Impact Relative to Subject of University of Waterloo Publications in Journals Indexed by Thomson Reuters, 2005-2013
2005-2009 2006-2010 2007-2011 2008-2012 2009-2013 Engineering Journals 1.3 1.3 1.3 1.3 1.3 Materials Science Journals 0.9 1.0 1.1 1.3 1.5
E. Women in Engineering Data Tables
1. Women in Engineering Disciplines, 2009-2013 2009 2010 2011 2012 2013
# % # % # % # % # % Undergraduate First-year Class 229 17.1% 240 16.1% 305 20.6% 334 21.0% 349 21.2% All Undergraduate Students 934 16.7% 997 16.7% 1096 17.7% 1197 18.5% 1234 18.6% Undergraduate Degrees Granted 122 15.5% 134 15.5% 162 17.1% 156 15.8% 218 20.1% All Graduate Students 368 22.0% 380 22.1% 382 22.2% 407 22.3% 392 22.4% All Graduate Degrees Granted 100 22.5% 109 20.8% 125 22.0% 134 25.3% 145 22.8% PhD Degrees Granted 20 20.8% 14 14.9% 17 14.7% 26 22.6% 22 16.4% Faculty Members 27.5 11.9% 31 12.7% 32 12.5% 36 13.4% 37 13.5%
2. Women in Architecture, 2009-2013 2009 2010 2011 2012 2013
# % # % # % # % # % Undergraduate First-year Class 35 50.0% 45 59.2% 45 60.8% 43 56.6% 42 55.3% All Undergraduate Students 189 54.3% 200 54.3% 204 58.0% 209 56.5% 197 55.3% Undergraduate Degrees Granted 33 51.6% 32 57.1% 40 52.6% 33 58.9% 45 57.7% All Graduate Students 74 49.7% 61 50.0% 62 52.1% 62 51.2% 54 54.0% All Graduate Degrees Granted 23 71.9% 24 49.0% 27 61.4% 20 51.3% 26 61.9% Faculty Members 6 35.3% 6 37.5% 6 37.5% 7 38.9% 7 36.8%
F. Internationalization Data Tables
1. International Students, 2009-2013 2009 2010 2011 2012 2013
# % # % # % # % # % Undergraduate New Admissions 138 9.8% 172 11.0% 222 14.3% 218 13.9% 208 13.1% All Undergraduate Students 375 6.3% 462 7.3% 594 9.1% 703 10.3% 782 11.2% Undergraduate Degrees Granted 26 3.1% 30 3.3% 37 3.6% 51 4.9% 59 5.1% Undergraduate Co-op Work Terms 635 10.0% 801 11.8% 847 12.1% 1074 14.5% 1122 14.6% Outgoing Exchange Students 74 n/a 89 n/a 96 n/a 91 n/a 105 n/a Incoming Exchange Students 180 n/a 204 n/a 205 n/a 205 n/a 257 n/a All Graduate Students 556 30.6% 626 33.9% 682 37.3% 806 41.4% 824 44.5% All Graduate Degrees Granted 85 19.0% 110 19.2% 149 24.3% 171 30.1% 243 35.8%
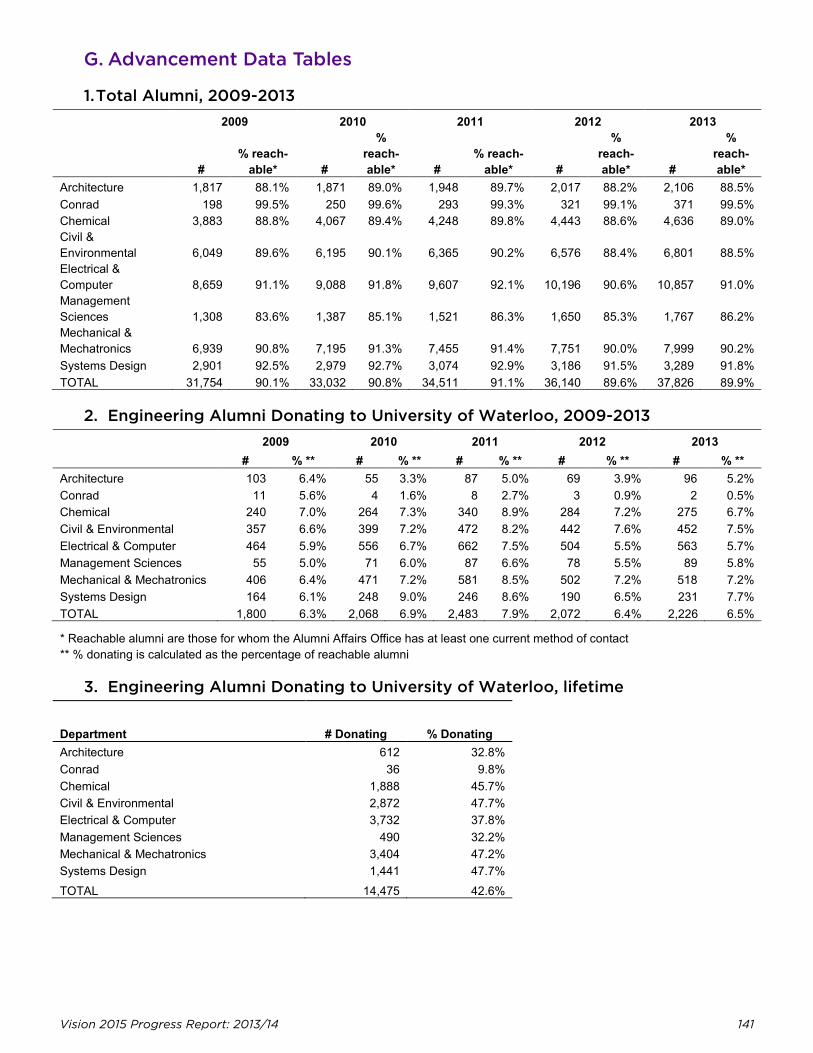
Vision 2015 Progress Report: 2013/14 141
G. Advancement Data Tables
1. Total Alumni, 2009-2013 2009 2010 2011 2012 2013
# % reach-
able* #
% reach-able* #
% reach-able* #
% reach-able* #
% reach-able*
Architecture 1,817 88.1% 1,871 89.0% 1,948 89.7% 2,017 88.2% 2,106 88.5% Conrad 198 99.5% 250 99.6% 293 99.3% 321 99.1% 371 99.5% Chemical 3,883 88.8% 4,067 89.4% 4,248 89.8% 4,443 88.6% 4,636 89.0% Civil & Environmental 6,049 89.6% 6,195 90.1% 6,365 90.2% 6,576 88.4% 6,801 88.5% Electrical & Computer 8,659 91.1% 9,088 91.8% 9,607 92.1% 10,196 90.6% 10,857 91.0% Management Sciences 1,308 83.6% 1,387 85.1% 1,521 86.3% 1,650 85.3% 1,767 86.2% Mechanical & Mechatronics 6,939 90.8% 7,195 91.3% 7,455 91.4% 7,751 90.0% 7,999 90.2% Systems Design 2,901 92.5% 2,979 92.7% 3,074 92.9% 3,186 91.5% 3,289 91.8% TOTAL 31,754 90.1% 33,032 90.8% 34,511 91.1% 36,140 89.6% 37,826 89.9%
* Reachable alumni are those for whom the Alumni Affairs Office has at least one current method of contact
2. Engineering Alumni Donating to University of Waterloo, 2009-2013 2009 2010 2011 2012 2013
# % ** # % ** # % ** # % ** # % **Architecture 103 6.4% 55 3.3% 87 5.0% 69 3.9% 96 5.2% Conrad 11 5.6% 4 1.6% 8 2.7% 3 0.9% 2 0.5% Chemical 240 7.0% 264 7.3% 340 8.9% 284 7.2% 275 6.7% Civil & Environmental 357 6.6% 399 7.2% 472 8.2% 442 7.6% 452 7.5% Electrical & Computer 464 5.9% 556 6.7% 662 7.5% 504 5.5% 563 5.7% Management Sciences 55 5.0% 71 6.0% 87 6.6% 78 5.5% 89 5.8% Mechanical & Mechatronics 406 6.4% 471 7.2% 581 8.5% 502 7.2% 518 7.2% Systems Design 164 6.1% 248 9.0% 246 8.6% 190 6.5% 231 7.7% TOTAL 1,800 6.3% 2,068 6.9% 2,483 7.9% 2,072 6.4% 2,226 6.5%
** % donating is calculated as the percentage of reachable alumni
3. Engineering Alumni Donating to University of Waterloo, lifetime
Department # Donating % Donating Architecture 612 32.8% Conrad 36 9.8% Chemical 1,888 45.7% Civil & Environmental 2,872 47.7% Electrical & Computer 3,732 37.8% Management Sciences 490 32.2% Mechanical & Mechatronics 3,404 47.2% Systems Design 1,441 47.7% TOTAL 14,475 42.6%
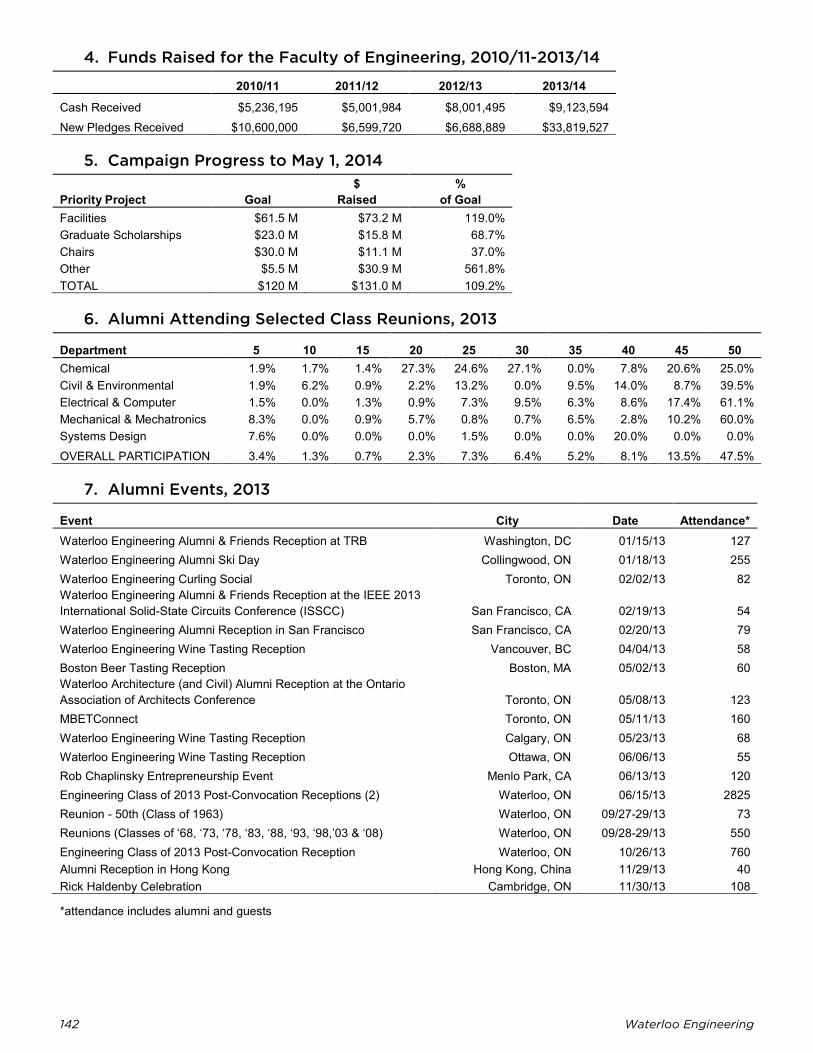
142 Waterloo Engineering
4. Funds Raised for the Faculty of Engineering, 2010/11-2013/14
2010/11 2011/12 2012/13 2013/14 Cash Received $5,236,195 $5,001,984 $8,001,495 $9,123,594 New Pledges Received $10,600,000 $6,599,720 $6,688,889 $33,819,527
5. Campaign Progress to May 1, 2014
Priority Project Goal $
Raised %
of Goal Facilities $61.5 M $73.2 M 119.0% Graduate Scholarships $23.0 M $15.8 M 68.7% Chairs $30.0 M $11.1 M 37.0% Other $5.5 M $30.9 M 561.8% TOTAL $120 M $131.0 M 109.2%
6. Alumni Attending Selected Class Reunions, 2013
Department 5 10 15 20 25 30 35 40 45 50 Chemical 1.9% 1.7% 1.4% 27.3% 24.6% 27.1% 0.0% 7.8% 20.6% 25.0% Civil & Environmental 1.9% 6.2% 0.9% 2.2% 13.2% 0.0% 9.5% 14.0% 8.7% 39.5% Electrical & Computer 1.5% 0.0% 1.3% 0.9% 7.3% 9.5% 6.3% 8.6% 17.4% 61.1% Mechanical & Mechatronics 8.3% 0.0% 0.9% 5.7% 0.8% 0.7% 6.5% 2.8% 10.2% 60.0% Systems Design 7.6% 0.0% 0.0% 0.0% 1.5% 0.0% 0.0% 20.0% 0.0% 0.0% OVERALL PARTICIPATION 3.4% 1.3% 0.7% 2.3% 7.3% 6.4% 5.2% 8.1% 13.5% 47.5%
7. Alumni Events, 2013
Event City Date Attendance*Waterloo Engineering Alumni & Friends Reception at TRB Washington, DC 01/15/13 127 Waterloo Engineering Alumni Ski Day Collingwood, ON 01/18/13 255 Waterloo Engineering Curling Social Toronto, ON 02/02/13 82 Waterloo Engineering Alumni & Friends Reception at the IEEE 2013 International Solid-State Circuits Conference (ISSCC) San Francisco, CA 02/19/13 54 Waterloo Engineering Alumni Reception in San Francisco San Francisco, CA 02/20/13 79 Waterloo Engineering Wine Tasting Reception Vancouver, BC 04/04/13 58 Boston Beer Tasting Reception Boston, MA 05/02/13 60 Waterloo Architecture (and Civil) Alumni Reception at the Ontario Association of Architects Conference Toronto, ON 05/08/13 123 MBETConnect Toronto, ON 05/11/13 160 Waterloo Engineering Wine Tasting Reception Calgary, ON 05/23/13 68 Waterloo Engineering Wine Tasting Reception Ottawa, ON 06/06/13 55 Rob Chaplinsky Entrepreneurship Event Menlo Park, CA 06/13/13 120 Engineering Class of 2013 Post-Convocation Receptions (2) Waterloo, ON 06/15/13 2825 Reunion - 50th (Class of 1963) Waterloo, ON 09/27-29/13 73 Reunions (Classes of ‘68, ‘73, ‘78, ‘83, ‘88, ‘93, ‘98,’03 & ‘08) Waterloo, ON 09/28-29/13 550 Engineering Class of 2013 Post-Convocation Reception Waterloo, ON 10/26/13 760 Alumni Reception in Hong Kong Hong Kong, China 11/29/13 40 Rick Haldenby Celebration Cambridge, ON 11/30/13 108
*attendance includes alumni and guests
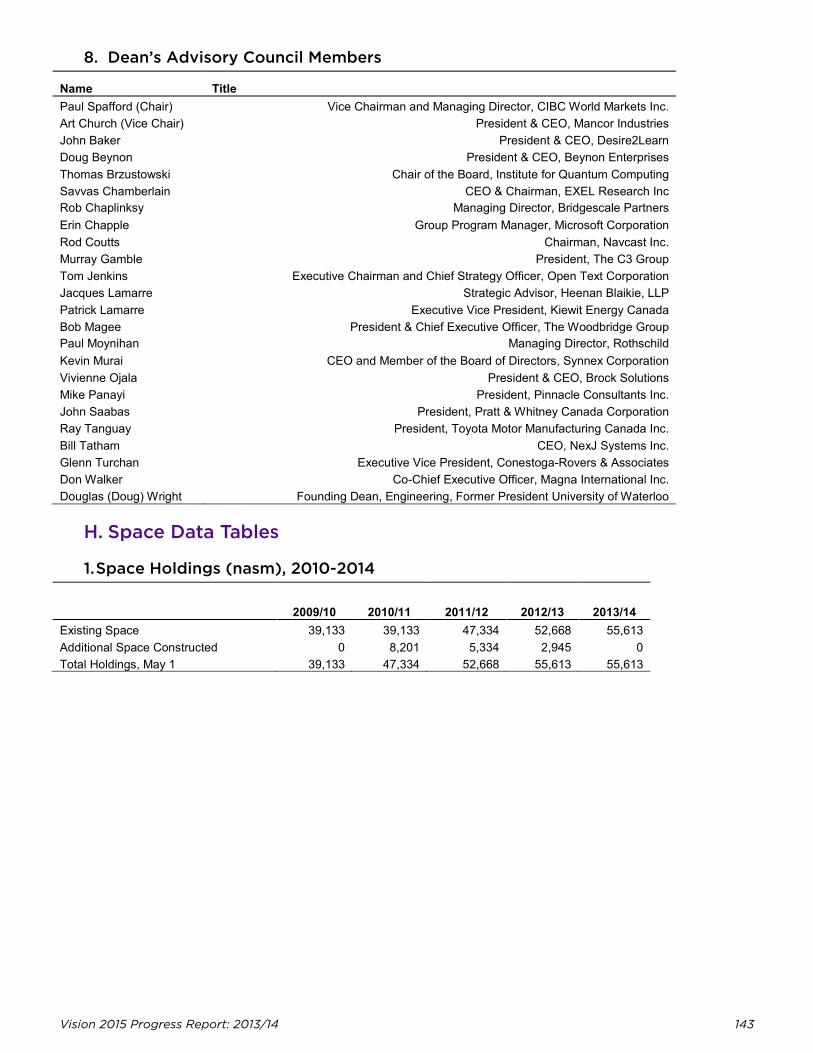
Vision 2015 Progress Report: 2013/14 143
8. Dean’s Advisory Council Members
Name Title Paul Spafford (Chair) Vice Chairman and Managing Director, CIBC World Markets Inc. Art Church (Vice Chair) President & CEO, Mancor Industries John Baker President & CEO, Desire2Learn Doug Beynon President & CEO, Beynon Enterprises Thomas Brzustowski Chair of the Board, Institute for Quantum Computing Savvas Chamberlain CEO & Chairman, EXEL Research Inc Rob Chaplinksy Managing Director, Bridgescale Partners Erin Chapple Group Program Manager, Microsoft Corporation Rod Coutts Chairman, Navcast Inc. Murray Gamble President, The C3 Group Tom Jenkins Executive Chairman and Chief Strategy Officer, Open Text Corporation Jacques Lamarre Strategic Advisor, Heenan Blaikie, LLP Patrick Lamarre Executive Vice President, Kiewit Energy Canada Bob Magee President & Chief Executive Officer, The Woodbridge Group Paul Moynihan Managing Director, Rothschild Kevin Murai CEO and Member of the Board of Directors, Synnex Corporation Vivienne Ojala President & CEO, Brock Solutions Mike Panayi President, Pinnacle Consultants Inc. John Saabas President, Pratt & Whitney Canada Corporation Ray Tanguay President, Toyota Motor Manufacturing Canada Inc. Bill Tatham CEO, NexJ Systems Inc. Glenn Turchan Executive Vice President, Conestoga-Rovers & Associates Don Walker Co-Chief Executive Officer, Magna International Inc. Douglas (Doug) Wright Founding Dean, Engineering, Former President University of Waterloo
H. Space Data Tables
1. Space Holdings (nasm), 2010-2014
2009/10 2010/11 2011/12 2012/13 2013/14 Existing Space 39,133 39,133 47,334 52,668 55,613 Additional Space Constructed 0 8,201 5,334 2,945 0 Total Holdings, May 1 39,133 47,334 52,668 55,613 55,613
144 Waterloo Engineering
I. Data Notes
Acronyms and Abbreviations Acad Academic Unit (department, school or academic centre) Admin Administrative Unit or Administrative Staff ARCH Architecture (school or program) Assoc Prof Associate Professor Asst Prof Assistant Professor CEE Civil & Environmental Engineering Department CHE Chemical Engineering (department or program) CIHR Canadian Institutes for Health Research CIVE Civil Engineering (program) CE Computer Engineering (program) Conrad Conrad Business, Entrepreneurship & Technology Centre CPR Canadian or Permanent Resident Def Term Definite Term DOE Dean of Engineering Office ECE Electrical & Computer Engineering Department EE Electrical Engineering (program) Enrol’t Enrolment ENVE Environmental Engineering (program) ERA Early Researcher Award (formerly Premier’s Research Excellence Award or PREA) Ext External FOE Faculty of Engineering FTE Full-time equivalent GENE Undergraduate students not registered in an academic program (e.g. exchange students and
students registered in the Qualifying Program for Readmission) GEOE Geological Engineering (program) GRS Graduate Research Studentship Int’l International Lect Lecturer ME Mechanical Engineering (program) MCTR Mechatronics Engineering (program) MGMT Management Engineering (program) MME Mechanical & Mechatronics Engineering Department MSCI Management Sciences Department MTCU Ministry of Training, Colleges and Universities NANTE Nanotechnology Engineering (program) nasm Net assignable square metre Non-Deg Non-degree (for graduate students, includes diploma and certificate students) NSERC Natural Sciences and Engineering Research Council OCE Ontario Centres of Excellence ORF Ontario Research Fund (RE = Research Excellence & RI = Research Infrastructure) PostDoc Post-doctoral Fellow Prof Professor Prof Master Professional Master (i.e. coursework; without a thesis) Rsch Assoc Research Associate Rsch Master Research Master (i.e. with a thesis) Rsch Prof Research Professor RTI Research Tools and Instruments (NSERC Program) Schlp Scholarship SDE Systems Design Engineering (department or program) SE Software Engineering (program) SSHRC Social Sciences and Humanities Research Council TA Teaching Assistant Tech Technical Staff TTS Tenured and tenure-stream faculty UAE United Arab Emirates (where Waterloo formerly had a campus, in Dubai) Univ University
Vision 2015 Progress Report: 2013/14 145
Notes on Tables 1 Key Metrics
Space Holdings excludes Architecture and Conrad In May 2014 previous space holdings calculations, which included projections for space under construction, were updated with actual figures. Baseline and previous year data have been restated with actuals.
2 Key Performance Indicators Undergraduate Students/Faculty excludes CSTV faculty (included elsewhere in Systems Design) and excludes proportion of students in joint programs with other Faculties Graduate Students/Faculty includes only tenured and tenure-stream faculty Space Holdings/Student, Sponsored Research Funds/Faculty and Sponsored Research Funds/Budget exclude Architecture and Conrad Budget/Student is widely considered an acceptable measure of the richness of a unit’s educational program and is not intended to represent the amount of money spent directly on each student
3 Institutional Context Source for each metric is consistent with its measurement described below
4 Provincial and National Context Source: Engineers Canada enrolment and degrees report (most recent available) Per Engineers Canada guidelines, excludes Architecture and new programs yet to be accredited
Data Definitions and Sources A1 Total Regular Faculty
Source: Dean of Engineering Office | As of: May 1 Excludes definite-term, research and visiting professors; excludes faculty members in full-time senior university administrative positions (e.g. president); Excludes positions not yet filled on May 1 Systems Design includes CSTV
A2 Distribution of Regular Faculty by PEng Status Source: Associate Dean, Co-operative Education & Professional Affairs | As of: May 1 Excludes faculty in Architecture, Conrad and CSTV; ineligible=degree(s)from a discipline ineligible for PEng
A3 Distribution of Regular Faculty by Age Source: Dean of Engineering Office | As of: May 1
A4 Distribution of TTS Faculty by PhD School Source: Dean of Engineering Office | As of: May 1 Excludes faculty who do not hold a PhD
A5 Total Non-regular and Non-faculty Appointments Source: Dean of Engineering Office | As of: May 1 Count of current appointments on May 1(note: a small proportion of individuals might hold multiple appointments)
A6 Selected Major Faculty Awards and Honours Source: Dean of Engineering Office | As of: Dec. 31
A7 FTE Staff Source: Waterloo Human Resources | As of: May 1 Full-time equivalent filled positions paid from the operating budget Research institutes include WatCAR, WIN and WISE; in previous years’ reports, Graduate, Research and Outreach Offices were included in Dean’s Office-admin; Undergraduate Office includes Teaching Office and Student Design Centre staff Excludes positions which were under recruitment/not yet filled on May 1
A8 Distribution of FTE Staff by Age Source: Waterloo Human Resource | As of: May 1
A9 Staff Awards and Honours Source: Dean of Engineering Office | As of: Dec. 31
A10 Faculty:Staff Ratios Total regular faculty/FTE staff paid from the operating budget Faculty Total includes staff and faculty in administrative units (e.g. Dean’s Office, Machine Shop, Undergraduate Office, etc.); Academic Units Only excludes support units
B1 Total Undergraduate Enrolment (head count) Source: Waterloo Institutional Analysis and Planning Office | As of: Nov.1 All undergraduates registered in the fall term (in class or on co-op) on MTCU count date Includes students on official co-op work term; includes all students in programs offered jointly with other faculties (i.e. software and nanotechnology); excludes part-time students; excludes students in GENE
46 Waterloo Engineering
B2 FTE Undergraduate Enrolment Source: Waterloo Institutional Analysis and Planning Office | As of: March 1 Equivalent student registrations in two academic terms in a year; this counters the impact of our co-op program, due to which a proportion of students will have 2 work terms and 1 academic term in a given year Annual FTE= (spring + fall + winter registrations, excluding students on co-op)/2 Includes all students in programs offered jointly with other faculties (i.e. software and nanotechnology); excludes part-time students; excludes students in GENE
B3 Undergraduate Degrees Granted Source: Waterloo Institutional Analysis and Planning Office | As of: Dec. 31 Total engineering undergraduate students graduating in the calendar year Includes all students in programs offered jointly with other faculties (i.e. software and nanotechnology); count by first major (double-major degrees are counted only once)
B4 Undergraduate Year One New Admissions Source: Waterloo Institutional Analysis and Planning Office | As of: Nov. 1 Total new engineering undergraduates registered in the fall term on MTCU count date Includes all students in programs offered jointly with other faculties (i.e. software and nanotechnology); Total 1A Enrolment includes continuing students returning to 1A
B5 Undergraduate Admissions by Average Grade Ranges Source: Waterloo Registrar’s Office | As of: Nov. 1 Average based on best final 6 U or M courses; averages with .5% are rounded up (e.g.94.5% to 94.9% are included in 95%)
B6 Undergraduate Students:Faculty Ratio FTE undergraduate students/regular faculty members Regular faculty here excludes CSTV faculty (included elsewhere in Systems Design); FTE students here exclude ½ of software students and ⅓ of nanotechnology students; mechatronics students are allocated 3/5 to MME, 1/5 to ECE and 1/5 to SDE
B7 Undergraduate Degrees Granted:Faculty Ratio Engineering undergraduate degrees granted/regular faculty members Regular faculty here excludes CSTV faculty (included elsewhere in Systems Design); FTE students here exclude ½ of software students and ⅓ of nanotechnology students; mechatronics students are allocated 3/5 to MME, 1/5 to ECE and 1/5 to SDE
B8 Co-op Employment Source: Waterloo Co-operative Education & Career Action Office | As of: Dec. 31 Excludes students who advised CECA that they were not seeking employment or who did not participate in the interview process and did not provide information on their status % international placements is share of “employed” terms outside of Canada
B9 Co-op Earnings Source: Waterloo Co-operative Education & Career Action Office JOBMINE | As of: May 1 Total student earnings are estimated using average salaries Does not include wages earned internationally
B10 Undergraduate Exchange Participation Source: Engineering Exchange Office | As of: Dec. 31
C1 Total Graduate Enrolment (head count) Source: Waterloo Institutional Analysis and Planning Office | As of: Nov.1 All graduate students registered in fall term (full-time or part-time) on MTCU count date Nanotechnology students are counted in the department in which they are registered; includes non-degree students (which include diploma and certificate programs)
C2 FTE Graduate Enrolment Source: Waterloo Institutional Analysis and Planning Office | As of: May 1 FTE = (SpringFTE+FallFTE+WinterFTE)/3 | Each term’s FTE = FT+(PT*0.3) Nanotechnology students are counted in the department in which they are registered; non-degree students are excluded
C3 Graduate Degrees Granted Source: Waterloo Institutional Analysis and Planning Office | As of: Dec. 31 Total engineering graduate students graduating in the calendar year Nanotechnology students are counted in the department in which they are registered; count by first major (double-major degrees are counted only once)
C4 FTE Graduate Student Admissions Source: Waterloo Institutional Analysis and Planning Office | As of: Nov.1 Total of FTE (FT+(PT*0.3)) of all new graduate student admissions in 3 terms (calendar year) Nanotechnology students are counted in the department in which they are registered; non-degree students are excluded; coursed-based master are included with professional master prior to 2012
Vision 2015 Progress Report: 2013/14 147
C5 Graduate Students:Faculty Ratio FTE graduate students/tenured and tenure-stream faculty members All Students includes non-degree students; Research Students includes PhD+Research Master students only; totals might not add precisely due to rounding
C6 Graduate Degrees Granted:Faculty Ratio Graduate degrees granted/TTS faculty members
C7 Graduate Proportion of Total FTE Enrolment FTE graduate students/(FTE graduate students+FTE undergraduate students)
C8 Graduate Student Financial Support Source: Waterloo Graduate Studies Office | As of: May 1
D1 Total Sponsored Research Funding Source: Waterloo Office of Research | As of: May 1 Research funding data presented in multi-year graphs are the most up-to-date data available, and include Office of Research corrections made to previous years’ funding after the final report for that year. Tabular data are not restated.
D2 Total Tri-Council Funding Source: Waterloo Office of Research | As of: May 1
D3 NSERC Funding by type Source: Waterloo Office of Research | As of: May 1 Discovery includes Accelerator Supplements; Partnerships was formerly called Industry
D4 University of Waterloo Share of NSERC Funding and Awards in Engineering Subject Groups Source: NSERC Awards Database | As of: May 1 Includes NSERC awards and funding earned by any University of Waterloo researcher in 19 NSERC research subject areas (comprised of 157 subjects) identified as related to engineering (Agricultural Eng, Artificial Intelligence, Biomedical Eng, Chemical Eng, Civil Eng, Design&Manufacturing, Electrical&Electronic Eng, Environmental Eng, Fluid Mechanics, Forest Eng, Fuel&Energy Tech, Industrial Eng, Information Tech, Materials Sci&Tech, Mechanical Eng, Mining&Mineral Processing, Nuclear Eng, Robotics, Structural Eng)
D5 Provincial Funding by type Source: Waterloo Office of Research | As of: May 1 Other includes Ministry, FedDev and Ontario Research Chair funding
D6 Industry Funding by source Source: Waterloo Office of Research | As of: May 1
D7 Total Sponsored Research Funding:Faculty Ratio Sponsored research funds/tenured and tenure-stream faculty members
D8 Total Sponsored Research Funding:Budget Ratio Sponsored research funds/permanent recurring budget
D9 Research Chair Holders Source: Engineering Research Office & Dean of Engineering Office | As of: May 1
D10 University of Waterloo Publications in Engineering or Materials Science Journals Indexed by Thomson Reuters Source: InCitesTM, Thomson Reuters (2012). Report Created: 28-May-14 Data Processed March 31, 2014 Data Source: Web of Science ® | As of: March 31, 2014 Limited to publications in journals indexed by Thomson Reuters. Includes publications by all researchers affiliated with the University of Waterloo in journals classified by Thomson Reuters Essential Science Indicators as engineering or materials science. Includes all documents published in each five-year period.
D11 Citations to University of Waterloo Publications in Engineering or Materials Science Journals Indexed by Thomson Reuters Source: InCitesTM, Thomson Reuters (2012). Report Created: 28-May-14 Data Processed March 31, 2014 Data Source: Web of Science ® | As of: March 31, 2014 Includes citations to all publications that were included in the counts for item D10, above. Data is limited to citations in journals indexed by Thomson Reuters. Citation counts for each five-year period specified are only from citing articles in the same five-year period as the document publication dates. (E.g., 1991-1995 includes citations to documents published between 1991-1995 period, in citing articles that were also published between 1991-1995. A publication from 1993 that was cited in a citing article published in 1996 would not be counted here: It would be counted in the time periods of 1992-1996 and 1993-1997 only).
D12 Impact Relative to Subject (Engineering or Materials Science) of University of Waterloo Publications in Journals Indexed by Thomson Reuters Source: InCitesTM, Thomson Reuters (2012). Report Created: 28-May-14 Data Processed March 31, 2014 Data Source: Web of Science ® | As of: March 31, 2014 Impact relative to subject area=Impact (citations/documents) of an institution in a subject area relative to the impact of all institutions in the subject area overall. Publications and citations are both limited to Thomson Reuters-indexed journals and to publication in the five-year time period indicated.
_______________________________
148 Waterloo Engineering
E1 & E2
Women in Engineering Disciplines and Women in Architecture Undergraduate year one new admissions excludes continuing students, Nov. 1 All undergraduate students = head count, Nov. 1 Undergraduate degrees granted in the calendar year, Dec. 31 All graduate students = head count, Nov. 1 Graduate degrees granted for the calendar year, Dec. 31 Professors = regular faculty, May 1
F1 International Students Undergraduate year one new admissions excludes continuing students, Nov. 1 All undergraduate students = head count, Nov. 1 Undergraduate degrees granted in the calendar year, Dec. 31 Undergraduate Co-op Work Terms = # and % of “employed” terms outside Canada, Dec. 31 All graduate students = head count, Nov. 1 Graduate degrees granted for the calendar year, Dec. 31 Outgoing Exchange Students = Waterloo students on exchange elsewhere, Dec. 31 Incoming Exchange Students = Students studying at Waterloo on exchange, Dec. 31
G1 Total Alumni Source: Waterloo Office of Alumni Affairs | As of: Dec. 31 Total of all alumni who have graduated with a degree from Waterloo Engineering Includes all Architecture, Conrad, and software engineering alumni; includes deceased and honorary alumni; count by preferred major (each alumnus is counted only once)
G2 Engineering Alumni Donating to the University of Waterloo in the year Source: Waterloo Office of Alumni Affairs | As of: Dec. 31 Includes donations by alumni in the given calendar year
G3 Engineering Alumni Donating to the University of Waterloo in their lifetime Source: Waterloo Office of Alumni Affairs | As of: Dec. 31 Includes donations by alumni at any time before December 31 of the current year
G4 Funds Raised for the Faculty of Engineering Source: Waterloo Office of Development | As of: May 1 Cash Received includes all cash, gifts-in-kind and other gifts received (including payments on pledges counted in previous years); New pledges includes all pledges, cash, gifts-in-kind and other gifts raised (including those not paid this year)
G5 Campaign Progress to Date Source: Waterloo Office of Development | As of: May 1 Other priority projects include the Rome Program and Conrad, and other donations received for projects outside the identified priorities
G6 Alumni Attending Selected Class Reunions Source: Engineering Alumni Office | As of: Dec. 31 Includes only departments with an undergraduate program in the given reunion year
G7 Alumni Events Source: Engineering Alumni Office | As of: Dec. 31
G8 Dean’s Advisory Council Members Source: Engineering Advancement Office | As of: May 1
H1 Space Holdings Source: Waterloo Institutional Analysis and Planning Office | As of: May 1 Space Holdings excludes Architecture and Conrad In May 2014 previous space holdings calculations, which included projections for space under construction, were updated with actual figures. Baseline and previous year data have been restated with actuals.
ENGINEERING IDEAS CLINIC and the ENGINEERING IDEAS CLINIC LOGO are trademarks of the University of Waterloo. All rights reserved