Embed Size (px)
Citation preview
Viscosity of dilute polyelectrolyte solutionsJ. Cohen, Z. Priel, and Y. Rabin
Citation: The Journal of Chemical Physics 88, 7111 (1988); doi: 10.1063/1.454361 View online: http://dx.doi.org/10.1063/1.454361 View Table of Contents: http://scitation.aip.org/content/aip/journal/jcp/88/11?ver=pdfcov Published by the AIP Publishing Articles you may be interested in Nematic ordering in dilute solutions of rodlike polyelectrolytes J. Chem. Phys. 120, 10848 (2004); 10.1063/1.1739393 Dynamic viscoelasticity of dilute polyelectrolyte solutions J. Chem. Phys. 94, 4581 (1991); 10.1063/1.460586 Viscosity of dilute polyelectrolyte solutions: Temperature dependence J. Chem. Phys. 93, 9062 (1990); 10.1063/1.459197 The intrinsic viscosity of dilute polymer solutions J. Chem. Phys. 66, 5500 (1977); 10.1063/1.433869 Excess chemical potential of dilute solutions of spherical polyelectrolytes J. Chem. Phys. 60, 2721 (1974); 10.1063/1.1681434
This article is copyrighted as indicated in the article. Reuse of AIP content is subject to the terms at: http://scitation.aip.org/termsconditions. Downloaded to IP:
128.103.149.52 On: Tue, 03 Jun 2014 06:15:00
Viscosity of dilute polyelectrolyte solutions J. Cohen and Z. Priel Department of Chemistry. Ben-Gurion University. Beer-Sheva. Israel
Y. Rabins )
Chemical Physics Department. Weizmann Institute of Science. Rehovot 76100. Israel
(Received 20 July 1987; accepted 13 November 1987)
We have developed an apparatus which enables us to perform accurate measurements of the shear viscosity of low ionic strength, dilute polyelectrolyte solutions, down to polymer concentrations below one part per million. We have shown that a theoretical expression for the viscosity of such solutions can be derived using the mode-mode coupling approximation to the hydrodynamics of charged Brownian spheres. Very good agreement between the predicted and observed polymer and salt concentration and molecular weight dependence of the viscosity is observed in the low-added salt, dilute solution range. Furthermore, it appears that the theory gives a qualitatively correct description of the viscosity of semidilute solutions, indicating that independent of polyion concentration, the hydrodynamics of low ionic strength polyelectrolyte solutions is dominated by electrostatic repulsion between polyions.
I. INTRODUCTION
Early investigations of the anomalous viscosity of polyelectrolyte solutions without added salt appeared to suggest that the reduced viscosity would increase without limit as one lowers the polyion concentration. I However, a careful investigation of the dilute solution behavior revealed that the apparently unbounded rise of the reduced viscosity is always followed by a maximum and normal polymer behavior is recovered at the extrapolated limit of zero polyelectrolyte concentration.2 It has been argued that the observed behavior is a consequence of the screening oflong-range intermolecular interactions by the residual electrolyte in the solution,2
an explanation supported by the observation of "regular" neutral polymer behavior upon isoionic dilution of polyelectrolyte solutions.3.4·22
In this work we have measured the reduced viscosity of strong polyelectrolytes in the dilute concentration range, down to polymer concentrations < 1 ppm. We have studied the molecular weight dependence of the viscosity using narrowly monodisperse samples of fully sulfonated sodium polystyrene in the molecular weight range 16000--690000. The salt concentration was varied from the so-called, "saltfree" conditions characteristic of polyelectrolyte behavior, to high NaCI concentrations at which neutral polymer behavior was recovered.
The experimental apparatus including the viscometer, thermostat, and the time of flow measuring system and the materials used, are described in Sec. II. Section III presents our experimental results, e.g., the transition between low and high salt regimes of the reduced viscosity (1] s Ie ) upon dd' . f P P
a lilon 0 salt, the peak in 1]splep as one varies the polymer concentration (cp ), the linear molecular weight dependence of (1]splcp ) max and the linear relation between Cs and cp at
a) Bat-Sheva de Rosthchild Fellow.
( 1] sp Ie p ) max' In Sec. IV we present a theoretical model for the shear viscosity of dilute polyelectrolyte solutions. A formal expression for the viscosity of charged Brownian spheres is presented and then evaluated using as an input a modified mean spherical approximation for the direct correlation function and the experimentally known behavior of the static structure factor in dilute polyelectrolyte solutions. We show that the result is equivalent to the one obtained in the weak coupling approximation for the viscositr provided that the polyion charge Z is replaced by an effective charge Z· and explain the renormalization of charge in terms of the "correlation hole" effect. The resulting expression for the dilute solution viscosity appears to be in very good agreement with our experimental results. Furthermore, it is nearly identical to the one recently proposed for semidilute polyelectrolyte solutions6 and, to the best of our knowledge, contains all the qualitative features observed in viscometric investigations of dilute and semidilute solutions. This apparent universality suggests that electrostatic repulsion between polyions dominates over entanglements in the semidilute regime and that the overlap concentration (c·) is not relevant to considerations of the (small shear, low frequency) hydrodynamic behavior of polyelectrolyte solutions.
II. EXPERIMENTAL
A. Materials
The polyelectrolyte used in the experiment was fully sulfonated sodium neutralized polystyrene (Pressure Chemical Co. Pittsburgh, PA). These polymers are prepared by the "living polymer" polymerization method and possess a very sharp molecular weight distribution (MwiMn ranging from 1.0034 for M w = 16 000 to 1.1 for M w = 690 000). All other materials which were used are analytical grade. Doubly distilled water was further filtered through millipore cleaning device (pore size 0.22 pm) until the resistance was 18 M!lcm.
J. Chern. Phys. 88 (11), 1 June 1988 0021-9606/88/117111-06$02.10 @ 1988 American Institute of Physics 7111 This article is copyrighted as indicated in the article. Reuse of AIP content is subject to the terms at: http://scitation.aip.org/termsconditions. Downloaded to IP:
128.103.149.52 On: Tue, 03 Jun 2014 06:15:00
7112 Cohen, Priel, and Rabin: Dilute polyelectrolyte solutions
B. Viscometer
The apparatus used in this work was an automatic Vbbelohde-type viscometer with a differential photodiode which enabled us to measure flow times of the order 500 s with accuracy of ± 100 ",s. In order to get such high reproducibility the following requirements have to be satisfied: ( 1) The thermostat used must have long-time thermal stability of at least ± 5 X 10⁻⁶ DC, (2) the viscometer has to be efficiently insulated from the outside, (3) a standard procedure for cleaning and preparing the glass surface should be devised, (4) the bulb and capillary of the viscometer have to be maintained in contact with the experimental liquid, (5) reproducible adjustment of the position of the viscometer has to be insured, and (6) a means must be developed to measure a time of about 103 s to within 100 ",s.
A serious drawback of our experimental technique is the relatively high shear rate in the capillary viscometer (the measurements were performed at average shear rates of 600 1/s). We could not carry out extensive studies of the shear dependence but no changes in the viscosity were observed when the shear rate was lowered to 300 1/s. Although, in general, one expects strong shear thinning of the viscosity of low-salt semidilute solutions of high molecular weight polyelectrolytes,2 the effect appears to be much smaller for low molecular weight polyions 7 and the qualitatively similar behavior we have observed for polyions in the molecular weight range 16 ()()(}"'690 000, indicates that shear thinning does not play an important role in the dilute concentration regime probed by our experiments. We have used dynamic light scattering to test against the possibility of degradation but no detectable effect was observed upon passage through the viscometer.
c. Time of flow measuring system Flow times of the order of500 s are measured with accu
racy of ± 10-4 s by the procedure reported in Ref. 8. Infrared light from an emitting diode (Motorola MLEO-930) is conducted on the upper capillary of the viscometer by an image fiber (Edmund Sci. Catalog No. 40643). When the liquid in the upper capillary passes through the light path, the change in index of refraction produces a corresponding change in the intensity of transmitted light. The light which passes the capillary is conducted by another image fiber to a differential photodiode (Siemens, BPX 48). The change in light intensity is converted to voltage by the photodiode and after amplification by a factor of 103_104
, we get relatively high (6-8 V) parabola-shaped pulse. The trigger level is adjusted close to the maximum of the parabola and when the pulse is crossing this level the counter starts to count time with accuracy of ± 10-4 s. This procedure is repeated when the meniscus reaches the lower capillary at the end of the bulb except that now the pulse stops the counter. The time recorded corresponds to the flow of a given volume ofliquid. This procedure is automatically repeated at least ten times and the results are averaged.
D. Thermostat The thermostat has been designed to give temperature
stability of ± 5 X 10⁻⁶ DC overperiodsofweeks.9 Heat input
to the thermostat is derived by stirring only. The temperature balance is maintained by changes in the speed of stirring in accordance with the state of a thermistor-based AC Wheatstone bridge. This method obviates hot spots inside the thermostat and therefore decreases the temperature gradients. It also eliminates the electric and magnetic fields usually created by heating elements which introduce considerable noise into the sensor. The thermostat has a stabilization factor of the order of 106 with respect to room temperature fluctuations.
E. Solutions
All solutions were prepared by weighing, using an analytical balance with an accuracy of ± 1 X 10⁻⁵ g. The balance was checked and calibrated before every weighing.
III. RESULTS
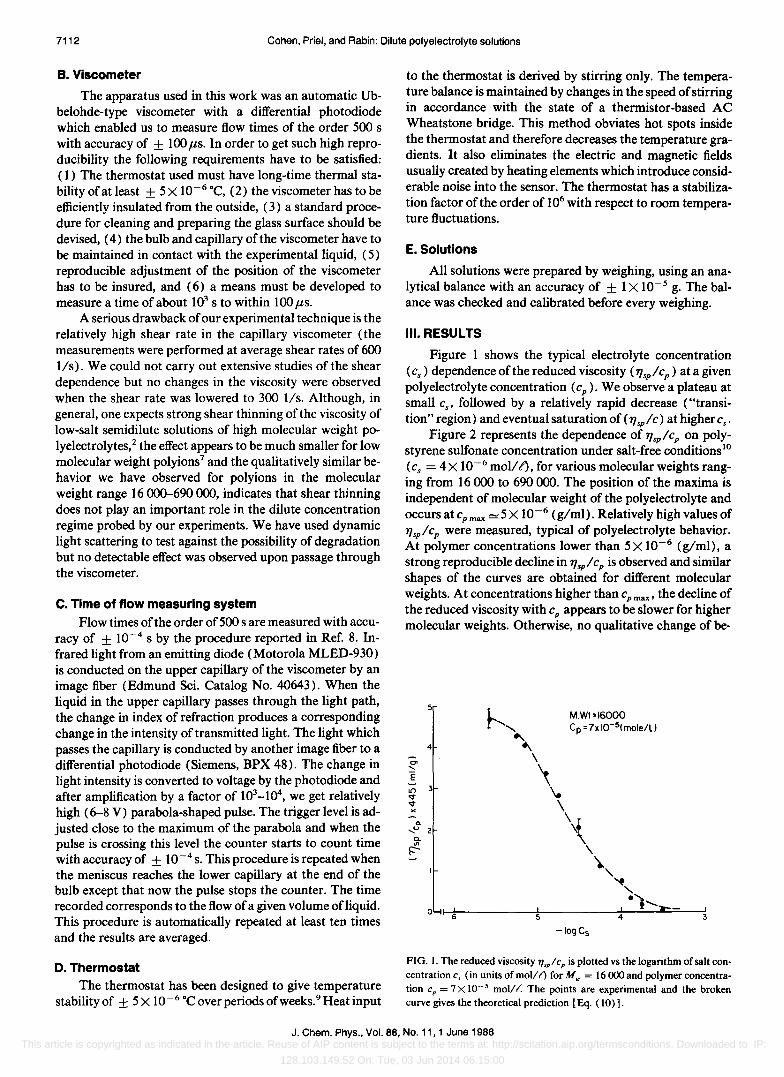
Figure 1 shows the typical electrolyte concentration (cs ) dependence of the reduced viscosity (7Jsplcp) at a given polyelectrolyte concentration (cp )' We observe a plateau at small Cs ' followed by a relatively rapid decrease ("transition" region) and eventual saturation of (7Jsplc) at highercs.
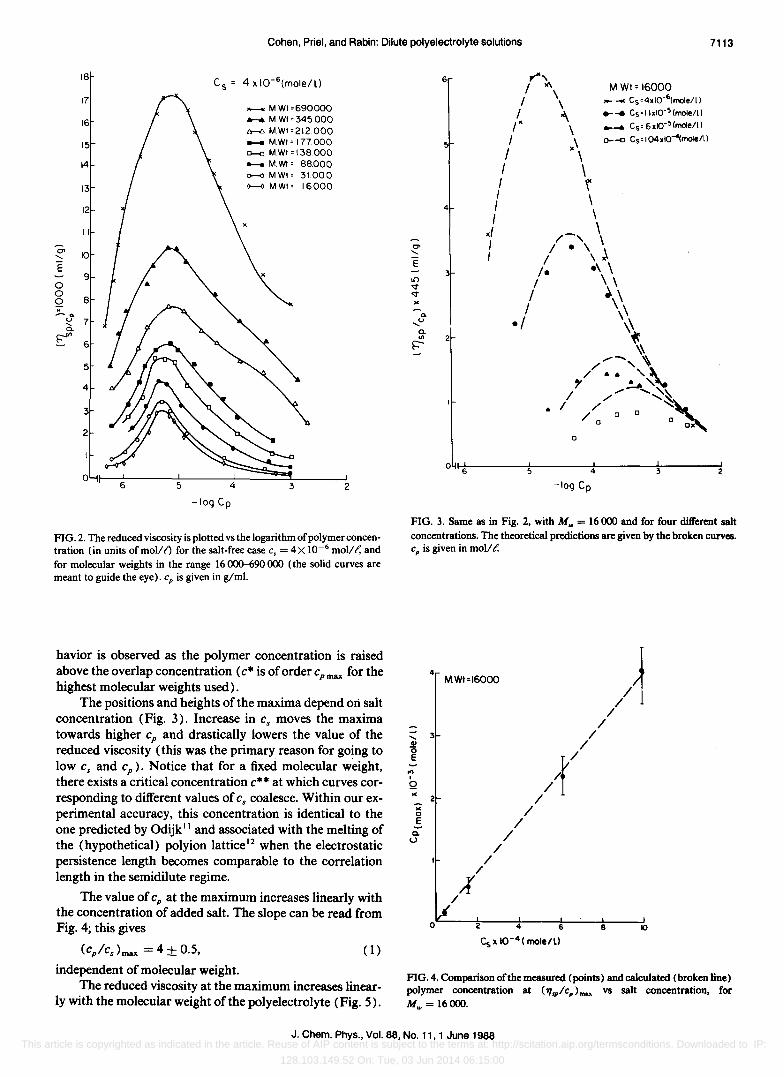
Figure 2 represents the dependence of 7Jsplcp on polystyrene sulfonate concentration under salt-free conditions lO
(cs = 4x 10⁻⁶ molll) , for various molecular weights ranging from 16 000 to 690 000. The position of the maxima is independent of molecular weight of the polyelectrolyte and occurs at cpmax =5 X 10⁻⁶ (g/mi). Relatively high values of 7Jsplcp were measured, typical of polyelectrolyte behavior. At polymer concentrations lower than 5 X 10⁻⁶ (g/mi), a strong reproducible decline in 7Jsplcp is observed and similar shapes of the curves are obtained for different molecular weights. At concentrations higher than cp max' the decline of the reduced viscosity with cp appears to be slower for higher molecular weights. Otherwise, no qualitative change of be-
'" "-E
5
4
U1 3 V V ><
o I 6
MWI = 16000 Cp = 7x 10⁻⁵(mole/l)
5 4
-logCs
FIG. I. The reduced viscosity 1],p/cp is plotted vs the logarithm of salt concentration c, (in units of mol/I) for Mw = 16000 and polymer concentration cp = 7 X 10⁻⁵ mol/ f. The points are experimental and the broken curve gives the theoretical prediction [Eq. (10)].
J. Chern. Phys., Vol. 88, No. 11, 1 June 1988 This article is copyrighted as indicated in the article. Reuse of AIP content is subject to the terms at: http://scitation.aip.org/termsconditions. Downloaded to IP:
128.103.149.52 On: Tue, 03 Jun 2014 06:15:00
Cohen, Priel, and Rabin: Dilute polyelectrolyte solutions 7113
18
17
16
15
14
13
12
II
~ 10
o o
9
o 8 . ~ ..
u 7 0.
f:""6
5
4
3
2
__ MWI=690000 ...... M WI = 345000 r.-t:> MWt=212 000 ..... MWf= 177000 G-<J MWf = 138000 _ MWI= 88000
0-0 MWf = 31000 0--0 MWf = 16000
0~r--~6------~5-------4~----~~3------~2
-log Cp
FIG. 2. The reduced viscosity is plotted vs the logarithm of polymer concentration (in units of mol! t) for the salt-free case c, = 4 X 10⁻⁶ mol! f, and for molecular weights in the range 16 00<Hl90 000 (the solid curves are meant to guide the eye). cp is given in glml.
havior is observed as the polymer concentration is raised above the overlap concentration (c· is of order cpmax for the highest molecular weights used).
The positions and heights of the maxima depend on salt concentration (Fig. 3). Increase in c s moves the maxima towards higher cp and drastically lowers the value of the reduced viscosity (this was the primary reason for going to low Cs and cp )' Notice that for a fixed molecular weight, there exists a critical concentration c·· at which curves corresponding to different values of Cs coalesce. Within our experimental accuracy, this concentration is identical to the one predicted by Odijk II and associated with the melting of the (hypothetical) polyion lattice l2 when the electrostatic persistence length becomes comparable to the correlation length in the semidilute regime.
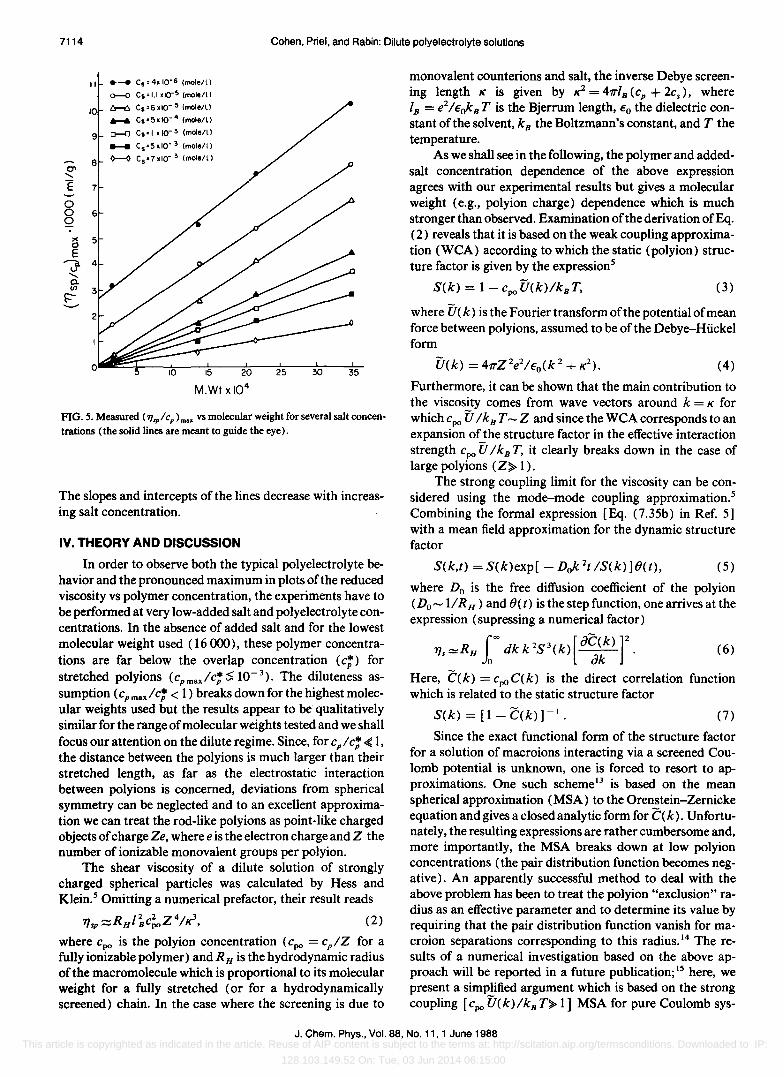
The value of cp at the maximum increases linearly with the concentration of added salt. The slope can be read from Fig. 4; this gives
(cplcs ) max = 4 ± 0.5, (1)
independent of molecular weight. The reduced viscosity at the maximum increases linear
ly with the molecular weight of the polyelectrolyte (Fig. 5).
6
4
o
o I~
-log Cp
M WI= 16000 _ ..... Cs=4xI0-6 (moIe/l)
....... Cs=t IxIO-~(molell)
...... Cs=6xl(y5(moIell)
~~ Cs=I.04xI04mo1e/L)
3
FIG. 3. Same as in Fig. 2, with Mw = 16000 and for four different salt concentrations. The theoretical predictions are given by the broken curves. Cp is given in mol/I.
"-... '0 E
.., I
Q
'" ';:( 0 E
Q.
U
4
3
2
MWI = 16000 1 //1
/ (
X /
/ /
/
/ /
/
A/ / /
/ /
OL---~2~--~4~--~6~--~B~--~~
Cs x 10-4( mole/L)
FIG. 4. Comparison of the measured (points) and calculated (broken line) polymer concentration at (7J",/cp)..... vs salt concentration, for Mw = 16000.
J. Chern. Phys., Vol. 88, No. 11,1 June 1988 This article is copyrighted as indicated in the article. Reuse of AIP content is subject to the terms at: http://scitation.aip.org/termsconditions. Downloaded to IP:
128.103.149.52 On: Tue, 03 Jun 2014 06:15:00
7114 Cohen, Priel, and Rabin: Dilute polyelectrolyte solutions
0" "-
II .- C. - 4, 10-6 (mololl) 0--0 C.-I.I 'IO-~ (mal,ll)
10 c.--c. C.-6 ,10- 5 (moI,/ll
....... Cs-5,10- 4 (mol,/l)
9 C>-G C. -I ,10- 3 (mole/ll
..... C.-5,10- 3 (mol.ll)
8 ~ Cs =7,1(J3 (mole/l)
E 7
o o 6 o
~ 5 E
"Cl. 4 u "-0-
'" ~ ..........
5 10 15 20
M.WI xl04
25 30 35
FIG. S. Measured (11,,'/ cp ) m .. vs molecular weight for several salt concentrations (the solid lines are meant to guide the eye).
The slopes and intercepts of the lines decrease with increasing salt concentration.
IV. THEORY AND DISCUSSION
In order to observe both the typical polyelectrolyte behavior and the pronounced maximum in plots of the reduced viscosity vs polymer concentration, the experiments have to be performed at very low-added salt and polyelectrolyte concentrations. In the absence of added salt and for the lowest molecular weight used (16000), these polymer concentrations are far below the overlap concentration (c;) for stretched polyions (cpmaJc; S 10-3
). The diluteness assumption (c p maJ c; < I) breaks down for the highest molecular weights used but the results appear to be qualitatively similar for the range of molecular weights tested and we shall focus our attention on the dilute regime. Since, for cplc; < I, the distance between the polyions is much larger than their stretched length, as far as the electrostatic interaction between polyions is concerned, deviations from spherical symmetry can be neglected and to an excellent approximation we can treat the rod-like polyions as point-like charged objects of charge Ze, where e is the electron charge and Z the number of ionizable monovalent groups per polyion.
The shear viscosity of a dilute solution of strongly charged spherical particles was calculated by Hess and Klein.5 Omitting a numerical prefactor, their result reads
(2)
where Cpo is the polyion concentration (cpo = cplZ for a fully ionizable polymer) and R H is the hydrodynamic radius of the macromolecule which is proportional to its molecular weight for a fully stretched (or for a hydrodynamically screened) chain. In the case where the screening is due to
monovalent counterions and salt, the inverse Debye screening length K is given by K- = 4trIB (cp + 2cs ), where I B = e21 Eok B T is the Bjerrum length, Eo the dielectric constant of the solvent, kB the Boltzmann's constant, and T the temperature .
As we shall see in the following, the polymer and addedsalt concentration dependence of the above expression agrees with our experimental results but gives a molecular weight (e.g., polyion charge) dependence which is much stronger than observed. Examination of the derivation ofEq. (2) reveals that it is based on the weak coupling approximation (WCA) according to which the static (polyion) structure factor is given by the expression5
S(k) = I - Cpo U(k)/kB T, (3)
where U (k) is the Fourier transform of the potential of mean force between polyions, assumed to be of the Debye-Hiickel form
(4)
Furthermore, it can be shown that the main contribution to the viscosity comes from wave vectors around k = K for which Cpo U I k B T - Z and since the WCA corresponds to an expansion of the structure factor in the effective interaction strength Cpo U I k B T, it clearly breaks down in the case of large polyions (Z> I ).
The strong coupling limit for the viscosity can be considered using the mode-mode coupling approximation.5
Combining the formal expression [Eq. (7.35b) in Ref. 5] with a mean field approximation for the dynamic structure factor
S(k,t) =S(k)exp[ -Dok2tIS(k)]()(t), (5)
where Do is the free diffusion coefficient of the polyion (Do-lIRH ) and ()(t) is the step function, one arrives at the expression (supressing a numerical factor)
17s =RH f" dk k 2S3(k) [ a~ik) r (6)
Here, C(k) = cpOC(k) is the direct correlation function which is related to the static structure factor
S(k) = [I - C(k)] -I • (7)
Since the exact functional form of the structure factor for a solution of macroions interacting via a screened Coulomb potential is unknown, one is forced to resort to approximations. One such schemel3 is based on the mean spherical approximation (MSA) to the Orenstein-Zernicke equation and gives a closed analytic form for C( k). Unfortunately, the resulting expressions are rather cumbersome and, more importantly, the MSA breaks down at low polyion concentrations (the pair distribution function becomes negative). An apparently successful method to deal with the above problem has been to treat the polyion "exclusion" radius as an effective parameter and to determine its value by requiring that the pair distribution function vanish for macroion separations corresponding to this radius. 14 The results of a numerical investigation based on the above approach will be reported in a future publication; 15 here, we present a simplified argument which is based on the strong coupling [cpo U(k)lkB T> I] MSA for pure Coulomb sys-
J. Chern. Phys., Vol. 88, No. 11, 1 June 1988 This article is copyrighted as indicated in the article. Reuse of AIP content is subject to the terms at: http://scitation.aip.org/termsconditions. Downloaded to IP:
128.103.149.52 On: Tue, 03 Jun 2014 06:15:00
Cohen, Priel, and Rabin: Dilute polyelectrolyte solutions 7115
terns. 16 In this limit, the direct correlation function can be written as
C(k) = -cpoU(k)f(k)lkBT, (8)
wheref(k) is a rapidly decaying oscillatory function of k {for one component plasma,f(k) = UI (kR)lkR ]2, where jl is a spherical Bessel function and R is the mean polyion separation}. We shall assume that the above form [Eq. (8)] holds also for the case of the screened Coulomb interaction and use the information obtained from light-scattering experiments on the static structure factor of dilute salt-free charged polyball17 and flexible polyelectrolyte l8 solutions, in order to approximate the integrand in Eq. (6).
We notice that S(k) possesses a broad maximum centered about a wave vector k * such that!8 k * <:::. O(K). At the maximum,17 S(k*);::: 1, which [seeEqs. (7) and (8)] indicates that If(k) I becomes very small as k-k *. The integral in Eq. (6) is dominated by the contributions of wave vectors for which both S(k) and (aC lak)2 are nonnegligible and thus only k values for which S(k) is of order unity need by considered. Therefore, we replace S(k) by unity in the integrand (actually, it can be somewhat larger but this will only change the result by a numerical factor of oE.der one) and, in order to estimate the contribution of the (aC I ak) 2 term, we notice that C(k) = 1 - lIS(k) is also of order unity in the range of interest. Substituting C(K) <:::.1 in Eq. (8) gives (in the limit of small added salt concentrations)
(9)
and, hence, we will approximate the direct correlation function by
C(k) <:::.cpo U(k)/ZkBT (8a)
inside the integrand in Eq. (6). Carrying out the remaining integration we finally obtain (up to a numerical prefactor)
lls<:::.RHI~c~/K3. (10)
Notice that if one replaces the polyion charge Z by a renormalized charge Z * such that
Z* =Z!12, (11 )
but retains the original Z dependence (number of counterions per polyion) in expression for the Debye screening length K-!, the above result becomes identical to the WCA expression [Eq. (2)]. This correspondence can be understood in terms of the "correlation hole" effect2!: As we have argued, the dominant contribution to the viscosity comes from wave vectors of order K for which the direct correlation function becomes small because of exclusion effects (strong electrostatic repulsion between polyions). Expanding Eq. (7) to first orderin C(k) and substituting from Eq. (8a) we arrive at the weak coupling result Eq. (3), where U(k) is replaced by the effective interaction U * (k) = 411Z *2e2 I Eo(k 2 + K2), with Z * defined in Eq. (11)
Inspection of Eq. (10) confirms that it contains all the qualitative features of our observations, including the following: (a) The existence of a maximum in llsplcp vs cp curves, (b) the height of the maximum is linearly proportional to the molecular weight of the polyion and decreases with salt concentration, and (c) the existence of a plateau at Cs ~cp when llsp/cp is plotted vs c" followed by a decrease at
higher salt concentrations. Within our experimental accuracy, the prediction (cplcs ) max = 4 is also confirmed (see Fig. 4). As can be seen in Figs. 1 and 3, the predicted reduced viscosity vs salt and polymer concentration curves, respectively, for M w = 16 000 are in very good agreement with our experimental observations for low salt concentrations. For higher salt concentrations, the calculated viscosity is systematically higher than experimental, possibly reflecting the decrease of the hydrodynamic radius due to increased electrostatic screening. We would like to stress that once the value of the missing multiplicative constant in Eq. (10) is fixed by fitting the experimental and theoretical values of ( n Ic) for a single salt concentration, the theory does "/sP p max .
not have any adjustable parameters. The results for higher molecular weights exhibit a systematic upward deviation of n I c at c > c • Provided that the approximations lead-·/sP p p pmax
ing to Eq. (10) remain valid, the deviation can be attributed to our neglect of purely hydrodynamic interactions and entanglement effects on the viscosity, both of which are expected to become important for higher molecular weights.
Returning to the close analogy between our expression for the reduced viscosity and Eq. (4) of Ref. 6, we notice that the model we have used (which was originally developed for dilute solutions of spherical polyions!5) appears to provide a reasonably accurate description of semidilute polymer solutions and, in fact, if charge renormalization of the type we have used could be extended to the semidilute regime, the molecular weight dependence of our Eq. (10) would be in better agreement with experimene9 than the Witten-Pincus mode1.6 The polymer and added-salt concentration dependences of both models are identical and both reproduce the phenomenological Fuoss law! llsplcp _lIc~,5 (at fixed cs ) and the observed phenomenon of isoionic dilution3,4
llsplcp -cp (at fixed ionic strength cp + 2cs ). The suggestion that polyelectrolytes behave similarly in
both the dilute and semidilute regimes of concentration, receives further support from recent quasielastic light scattering experiments on dilute, salt-free solutions!8 which reveal qualitatively similar features (a peak at momentum transfer corresponding to the inverse Debye screening length) to the ones observed by neutron scattering in the semidilute range.20 If, as was recently argued,6 the persistence length in the salt-free semidilute regime is compromised by interchain interactions which reduce it to O(K-!) (rather than the much larger Odijk length 11 ), we are tempted to conclude that, independent of polyion concentration, the behavior of low salt polyelectrolyte solutions is in many respects, similar to that of a dense fluid of hard spheres with effective hardcore radii K- I.
ACKNOWLEDGMENTS
Helpful conversations with S. Alexander, H, Eisenberg, S. Lifson, P. Pincus, Y. Rosenfeld, and A. Silberberg are gratefully acknowledged. One of us (Y.R.) would like to thank M. W. Kim for communicating his experimental results prior to publication. This work was supported in part by grants from the Bat-Sheva de Rotschild Foundation and from DARPA (through the La Jolla Institute), and by U. S.-Israel Binational Science Foundation Grant No. 2127.
J. Chern. Phys" Vol. 88, No. 11, 1 June 1988 This article is copyrighted as indicated in the article. Reuse of AIP content is subject to the terms at: http://scitation.aip.org/termsconditions. Downloaded to IP:
128.103.149.52 On: Tue, 03 Jun 2014 06:15:00
7116 Cohen, Priel, and Rabin: Dilute polyelectrolyte solutions
IR, M. Fuoss, J. Polym. Sci. 3, 603 (1948); 4, 96 (1949). 2H. Eisenberg and J. Pouyet, J. Polym. Sci. 13, 85 (1954). 3D. T. F. Pals and J. J. Hermans, Rec. Trav. Chem. 71, 433 (1952). ·C. Wolf, J. Phys. (Paris) 39, C2-169 (1978). 5W. Hess and R. Klein, Adv. Phys. 32, 173 (1983). 17. A. Witten and P. Pincus, Europhys. Lett. 3, 315 (1987). 7H. Vink, Macromol. Chem.131, 133 (1970). 8Z. Priel, J. Phys. E 13, 814 (1980). 9Z. Priel, J. Phys. Ell, 27 (1978). l"The polymer solutions were prepared under "free-atmosphere" condi
tions; no measures were taken to remove CO2, The measured pH was 5.4 and therefore the minimum ionic concentration was 4 X 10⁻⁶ mol! t'. This residual ionic concentration is often neglected in the literature and solutions prepared under similar conditions are commonly referred to as saltfree.
liT. Odijk, Macromolecules 12, 688 (1979).
12p. G. de Gennes, P. Pincus, R. M. Velasco, and F. Brochard, J. Phys. (Paris) 37, 1461 (1976).
13J. B. Hayter and J. Penfold, Mol. Phys. 42, 109 (1981). 14J. P. Hansen and J. B. Hayter, Mol. Phys. 46, 651 (1982). 15y' Rosenfeld and Y. Rabin (to be published). 16y. Rosenfeld, Phys. Rev. A 32,1834 (1985); 33, 2025 (1986). I7F. Griiner and W. Lehmann, J. Phys. A 12, L-303 (1979); IS, 2874
(1982). 18M. Drifford and J. P. Dalbiez, J. Phys. Chem. 88, 5368 (1984). 19M. W. Kim and D. G. Peiffer, Europhys. Lett. 5, 321 (1988). 20M. Nierlich, C. Williams, F. Boue, J. P. Cotton, M. Daoud, B. Farnoux,
G. Jannink, C. Picot, M. Moan, C. Wolff, M. Rinaudo, and P. G. de Gennes, J. Phys. (Paris) 40, 701 (1979).
2Ip. G. de Gennes, Scaling Concepts in Polymer Physics (Cornell University, Cornell, 1979).
22R. M. Davis and W. B. Russel, J. Po1ym. Sci. 24, 511 (1986).
J. Chern. Phys., Vol. 88, No. 11, 1 June 1988 This article is copyrighted as indicated in the article. Reuse of AIP content is subject to the terms at: http://scitation.aip.org/termsconditions. Downloaded to IP:
128.103.149.52 On: Tue, 03 Jun 2014 06:15:00