Embed Size (px)
Citation preview
Michael J. Grey
B.Sc. University of British Columbia 1990
THESIS SUBMITTED IN PARTIAL FULFILLMENT OF
THE REQUIREMENTS FOR THE DEGREE OF
MASTER OF SCIENCE
in the School
of
Kinesiology
0 Michael J. Grey 1997
SIMON FRASER UNIVERSITY
December 1997
All rights reserved. This work may not be reproduced in whole or in part, by photocopy or other means, without permission of the author.
National Library BiioWque nationale du Canada
Acqui$itions and Acquisitions et Bibliographic Services services bibliographiques .
395 Wekngton Street 395, rue Wdlingtm *-ON KlAON4 OttawaON K I A W Canada Canada
The author has granted a non- L'auteur a accorde une licence non exclusive licence allowing the exclusive pennettant a la National L i b r e of Canada to Bibliotheque nationale du Canada de reproduce, loan, distribute or sell reproduire, przter, lstribuer ou copies of thls thesis in microform, vendre des copies de cette these sous paper or electronic formats. la forme de microfichelfilm, de
reproduction sur papier ou sur format electronque.
The author retams ownershp of the L'auteur conserve la propriete du copyright in t h ~ s thesis. Neither the droit d'auteur qui protege cette these. thesis nor Substantial extracts fiom it Ni la these ni des extraits substantiels may be printed or otherwise de celle-ci ne doivent &re imprimes reproduced without the author's ou autrement reproduits sans son permission. autorisation. -
- s
APPROVAL
NAME: Michael J. Grey
DEGREE: Master of Science
TITLE OF THESIS:
Viscoelastic Properties Of The Human Wrist During The Stabilization
Phase Of A Targeted Movement
EXAMINING COMMITTEE:
CHAIR: Dr. M. P. Rosin, Professor
Dr. T. ,E. Milner, Associate Professor,
School of Kinesiology
Simon Fraser University
Senior Supervisor
Dr. P. N. S. Bawa, Professor
School of Kinesiology
Simon Fraser University
Supervisor
Dr. A. J. Hdgson, Assistant Professor
Department of Mechanical Engineering - University of British Columbia
E x t e r d Examiner
Date Approved: ~ E C . \ , 1977
ABSTRACT
Joint stability is a critical factor in the control of human movement. An
understanding of the methods by which the neuromuscular system maintains mechanical
stability in the face of a wide range of changing mechanical environments is important in
the accurate modeling of motor control dynamics.
Under normal operating conditions, the neuromuscular system is able to rapidly
modulate the mechanical impedance of a joint in order to maintain stability during postural
or movement tasks. This is particularly evident following a targeted movement; the
mechanics of the limb is controlled so that motion is stopped as quickly as possible with
minimal oscillation about the final position. In fact, the human motor control system is
very good at this type of task considering that rapid voluntary movements are most often
stopped without any noticeable oscillation.
The mechanical impedance of a joint consists of inertial, viscous, and elastic
components. Its mechanical properties are determined primarily by the activation of the
muscles that act about the joint. Stability is therefore effected by intrinsic muscle
properties and proprioceptive feedback. It has been suggested that reflex feedback from
muscle proprioceptors is responsible for damping oscillations. There is however, a body of
evidence that suggests the central nervous system may more readily employ viscoelastic
properties intrinsic to the muscle as a means of controlling joint stability. The intrinsic
elastic property of muscle has been investigated in detail, especially with respect to its role
in postural control. Viscous properties have not yet been studied in great depth.
The objective of this study was to investigate the intrinsic and reflexive viscoelastic
properties of the human wrist during the stabilization phase of a targeted voluntary
movement. The oscillation of the hand about its final position was exaggerated by reducing
the viscosity of the wrist joint with the aid of a robot manipulandum. The velocity trace
was modeled to estimate the viscoelastic properties of the joint. Wrist stiffness increased
when the target width was decreased. Both stiffness and viscosity increased for faster
movements and decreased when the distance to the target was increased.

DEDICATION
To my parents - without your support this work
could not have been accomplished
ACKNOWLEDGMENTS
I owe a great deal of thanks to my supervisor, Dr. Ted Milner, for his dedication,
support, and insistence in high standards of research; for allowing me the freedom to
make mistakes and learn from them. I am grateful to Dr. Parveen Bawa for her academic
support and, more importantly, for her friendship. I owe thanks to my good friends Rod
Rempel and David Franklin - one helped get me into the lab, the other urged me to get
out. Thanks are extended to Charles Pierce for his technical help and insightful
comments. Thanks are extended to all of my labmates with whom I worked, without
whose friendship this thesis would not have been nearly as enjoyable. I am indebted to
Shona McLean, Laurie Klak, and Sherry Lloyd - I would never have been able to weave
my way through the administrative "challenges" without your help. I have very much
appreciated the support and friendship of Dr. Silia Chadan, Craig Asmundson, and Dr.
Richard Ward throughout my stay at SFU. Finally, I must thank my subjects who
unselfishly volunteered their time for this study.
ABSTRACT ................................................................................................................................................ I11
DEDICATION ............................................................................................................................................ IV
ACKNOWLEDGMENTS ............................................................................................................................ V
TABLE OF CONTENTS ........................................................................................................................... VI
LIST OF TABLES ..................................................................................................................................... VII
LIST OF FIGURES ................................................................................................................................. VIII
INTRODUCTION ........................................................................................................................................ 1
WRIST ANATOMY ..................................................................................................................................... 3
MECHANICS ............................................................................................................................................... 6
MODELS OF MUSCLE MECHANICS ............................................................................................................... 6 INTRINSIC STIFFNESS AND VISCOSITY ......................................................................................................... 8 WHOLE MUSCLE VISCOELASTICITY .......................................................................................................... 12 SINGLE JOINT MECHANICS ........................................................................................................................ 16 MECHANICAL STABILITY .......................................................................................................................... 21
METHODS .................................................................................................................................................. 28
ANALYSIS .................................................................................................................................................. 38
........................................................................................................................................ EMG ANALYSIS 38 MECHANICAL IMPEDANCE PARAMETER ESTIMATION ............................................................................... 38 STATISTICAL ANALYSIS ............................................................................................................................ 40
RESULTS .................................................................................................................................................... 42
DISCUSSION ............................................................................................................................................. 65
CONCLUSION ........................................................................................................................................... 73
REFERENCES .......................................................................................................................................... 75
LIST OF TABLES
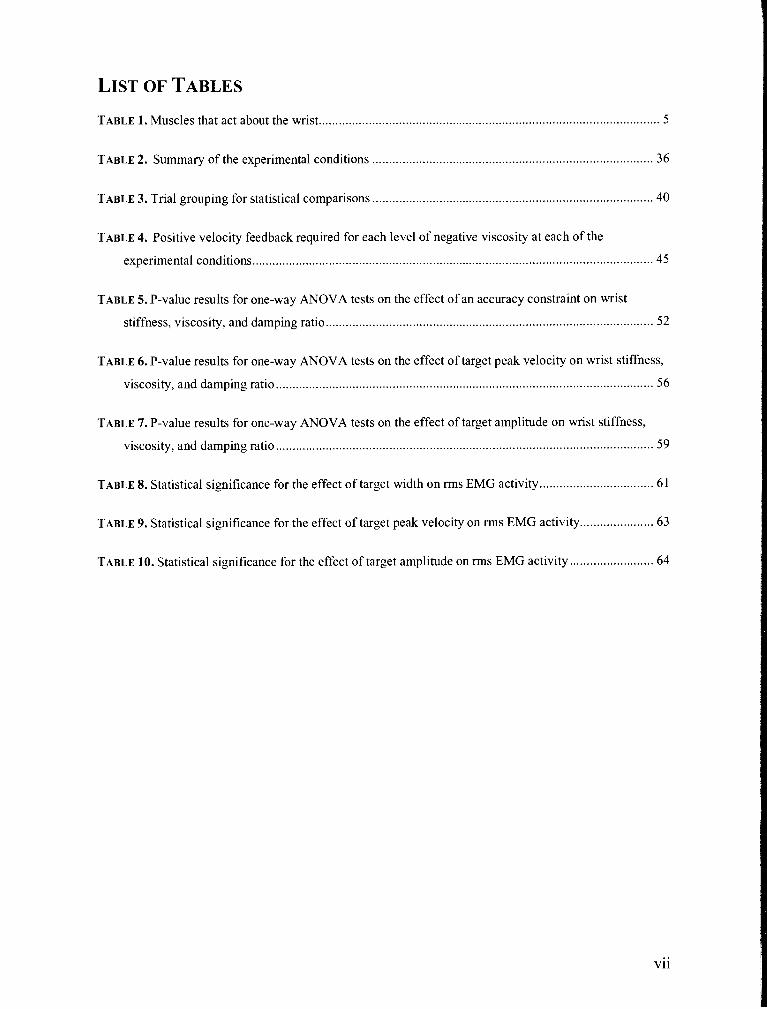
TABLE 1 . Muscles that act about the wrist ...................................................................................................... 5
TABLE 2 . Summary of the experimental conditions .................................................................................... 36
TABLE 3 . Trial grouping for statistical comparisons .................................................................................... 40
TABLE 4 . Positive velocity feedback required for each level of negative viscosity at each of the
experimental conditions ........................................................................................................................ 45
TABLE 5 . P-value results for one-way ANOVA tests on the effect of an accuracy constraint on wrist
stiffness. viscosity. and damping ratio ............................................................................................. 52
TABLE 6 . P-value results for one-way ANOVA tests on the effect of target peak velocity on wrist stiffness.
viscosity. and damping ratio ................................................................................................................. 56
TABLE 7 . P-value results for one-way ANOVA tests on the effect of target amplitude on wrist stiffness.
viscosity. and damping ratio ................................................................................................................. 59
TABLE 8 . Statistical significance for the effect of target width on rms EMG activity .................................. 61
TABLE 9 . Statistical significance for the effect of target peak velocity on rms EMG activity ...................... 63
TABLE 10 . Statistical significance for the effect of target amplitude on rms EMG activity ......................... 64
vii
LIST OF FIGURES
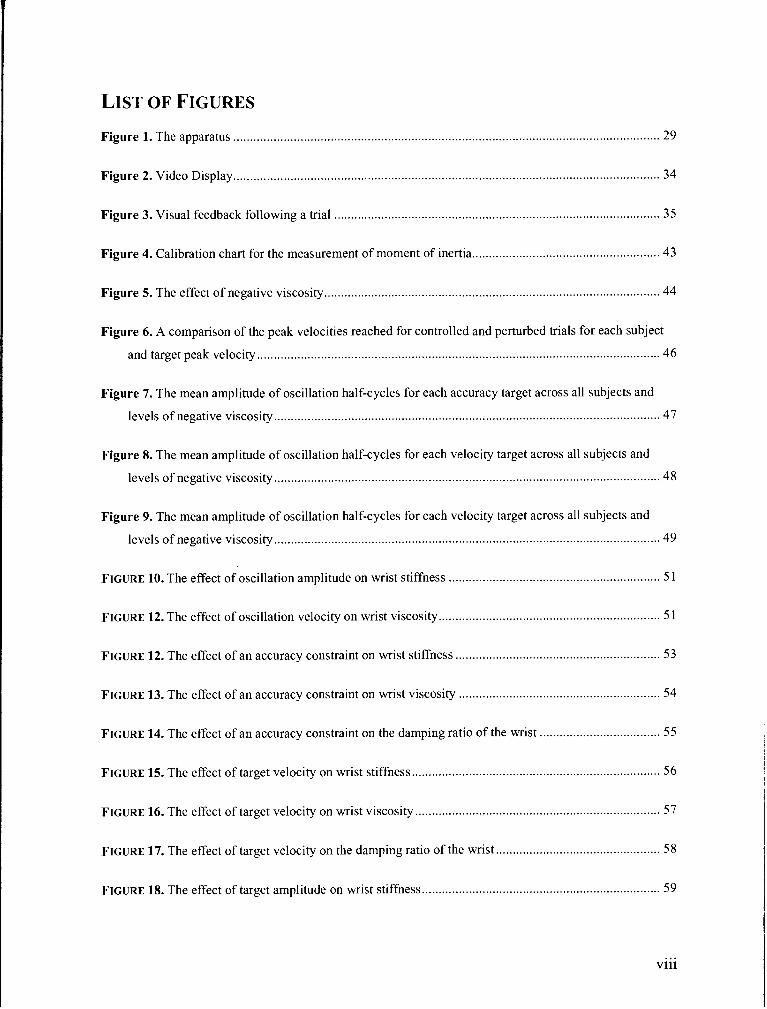
Figure 1 . The apparatus ............................................................................................................................... 29
Figure 2 . Video Display ............................................................................................................................... 34
Figure 3 . Visual feedback following a trial ................................................................................................. 35
Figure 4 . Calibration chart for the measurement of moment of inertia ........................................................ 43
Figure 5 . The effect of negative viscosity .................................................................................................... 44
Figure 6 . A comparison of the peak velocities reached for controlled and perturbed trials for each subject
and target peak velocity ........................................................................................................................ 46
Figure 7 . The mean amplitude of oscillation half-cycles for each accuracy target across all subjects and
levels of negative viscosity ................................................................................................................... 47
Figure 8 . The mean amplitude of oscillation half-cycles for each velocity target across all subjects and
levels of negative viscosity ................................................................................................................... 48
Figure 9 . The mean amplitude of oscillation half-cycles for each velocity target across all subjects and
levels of negative viscosity ................................................................................................................... 49
FIGURE 10 . The effect of oscillation amplitude on wrist stiffness ............................................................... 51
FIGURE 12 . The effect of oscillation velocity on wrist viscosity .................................................................. 51
FIGURE 12 . The effect of an accuracy constraint on wrist stiffness ............................................................. 53
FIGURE 13 . The effect of an accuracy constraint on wrist viscosity .......................................................... 54
FIGURE 14 . The effect of an accuracy constraint on the damping ratio of the wrist .................................... 55
FIGURE 15 . The effect of target velocity on wrist stiffness ..................................................................... 56
FIGURE 16 . The effect of target velocity on wrist viscosity ......................................................................... 57
................................................. FIGURE 17 . The effect of target velocity on the damping ratio of the wrist 58
FIGURE 18 . The effect of target amplitude on wrist stiffness ................................................................. 59
... Vl l l
FIGURE 19 . The effect of target amplitude on wrist viscosity ...................................................................... 60
FIGURE 20 . The effect of target amplitude on the wrist damping ratio ...................................................... 60
FIGURE 21 . The effect of an accuracy constraint on flexor and extensor rms EMG activity during the
stabilization and post-movement phases of the movement ............................................................ 62
FIGURE 22 . The effect of target velocity on flexor and extensor rms EMG activity during the stabilization
and post-movement phases of the movement ....................................................................................... 63
FIGURE 23 . The effect of target amplitude on flexor and extensor rms EMG activity during the stabilization
and post-movement phases of the movement ....................................................................................... 64
The neuromuscular system's ability to modulate joint mechanical properties is of
fundamental concern in the study of human motor control. The mechanical properties of a
joint determine how it will respond to perturbing forces during postural control and how
it will act during voluntary movement.
In general, humans are able to maintain stable mechanical behaviour in the face of
a wide range of mechanical operating environments. Goal directed movements are
usually very smooth and there is a strong tendency to return to the original trajectory or
target when the limb is perturbed. The stability of a joint is determined by its mechanical
impedance or ability to resist disturbance forces that would move it away from its
intended posture or trajectory. This is determined to a great extent by the viscoelastic
properties of the muscles controlling a joint. The neuromuscular system can, therefore,
change a joint' s mechanical impedance by modulating voluntary muscle activation and
reflex feedback gains.
Considerable progress has been made in the understanding of postural control of
single joints. Numerous single joint studies have been conducted to determine the
mechanics of the joint during both imposed and voluntary movements. One main result of
such studies is the finding that muscles are essentially spring-like and that the central
nervous system may employ this characteristic in the control of posture and movement.
Recently, techniques have been developed to estimate the time-varying
viscoelasticity of a single joint during movement (Bennett et al., 1992; Bennett, 1993;
Milner and Cloutier, 1993; Milner and Cloutier, 1997). These studies have indicated that
the viscoelastic parameters depend on muscle activation and the speed of movement.
These experiments have all been conducted with a fixed target size.
For purposes of analysis, a goal directed movement may be divided into a number
of phases: pre-movement, acceleration to peak velocity, deceleration to the target,
stabilization at the target, and post-movement. For many tasks, the stabilization phase is a
critical component of the movement. Stability may be important in order to prepare for
another event (such as catching a ball) or to interact with the environment (such as
moving a switch).
The purpose of this thesis was to investigate how the neuromuscular systems
adapts the mechanics of a joint in response to different targets. In particular, the intent
was to determine the viscoelastic characteristics of the wrist joint during the stabilization
phase of a movement when the distance to the target was changed, the accuracy
requirements of the target were changed, or the velocity of movement toward the target
was changed.
For normal targeted human movements the oscillations about the target are small
in amplitude and they damp out very quickly. For this study, the natural damping of the
wrist was decreased by employing the novel technique of applying negative viscosity to
the wrist with a torque motor (Milner and Cloutier, 1993). Using this technique, the
number and amplitude of these oscillations were increased but the frequency of the
oscillations remained at the natural frequency of the system. These oscillations were then
modeled with a second order model to determine the viscoelasticity of the joint.
The wrist is a complex joint allowing flexion, extension, abduction, adduction,
and circumduction. The skeletal framework of the wrist consists of eight carpal bones
that articulate with the distal aspect of the radius, the metacarpals, and with each other.
The carpal bones are arranged in two transverse rows of four bones each, located in the
proximal part of the hand. Together, the carpal bones form the carpus. The trapezium,
trapezoid, capitate, and hamate bones form the distal row of the carpus. The proximal
row is formed by the scaphoid, lunate, triquetrum, and pisiform. Within each row of
carpal bones, the palmar, dorsal, and interosseous ligaments restrict movement. The
proximal and distal rows of the carpus form the midcarpal joint. The ligaments allow
more freedom of movement between the rows than between the individual carpal bones
such that flexion and extension are possible. The distal end of the radius forms a concave
surface that together with the articular disc of the ulna articulate over a convex surface
formed by the proximal row of the carpus. The midcarpal joint and the wrist joint work in
concert to increase the range of flexion and extension available to the hand.
Many degrees of freedom exist for the wrist joint due to the complex interactions
available within and between the carporadial and midcarpal joints. However, the wrist as
a whole essentially undergoes biaxial rotation about the flexion-extension and radial
deviation-ulnar deviation axes. Although there is a great deal of variation between
individuals, the normal ranges of motion of the wrist complex are generally considered to
be 85-90 degrees of flexion, 75-80 degrees of extension, 15-20 degrees of radial
deviation, and 35-37 degrees of ulnar deviation (Crouch, 1983).
The musculature that generates movement of the hand about the wrist is also
complex. Most of the muscles that act across the wrist joint are biarticular because they
have at least part of their origin on the distal end of the humerus. Nevertheless, it should
be noted that these muscles have very slight actions on the elbow. The primary actions of
the wrist muscles are in the movement of the hand and fingers. All of these muscles have
their bellies in the proximal part of the forearm and have long tendons that cross the
wrist. The tendons are held down at the wrist by flexor and extensor retinacula. These
transverse bands of fascia prevent the tendons from protruding when the hand is flexed or
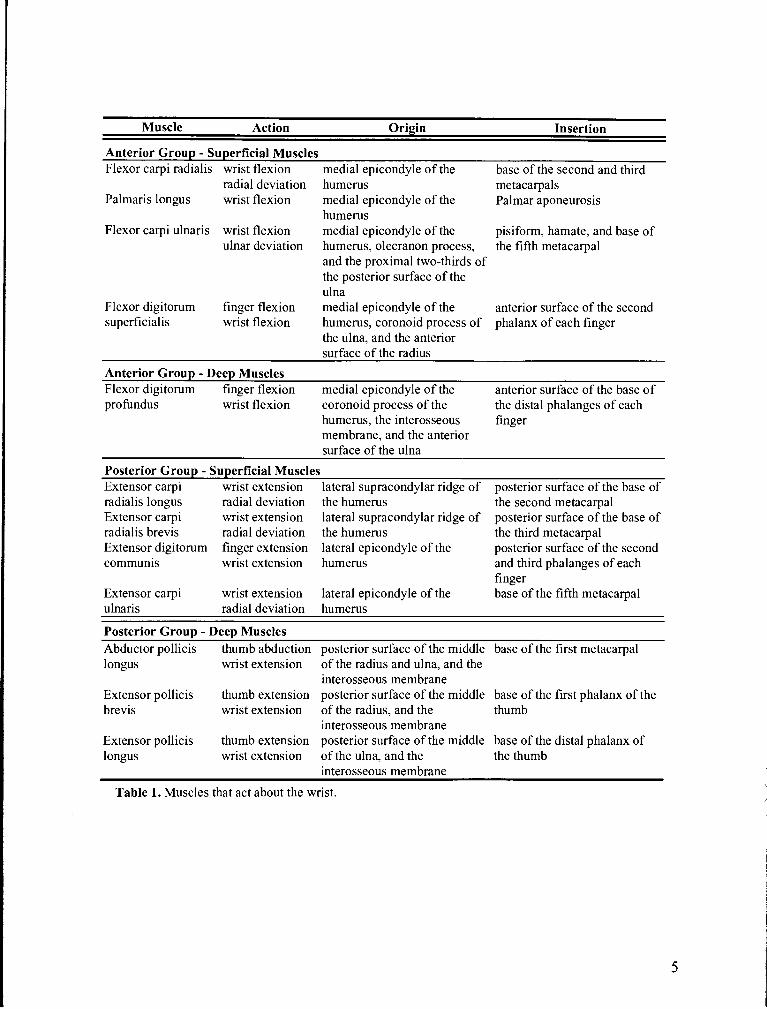
extended. As indicated in Table 1, the muscles may be classified based on their location
and function. The muscles of the anterior group serve as flexors of the wrist and have
their origin on the medial epicondyle of the humerus. These muscles insert on the carpals,
metacarpals, or phalanges. Wrist flexion is effected predominantly by three muscles:
flexor carpi ulnaris (FCU), flexor carpi radialis (FCR), and palmaris longus (PL). The
finger flexors may also act in assisting wrist flexion. The posterior group of muscles acts
as wrist extensors. These muscles have their origin on the lateral epicondyle or the lateral
supracondylar ridge of the humerus and they insert on the metacarpals or phalanges.
There are four primary wrist extensor muscles: the extensor carpi radialis longus (ECRL),
extensor carpi radialis brevis (ECRB), extensor carpi ulnaris (ECU), and the extensor
digitorum comunis. Although the wrist extensor muscles are antagonistic to the wrist
flexors, the ECRL acts synergistically with the FCR to radially deviate the hand. In a
similar manner, the ECU acts synergistically with the FCU to produce ulnar deviation of
the hand. The above mentioned primary wrist flexors and extensors comprise the
superficial group of muscles of the forearm. In addition, there are layers of deeper
muscles I the forearm. These muscles are summarized in Table 1 together with their
actions, origins, and insertions (Crouch, 1983).
Muscle Action Origin Insertion
Anterior G r o w - Suaerficial Muscles Flexor carpi radialis wrist flexion medial epicondyle of the base of the second and third
radial deviation humerus Palmaris longus wrist flexion medial epicondyle of the
humerus Flexor carpi ulnaris wrist flexion medial epicondyle of the
ulnar deviation humerus, olecranon process, and the proximal two-thirds of the posterior surface of the ulna
Flexor digitorum finger flexion medial epicondyle of the superficialis wrist flexion humerus, coronoid process of
the ulna, and the anterior
metacarpals Palmar aponeurosis
pisiform, hamate, and base of the fifth metacarpal
anterior surface of the second phalanx of each finger
surface of the radius
Anterior Group - Deep Muscles Flexor digitorum finger flexion medial epicondyle of the anterior surface of the base of profundus wrist flexion coronoid process of the the distal phalanges of each
humerus, the interosseous finger membrane, and the anterior surface of the ulna
Posterior Group - Superficial Muscles Extensor carpi wrist extension lateral supracondylar ridge of posterior surface of the base of radialis longus radial deviation the humerus the second metacarpal Extensor carpi wrist extension lateral supracondylar ridge of posterior surface of the base of radialis brevis radial deviation the humerus the third metacarpal Extensor digitorum finger extension lateral epicondyle of the posterior surface of the second communis wrist extension humerus and third phalanges of each
finger Extensor carpi wrist extension lateral epicondyle of the base of the fifth metacarpal ulnaris radial deviation humerus
Posterior Group - Deep Muscles Abductor pollicis thumb abduction posterior surface of the middle base of the first metacarpal longus wrist extension of the radius and ulna, and the
interosseous membrane Extensor pollicis thumb extension posterior surface of the middle base of the first phalanx of the brevis wrist extension of the radius, and the thumb
interosseous membrane Extensor pollicis thumb extension posterior surface of the middle base of the distal phalanx of longus wrist extension of the ulna, and the the thumb
interosseous membrane
Table 1. Muscles that act about the wrist.
Models of Muscle Mechanics
The A. K Hill Model
The earliest model of muscle mechanics that is still widely used today is the
macroscopic model proposed by A.V. Hill (Hill, 1938). Hill adopted a phenomenological
systems physiology approach with his model to provide an understanding of the
mechanics of muscle as a whole. The origins of this model may be traced back to the
experiments of Gasser and Hill (1924) who conducted force and length change
measurements of maximally stimulated isolated frog muscles. They showed that the
contractile properties of muscle resembled a passive viscoelastic system. The Hill model
was based primarily on thermal measurements of maximally stimulated muscle exposed
to an isotonic quick release (Hill, 1938). Hill suggested that the mechanical properties of
muscle could be modeled by a passive damped elastic element connected in series with a
nonlinear contractile element.
In current versions of the Hill model, the contractile element accounts for the
dynamics of muscle excitation and mechanical contraction. The energy conversion
process from neural excitation to mechanical contraction is represented by equations that
incorporate muscle length-tension and force-velocity properties as well as a rate limiting
term representing calcium activation and deactivation. The maximum tension as a
function of muscle length is multiplied by the activation level to determine the
length-tension relationship. For a muscle that is shortening, the force-velocity
relationship is defined by a hyperbolic curve in which the contractile force decreases as
the shortening velocity increases. This curve is defined such that the x-intercept is located
at the maximum velocity of unloaded shortening and the y-intercept is defined at the
maximum isometric force. For a muscle that is lengthening, the force-velocity
relationship has a very steep slope at low lengthening velocity and levels off to a constant
force for higher velocities.
The series element represents the stiffness of passive connective tissue; it includes
the passive elasticity associated with active and inactive muscle fibers, tendon, and
aponeurosis (Zajac, 1989). The series element is modeled as a nonlinear spring whose
length and stiffness is determined by the instantaneous muscle force.
Although Hill did not include it in his original model, the results of an experiment
performed by Katz (1939) suggested that a second elastic element be added to the model.
He suggested that this element should be in parallel with the contractile element and that
it would be due to passive force generation from connective issues within and
surrounding the muscle. In spite of the fact that the addition of the parallel elastic element
improves the model, it is not usually included in muscle model simulations because it
generates very little force except at the extremes of the range of motion, well beyond the
normal physiological range.
The Sliding Filament Model
In contrast to the previous model, the Sliding Filament Model proposed by A.F.
Huxley (1957) is a biophysical model of the dynamics of the actin-myosin interaction.
This type of model allows insight into the actual mechanisms of muscle contraction at the
molecular level.
Huxley assumed that a muscle's active mechanical properties are due to the
interaction between actin and myosin. The model assumes that the head projecting from
the myosin filament forms an elastic linkage or cross-bridge with the actin filament that
can be attached or detached. When the muscle is activated, a cross-bridge will attach to
the actin filament, undergo a conformational change creating a force that shortens the
actin-myosin complex, and later detach from the actin filament. This cycle is repeated as
long as the muscle is activated. The combined effect of cycling cross-bridges along the
myosin filament produces a sliding of the actin filament with respect to the myosin
filament. It is assumed that the cross-bridges act independently of each other, and attach
and detach with rate constants that vary independently of the activation level.
The mechanical properties exhibited by whole muscle are a result of the sum of
the actions of the myofilaments that comprise it. Force and stiffness depend on the
availability of a binding site on the actin filament to which the myosin head may attach;
therefore, these properties are dependent on the activation level. The force and stiffness
of a muscle fiber are also dependent on the movement of the actin-myosin complex
because cross-bridges can be forcibly detached due to over stretching, resulting in
decreased force and stiffness in the fiber as a whole.
Huxley's model provides a relatively simple and concise mathematical
description of the way muscles are believed to work on a molecular level. Although he
showed that his model was consistent with many of the macroscopic features of muscle
behavior, subsequent modifications have been made to the basic theory to account for
new observations. For example, two attachment states were suggested to account for
transient tension changes following step shortening and lengthening (Huxley and
Simmons, 1971). Other researchers have suggested niultiple states of attachment and
detachment to account for the numerous complex details of muscle mechanical,
biochemical, and thermodynamic behavior (Huxley and Simmons, 197 1 ; Eisenberg and
Hill, 1978; Eisenberg et al., 1980)
Intrinsic Stiffness and Viscosity
Muscle Fiber Stiffness
When muscle is lengthened, a restoring force develops that resists the movement
and tends to bring the muscle back to its original position. Early work in muscle
mechanics suggested that muscles behave like nonlinear springs (Gasser and Hill, 1924;
Fenn and Marsh, 1935; Hill, 1938). When a muscle is lengthened or shortened such that
the cross-bridges are deformed, the cross-bridges generate a restoring force that opposes
the displacement. Muscle, therefore, exhibits elastic behavior and consequently has the
property of stiffness. Stiffness can be defined as either static or dynamic. When a muscle
fiber is displaced and held at a new steady state length it generates a new steady state
force. The static stiffness of a muscle fiber is defined from these two different steady
states as the incremental change in force, AF, produced by the muscle in response to an
imposed change in length, AL, divided by that change in length. This relationship is
summarized by the equation
AF K , =-
AL'
where the variable K,, is the elastic coefficient of the muscle. Whereas static stiffness is
easily measured, time varying stiffness is more difficult to measure. It must be estimated
by modeling the mechanical behavior and estimating the elastic, viscous, and inertial
contributions to the force. Some aspects of muscle behavior are best discussed in terms of
compliance. Mathematically, compliance is the inverse of stiffness and is defined by the
equation
In practice, a muscle's viscoelastic behavior is history dependent and therefore its
compliance may not simply be the reciprocal of its stiffness for a given set of operating
conditions.
The stiffness of a muscle fiber has both passive and active components. However,
the length-tension curve shows that passive components only become significant when
the fiber length approaches the maximum of its physiological range (Edman, 1966;
Gordon et al., 1966). If the mechanics are described in terms of the Sliding Filament
Theory, the muscle fiber stiffness can be thought of as a relative measure of the number
of attached cross-bridges. This is because stiffness is proportional to the number of
attached cross-bridges. (Huxley and Simmons, 197 1 ; Ford et al., 198 1).
Several studies have shown that the number of attached cross-bridges, and
therefore, the stiffness varies with the velocity of a displacement (Edman, 1978; Ford et
al., 1985; Sugi and Tsuchiya, 1988; Lombardi and Piazzesi, 1990). As the stretch velocity
is increased both force and stiffness increase with force rising more rapidly than stiffness
(Lombardi and Piazzesi, 1990). Similarly, as the shortening velocity is increased force
and stiffness decrease with stiffness falling more gradually than force. (Ford et al., 1985;
Edman, 1993). Griffiths et al. (1993) isotonically shortened muscle fibers at constant
velocity and confirmed these results by estimating the number of attached cross-bridges
using x-ray diffraction techniques. They suggested that negatively strained cross-bridges
could account for the difference between force and stiffness because they would reduce
the tension and still contribute to the muscle fiber stiffness.
Muscle Fiber Viscosity
Materials that generate resistive forces related to the velocity of a disturbance are
said to have the property of viscosity. Muscles exhibit this property and like stiffness, the
relationship between force and velocity may be summarized by a simple equation
where B, is the coefficient of viscosity of the muscle and A V is the change in muscle
velocity. Like stiffness, instantaneous viscosity cannot be measured directly because any
change in the length of a muscle fiber will result in the generation of elastic forces from
the cross-bridges. Therefore, instantaneous viscosity must be estimated by modeling the
dynamic behavior of stiffness and viscosity simultaneously. A steady state viscosity may
be estimated from the slope of the force-velocity curve identified by A.V. Hill (1938).
Based on this relation, the viscosity of a shortening muscle fiber should be maximum
near zero velocity and approach zero as the shortening velocity is increased. Similarly, in
lengthening fibers viscosity should be maximum near zero velocity and get smaller as the
velocity is increased.
If viscosity is determined by the force-velocity curve, an explanation of the
underlying physiology of viscosity depends on the physiological processes that account
for the force-velocity relationship. There are different views on how the force-velocity
curve is explained physiologically. Huxley originally proposed that the number of
attached cross-bridges is related to the relative velocity of the sliding myofilaments. For
muscle fibers lengthening at low velocity, he suggested that the average strain in the
attached cross-bridges must increase. In addition, further attachments are made while
these cross-bridges are stretched contributing to the enhancement of force. As the
lengthening velocity is increased, the progressive increase in average strain is balanced
by the reduced time that the cross-bridges may remain attached. Consequently, the force
enhancement decreases with lengthening velocity such that force becomes constant.
When a muscle fiber shortens attached cross-bridges will be compressed and therefore
generate negative tension which detracts from the overall force generated by the fiber.
According to Huxley's theory, as the rate of shortening increases, a progressively larger
population of the cross-bridges will not detach in time to prevent the generation of
negative tension. The velocity of shortening therefore reaches a limit when the negative
tension equals the positive tension.
Huxley has suggested that the force-velocity relationship of a muscle fiber may be
explained in terms of to a change in the average cross-bridge strain as a function of
velocity (Huxley, 1957; Ford et al., 1985). Conversely Iwamoto et a1.,(1990) suggest
that the relationship is due to changes in the populations of attached and detached
cross-bridge states. It should be noted that muscle fiber viscosity has not been attributed
to a dashpot-like system where the movement of myofilaments is resisted by a viscous
myoplasm.
The force-velocity relationship for the lengthening muscle may be determined by
measuring the force change in response to constant velocity stretches of various lengths.
When the velocity of stretch is low and the sarcomere lengths are long, the force is
observed to rise rapidly followed by a very slow rise to a higher level until it reaches a
plateau. This phenomenon is known as creep (Flitney and Hirst, 1978). As the stretch
velocity is increased, the force increment gets progressively smaller. Lombardi and
Piazzesi (1990) characterized the force-velocity relationship at high velocities as having
two distinct phases. The first phase is transitory - the force rises to a velocity dependent
maximum value and then decreases. Next, there is a steady state phase where the increase
in force with velocity is low and it decreases progressively to a limiting value as velocity
is increased further (Edman et al., 1978; Lombardi and Piazzesi, 1990). The variability in
the force response has been suggested to result from inhomogeneity in the distribution of
length changes within the sarcomeres of a fiber (Colomo et al., 1988). The length change
for weak sarcomeres is much greater than that for strong sarcomeres. At high stretch
velocities, the weak segments are responsible for most of the increase in velocity keeping
the force increase small. In addition, Lombardi and Piazzesi suggest that at low stretch
velocity, the average strain in the attached cross-bridges increases and more cross-bridges
become attached contributing to the force enhancement. As the velocity is increased, the
time for a cross-bridge to attach is reduced and, therefore, fewer cross-bridges actually
bond with the actin filament. The force generation at high velocity is, therefore,
dependent on the cycling rate of the cross-bridges (Lombardi and Piazzesi, 1990;
Lombardi et al., 1992).
In contrast, Iwamoto et al. (1990) investigated the force-velocity relationship by
varying the load on the fiber and measuring the resulting change in velocity. Their results
showed that when a ramp decrease in load was applied to the fiber the force-velocity
curve was always convex except for a hump in the high force region that increased as the
velocity increased. They suggested that the increase in the shortening velocity was due to
an increase in the proportion of cross-bridges that remain attached until the force is
reduced to zero. They attempted to simulate this behavior with a model. However, they
were not able to predict the experimentally observed hump at high forces and suggested
that the series elastic component may be responsible for this effect. A significant finding
from their work was that the slope of the velocity-force curve approaches infinity as the
force approaches zero. This suggests that viscosity cannot simply be determined from the
slope of the force-velocity curve in this region.
Whole Muscle Viscoelasticity
Stiffness
The elastic behavior of a whole muscle is complex and may be affected by several
factors, some of which give rise to nonlinear behavior. In terms of the Hill model,
stiffness is created passively by the stretching or shortening of the series and parallel
elastic components. Although the model assumes that passive stiffness should be a fixed
function for a given muscle, the length-tension dynamics are in fact nonlinear and,
therefore, stiffness may change. The muscle is connected in series to its aponeurosis and
tendon. The effect of this series connection is that the compliance of the entire
musculotendon unit is obtained from the sum of the compliance contributions from the
muscle, tendon and aponeurosis. Rack and Westbury (1969) showed that for small loads,
the stiffness of the tendon and aponeurosis is much greater than that of muscle; the length
change in the musculotendon unit is therefore taken up by the muscle. As the imposed
load increases, the tendon-muscle stiffness ratio decreases and more of the stretch is
taken up by the tendon. In the cat, this ratio was constant for in isometric conditions for
the force range of 20-80% of the maximal. (Baratta and Solomonow, 1991). The dynamic
effect of the tendon is somewhat more complicated. In contrast to the static results of
Baratta and Solomonow, Roleveld (1994) reported that the tendon's viscoelastic
properties do, in fact, have a moderate effect on the dynamic response of a load-moving
musculotendon unit. Furthermore, Griffiths (1991) found that the length change for slow
to moderate stretches of maximally contracted isometric cat medial gastrocnemius muscle
were taken up entirely in the tendons. For higher velocity stretches, the length change
was shown to take place mostly in the muscle. Passive properties also result in a
nonlinear dependence of stiffness on muscle length (Rack and Westbury, 1969). Single
joint studies have shown that stiffness greatly increases towards the extremes of the range
of motion of the joint as the passive elements are stretched but remains mains nearly
constant in the joint's mid-range (Kearney and Hunter, 1990).
Active stiffness is generated intrinsically from the elastic deformation of the
cross-bridges formed by actin-myosin bonds. The relation between force and intrinsic
stiffness is complex and nonlinear because it depends on the amplitude and velocity of
the length change, as well as the level of activation of the muscle prior to the
displacement. In addition, time varying stiffness can be relatively high compared with
static stiffness. Joyce et al. (1969) measured the force response of constant velocity
movements generated with various stimulation rates of the cat soleus muscle. They
suggested that the amplitude and activation dependence exhibited by the force could be
summarized by the slopes of a family of length-tension curves. Rack (1966) applied
sinusoidal oscillations to cat soleus muscle and showed that the stiffness increased
approximately linearly with frequency of the oscillations and decreased nonlinearly with
stretch amplitude. For small amplitude changes of up to 2% of the physiological range of
the muscle length the change in force is proportional to the change in length (Rack and
Westbury, 1974). Rack referred to the high time varying stiffness in this region as the
short-range stiffness. Experiments with human subjects have shown that the short-range
stiffness increases linearly with the muscle's level of activation (Ma and Zahalak, 1985).
The extent of this region also increases when the muscle is alternately stretched and
shortened compared to when the muscle is held isometric (Rack and Westbury, 1974).
Rack and Westbury suggest that this result occurs because the cross-bridges that attach
when the muscle is shortened can be extended further before they are forcibly detached.
For stretch amplitudes beyond this range a drop in force occurs which results in a short
period of negative time varying stiffness called yielding (Joyce et al., 1969). The yielding
phenomenon occurs because the cross-bridges become stretched beyond the capacity of
the actin-myosin bonds to resist the imposed strain. Consequently, they break and
reattach at a new position on the muscle's length-tension curve. As the amplitude of the
displacement is increased the stiffness decreases, because on average the cross-bridges
will have to cycle more and will, therefore, spend more time in a detached state. The
amount of yielding is inversely proportional to both velocity of stretch and level of
muscle activation (Joyce et al., 1969; Rack and Westbury, 1974; Nichols and Houk,
1976; Houk and Rymer, 198 1).
When muscle is shortened, the yielding phenomenon is not observed and the
muscle force drops continuously until the imposed length change is stopped. Joyce et al.
(1969) showed that in contrast to lengthening, stiffness is independent of the shortening
velocity. In addition, Nichols (1984) has shown that as the velocity of stretch increases,
larger amplitude stretches are required to produce yielding.
Viscosity
Viscous mechanical properties are more difficult to measure than are static elastic
properties because they must be measured under dynamic conditions and are generally of
small magnitude. As a result, there have been far fewer studies examining muscle viscous
properties than elastic properties. However, some work has been done to determine the
mechanical effects of viscosity with respect to muscle activation, amplitude and velocity
of displacement, and frequency of oscillation.
Like stiffness, muscle viscosity has been found to increase with activation level
(Rack, 1966; Joyce and Rack, 1969). This result is in agreement with the muscle fiber
theories and experiments that suggest that viscous properties result from cross-bridge
mechanics. Because activation level also affects stiffness, the viscous and elastic
properties had to be measured simultaneously in Rack's experiments (Rack, 1966; Joyce
and Rack, 1969). Rack sinusoidally oscillated tetanized and passive cat soleus muscles
with small amplitudes and low frequencies. He assumed that for small amplitude
oscillations with constant activation, stiffness and viscosity could be considered constant.
The experiments showed that viscosity increased with frequency when the muscle was
oscillated at low frequencies (up to 5 Hz). This increase, however, was small compared
with the corresponding increase observed for stiffness. As the frequency of oscillation
was increased further, viscosity became constant and then began to decrease. Kirsch et al.
(1994) applied stochastic perturbation sequences to the passive cat soleus and medial
gastrocnemius muscles. They oscillated the muscle at much higher frequencies than those
used in Rack's experiment and found that viscosity decreased nonlinearly with oscillation
frequency in agreement with his results. Furthermore, these results indicated that
viscosity decreased nonlinearly with increased velocity in agreement with the
force-velocity curve.
Kirsch et al. (1 994) also investigated the effect of oscillation amplitude on muscle
viscoelasticity. Whereas stiffness was observed to decrease for small increases in
oscillation amplitude, viscosity did not appear to change. In the same study, however,
these investigators reported that both stiffness and viscosity decreased when the
amplitude of step muscle stretches was increased. The relative decrease in stiffness was
much greater than that of viscosity for these perturbations so that, as the stretch amplitude
was increased, muscle properties became more viscous in nature.
Kirsch et al. (1994) compared predictions of three viscoelastic models to the
stiffness frequency responses for stochastic perturbations of cat medial gastrocnemius
muscle. The first model consisted of a stiffness and elastic element in parallel. The
second model was similar to the first with the addition of a series elastic element to
account for tendon compliance. The third model consisted of a stiffness and elastic
element in series coupled with a parallel elastic element. All models accurately predicted
the stiffness magnitude. However, only the first model accurately predicted the observed
phase shift towards 90 degrees as the frequency was increased. This model is essentially
a second order linear model of muscle viscoelasticty.
The force-velocity curve has been shown to be asymmetric near zero velocity for
both active and passive muscle (Harry et al., 1990; Krause et al., 1995). Harry et al.
(1990) stretched and shortened active frog sartorius muscles at various constant velocities
and measured the force response. Their results indicated that the slope of the
force-velocity relation during shortening was approximately one quarter of the magnitude
of the slope during lengthening. Krause et al. (1995) conducted a similar experiment
using passive frog sartorius muscle. Like the previous experiment, their results showed
that the force-velocity curve is asymmetric about zero velocity; furthermore, they found
that the viscosity is discontinuous at zero velocity. These results provide further support
for the idea that viscosity at low velocity should not be determined from the slope of the
force-velocity curve and that alternative methods should be used for this measure.
Lin and Rymer (1 993) investigated the mechanical properties of decerebrate cat
soleus muscle in response to a stretches beyond the short-range stiffness region. They
applied constant velocity stretches to the muscle while holding the initial length and
activation constant. Their results were similar to those of the muscle fiber experiments
performed by Lombardi and Piazzesi (1990) indicating that following yield the force
response was essentially viscous. Lin and Rymer suggested that the force response of the
yield and steady state phases of the stretch reflect a transition between the transient
elastic behavior of the short-range stiffness to a more stable steady state viscous behavior.
Kirsch's (1 994) results also support these findings.
Single Joint Mechanics
Joint Viscoelasticity
The stiffness and viscosity observed at a joint in response to an angular
perturbation is more complex than that of a single muscle because there are more
structural components contributing to the overall viscoelasticity. Generally, a torque
about a particular axis of rotation cannot be achieved through the action of a single
muscle. Synergist muscles must be activated such that the required torque vector is
achieved through the vector summation of the torque produced by the individual muscles.
The activation of synergist muscles, all of which have different moment arms, creates off
axis torques which are balanced by stresses in bone, connective tissue, and contraction of
other muscles. Another factor contributing to a more complex joint viscoelasticity is that
when a joint is displaced, the agonist muscles are shortened and the antagonist muscles
are stretched. The viscoelastic properties are, therefore, affected by the force of the
shortening cross-bridges in the agonists and the resistive forces of the stretched
cross-bridges in the antagonists.
Since muscle viscoelastic properties are nonlinear, joint viscoelastic properties are
also nonlinear. Nonlinearities arise from the contribution to viscoelastic properties from
multiple muscles, as well as the nonlinearities inherent in the properties of muscles
themselves. In addition, the geometrical transformation between joint angle and muscle
length involves nonlinear scaling by the moment arm. Frictional forces within the joint
will also affect the joint dynamics.
Whereas the torque generated about a joint is a vector quantity whose magnitude
is determined from the difference between the torques created by agonist and antagonist
muscles, the joint viscoelastic properties are scalar. The elastic and viscous contributions
from each muscle acting about the joint, therefore, sum to produce the viscoelastic
properties of the joint. Consequently, the mechanical impedance of a joint my be
increased by agonist/antagonist muscle cocontraction without generating torque. Joint
stiffness and viscosity are defined in a similar manner as muscle stiffness and viscosity
except that the joint properties are expressed as rotational quantities. Joint stiffness is
defined as the change in torque, AT, produced in response to a small angular
displacement, A@, divided by that change in angle
Similarly, joint viscosity is determined from the torque response to a change in angular
velocity A0
A useful property when describing joint viscoelasticity is that of damping.
Damping is a measure that describes how effective the viscous forces of an oscillating
system are in decreasing the amplitude of the oscillations. An overdamped system that is
displaced from its equilibrium position will return to that position without overshoot and
slow down as it nears the equilibrium position and require a relatively long time to come
to rest. An underdamped system will undergo a series of decaying sinusoidal oscillations
about the final position before it reaches equilibrium. Damping depends on the inertia (I),
viscosity, and stiffness of a joint. The damping ratio is defined as
The damping coefficient is defined as:
Since the inertia about a single joint is often almost constant, changes in the damping
ratio are mainly the result of changes in joint stiffness andlor viscosity.
The torque about a joint produced by a particular muscle may be determined by
multiplying its moment arm by the force that it generates. For small joint angle
displacements, the change in joint angle may be determined from the muscle length
change divided by the muscle's moment arm. Using these two relations, for a particular
muscle the joint viscoelasticity can be related to muscle viscoelasticity as follows:
and
Several system identification techniques have been used to measure joint
viscoelastic properties. Some of these techniques include step torque perturbations
(Gielen et al., 1984; Gottlieb and Aganval, 1988; Bennett et al., 1992; Milner, 1993),
step position displacements (MacKay et al., l986b; Bennett, 1993a; Bennett, 1993b),
ramp and hold position displacements (Gielen and Houk, 1984; Gielen et al., 1984; Ma
and Zahalak, 1985; MacKay et al., l986b), sinusoidal length displacements (Aganval and
Gottlieb, 1977; Cannon and Zahalak, 1982; MacKay et al., 1986b; Bennett, 1994), and
stochastic perturbations (Hunter and Kearney, 1982; Kearney and Hunter, 1982; Weiss et
al., 1986a; Weiss et al., l986b; Weiss et al., 1988).
Experiments employing oscillations of the human ankle oscillations have shown
that joint stiffness is linearly dependent on joint torque (Agarwal and Gottlieb, 1977;
Hunter and Kearney, 1982; Weiss et al., l986a; Weiss et al., 1986b; Weiss et al., 1988).
With respect to the direction of joint movement, the torque-stiffness relationship has been
shown to be asymmetric in the both the human ankle and the human wrist. For example,
stiffness was greater with ankle extension than with ankle flexion in the ankle (Hunter
and Kearney, 1982), but for the forearm it was greater with flexion than with extension in
the wrist (Milner and Cloutier, 1993; Milner and Cloutier, 1997).
Like stiffness, joint viscosity has been shown to increase with activation (Hunter
and Kearney, 1982; Becker and Mote, 1990). In contrast to stiffness, however, viscosity
was shown to be greater for extension than for flexion in the wrist (Milner and Cloutier,
1997). Hunter and Kearney (1982) have suggested that such asymmetry may be due to
differences in intrinsic or reflex properties between the active muscles.
As indicated previously, joint viscoelastic properties result from the additive
elastic and viscous properties of the active muscles about the joint. The viscoelasticity of
a joint may be modulated without changing its torque by cocontraction of the agonist and
antagonist muscles. Several studies have reported that joint stiffness and viscosity
increase with cocontraction (Lacquaniti et al., 1982; Akazawa et al., 1983; De Serres and
Milner, 199 1 ; Milner and Cloutier, 1993). These properties provide the central nervous
system with a very useful tool that may be employed to maintain stability.
In a series of experiments using stochastic perturbations, Weiss et al. (1986a,
1986b) investigated the passive and active mechanics of the human ankle joint. Their
results showed that the stiffness and viscosity of passive joints exhibit position
dependence (Weiss et al., 1986a). They observed that the passive stiffness of the human
ankle is small and nearly constant in the midrange of a joint's range of motion and that it
increases dramatically at either extreme. The passive viscosity changed throughout the
range of motion such that a uniform damping ratio was maintained. In contrast, the active
mechanical characteristics for the human ankle did not show any position dependence
(Weiss et al., l986b).
As with muscle viscoelasticity, small amplitude changes in joint angle result in
mechanical characteristics that are largely dominated by the elastic properties of the
cross-bridges. Stiffness has been shown to decrease linearly with increasing movement
amplitude in experiments with the ankle (Aganval and Gottlieb, 1977; Kearney and
Hunter, 1982; Gottlieb and Aganval, 1988), the wrist (Gielen and Houk, 1984; De Serres
and Milner, 199 l), and the elbow (Joyce et al., 1974; Cannon and Zahalak, 1982; Ma and
Zahalak, 1985; MacKay et al., 1986a; Gottlieb and Agarwal, 1988). Fewer studies have
reported the effects on viscosity. Kearney and Hunter applied position perturbations to
the ankle and modeled the force response with a second order transfer function. Their
results indicated that viscosity decreased with amplitude (Kearney and Hunter, 1982).
This finding has been supported by the results of MacKay et al. (1986a) who applied step
torque displacements to the elbow. Both of these experiments showed that the decreased
viscous response was not as great as the decrease in the stiffness response. Gielen and
Houk's (1984) experiment with the wrist indicated that the force dependence on velocity
was, in fact, nonlinear. They showed that the force response varied as a power function of
velocity, which had an exponent value of 0.17.
Recently, several investigators have looked at the viscoelastic characteristics of
joints during voluntary targeted movements (Bennett et al., 1992; Bennett, 1993b;
Milner, 1993; Milner and Cloutier, 1993; Milner and Cloutier, 1997). Bennett et al.
(1992) investigated the phasic mechanical characteristics of the human elbow during
sinusoidal movement by measuring the response to small pseudorandom torque
perturbations. They compared the stiffness during movement to that when holding a
steady posture. Their results showed that the stiffness dropped during the movement to
such an extent that the maximum stiffness recorded for the movement was less than the
minimum stiffness observed when subjects were required to hold a steady posture. Milner
(1993) suggested that the larger stiffness seen during maintenance of posture in Bennett's
experiments was due to a cocontraction strategy that is not employed when the limb is
moved voluntarily. He found that during relaxed posture the elbow was more compliant
than during movement. As the target was approached, the stiffness gradually increased.
In contrast, the damping ratio was observed to change erratically during the movement
and drop as it neared the target.
As with stiffness, viscosity has also been reported to increase in the human elbow
as a target is approached so as to stabilize the joint (Bennett, 1994). Using a paradigm
very similar to the proposed work, Milner and Cloutier (1993, 1997) investigated the
damping characteristics of the wrist during rapid targeted flexion movements.
Throughout the movement a load with negative viscosity was used to reduce the natural
damping of the wrist. This had the effect of enhancing the oscillations about the target so
that the time course of the viscoelastic properties could be modeled. The first study
showed that cocontraction of the flexor and extensor muscles was used to stabilize the
joint about the target. Furthermore, the stiffness was reported to increase with decreasing
oscillation amplitude. The most recent study confirmed this result and revealed more
detail about the effects of viscosity. Viscosity was reported to increase as the joint
became more stable which is again consistent with the observation that viscosity
increases with decreased oscillation amplitude or velocity.
Mechanical Stability
The mechanical impedance of a limb may be broken down into three types of
resistance to motion - inertial, viscous, and elastic. The inertial component of impedance
depends on the mass m of the system, and produces a resistance to motion proportional to
the acceleration of motion. Viscous friction resists the movement in proportion to the
velocity of movement and the viscosity b. The elastic resistance to motion is proportional
to the displacement of the limb and the stiffness k.
Rack (1 98 1) used the transfer function of a second-order linear system to model
the mechanical behavior of the human neuromuscular system. In order to describe the
system he considered the movement of a load combining elastic, viscous, and inertial
elements. A load that is driven by sinusoidal oscillations will have a displacement
rsin(wt) where r is the oscillation amplitude, w is the angular frequency, and t is time.
The inertial resistive force due to the mass of the load is -mrw2-sin(wt). A viscous friction
q , will provide a force sinusoid qrw.cos(wt) resisting the movement. This force leads the
movement by 90" and has increasing amplitude in proportion with the frequency of
movement. The elastic impedance, k, for this movement is in phase with the
displacement. The overall mechanical impedance for the load is determined from the
magnitude of the vector sum of these three types of resistance to motion. The phase
difference between the movement and the force response due to the system's mechanical
impedance is, therefore, dependent on the relative magnitudes of the mass, viscosity, and
stiffness of the limb.
Rack used a vector representation of the frequency response to describe the
relationship between the amplitude and phase of the inputloutput properties of the human
neuromuscular system. The human system was represented by a load combining elastic,
viscous, and inertial elements. Rack showed that at low frequencies the total mechanical
impedance is dominated by the stiffness of the elastic component resulting in a force
component krsin(wt) in phase with the position sinusoid. As the frequency of the driving
oscillations increases, the viscous component adds a progressively larger force qrw-
cos(wr) and the inertial component adds a force -mrw2-sin(w4, which increases even
more steeply. Rack's analysis shows that for a limb held in a steady posture, the elastic
component contributes the greatest to the overall mechanical impedance. As the limb is
moved and the frequency of movement is increased, the viscous and inertial elements
become more important in the determination of its impedance.
It can be assumed that the mass of a human limb does not change appreciably
during a movement. For motion of about a single joint, the moment of inertia does not
change if the configuration of the limb does not change with respect to the center of the
rotation of the joint. Therefore, it can be assumed that, in this case, the inertia is constant
and that the inertial resistive force in response to an imposed acceleration is both constant
and immediate. The force response due to the intrinsic viscoelastic resistance from
cross-bridge mechanics and connective tissues is also immediate because the restoring
force is generated as soon as these structures are displaced. The force response from
reflexes, however, is delayed due to the time required for the conduction of neural
impulses through the neural pathways (including signal processing for transcortical reflex
pathways), and excitation--contraction coupling.
Research in control theory has shown that the greatest benefit gained from
feedback loops is that the control becomes less dependent on the dynamics of the actuator
and more dependent on the control signal as the gain of the feedback is increased. It
follows that if the overall mechanical impedance of the system is influenced more by
reflex feedback than by the intrinsic muscle mechanics, then the mechanical behavior of
the system becomes less sensitive to variations arising from nonlinearities in the behavior
of the muscle. A servo-control system is most effective when it has a high feedback loop
gain and a short delay because small errors in the feedback signal result in a large
correction signal that is applied quickly. Control theory has also shown, however, that the
effect of feedback control is somewhat limited as the frequency at which the system is
controlled is increased. It is well known that the combination of high feedback gain and
long feedback delays may lead to oscillatory instability.
Because the reflex latencies in the human neuromuscular system are significant,
the effect of the reflex response cannot simply be determined from the magnitude of its
force response. The delayed response will result in the reflex force being phase shifted
relative to the other components of mechanical impedance. Reflex feedback contributes
to muscle force whether the muscle is shortening or lengthening. Consequently, the phase
of the movement in which the reflex force response occurs will influence the mechanical
stability of the limb.
The effect of reflexes on mechanical stability has been investigated in a number
of studies (Rack, 198 1; Brown et al., 1982; Jacks et al., 1988; Prochazka and Trend,
1988; De Serres and Milner, 1991; Shadmehr and Arbib, 1992; Milner and Cloutier,
1993; Bennett et al., 1994; Stein et al., 1995). The movement frequency and reflex
response latency determines the phase of the reflex force. If reflex force leads
displacement by 90" such that it is in phase with the velocity of lengthening muscle, the
effect of the reflex will be to oppose the movement with a viscous force. As the
frequency of the imposed movement is increased, the phase lag of the reflex response
increases (Rack, 1981). One result of Rack's analysis is that the combination of a long
delay and high feedback gain has the potential to cause the system to become
mechanically unstable. This effect has been shown in experiments with human subjects
using driven sinusoidal movements of the thumb (Brown et al., 1982), and elbow (Rack,
1981). If the reflex response lags the movement by 90" it will contribute a force
proportional to velocity as the muscle is shortening. In effect, this adds negative viscosity
to the system resulting in an assistive rather than a resistive force to the imposed
movement. Long feedback delays can result in responses that are applied too late to have
their intended corrective effect. If the feedback gain is sufficiently high, the corrective
response will instead lead to oscillatory instability.
Theoretical analyses of joint stability confirm that long reflex feedback delays can
indeed result in unstable mechanical behavior (Hogan, 1985; Shadmehr and Arbib, 1992).
Hogan has argued that feedback can only be effective below a frequency that is
determined by the length of the feedback delay. As this delay increases, the frequency at
which feedback can significantly modulate impedance is decreased. He notes that
instability rarely occurs in normal human motor control because the reflex feedback
delays are within the temporal limits at which most tasks can be performed with stability.
Inherent properties of muscle also aid in the maintenance of stability. For
example, in the generation of force muscles behave like low pass filters. When a muscle
is stimulated by a slow train of a--motoneuron action potentials, it generates a similar
train of force impulses. However, a fast train of action potentials will lead to a tetanic
force output. The intermittent nature of the stimulation is filtered out and does not result
in an equivalent intermittent force response (Rack, 1981). The result of this low pass
filtering behavior in the normal neuromuscular system is that the reflex force response
from high frequency movements becomes attenuated. The reflex response to high
frequency movements, therefore, has less of a destabilizing effect than does the response
to low frequency movements (Bawa et al., 1976; Bawa and Stein, 1976; Zahalak and
Heyman, 1979). Perhaps a more important reason why instability is prevented in the
normal system is that the CNS exploits the immediate resistance provided by the intrinsic
viscoelasticity of muscle. Instability due to reflex feedback delay is, therefore, avoided
entirely. If agonist and antagonist muscles are coactivated, the CNS can modulate the net
joint stiffness and control the behavior of the system with greater stability (Hogan, 1985).
This cocontraction strategy has been observed in human subjects with studies involving
the finger (Akazawa et al., 1983) and wrist (De Serres and Milner, 199 1 ; Milner et al.,
1995). The disadvantage of this control strategy is that it involves a higher metabolic
energy cost than is required for reflex mediated feedback. Presumably, the CNS will
attempt to modulate the amount of cocontraction required for stable control such that the
energy cost is minimized. Another property that aids in stability is the nonlinear nature of
resistance to movements of different amplitudes. Joyce et al. (1 974) showed that stiffness
decreased nonlinearly with oscillation amplitude. This effectively reduces the natural
frequency of the joint and, therefore, increases stability by limiting the growth of
oscillations.
Despite the fact that these mechanisms are available to the neuromuscular system,
instability resulting from reflex feedback has been observed by several investigators in
both normal and pathological states. Excessive oscillations have been observed in
subjects with neuropathological conditions such as Parkinson's disease, cerebellar
dysfunction, spinal cord injury and hemiplegia (Stein and Oguztoreli, 1976; Stein and
Lee, 1981). They have also been induced artificially (Jacks et al., 1988; Prochazka and
Trend, 1988; Milner and Cloutier, 1993; Bennett et al., 1994). Prochazka and Trend
(1988) applied frequency-modulated vibrations to the elbow flexor and extensor tendons
of normal human subjects to produce reflex-generated movements. The application of the
vibrations had the effect of artificially increasing the gain of the reflex pathway. At low
levels of cocontraction, they observed activation dependent tremor in the forearm with a
frequency of 3-5 Hz. The oscillation frequency increased to 5-8 Hz for 100 percent
cocontraction. Similar results were obtained in another experiment from their laboratory
in which instability was induced in the forearm with amplitude-modulated electrical
stimulation of the biceps and triceps muscles of human subjects (Jacks et al., 1988).
Milner and Cloutier (1993) investigated the roles of intrinsic muscle mechanics
and reflex feedback in stabilizing targeted movements. Their subjects were required to
perform wrist flexion movements while exposed to a load that had the property of
negative viscosity, thus removing the natural damping of the wrist. It was shown that the
oscillation amplitude increased when the natural frequency was close to a critical
frequency of 6-7.5 Hz. When the wrist oscillated near this critical frequency, the reflex
torque lagged the angular velocity of the wrist by 180". Although the oscillations were
observed to increase, mechanical instability was never observed. The authors suggested
that stability was maintained because the torque contributed by the intrinsic muscle
impedance dominated the reflex torque. This result lends further support to an earlier
study conducted in their laboratory in which the torque produced in response to a stretch
of the wrist originated mostly from intrinsic mechanics rather than reflex pathways (De
Serres and Milner, 1991). In addition, this result is supported by an experiment conducted
by Bennett (1994). He used sinusoidal position perturbations of the human elbow to show
that the mechanical impedance of the arm decreased for frequencies between 6-7 Hz, due
to reflex delay.
Numerous single joint studies with human subjects have shown that joints are
underdamped during maintenance of posture (Aganval and Gottlieb, 1977; Gottlieb and
Aganval, 1978; Hunter and Kearney, 1982; Becker and Mote, 1990) and during voluntary
movements (Bennett et al., 1992; Bennett, 1993b; Milner and Cloutier, 1993; Milner and
Cloutier, 1997). Whereas Bennett (1992, 1993b) reported that the damping ratio of the
elbow joint was erratic during movement and decreased as the limb neared a target
window, a subsequent experiment indicated that the joint viscosity scaled with the joint
stiffness so as to maintain constant damping (Bennett, 1994). Becker and Mote (1990)
reported that the damping ratio increased with muscle activation and decreased as muscle
fatigue increased.
For many tasks, the transition between limb deceleration and steady posture is
perhaps the most important part of the movement. During this part of the movement, the
limb must be stabilized in order for the task to be successfully performed. The present
study was intended to explore in detail the viscoelastic joint properties of the human wrist
during the stabilization phase of a voluntary targeted movement. In particular, it was
designed to investigate how its viscoelastic properties change when the characteristics of
the target change. There were two main components to this study. First, the effects of an
accuracy constraint on the viscoelastic properties exhibited by the wrist were investigated
by requiring subjects to stabilize the hand in target windows of different widths. Previous
studies investigating viscoelastic properties during voluntary targeted movements have
all used a single target window with a single accuracy constraint (Bennett et al., 1992;
Bennett, 1993b; Milner and Cloutier, 1993; Milner and Cloutier, 1997). The second
component of this experiment was to investigate the effect of velocity on the viscoelastic
joint properties as the joint is stabilized. Bennett (1993b) looked at the joint stiffness
during movement as a function of velocity although he did not focus on a particular phase
of movement as was done for this study. With few exceptions, previous experiments
where viscosity has been investigated have used a single velocity. Furthermore,
researchers who have employed different ramp velocities have examined only imposed
movements as opposed to voluntary movements (Gielen and Houk, 1984; Gielen et al.,
1984).
We know very little about how the neuromuscular system controls joint
mechanical properties during stabilization. The results of this experiment allow us to
determine the variation of viscoelastic parameters with different target characteristics.
This will lead to greater insight into the control schemes used by the neuromuscular
system. We can then better predict how the system will behave when exposed to various
environmental conditions.
General Overview
To examine the effects of target constraints and the velocity of movement on joint
viscoelasticity, subjects were required to make repeated wrist flexion movements from a
stationary position and stabilize the hand within the boundaries of a target window. The
natural damping of the wrist was removed during the stabilization phase to exaggerate the
natural oscillation. Subjects made movements of two different amplitudes with various
combinations of three accuracy constraints, three movement velocities, and three levels
of negative viscosity. The experiment was conducted on two consecutive days. On the
first day of testing, subjects performed a series of wrist flexion movements for training.
They were exposed to each of the experimental conditions so that modulation of wrist
mechanics due to practice effects would be diminished. In addition, the moment of inertia
of the wrist and manipulandum was measured and the relative levels of negative viscosity
required to remove natural damping were determined. Following a brief retraining period
on the second day, subjects again performed the flexion movements under the same
experimental conditions. This time, however, the natural damping of the wrist was
unexpectedly removed by applying a load with negative viscosity on random trials.
Subjects
Ten male right-handed volunteers without known history of musculoskeletal
disorders participated in this study. The subjects ranged in age from 22 to 43 years with a '
mean age of 30.6 years. The experiment was conducted with the right hand only.
Apparatus
Subjects were seated comfortably with the right forearm resting on a padded
support. The hand was secured in a wrist manipulandum by clamping the palm such that
the hand was positioned midway between pronation and supination (Figure 1). The
manipulandum was coupled to a torque motor (PMI U16M4) and the subject was
positioned with his flexion/extension axis centered over the shaft of the motor. Because
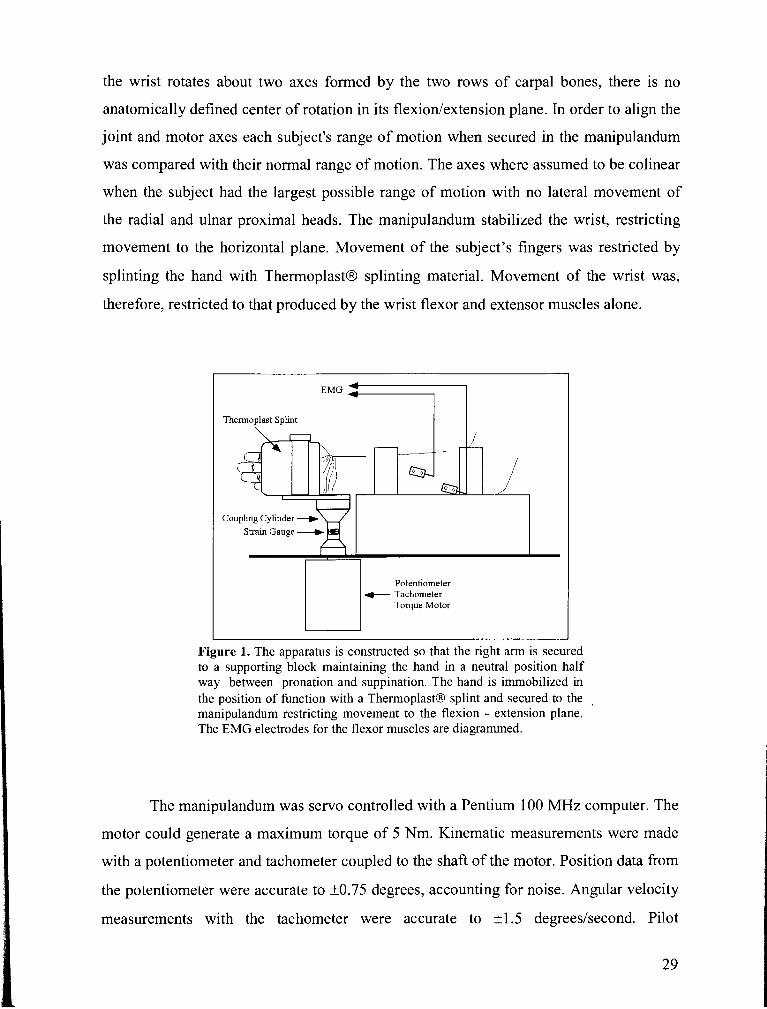
the wrist rotates about two axes formed by the two rows of carpal bones, there is no
anatomically defined center of rotation in its flexionlextension plane. In order to align the
joint and motor axes each subject's range of motion when secured in the manipulandum
was compared with their normal range of motion. The axes where assumed to be colinear
when the subject had the largest possible range of motion with no lateral movement of
the radial and ulnar proximal heads. The manipulandum stabilized the wrist, restricting
movement to the horizontal plane. Movement of the subject's fingers was restricted by
splinting the hand with Themoplast@ splinting material. Movement of the wrist was,
therefore, restricted to that produced by the wrist flexor and extensor muscles alone.
Themoplast Splint
Couphg Cylinder -1 + Strain Gauge d 8 I
Potentiometer + Tachometer
Torque Motor
Figure 1. The apparatus is constructed so that the right arm is secured to a supporting block maintaining the hand in a neutral position half way between pronation and suppination. The hand is immobilized in the position of function with a ThermoplastB splint and secured to the manipulandum restricting movement to the flexion - extension plane. The EMG electrodes for the flexor muscles are diagrammed.
The manipulandum was servo controlled with a Pentium 100 MHz computer. The
motor could generate a maximum torque of 5 Nm. Kinematic measurements were made
with a potentiometer and tachometer coupled to the shaft of the motor. Position data from
the potentiometer were accurate to f 0.75 degrees, accounting for noise. Angular velocity
measurements with the tachometer were accurate to k1.5 degreeslsecond. Pilot
experiments showed that more error resulted from intertrial variability than from the
measurement accuracy of the apparatus. To provide information about muscle activation
patterns, electromyographic activity was recorded from four superficial muscles of the
forearm: ECU, ECRL, FCU, and FCR. EMG was recorded using active, bipolar, stainless
steel surface electrodes (Liberty Mutual M Y 0 11 1) bandpass filtered with cut-off
frequencies of 45 and 550 Hz to remove electrical noise. The placement of the electrodes
over each muscle was determined by observing the EMG activity with an oscilloscope
while the subject performed flexion and extension movements. The electrodes were
placed where each signal was maximal. The position, velocity, torque, and EMG
measurements were amplified and digitized at 2 kHz.
Moment of Inertia Measurement
The moment of inertia, I, is defined as torque divided by angular acceleration
Torque was measured with a linear strain gauge attached to a cylinder coupling
the shaft of the motor and the manipulandum. Angular acceleration was obtained by
numerical differentiation of the angular velocity record measured with the tachometer.
These data were low pass filtered at 200 Hz with a first order Butterworth filter. Small
amplitude high frequency oscillations were applied with the torque motor and the
resulting torque and angular acceleration traces were recorded. The moment of inertia of
the wrist and manipulandum could then be determined by dividing the torque record by
the angular acceleration record during periods of high acceleration. Because reflex forces
are delayed with respect to their time of initiation, it can be assumed that forces due to
reflexes would not be in phase with the driving torque applied by the motor. Because the
torque and acceleration records were not phase shifted with respect to one another, it can
be assumed that reflex forces generated in response to the driving oscillation were either
non existent or too small to have a measurable effect on the inertia estimate.
Viscoelastic forces from the motor shaft or coupling cylinder due to torsion could
be neglected because the wrist-manipulandum system was oscillated at a frequency well
below the natural frequency of the motor shaft and coupling cylinder (1 9Hz). The periods
of high acceleration occurred when velocity was lowest. During these periods of high
acceleration, viscous forces generated from the wrist muscles would be relatively small
and can be considered negligible. However, elastic forces due the wrist musculature need
not be small. Consequently, the wrist-manipulandum system was sinusoidally oscillated
at two different frequencies: 8 Hz and 10 Hz so that both stiffness and inertia could be
estimated. The driving torque for these oscillations was adjusted so that the peak to peak
amplitudes were the same for both frequencies. If 8 is the peak amplitude and e0 is an
offset (the zero point), the equation of motion is
The stiffness, K, and moment of inertia, I, can be estimated using a least squares
approach to minimize
where the subscript i refers to the data sampling matrix. The minimization is done by
setting the derivatives of Equation 12 equal to zero. This leads to the following set of
equations
and
This system of equations has solutions for inertia and stiffness as follows:
and
The subject's hand was oscillated for 8 seconds at either 8 or 10 Hz with the
subject instructed to relax. The position trace was then analyzed for compliance with this
instruction by looking for variations in the maxima and minima. This method was very
sensitive, often showing the effects of involuntary muscle contractions that were not
actually perceived by the subject. The position, acceleration, and torque values were
recorded from oscillations during the last few seconds to avoid any artifact induced by
the motor when it was first turned on. Following these calculations, the system was
oscillated at the other frequency. These position, acceleration, and torque values were
added to the data matrix. The same number of peaks was added to the matrix for both
frequencies. Inertia and stiffness values were then calculated using Equations 15 and 16.
Ten estimates for stiffness and inertia were obtained and these results were averaged for a
final value for each subject.
It was also necessary to account for the moment of inertia of the motor shaft.
This value was determined by rapidly accelerating the manipulandum toward a physical
stop with the motor turned off. The peak torque observed before impact was then divided
by the peak acceleration to obtain the moment of inertia. The moment of inertia of the
motor shaft was determined to be 0.00056 Nm. This value was added to each moment of
inertia measurement of the wrist-manipulandum system.
The method of estimating moment of inertia was validated using metal plates of
known moment of inertia. The moment of inertia of a square metal plate of mass, M, and
length, x, is given by
The plates were oscillated and the moment of inertia estimated in the same manner as the
hand. The measured moment of inertia should yield the same values as those calculated
using Equation 17.
Experimental Procedure
When the subject was ready to begin he was presented with a video display as
shown in Figure 2. The display indicated the desired target distance, target width, and
peak velocity range. With the assistance of visual feedback from the video display the
subject would start by placing a hairline cursor in a one degree wide start window located
twenty degrees into extension. When a steady position had been maintained within this
window for 500 ms the cursor changed colour signaling the subject that a movement
could be initiated. At this time, the controller was programmed to compensate for friction
so that the subject was presented with a frictionless axis about which to move. The
subject then moved the cursor to the indicated target window and attempted to stabilize
the movement within the target boundaries. Following the movement, knowledge of the
results of the peak velocity and level of accuracy was provided via the video display.
Peak velocity was represented as a bar graph, above the velocity target display - the bar
turned green if the correct velocity range was achieved. The subject was provided with
feedback of accuracy by showing his actual range of movement with respect to the left
and right boundaries of the target during the stabilization period. Figure 2 shows the
display as a result of unsuccessful trials due to (a) incorrect velocity (b) movement
outside the target boundaries and (c) a successful trial in which the movement stayed
within the required velocity range and target boundary. ,
On random trials in which the correct maximum velocity was achieved, one of
three levels of positive velocity feedback was used to control the motor. The positive
velocity feedback was applied immediately after the wrist velocity reached zero in the
target window. This created a load with the characteristics of negative viscosity that
effectively reduced the damping of the wrist so that the hand behaved like an
underdamped oscillator.
Subjects were instructed not to react to the increased oscillations produced as a
result of the decreased damping. This instruction was similar do the "do not resist"
instruction which has been shown to be effective by Crago et al. (1976) and Lacquaniti et
al. (1982). Crago et al. (1976) investigated the ability of human subjects to voluntarily
modify their responses to mechanical disturbances of the elbow. They reported that
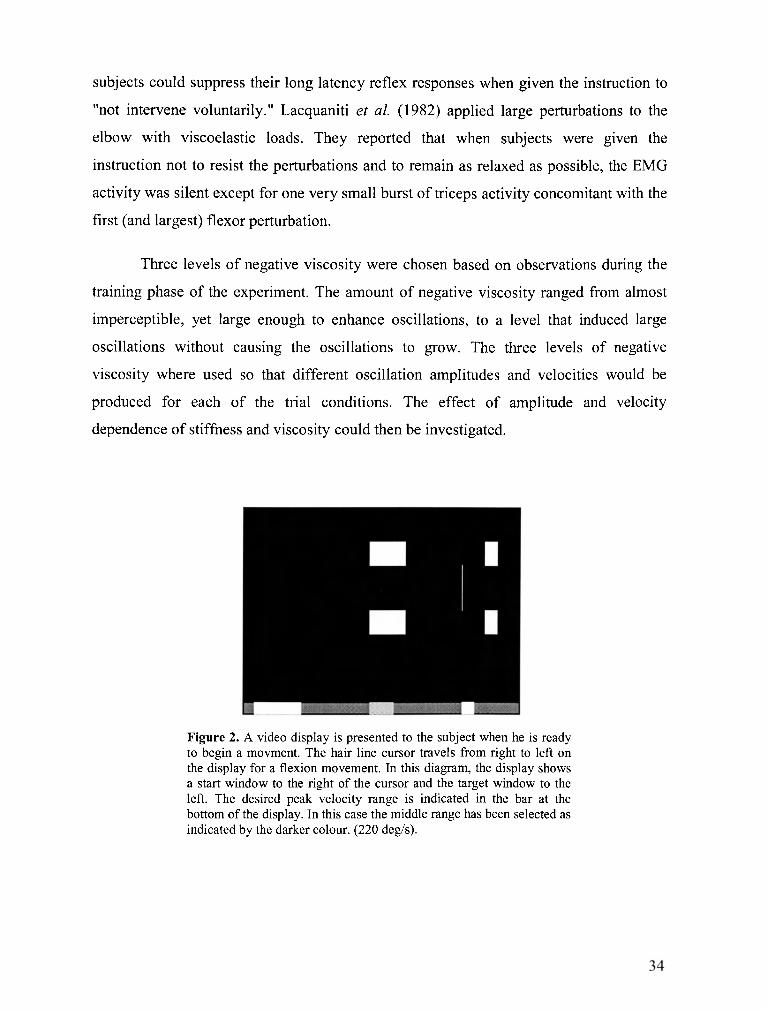
subjects could suppress their long latency reflex responses when given the instruction to
"not intervene voluntarily." Lacquaniti et al. (1982) applied large perturbations to the
elbow with viscoelastic loads. They reported that when subjects were given the
instruction not to resist the perturbations and to remain as relaxed as possible, the EMG
activity was silent except for one very small burst of triceps activity concomitant with the
first (and largest) flexor perturbation.
Three levels of negative viscosity were chosen based on observations during the
training phase of the experiment. The amount of negative viscosity ranged from almost
imperceptible, yet large enough to enhance oscillations, to a level that induced large
oscillations without causing the oscillations to grow. The three levels of negative
viscosity where used so that different oscillation amplitudes and velocities would be
produced for each of the trial conditions. The effect of amplitude and velocity
dependence of stiffness and viscosity could then be investigated.
Figure 2. A video display is presented to the subject when he is ready to begin a movment. The hair line cursor travels from right to left on the display for a flexion movement. In this diagram, the display shows a start window to the right of the cursor and the target window to the left. The desired peak velocity range is indicated in the bar at the bottom of the display. In this case the middle range has been selected as indicated by the darker colour. (220 degls).
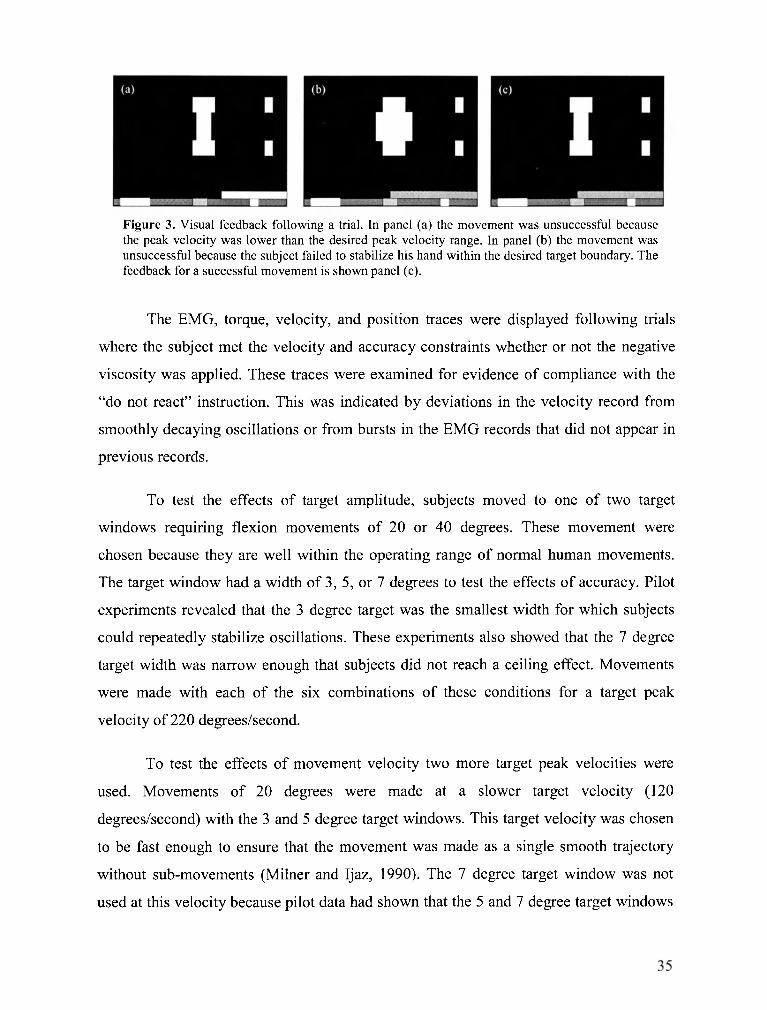
Figure 3. Visual feedback following a trial. In panel (a) the movement was unsuccessful because the peak velocity was lower than the desired peak velocity range. In panel (b) the movement was unsuccessful because the subject failed to stabilize his hand within the desired target boundary. The feedback for a successful movement is shown panel (c).
The EMG, torque, velocity, and position traces were displayed following trials
where the subject met the velocity and accuracy constraints whether or not the negative
viscosity was applied. These traces were examined for evidence of compliance with the
"do not react" instruction. This was indicated by deviations in the velocity record from
smoothly decaying oscillations or from bursts in the EMG records that did not appear in
previous records.
To test the effects of target amplitude, subjects moved to one of two target
windows requiring flexion movements of 20 or 40 degrees. These movement were
chosen because they are well within the operating range of normal human movements.
The target window had a width of 3, 5, or 7 degrees to test the effects of accuracy. Pilot
experiments revealed that the 3 degree target was the smallest width for which subjects
could repeatedly stabilize oscillations. These experiments also showed that the 7 degree
target width was narrow enough that subjects did not reach a ceiling effect. Movements
were made with each of the six combinations of these conditions for a target peak
velocity of 220 degreeslsecond.
To test the effects of movement velocity two more target peak velocities were
used. Movements of 20 degrees were made at a slower target velocity (120
degreeslsecond) with the 3 and 5 degree target windows. This target velocity was chosen
to be fast enough to ensure that the movement was made as a single smooth trajectory
without sub-movements (Milner and Ijaz, 1990). The 7 degree target window was not
used at this velocity because pilot data had shown that the 5 and 7 degree target windows
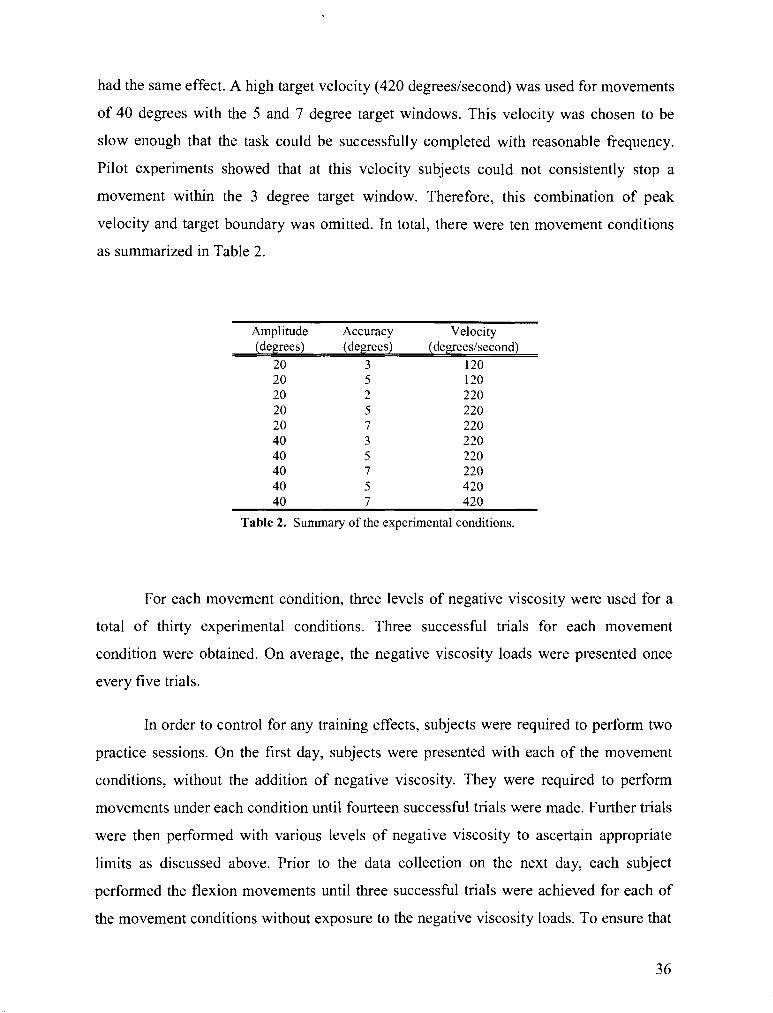
had the same effect. A high target velocity (420 degreeslsecond) was used for movements
of 40 degrees with the 5 and 7 degree target windows. This velocity was chosen to be
slow enough that the task could be successfully completed with reasonable frequency.
Pilot experiments showed that at this velocity subjects could not consistently stop a
movement within the 3 degree target window. Therefore, this combination of peak
velocity and target boundary was omitted. In total, there were ten movement conditions
as summarized in Table 2.
Amplitude Accuracy Velocity (degrees) (degrees) (degreeslsecond)
20 3 120 20 5 120 20 2 220 20 5 220 20 7 220 40 3 220 40 5 220 40 7 220 40 5 420 40 7 420
Table 2. Summary of the experimental conditions.
For each movement condition, three levels of negative viscosity were used for a
total of thirty experimental conditions. Three successful trials for each movement
condition were obtained. On average, the negative viscosity loads were presented once
every five trials.
In order to control for any training effects, subjects were required to perform two
practice sessions. On the first day, subjects were presented with each of the movement
conditions, without the additior, of negative viscosity. They were required to perform
movements under each condition until fourteen successful trials were made. Further trials
were then performed with various levels of negative viscosity to ascertain appropriate
limits as discussed above. Prior to the data collection on the next day, each subject
performed the flexion movements until three successful trials were achieved for each of
the movement conditions without exposure to the negative viscosity loads. To ensure that

the practice effects had indeed stabilized, the peak velocity values for blocks of data with
similar trial conditions were compared for trials near the beginning of the experiments
and at the end of the experiment.
The analysis of the EMG data and the parameter estimation of wrist stiffness and
viscosity was carried out off-line. Trials were rejected if the stabilization phase of the
movement showed evidence of reaction to the effects of negative viscosity (non-uniform
velocity or position traces) or if fewer than three half-cycles of oscillation within the
target window were apparent. Other criteria for rejection were excessive cocontraction at
any time during the movement or a non-zero mean velocity at the end of the movement
indicating a position drift away from the target. Excessive cocontraction was determined
by visual inspection and comparison of the EMG activity to previous trials.
EMG Analysis
The EMG activity from the individual trials were quantified by determining the
root mean squared values during four time intervals as defined by Milner and Cloutier
(1993). These time intervals correspond to different phases of the task: (1)
pre-movement, (2) movement to the target, (3) stabilization at the target, and (4)
post-movement. Using this method, the interval boundaries were determined such that the
EMG for a particular interval would be expected to contribute to the wrist torque during
the corresponding phase of the movement.
Mechanical Impedance Parameter Estimation
The viscoelastic parameters were estimated using the velocity trace. The
combined system of the wrist, ThermoplastB cast, manipulandum, and torque motor may
be modeled as an underdamped harmonic oscillator as described by the following
equation:
where I is the combined inertia of the wrist, plastic mold, manipulandum, and motor, B is
the wrist viscosity, K is the wrist stiffness, and B, is the viscosity of the motor. The
inertia was measured as previously described. The oscillation amplitude and angular
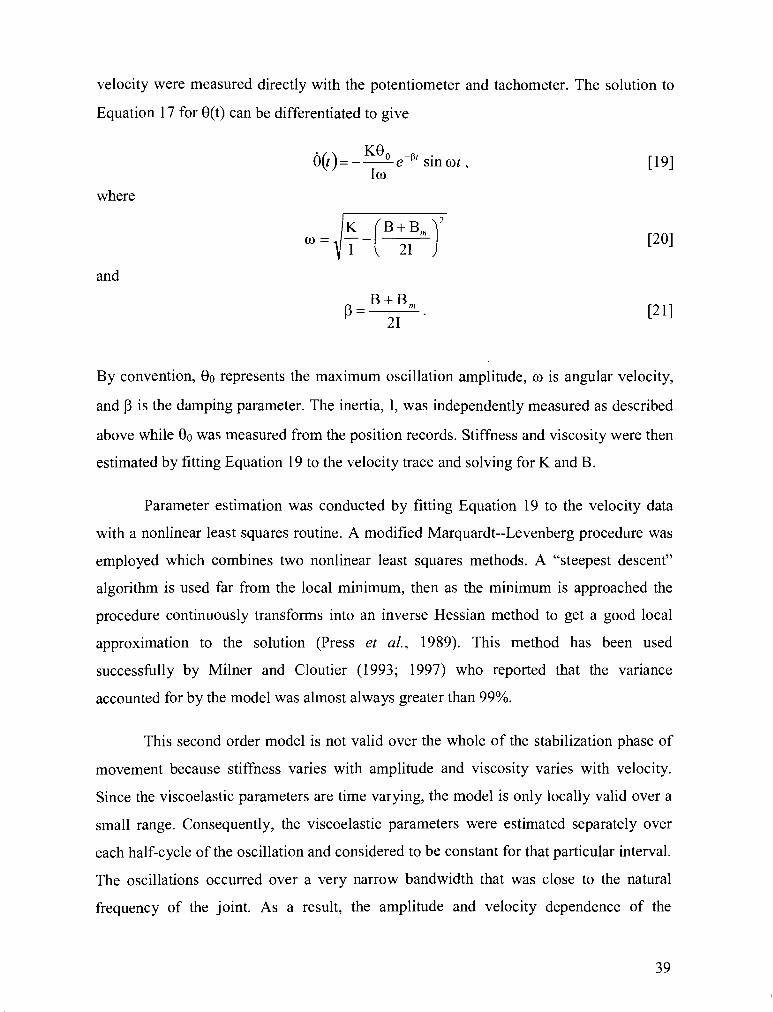
velocity were measured directly with the potentiometer and tachometer. The solution to
Equation 17 for O(t) can be differentiated to give
e-P' sin o t , 0(t)= -- Io
where
and
By convention, 00 represents the maximum oscillation amplitude, o is angular velocity,
and p is the damping parameter. The inertia, I, was independently measured as described
above while 00 was measured from the position records. Stiffness and viscosity were then
estimated by fitting Equation 19 to the velocity trace and solving for K and B.
Parameter estimation was conducted by fitting Equation 19 to the velocity data
with a nonlinear least squares routine. A modified Marquardt--Levenberg procedure was
employed which combines two nonlinear least squares methods. A "steepest descent"
algorithm is used far from the local minimum, then as the minimum is approached the
procedure continuously transforms into an inverse Hessian method to get a good local
approximation to the solution (Press et al., 1989). This method has been used
successfully by Milner and Cloutier (1993; 1997) who reported that the variance
accounted for by the model was almost always greater than 99%.
This second order model is not valid over the whole of the stabilization phase of
movement because stiffness varies with amplitude and viscosity varies with velocity.
Since the viscoelastic parameters are time varying, the model is only locally valid over a
small range. Consequently, the viscoelastic parameters were estimated separately over
each half-cycle of the oscillation and considered to be constant for that particular interval.
The oscillations occurred over a very narrow bandwidth that was close to the natural
frequency of the joint. As a result, the amplitude and velocity dependence of the
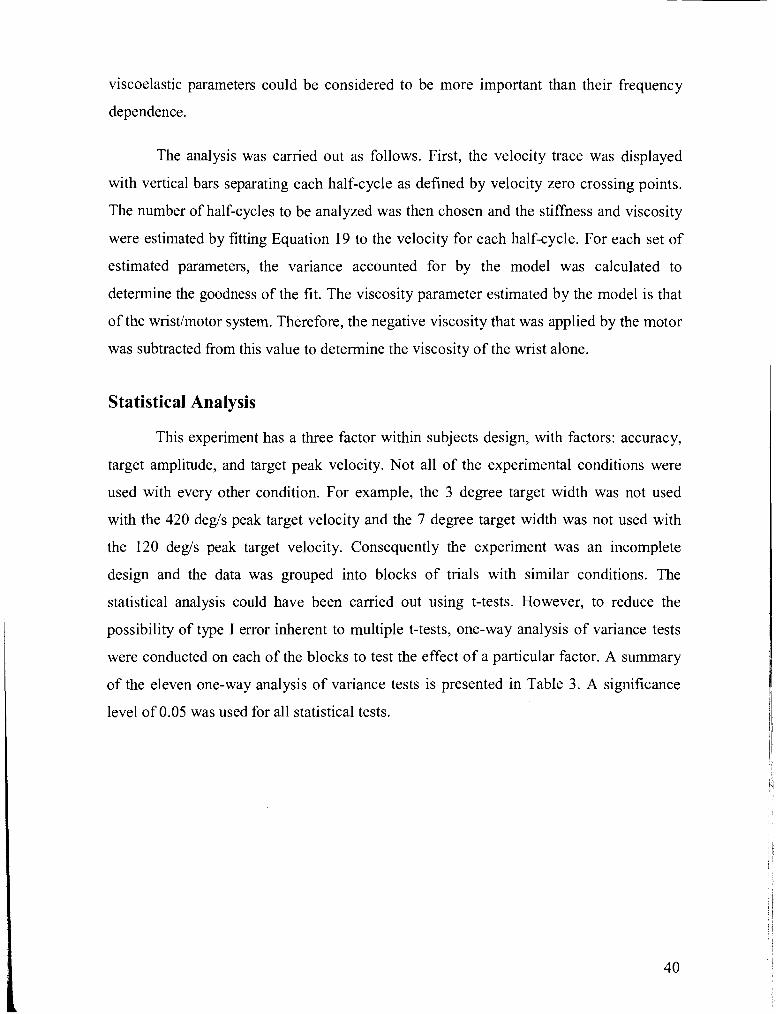
viscoelastic parameters could be considered to be more important than their frequency
dependence.
The analysis was carried out as follows. First, the velocity trace was displayed
with vertical bars separating each half-cycle as defined by velocity zero crossing points.
The number of half-cycles to be analyzed was then chosen and the stiffness and viscosity
were estimated by fitting Equation 19 to the velocity for each half-cycle. For each set of
estimated parameters, the variance accounted for by the model was calculated to
determine the goodness of the fit. The viscosity parameter estimated by the model is that
of the wristimotor system. Therefore, the negative viscosity that was applied by the motor
was subtracted from this value to determine the viscosity of the wrist alone.
Statistical Analysis
This experiment has a three factor within subjects design, with factors: accuracy,
target amplitude, and target peak velocity. Not all of the experimental conditions were
used with every other condition. For example, the 3 degree target width was not used
with the 420 degls peak target velocity and the 7 degree target width was not used with
the 120 degls peak target velocity. Consequently the experiment was an incomplete
design and the data was grouped into blocks of trials with similar conditions. The
statistical analysis could have been carried out using t-tests. However, to reduce the
possibility of type I error inherent to multiple t-tests, one-way analysis of variance tests
were conducted on each of the blocks to test the effect of a particular factor. A summary
of the eleven one-way analysis of variance tests is presented in Table 3 . A significance
level of 0.05 was used for all statistical tests.
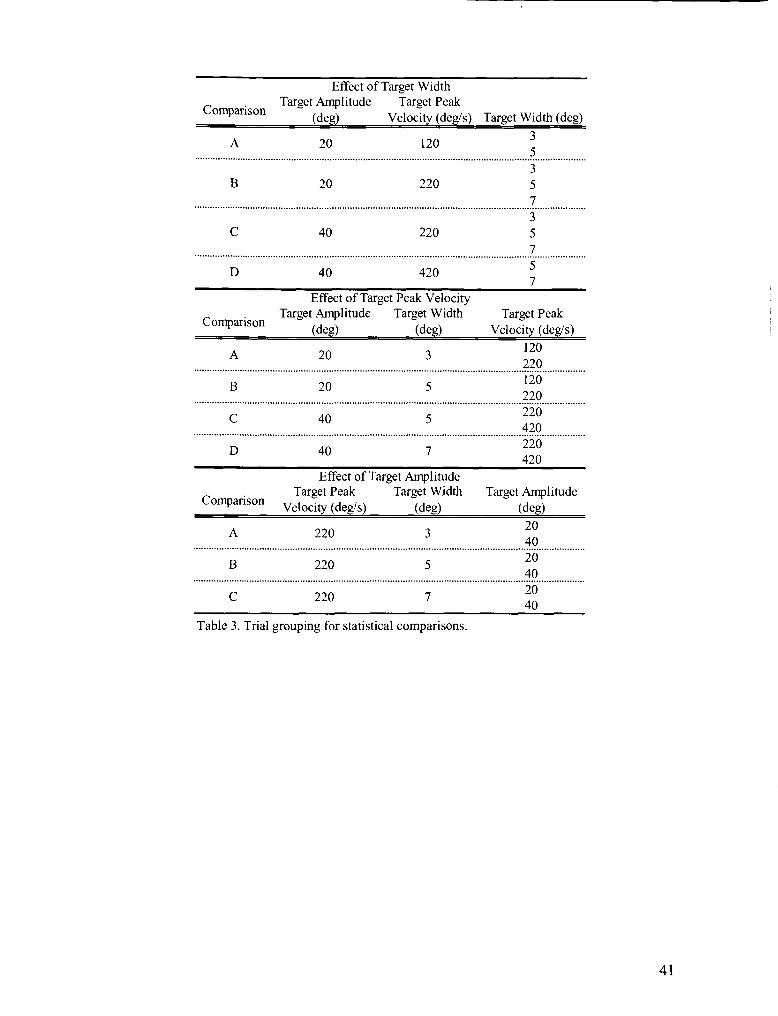
Effect of Target Width - Target Amplitude Target Peak
Comparison (d%) Velocity (deg/s) Target Width (deg) -
D 40 420 5 7
Effect of Target Peak Velocity Target Amplitude - Target width- Target Peak
Comparison (deg) (deg) Velocity (degls)
Effect of Target Amplitude Target Peak ~ a r ~ e t Width Target Amplitude
CornpanSon velocity (degis) (deg) (deg)
. - Table 3. Trial grouping for statistical comparisons.
Moment of Inertia
The measured moment of inertia of the combined hand, ThermoplastB cast, and
manipulandum system ranged from 0.00322 kg-m2 to 0.00541 kg-m2 with an average of
0.00469 kg-m2. Subtracting the moment of inertia of the manipulandum and
ThermoplastB cast, 0.00127 kg-m2, the moment of inertia of the hand ranged from
0.00195 kg-m2 to 0.00414 kg-m2 with an average value of 0.00342 kg-m2. The moment
of inertia of the motor shaft was 0.00056 kg-m2.
For one subject the moment of inertia of the hand was estimated with an
anthropometric method which uses measurements of the wrist to first interphalangeal
joint of the middle finger length, the wrist to middle finger tip length, and the subject's
body mass (Winter, 1990). The moment of inertia of the hand using this method was
0.0037 kg-m2 compared with 0.00342 kg-m2 for our method.
The results of the moment of inertia validation procedure are diagramed in Figure
4. Error bars are not shown on the figure because, in all cases, they were smaller than the
data point symbol. The regression equation for the actual and estimated inertia data has
slope = 0.96 k 0.02 and intercept = 0.00003 kg-m2 + 0.00015 kg-m2. The estimated
inertia values are slightly higher than the actual values. Ideally, the slope should be equal
to one and the intercept should be zero. The slope value indicates that the combined error
of the torque and velocity conversion factors is approximately 4%. This could be the
result of too large a torque conversion factor andlor too small a velocity conversion
factor. The intercept was not statistically significant from zero. The inertia estimates were
corrected for this 4% error for the viscoelastic parameter estimation procedure. The
values reported above are the corrected estimates of inertia.
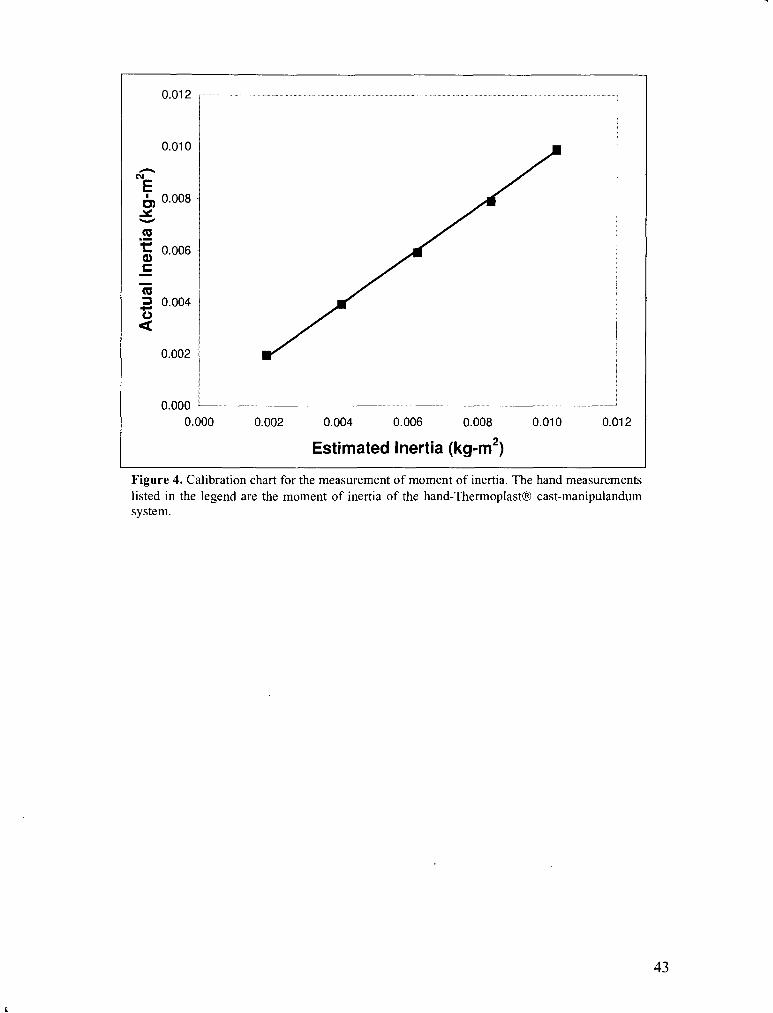
-
Estimated Inertia (kg-m2)
Figure 4. Calibration chart for the measurement of moment of inertia. The hand measurements listed in the legend are the moment of inertia of the hand-Themoplast8 cast-manipulandum system.
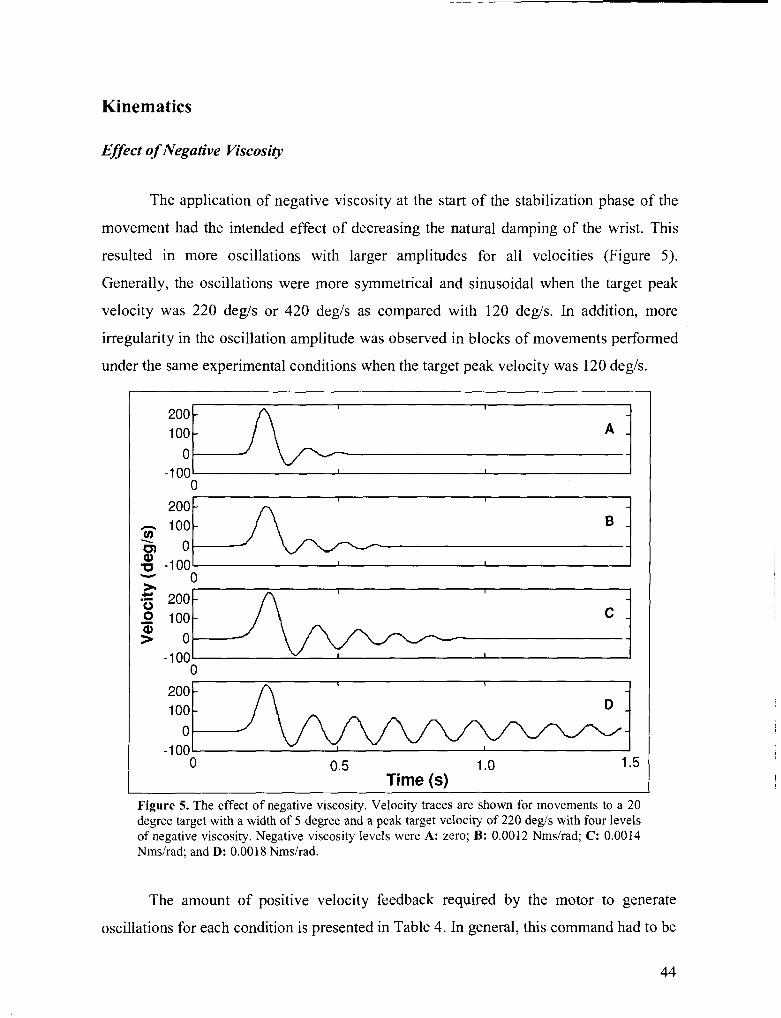
Kinematics
Effect of Negative Viscosity
The application of negative viscosity at the start of the stabilization phase of the
movement had the intended effect of decreasing the natural damping of the wrist. This
resulted in more oscillations with larger amplitudes for all velocities (Figure 5).
Generally, the oscillations were more symmetrical and sinusoidal when the target peak
velocity was 220 degls or 420 degls as compared with 120 degls. In addition, more
irregularity in the oscillation amplitude was observed in blocks of movements performed
under the same experimental conditions when the target peak velocity was 120 degls.
0 0.5 1 .O 1.5 Time (s)
Figure 5. The effect of negative viscosity. Velocity traces are shown for movements to a 20 degree target with a width of 5 degree and a peak target velocity of 220 degis with four levels of negative viscosity. Negative viscosity levels were A: zero; B: 0.0012 Nmsirad; C: 0.0014 Nmsirad: and D: 0.001 8 Nmslrad.
The amount of positive velocity feedback required by the motor to generate
oscillations for each condition is presented in Table 4. In general, this command had to be
44
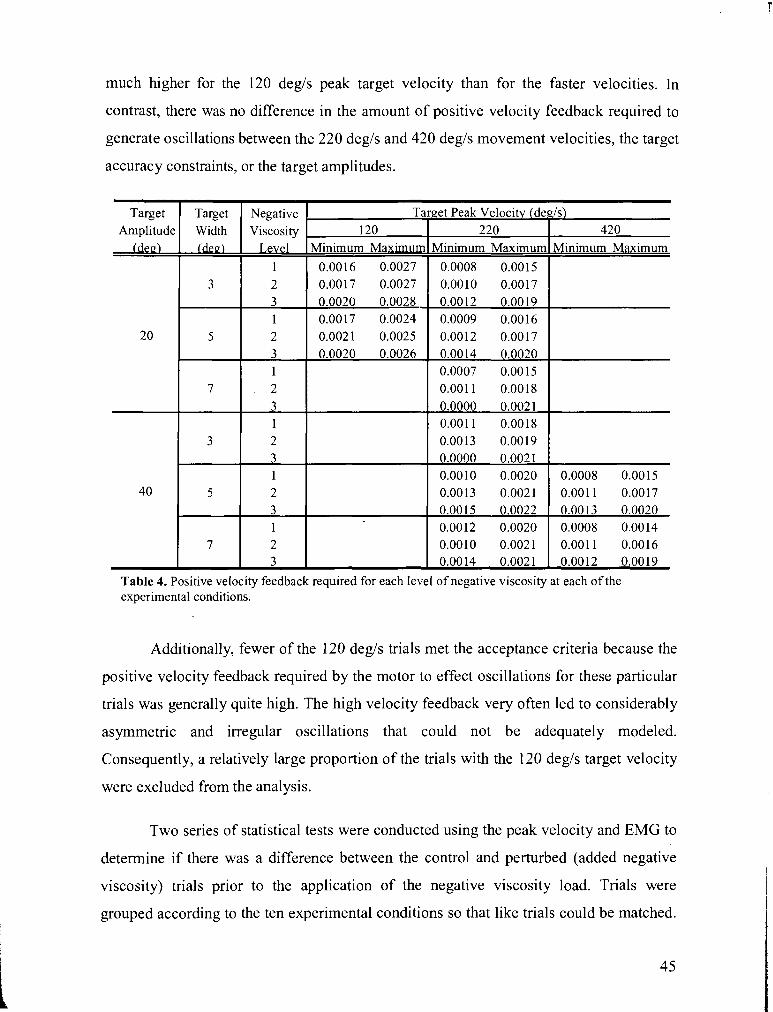
much higher for the 120 degls peak target velocity than for the faster velocities. In
contrast, there was no difference in the amount of positive velocity feedback required to
generate oscillations between the 220 degls and 420 degls movement velocities, the target
accuracy constraints, or the target amplitudes.
Additionally, fewer of the 120 deg/s trials met the acceptance criteria because the
Target Amplitude
(dee)
20
40
positive velocity feedback required by the motor to effect oscillations for these particular
trials was generally quite high. The high velocity feedback very often led to considerably
Table 4. Positive velocity feedback required for each level of negative viscosity at each of the experimental conditions.
Target Width (dev)
3
5
7
3
5
7
asymmetric and irregular oscillations that could not be adequately modeled.
Consequently, a relatively large proportion of the trials with the 120 degls target velocity
Negative Viscosity
1,evel 1 2 3 1 2 3 1 2 3 1 2 3 1 2 3 1 2 3
were excluded from the analysis.
Two series of statistical tests were conducted using the peak velocity and EMG to
determine if there was a difference between the control and perturbed (added negative
viscosity) trials prior to the application of the negative viscosity load. Trials were
grouped according to the ten experimental conditions so that like trials could be matched.
120 Minimum Maximum
0.0016 0.0027 0.0017 0.0027 0.0020 0.0028 0.0017 0.0024 0.002 1 0.0025 0.0020 0.0026
Target Peak Velocity (degls) 220
Minimum Maximum
0.0008 0.0015 0.0010 0.0017 0.0012 0.00 19 0.0009 0.0016 0.0012 0.00 17 0.00 14 0.0020 0.0007 0.0015 0.001 1 0.0018 0.0000 0.0021 0.0011 0.0018 0.0013 0.0019 0.0000 0.0021 0.0010 0.0020 0.0013 0.0021 0.00 15 0.0022 0.0012 0.0020 0.0010 0.002 1 0.0014 0.0021
420 Minimum Maximum
0.0008 0.0015 0.001 1 0.0017 0.00 13 0.0020 0.0008 0.0014 0.001 1 0.0016 0.0012 0.0019
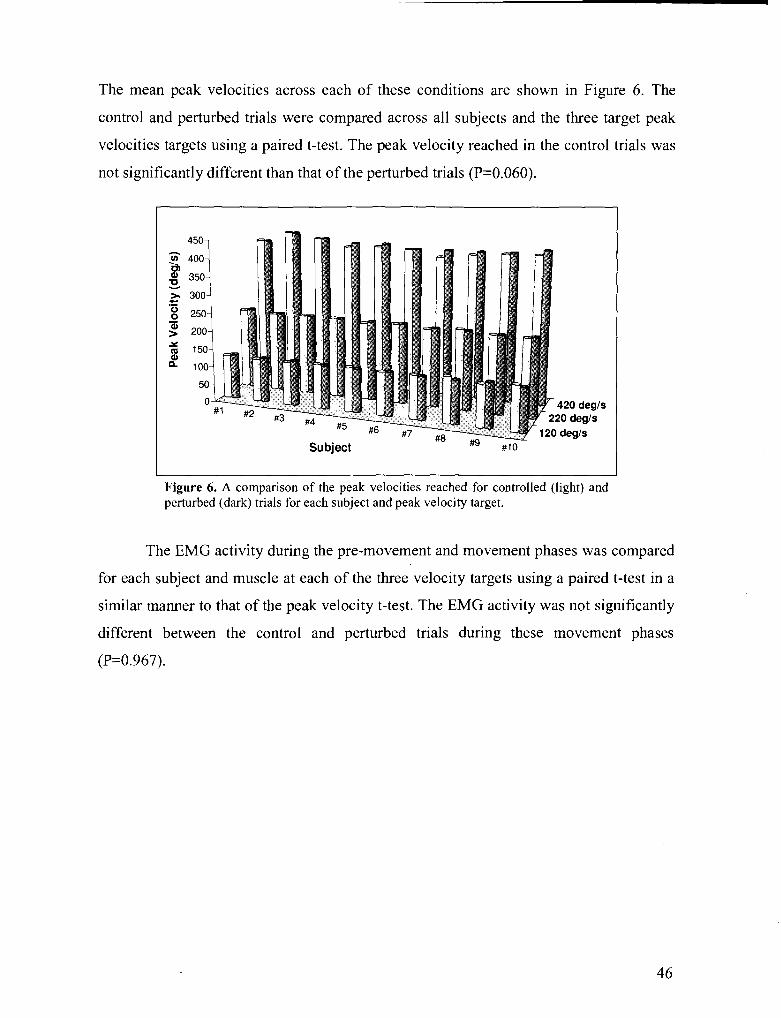
The mean peak velocities across each of these conditions are shown in Figure 6. The
control and perturbed trials were compared across all subjects and the three target peak
velocities targets using a paired t-test. The peak velocity reached in the control trials was
not significantly different than that of the perturbed trials (P=0.060).
Subject
Figure 6. A comparison of the peak velocities reached for controlled (light) and perturbed (dark) trials for each subject and peak velocity target.
The EMG activity during the pre-movement and movement phases was compared
for each subject and muscle at each of the three velocity targets using a paired t-test in a
similar manner to that of the peak velocity t-test. The EMG activity was not significantly
different between the control and perturbed trials during these movement phases
(P=0.967).
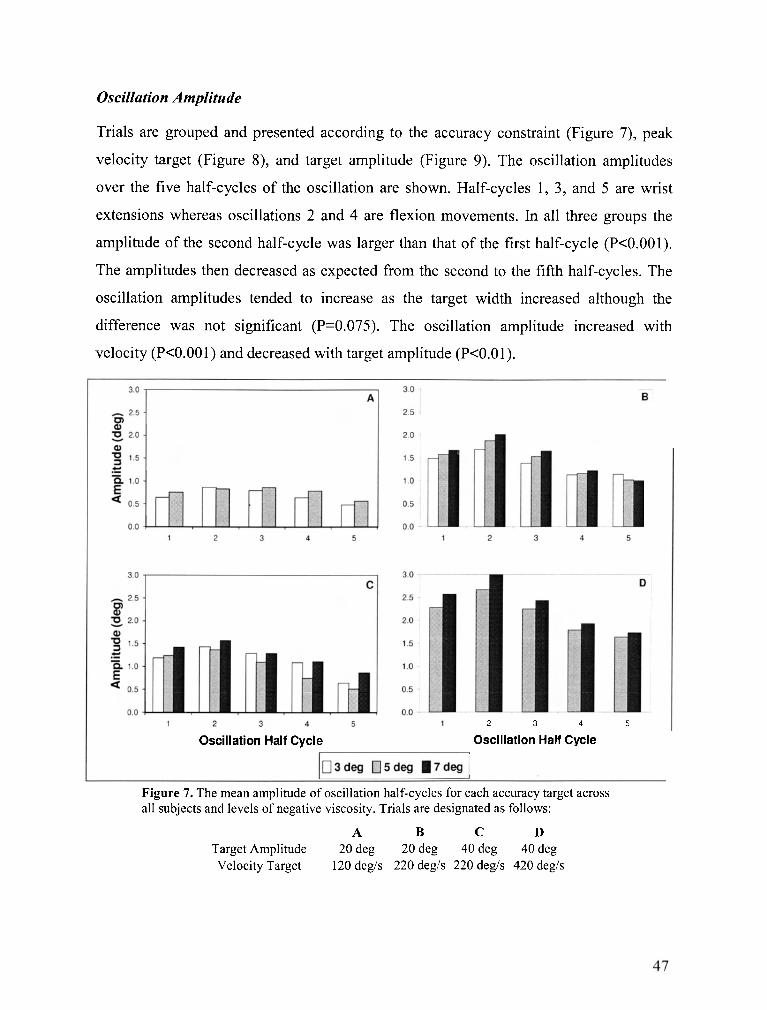
Oscillation Amplitude
Trials are grouped and presented according to the accuracy constraint (Figure 7), peak
velocity target (Figure 8), and target amplitude (Figure 9). The oscillation amplitudes
over the five half-cycles of the oscillation are shown. Half-cycles 1, 3, and 5 are wrist
extensions whereas oscillations 2 and 4 are flexion movements. In all three groups the
amplitude of the second half-cycle was larger than that of the first half-cycle (P<0.001).
The amplitudes then decreased as expected from the second to the fifth half-cycles. The
oscillation amplitudes tended to increase as the target width increased although the
difference was not significant (P=0.075). The oscillation amplitude increased with
velocity (P<0.001) and decreased with target amplitude (P<0.01).
Oscillation Half Cycle 2 3 4 5
Oscillation Half Cycle
Figure 7. The mean amplitude of oscillation half-cycles for each accuracy target across all subjects and levels of negative viscosity. Trials are designated as follows:
A B C D Target Amplitude 20 deg 20 deg 40 deg 40 deg Velocity Target 120 degls 220 degls 220 degls 420 degls
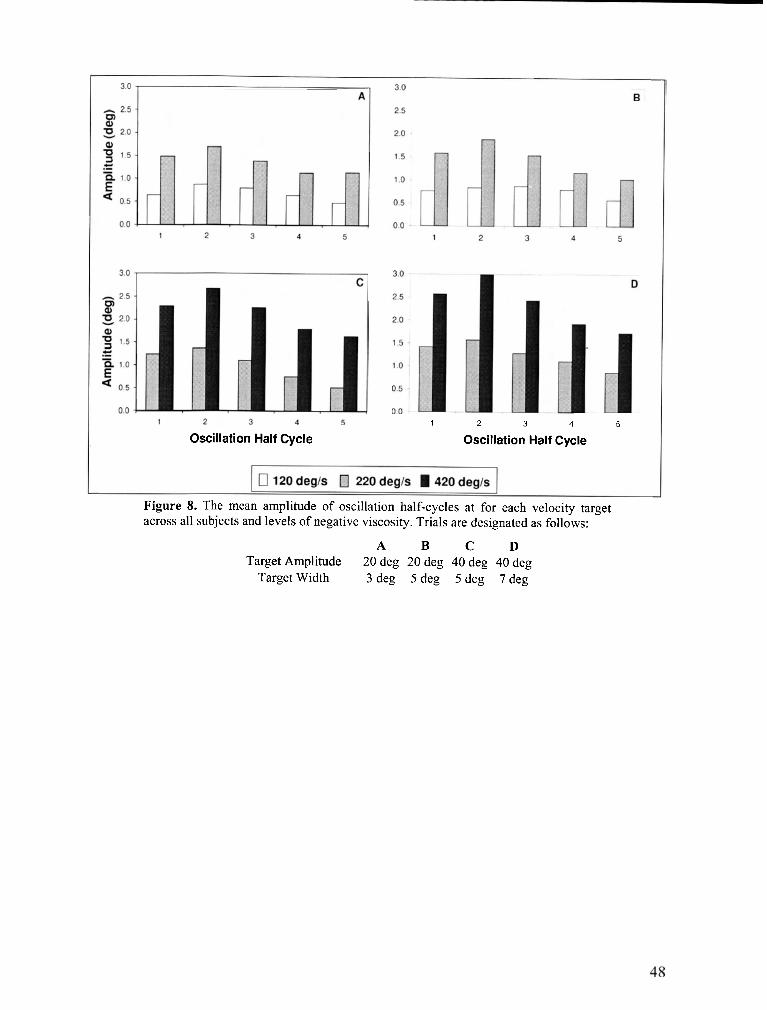
Oscillation Half Cycle 1 2 3 4 5
Oscillation Half Cycle
Figure 8. The mean amplitude of oscillation half-cycles at for each velocity target across all subjects and levels of negative viscosity. Trials are designated as follows:
A B C D Target Amplitude 20 deg 20 deg 40 deg 40 deg
Target Width 3 deg 5 deg 5 deg 7 deg
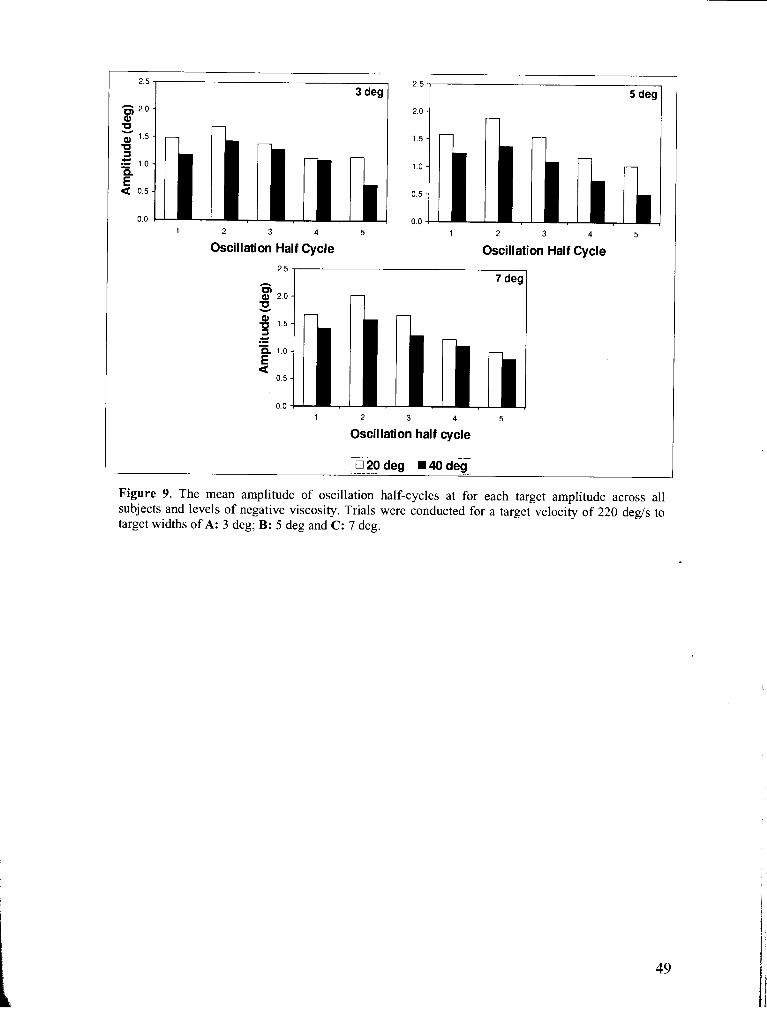
3 deg
1 2 3 4 5
Oscillation Half Cycle
2.5 5 deg
Oscillation Half Cycle
7 deg
1 2 3 4
Oscillation half cycle
Figure 9. The mean amplitude of oscillation half-cycles at for each target amplitude across all subjects and levels of negative viscosity. Trials were conducted for a target velocity of 220 degls to target widths of A: 3 deg; B: 5 deg and C: 7 deg.
Viscoelastic Behavior
There was a considerable amount of trial to trial variability in the parameter
estimates for all of the viscoelastic parameters. However the data do show some very
clear patterns. Stiffness tended to be high for the first half-cycle of oscillation as the wrist
moved in extension. In all cases the wrist stiffness dropped over the second half-cycle of
oscillation and then progressively increased for the next three half-cycles. Viscosity
tended to be low and was very often negative for the first half-cycle oscillation. It
increased until the third or fourth half-cycle and then decreased slightly over the fourth
and fifth half-cycles. The damping ratio followed a very similar pattern to that of
viscosity. The coefficient of determination (variance accounted for) was very high (on
average R~ = 0.987) indicating that the model fit the data extremely well.
Effect of Oscillation Amplitude and Velocity
For all trials, both the oscillation amplitude and velocity decreased over the
course of the stabilization phase. In order to determine the effects of these decreases on
the viscoelastic parameters, the trials separated into three groups based on amplitude or
velocity and compared with stiffness and viscosity respectively (Figures 10 and 11). For
each comparison, a one-way ANOVA was conducted to determine if the changes in the
viscoelastic parameters were statistically significant. Stiffness increased nonlinearly as
the amplitude of the oscillations decreased (P < 0.001). In addition, viscosity increased
nonlinearly as the velocity of the oscillations decreased (P < 0.001).
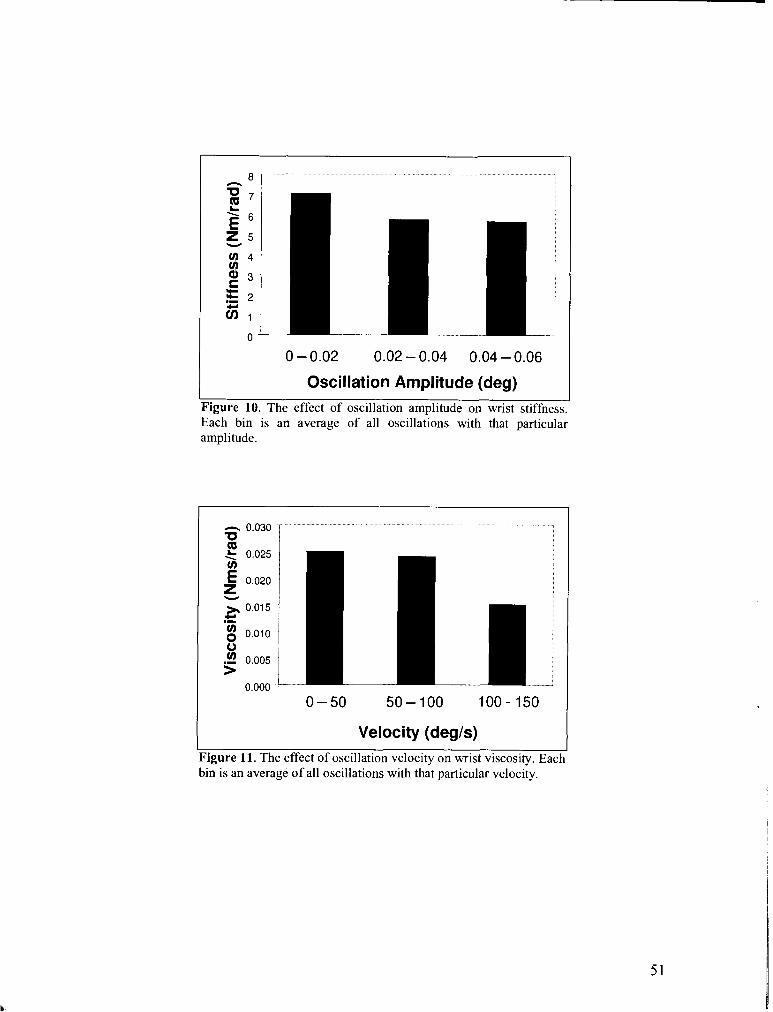
Ggure 10. The effect of oscillation amplitude on wrist stiffness.
0 - 0.02 0.02 - 0.04 0.04 - 0.06
Oscillation Amplitude (deg) L E - Each bin is an average of all oscilla~ions with that particular amplitude.
Velocity (degls) 1 rigure 11. The effect of oscillation velocity on wrist viscositv. Each
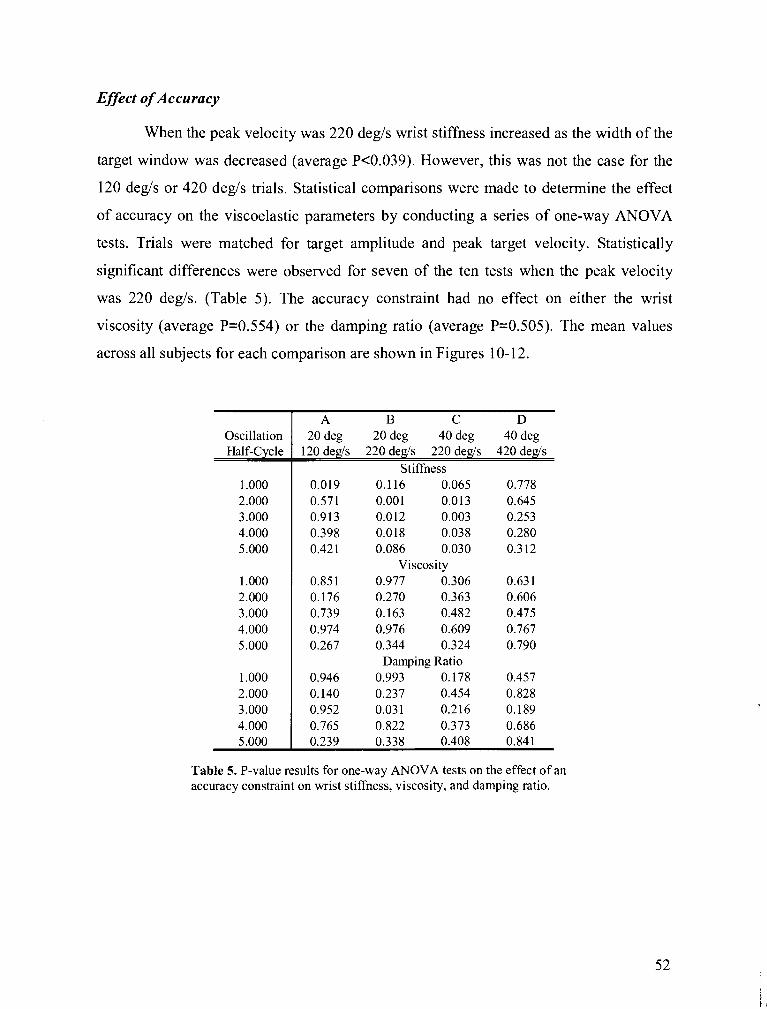
Effect of Accuracy
When the peak velocity was 220 degls wrist stiffness increased as the width of the
target window was decreased (average Pc0.039). However, this was not the case for the
120 degls or 420 degls trials. Statistical comparisons were made to determine the effect
of accuracy on the viscoelastic parameters by conducting a series of one-way ANOVA
tests. Trials were matched for target amplitude and peak target velocity. Statistically
significant differences were observed for seven of the ten tests when the peak velocity
was 220 degls. (Table 5). The accuracy constraint had no effect on either the wrist
viscosity (average P=0.554) or the damping ratio (average P=0.505). The mean values
across all subjects for each comparison are shown in Figures 10- 12.
Oscillation Half-Cycle
1 .ooo 2.000 3.000 4.000 5.000
1 .ooo 2.000 3.000 4.000 5.000
1 .ooo 2.000 3.000 4.000 5.000
A B C D 20 deg 20 deg 40 deg 40 deg
120 degk 220 deds 220 deds 420 degls Stiffness
0.019 0.116 0.065 0.778 0.571 0.001 0.013 0.645 0.9 13 0.012 0.003 0.253 0.398 0.018 0.038 0.280 0.42 1 0.086 0.030 0.312
Viscosity 0.85 1 0.977 0.306 0.63 1 0.176 0.270 0.363 0.606 0.739 0.163 0.482 0.475 0.974 0.976 0.609 0.767 0.267 0.344 0.324 0.790
Damping Ratio 0.946 0.993 0.178 0.457 0.140 0.237 0.454 0.828 0.952 0.03 1 0.216 0.189 0.765 0.822 0.373 0.686 0.239 0.338 0.408 0.841
Table 5. P-value results for one-way ANOVA tests on the effect of an accuracy constraint on wrist stiffness, viscosity, and damping ratio.
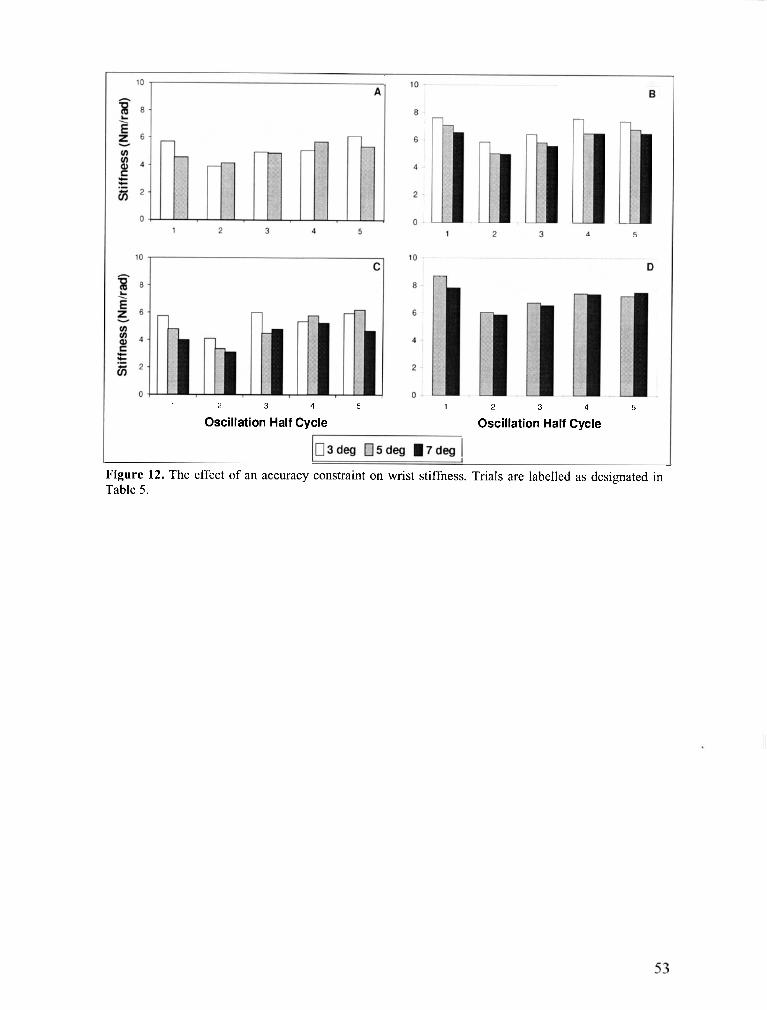
1 2 3 4 5
Oscillation Half Cycle 1 2 3 4 5
Oscillation Half Cycle
Figure 12. The effect of an accuracy constraint on wrist stiffness. Trials are labelled as designated in Table 5.
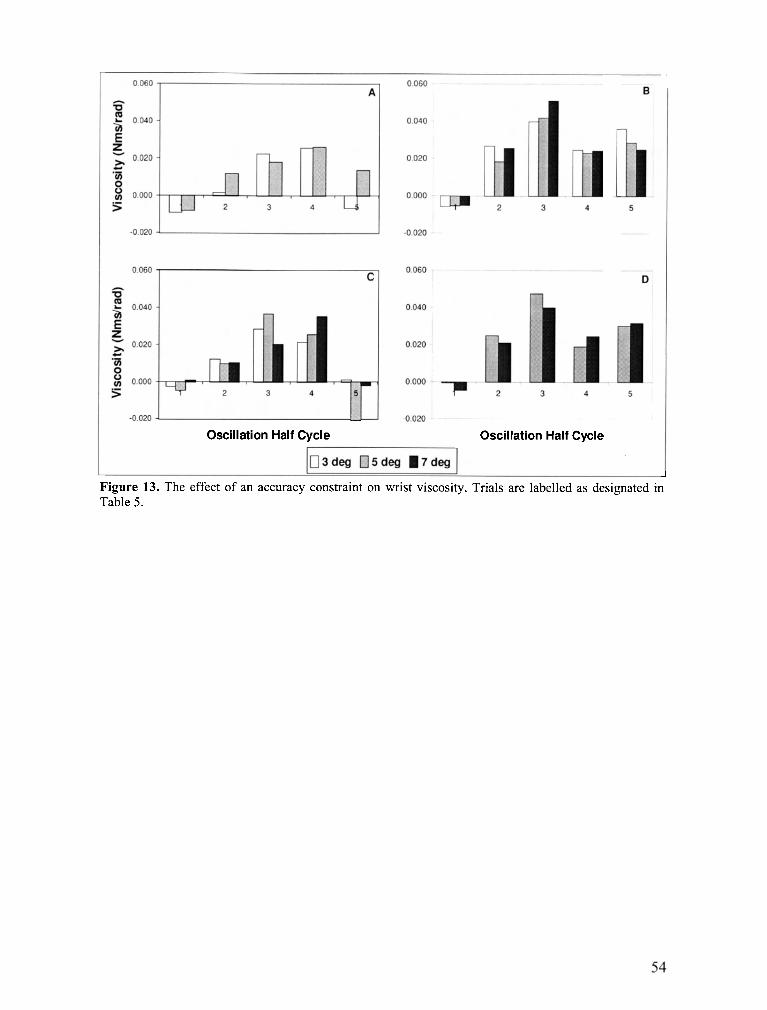
- Oscillation Half Cycle Oscillation Half Cycle
J
Figure 13. The effect of an accuracy constraint on wrist viscosity. Trials are labelled as designated in Table 5.
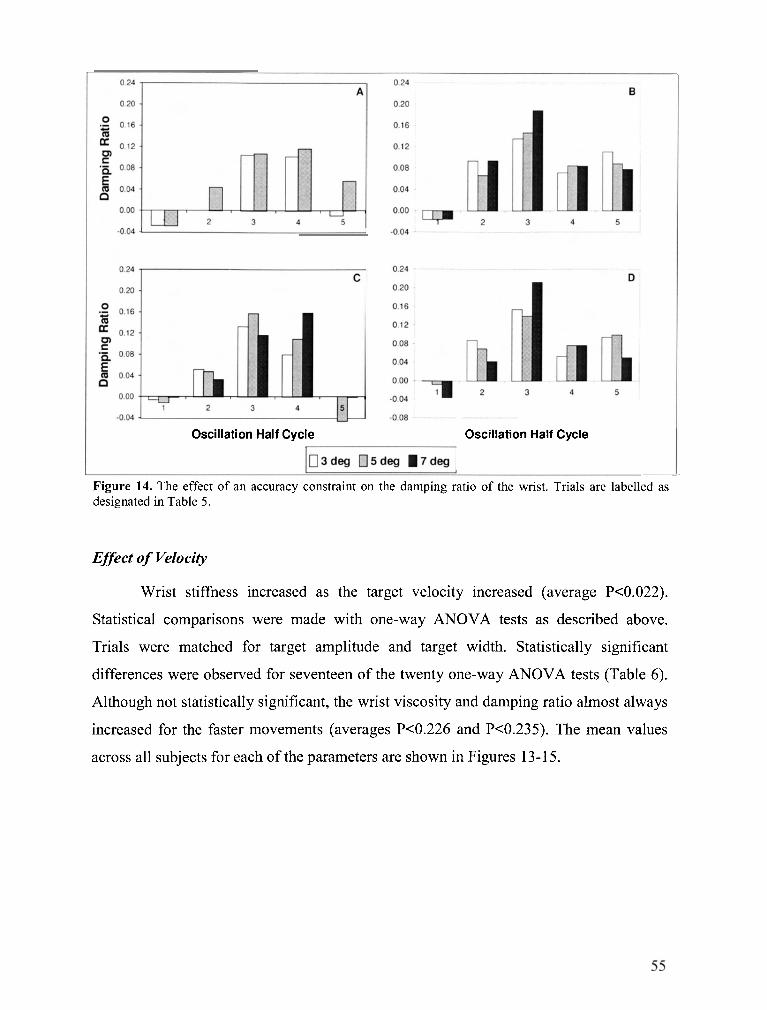
Oscillation Half Cycle
- -
Oscillation Half Cycle
Figure 14. The effect of an accuracy constraint on the damping ratio of the wrist. Trials are labelled as designated in Table 5.
Effect of Velocity
Wrist stiffness increased as the target velocity increased (average PC0.022).
Statistical comparisons were made with one-way ANOVA tests as described above.
Trials were matched for target amplitude and target width. Statistically significant
differences were observed for seventeen of the twenty one-way ANOVA tests (Table 6).
Although not statistically significant, the wrist viscosity and damping ratio almost always
increased for the faster movements (averages P<0.226 and P<0.235). The mean values
across all subjects for each of the parameters are shown in Figures 13-1 5.
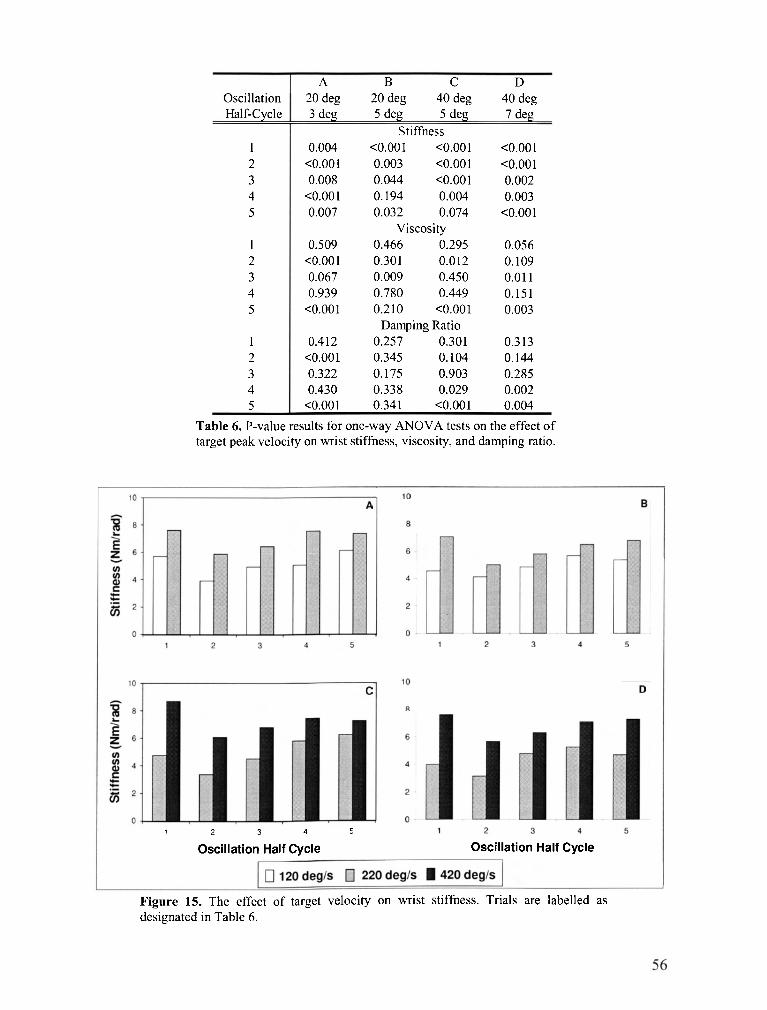
Oscillation Half-Cycle
1 2 3 4 5
1 2 3 4 5
1 2 3 4 5
A B C D 20 deg 20 deg 40 deg 40 deg 3 deg 5 deg 5 deg 7 deg
Stiffness 0.004 <0.001 <0.001 <0.001
<O.OO 1 0.003 <0.001 <0.001 0.008 0.044 <0.001 0.002
<O.OO 1 0.194 0.004 0.003 0.007 0.032 0.074 <0.001
Viscosity 0.509 0.466 0.295 0.056
<O.OO 1 0.301 0.012 0.109 0.067 0.009 0.450 0.01 1 0.939 0.780 0.449 0.151
<0.001 0.210 <0.001 0.003 Damping Ratio
0.412 0.257 0.301 0.3 13 <0.001 0.345 0.104 0.144 0.322 0.175 0.903 0.285 0.430 0.338 0.029 0.002
<O.OO 1 0.341 <0.001 0.004
Table 6. P-value results for one-way ANOVA tests on the effect of target peak velocity on wrist stiffness, viscosity, and damping ratio.
1 2 3 4 5
Oscillation Half Cycle Oscillation Half Cycle
Figure 15. The effect of target velocity on wrist stiffness. Trials are labelled as designated in Table 6.
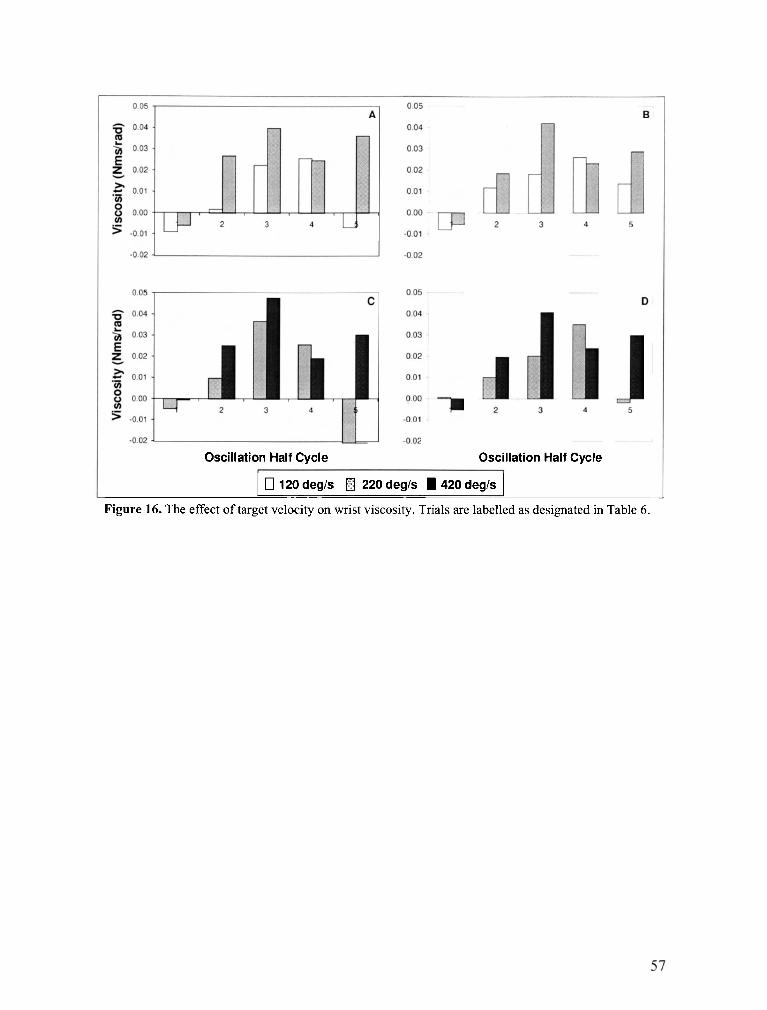
Oscillation Half Cycle -
Oscillation Half Cycle
1 0 120 degls a 220 degh 1 420 degh I Figure 16. The effect of target velocity on wrist viscosity. Trials are labelled as designated in Table 6.
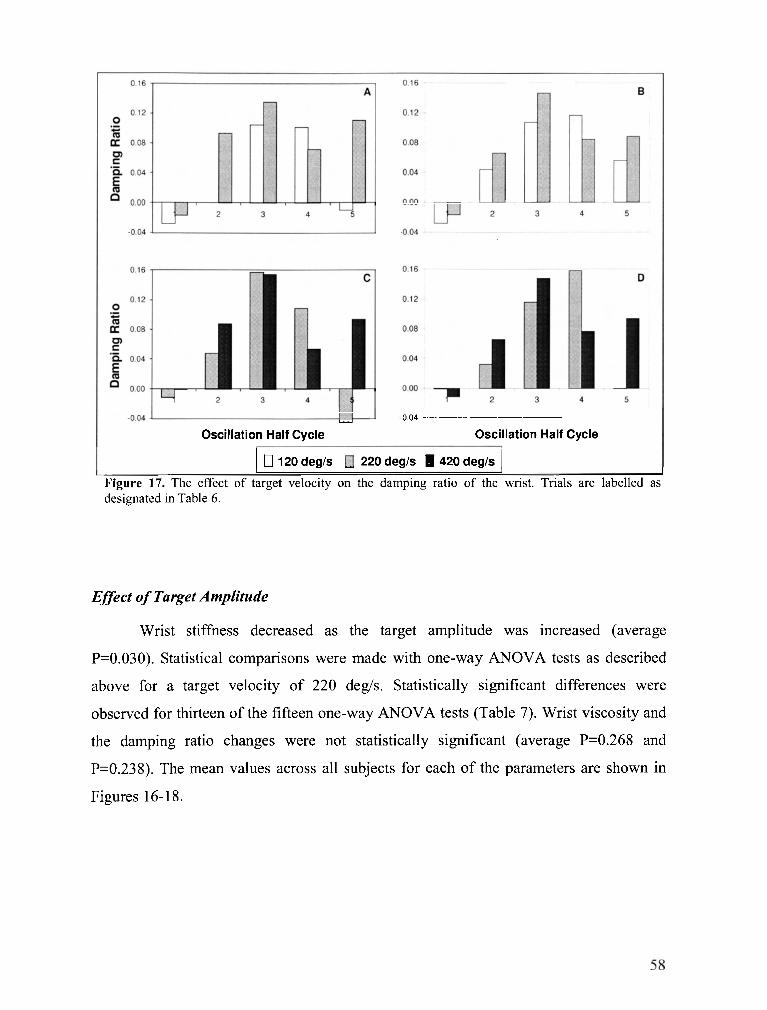
*
Oscillation Half Cycle
.o&, - - - ---
Oscillation Half Cycle
I 0 120 degls 220 degls 1 420 degls 1 I I I
Figure 17. The effect of target velocity on the damping ratio of the wrist. Trials are labelled as designated in Table 6.
Effect of Target Amplitude
Wrist stiffness decreased as the target amplitude was increased (average
P=0.030). Statistical comparisons were made with one-way ANOVA tests as described
above for a target velocity of 220 degls. Statistically significant differences were
observed for thirteen of the fifteen one-way ANOVA tests (Table 7). Wrist viscosity and
the damping ratio changes were not statistically significant (average P=0.268 and
P=0.238). The mean values across all subjects for each of the parameters are shown in
Figures 16- 1 8.
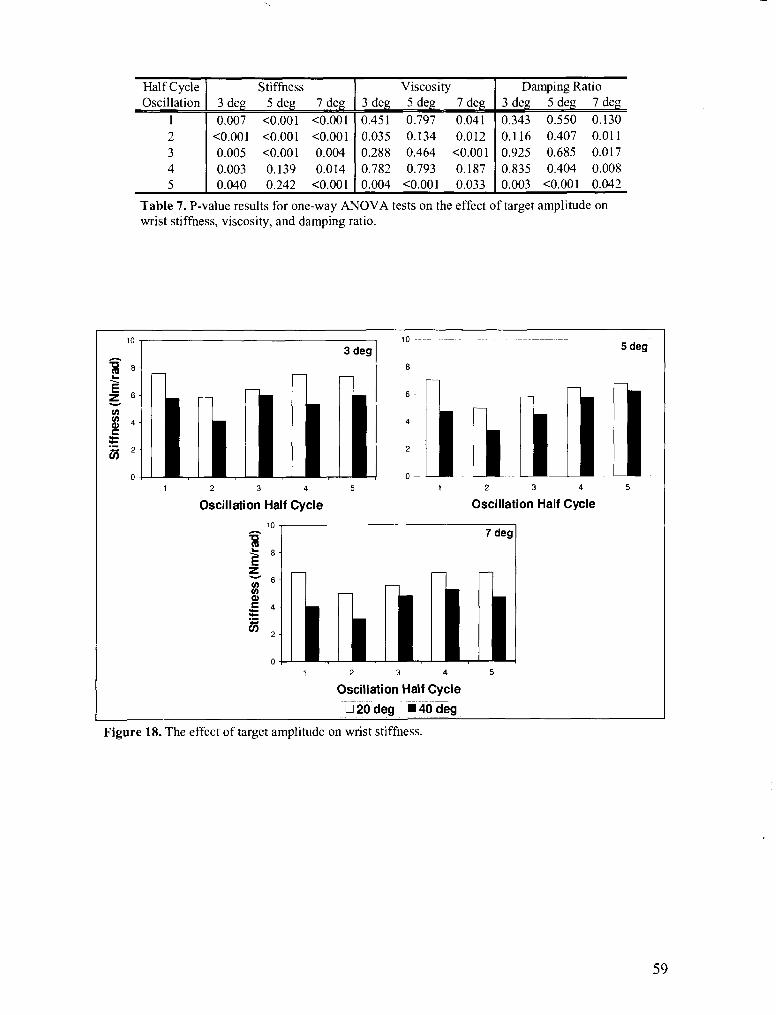
Half Cycle I Stiffness I Viscosity I Damping Ratio oscillation 1 3 deg 5 deg 7 deg
1 1 0.007 <0.001 <0.001
3 deg
- ~
3 deg 5 deg 7 deg 0.451 0.797 0.041 0.343 0.550 0.130
2 3 4 5
Oscillation Half Cycle Oscillation Half Cycle
Table 7. P-value results for one-way ANOVA tests on the effect of target amplitude on wrist stiffness, viscosity, and damping ratio.
<0.001 <0.001 <0.001 0.005 <0.001 0.004 0.003 0.139 0.014 0.040 0.242 <0.001
i n . 7 deg
Oscillation Half Cycle
0.035 0.134 0.012 0.288 0.464 <0.001 0.782 0.793 0.187 0.004 <0.001 0.033
d20deg .° Figure 18. The effect of target amplitude on wrist stiffness.
0.1 16 0.407 0.01 1 0.925 0.685 0.017 0.835 0.404 0.008 0.003 <0.001 0.042
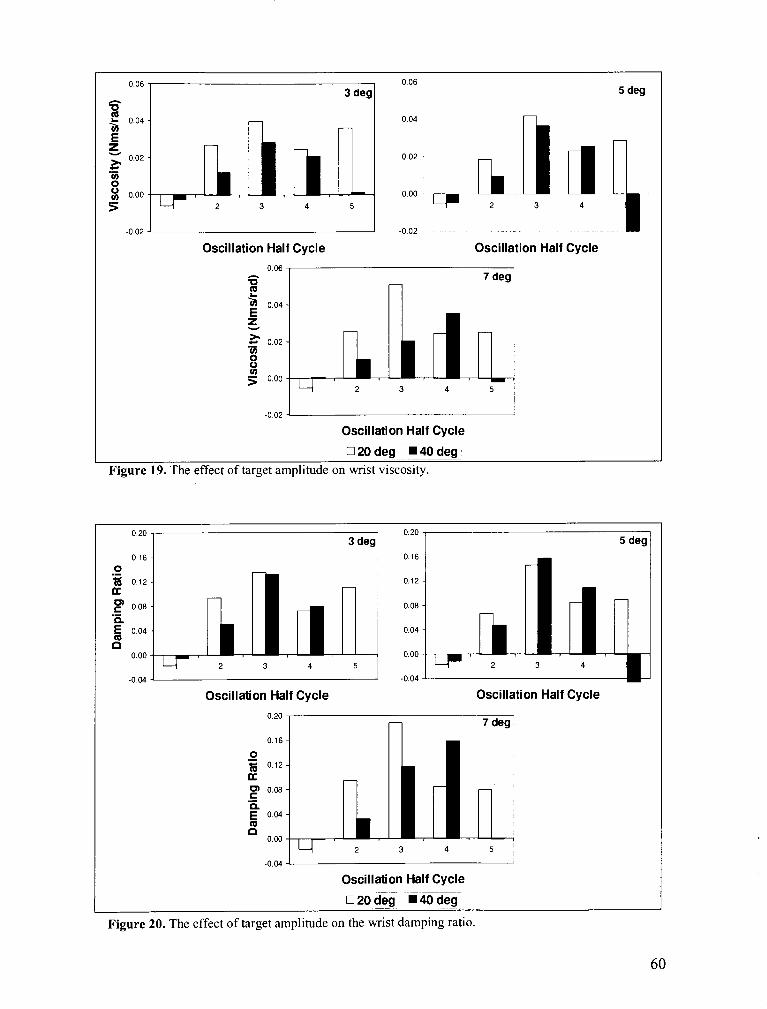
0.06 0 06 3 deg 1 5 deg
Oscillation Half Cycle Oscillation Half Cycle
-0.02 J I
Oscillation Half Cycle
0.06
0 20 deg c%!d&~ Figure 19. The effect of target amplitude on wrist viscosity.
2 7 deg n
Oscillation Half Cycle Oscillation Half Cycle
0.20 0.20
0.20
n 7 deg
3 deg
Oscillation Half Cycle
5 deg
-
0 20 deg - W 40 deg A
Figure 20. The effect of target amplitude on the wrist damping ratio.
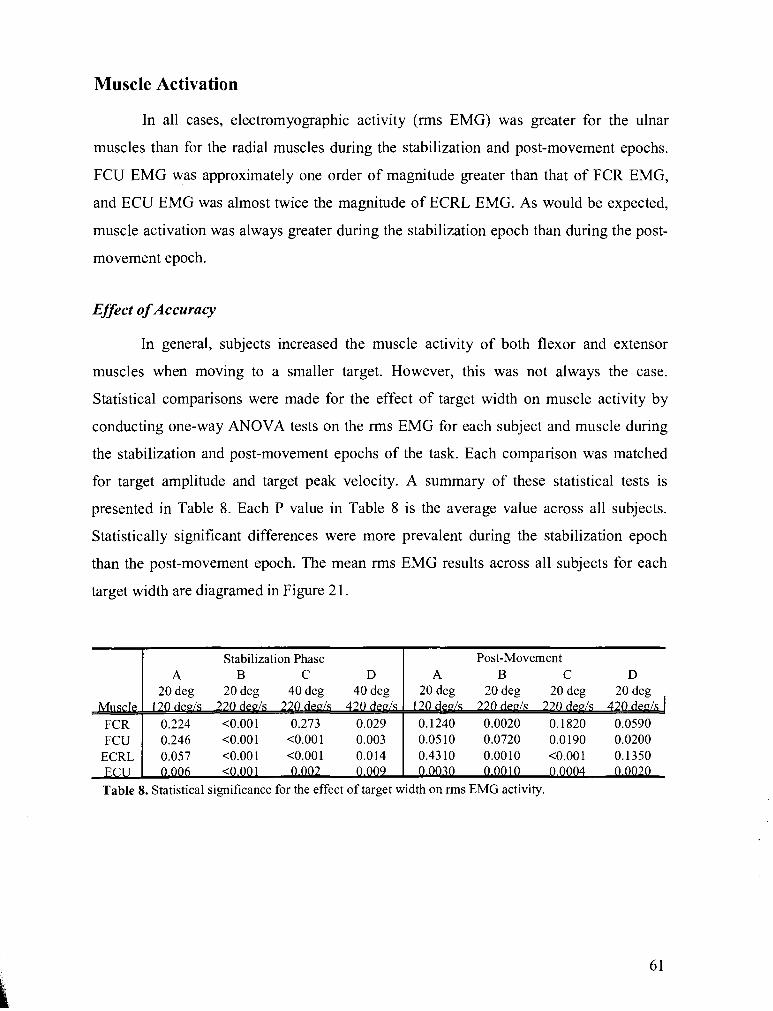
Muscle Activation
In all cases, electromyographic activity (rms EMG) was greater for the ulnar
muscles than for the radial muscles during the stabilization and post-movement epochs.
FCU EMG was approximately one order of magnitude greater than that of FCR EMG,
and ECU EMG was almost twice the magnitude of ECRL EMG. As would be expected,
muscle activation was always greater during the stabilization epoch than during the post-
movement epoch.
Effect of Accuracy
In general, subjects increased the muscle activity of both flexor and extensor
muscles when moving to a smaller target. However, this was not always the case.
Statistical comparisons were made for the effect of target width on muscle activity by
conducting one-way ANOVA tests on the rms EMG for each subject and muscle during
the stabilization and post-movement epochs of the task. Each comparison was matched
for target amplitude and target peak velocity. A summary of these statistical tests is
presented in Table 8. Each P value in Table 8 is the average value across all subjects.
Statistically significant differences were more prevalent during the stabilization epoch
than the post-movement epoch. The mean rms EMG results across all subjects for each
target width are diagramed in Figure 2 1.
Table 8. Statistical significance for the effect of target width on rms EMG activity.
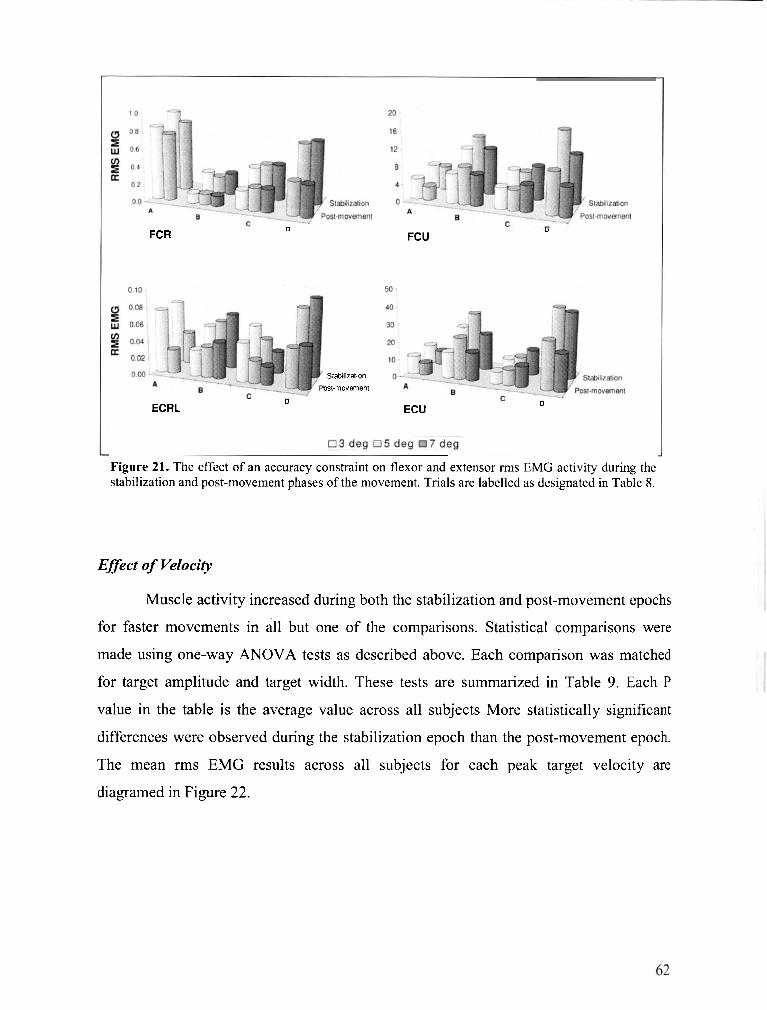
FCR D
Stabilization
ost-movement
ECRL D
" FCU
ECU D
--
Figure 21. The effect of an accuracy constraint on flexor and extensor rms EMG activity during the stabilization and post-movement phases of the movement. Trials are labelled as designated in Table 8.
Effect of Velocity
Muscle activity increased during both the stabilization and post-movement epochs
for faster movements in all but one of the comparisons. Statistical comparisons were
made using one-way ANOVA tests as described above. Each comparison was matched
for target amplitude and target width. These tests are summarized in Table 9. Each P
value in the table is the average value across all subjects More statistically significant
differences were observed during the stabilization epoch than the post-movement epoch.
The mean rms EMG results across all subjects for each peak target velocity are
diagramed in Figure 22.
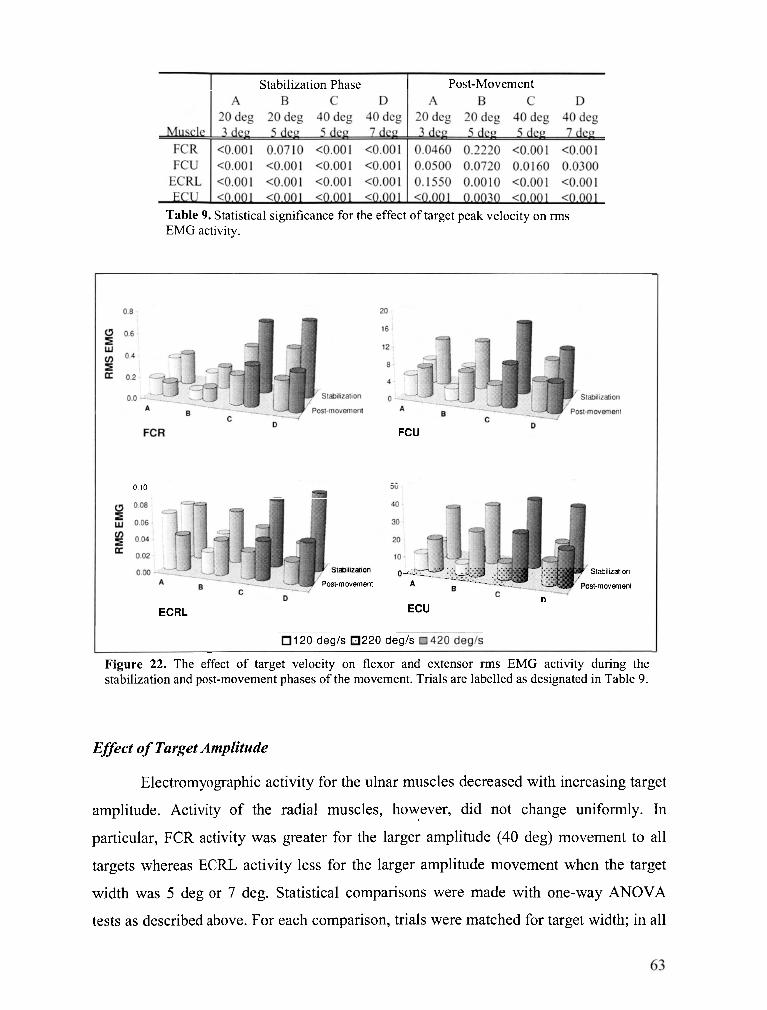
Stabilization Phase Post-Movement
Table 9. Statistical significance for the effect of target peak velocity on rms EMG activity.
FCU
0 10
Stabilization
Post-movement st-movement
n
ECRL ECU
120 degls 220degh- --
-
Figure 22. The effect of target velocity on flexor and extensor rms EMG activity during the stabilization and post-movement phases of the movement. Trials are labelled as designated in Table 9.
Effect of Target Amplitude
Electromyographic activity for the ulnar muscles decreased with increasing target
amplitude. Activity of the radial muscles, however, did not change uniformly. In
particular, FCR activity was greater for the larger amplitude (40 deg) movement to all
targets whereas ECRL activity less for the larger amplitude movement when the target
width was 5 deg or 7 deg. Statistical comparisons were made with one-way ANOVA
tests as described above. For each comparison, trials were matched for target width; in all
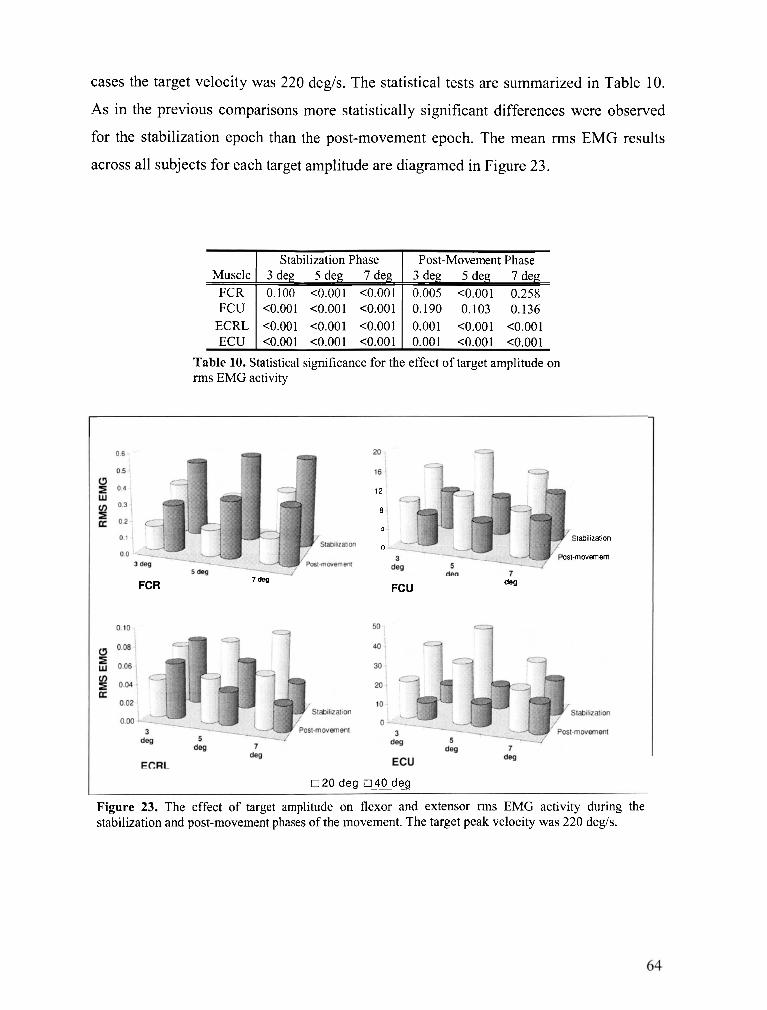
cases the target velocity was 220 degls. The statistical tests are summarized in Table 10.
As in the previous comparisons more statistically significant differences were observed
for the stabilization epoch than the post-movement epoch. The mean rms EMG results
across all subjects for each target amplitude are diagramed in Figure 23.
I Stabilization Phase I Post-Movement Phase Muscle FCR
FCR 7 deg
FCU ECRL ECU
12
8
4 tabilization
0 ost-movement
3 deg 5 deg 7 deg 0.100 <0.001 <0.001
FCU deg
3 deg 5 deg 7 deg 0.005 <0.001 0.258
Table 10. Statistical significance for the effect of target amplitude on rms EMG activity
<0.001 <0.001 <0.001 <0.001 <0.001 <0.001 <0.001 <0.001 <0.001
0 20 deg o 2 d e g
0.190 0.103 0.136 0.001 <0.001 <0.001 0.001 <0.001 <0.001
Figure 23. The effect of target amplitude on flexor and extensor rms EMG activity during the stabilization and post-movement phases of the movement. The target peak velocity was 220 degls.
The purpose of this study was to determine how target velocity, target amplitude,
and target width affected the viscoelastic properties of the wrist as the hand stabilized
following a voluntary targeted movement. Viscoelastic parameters were estimated using
a second order linear model. Second order models have been successfully used to
describe joint mechanics in many other studies (Gottlieb and Aganval, 1978; Zahalak and
Heyrnan, 1979; Kearney and Hunter, 1982; Lacquaniti et al., 1982; Becker and Mote,
1990; Bennett et al., 1992). It was assumed that because the hand was restricted to
rotation about the flexion/extension axis of the wrist, that its moment of inertia would be
constant. Furthermore, it was assumed that during stabilization at the target position, the
viscoelastic properties of the wrist would change slowly enough that they could be
presumed were constant over half a cycle of oscillation
Parameter Estimation
Our moment of inertia estimates of the hand ranged from 0.00195 kg-m2 to
0.00414 kg-m2 with an average value of 0.00342 kg-m2. This is a reasonable range of
values given that subjects varied a great deal physical stature. The only reported
measurements of wrist moment of inertia to which our results can be compared are those
of Lakie et al. (1980). They used rhythmic torques to determine the resonant frequency,
inertia, and stiffness of the hand. They reported a moment of inertia for the hand for three
subjects in the range 0.003 1-0.0037 kg-m2. Their results are very similar to the results of
the present study.
Across all subjects, trials, and movement conditions, joint stiffness varied from
approximately 4-8 Nmlrad. This range is corresponds well with stiffness values in other
studies. Lakie et al. (1980) reported the resting wrist stiffness to be approximately 1.2
Ndrad . Gielen and Houk (1984) reported a somewhat higher range of 2-5 Nmlrad for
the relaxed wrist using a nonlinear model. De Serres and Milner (1991) found values of
static stiffness in the 1.5-4 N d r a d range. In an experiment with a task very similar to
that of the present study, Milner and Cloutier (1997) reported a comparable range for
stiffness (4-6 Nmlrad).
The observation of negative wrist viscosity during the first half-cycle of
oscillation of the wrist was unexpected. However, a similar finding has been reported
previously. Bennett (1994) reported that the elbow viscosity became negative during
movement to a target just as the target was reached. The viscosity then increased as the
elbow stabilized at the target and subsequently decreased in a similar manner to that
observed in the present experiment. Bennett reported this effect for four out of five
subjects. In our study negative wrist viscosity during the first half-cycle of oscillation was
observed for all ten subjects.
Negative viscosity could potentially arise from reflex effects. Muscle forces due
to reflex feedback originating from changes in muscle length can be phase shifted with
respect to the movement. For example, if reflex torque is modulated in phase with the
angular velocity, it will oppose the motion and increase the effective viscosity of the
joint. If the reflex torque is delayed, it may be phase shifted so that it assists rather than
opposes motion, thereby decreasing the effective viscosity of the joint. Destabilizing
effects due to reflexes have been reported. However, as will be discussed later, reflexes
could not possibly be responsible for any mechanical effects in the first oscillation due to
the time delay between the triggering of the reflex and the resulting force output.
Alternatively, the effect could be due to an underestimation of the amount of positive
velocity feedback. Although this must be considered as a possibility, Bennett (1994)
found a similar result using a very different apparatus and data collection system.
Oscillation amplitude was observed to increase from the first to second half-cycle. This
supports the finding of negative viscosity in the first half-cycle. A possible explanation
for why the viscosity might be negative is the timing of the antagonist muscle burst
responsible for the deceleration of the hand as the target is approached. The torque from
an extensor muscle could have been phased shifted as discussed so that it assisted motion
at the time the target was reached rather than resist motion.
Our results indicate that the damping ratio varied from 4 . 0 4 to 0.16 and closely
followed the viscosity. In contrast, Milner and Cloutier (1997) reported that the damping
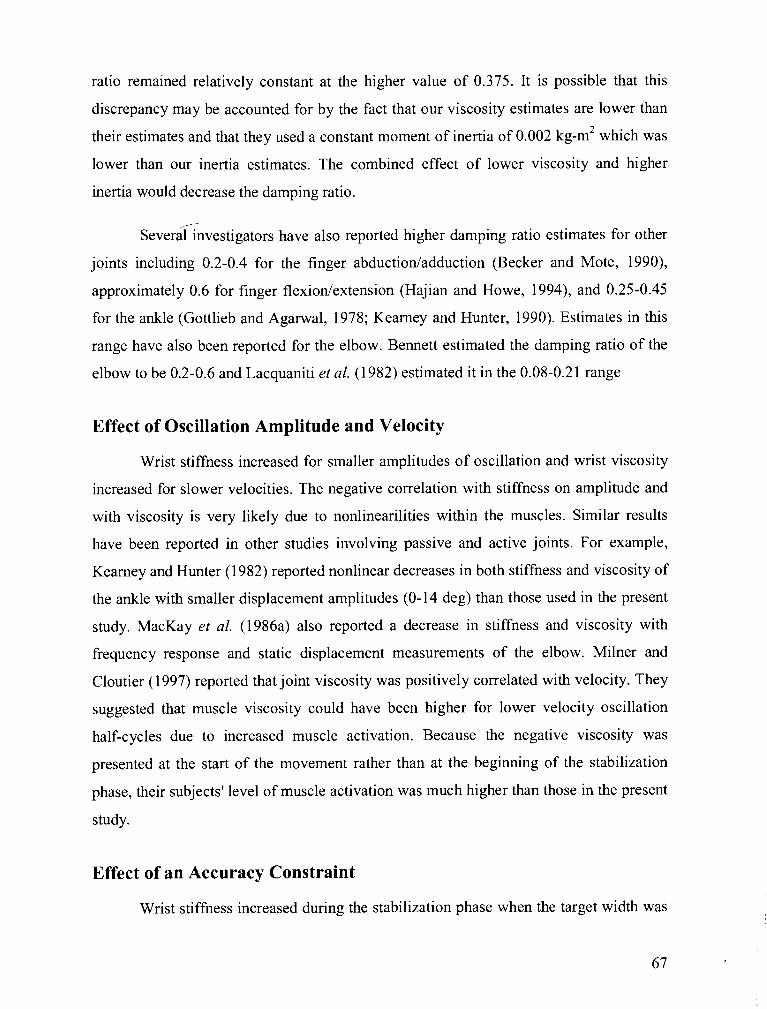
ratio remained relatively constant at the higher value of 0.375. It is possible that this
discrepancy may be accounted for by the fact that our viscosity estimates are lower than
their estimates and that they used a constant moment of inertia of 0.002 kg-m2 which was
lower than our inertia estimates. The combined effect of lower viscosity and higher
inertia would decrease the damping ratio.
I Several investigators have also reported higher damping ratio estimates for other
joints including 0.2-0.4 for the finger abductiodadduction (Becker and Mote, 1990),
approximately 0.6 for finger flexiodextension (Hajian and Howe, 1994), and 0.25-0.45
for the ankle (Gottlieb and Aganval, 1978; Kearney and Hunter, 1990). Estimates in this
range have also been reported for the elbow. Bennett estimated the damping ratio of the
elbow to be 0.2-0.6 and Lacquaniti et al. (1982) estimated it in the 0.08-0.21 range
Effect of Oscillation Amplitude and Velocity
Wrist stiffness increased for smaller amplitudes of oscillation and wrist viscosity
increased for slower velocities. The negative correlation with stiffness on amplitude and
with viscosity is very likely due to nonlinearilities within the muscles. Similar results
have been reported in other studies involving passive and active joints. For example,
Kearney and Hunter (1982) reported nonlinear decreases in both stiffness and viscosity of
the ankle with smaller displacement amplitudes (0-14 deg) than those used in the present
study. MacKay et al. (1986a) also reported a decrease in stiffness and viscosity with
frequency response and static displacement measurements of the elbow. Milner and
Cloutier (1997) reported that joint viscosity was positively correlated with velocity. They
suggested that muscle viscosity could have been higher for lower velocity oscillation
half-cycles due to increased muscle activation. Because the negative viscosity was
presented at the start of the movement rather than at the beginning of the stabilization
phase, their subjects' level of muscle activation was much higher than those in the present
study.
Effect of an Accuracy Constraint
Wrist stiffness increased during the stabilization phase when the target width was
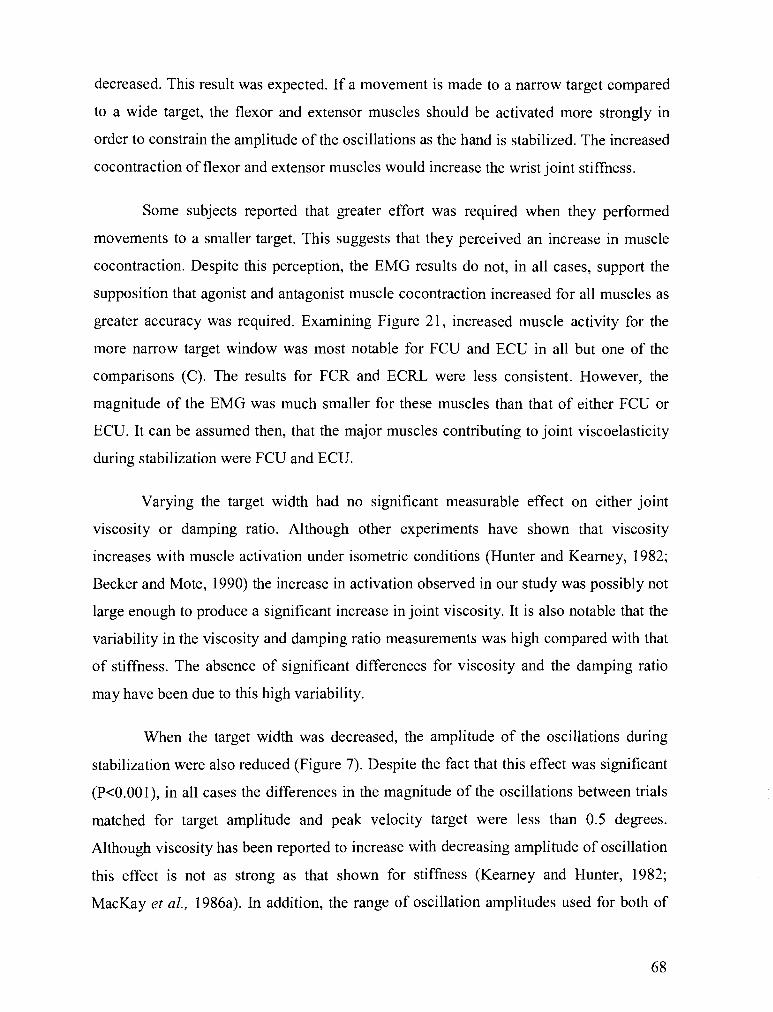
decreased. This result was expected. If a movement is made to a narrow target compared
to a wide target, the flexor and extensor muscles should be activated more strongly in
order to constrain the amplitude of the oscillations as the hand is stabilized. The increased
cocontraction of flexor and extensor muscles would increase the wrist joint stiffness.
Some subjects reported that greater effort was required when they performed
movements to a smaller target. This suggests that they perceived an increase in muscle
cocontraction. Despite this perception, the EMG results do not, in all cases, support the
supposition that agonist and antagonist muscle cocontraction increased for all muscles as
greater accuracy was required. Examining Figure 21, increased muscle activity for the
more narrow target window was most notable for FCU and ECU in all but one of the
comparisons (C). The results for FCR and ECRL were less consistent. However, the
magnitude of the EMG was much smaller for these muscles than that of either FCU or
ECU. It can be assumed then, that the major muscles contributing to joint viscoelasticity
during stabilization were FCU and ECU.
Varying the target width had no significant measurable effect on either joint
viscosity or damping ratio. Although other experiments have shown that viscosity
increases with muscle activation under isometric conditions (Hunter and Kearney, 1982;
Becker and Mote, 1990) the increase in activation observed in our study was possibly not
large enough to produce a significant increase in joint viscosity. It is also notable that the
variability in the viscosity and damping ratio measurements was high compared with that
of stiffness. The absence of significant differences for viscosity and the damping ratio
may have been due to this high variability.
When the target width was decreased, the amplitude of the oscillations during
stabilization were also reduced (Figure 7). Despite the fact that this effect was significant
(P<0.001), in all cases the differences in the magnitude of the oscillations between trials
matched for target amplitude and peak velocity target were less than 0.5 degrees.
Although viscosity has been reported to increase with decreasing amplitude of oscillation
this effect is not as strong as that shown for stiffness (Kearney and Hunter, 1982;
MacKay et al., 1986a). In addition, the range of oscillation amplitudes used for both of
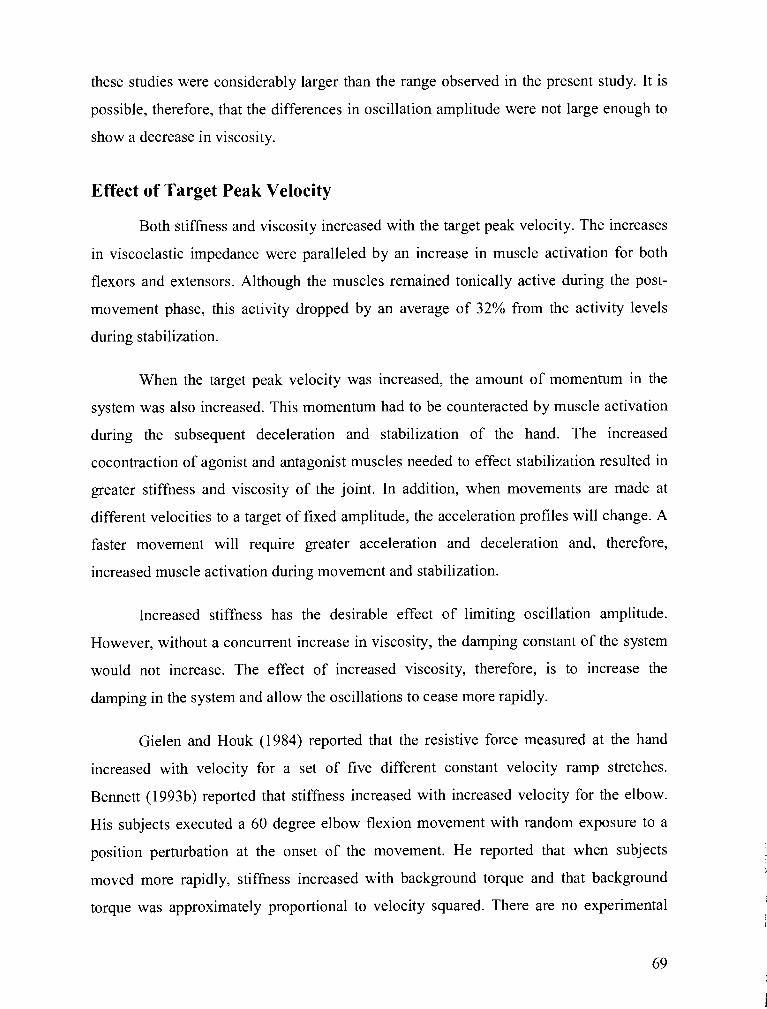
these studies were considerably larger than the range observed in the present study. It is
possible, therefore, that the differences in oscillation amplitude were not large enough to
show a decrease in viscosity.
Effect of Target Peak Velocity
Both stiffness and viscosity increased with the target peak velocity. The increases
in viscoelastic impedance were paralleled by an increase in muscle activation for both
flexors and extensors. Although the muscles remained tonically active during the post-
movement phase, this activity dropped by an average of 32% from the activity levels
during stabilization.
When the target peak velocity was increased, the amount of momentum in the
system was also increased. This momentum had to be counteracted by muscle activation
during the subsequent deceleration and stabilization of the hand. The increased
cocontraction of agonist and antagonist muscles needed to effect stabilization resulted in
greater stiffness and viscosity of the joint. In addition, when movements are made at
different velocities to a target of fixed amplitude, the acceleration profiles will change. A
faster movement will require greater acceleration and deceleration and, therefore,
increased muscle activation during movement and stabilization.
Increased stiffness has the desirable effect of limiting oscillation amplitude.
However, without a concurrent increase in viscosity, the damping constant of the system
would not increase. The effect of increased viscosity, therefore, is to increase the
damping in the system and allow the oscillations to cease more rapidly.
Gielen and Houk (1984) reported that the resistive force measured at the hand
increased with velocity for a set of five different constant velocity ramp stretches.
Bennett (1993b) reported that stiffness increased with increased velocity for the elbow.
His subjects executed a 60 degree elbow flexion movement with random exposure to a
position perturbation at the onset of the movement. He reported that when subjects
moved more rapidly, stiffness increased with background torque and that background
torque was approximately proportional to velocity squared. There are no experimental
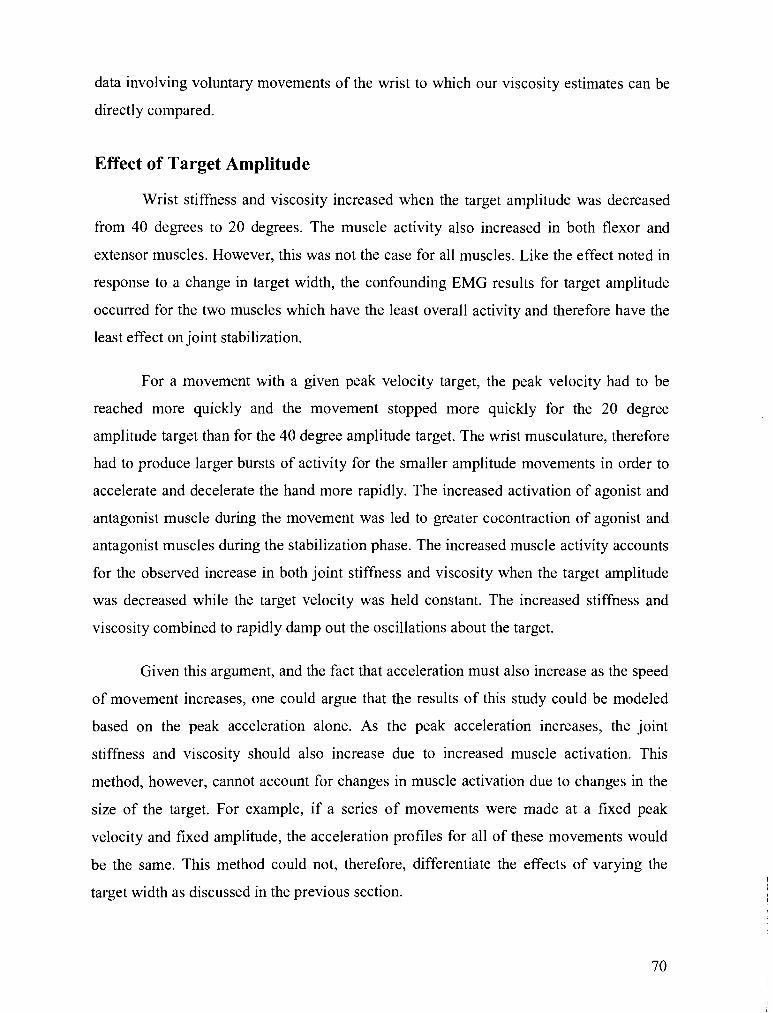
data involving voluntary movements of the wrist to which our viscosity estimates can be
directly compared.
Effect of Target Amplitude
Wrist stiffness and viscosity increased when the target amplitude was decreased
from 40 degrees to 20 degrees. The muscle activity also increased in both flexor and
extensor muscles. However, this was not the case for all muscles. Like the effect noted in
response to a change in target width, the confounding EMG results for target amplitude
occurred for the two muscles which have the least overall activity and therefore have the
least effect on joint stabilization.
For a movement with a given peak velocity target, the peak velocity had to be
reached more quickly and the movement stopped more quickly for the 20 degree
amplitude target than for the 40 degree amplitude target. The wrist musculature, therefore
had to produce larger bursts of activity for the smaller amplitude movements in order to
accelerate and decelerate the hand more rapidly. The increased activation of agonist and
antagonist muscle during the movement was led to greater cocontraction of agonist and
antagonist muscles during the stabilization phase. The increased muscle activity accounts
for the observed increase in both joint stiffness and viscosity when the target amplitude
was decreased while the target velocity was held constant. The increased stiffness and
viscosity combined to rapidly damp out the oscillations about the target.
Given this argument, and the fact that acceleration must also increase as the speed
of movement increases, one could argue that the results of this study could be modeled
based on the peak acceleration alone. As the peak acceleration increases, the joint
stiffness and viscosity should also increase due to increased muscle activation. This
method, however, cannot account for changes in muscle activation due to changes in the
size of the target. For example, if a series of movements were made at a fixed peak
velocity and fixed amplitude, the acceleration profiles for all of these movements would
be the same. This method could not, therefore, differentiate the effects of varying the
target width as discussed in the previous section.
Effect of Reflexes
The positive velocity feedback applied by the torque motor to effect negative
viscosity was turned on when the hand velocity reached zero within the target window.
The reduced viscosity of the wrist has the result of stretching the extensor muscles more
than they would have been stretched due the momentum of the hand-manipulandum
system alone. The effective torque response attributable to the stretch reflex is delayed
due to conduction through neural pathways and to the low-pass filter properties of
muscle. De Serres (1990) measured the delay due conduction through neural pathways
and the duration of excitation-contraction coupling for the wrist flexor and extensor
muscles. She reported the shortest period of time for the conduction delay and excitation-
contraction to be approximately 22 ms. Furthermore, she reported that the mean time to
peak EMG activity was 20 ms. Riek and Bawa (1992) stimulated single motor units for
two wrist extensor muscles and recorded the isometric twitch profiles. Their results
suggest that time to peak force production is approximately 60 ms. These estimates
suggest that from the onset of stretch, the time to peak force production from reflexes is
approximately 100 ms. Given these estimates, it is reasonable to assume that the earliest
that the reflex generated torque could actually affect the mechanics of the wrist would be
80-1 00 ms.
The natural frequency for a second order system is
The average natural frequency for each subject during the first half-cycle of oscillation
across all trials was calculated from the corresponding stiffness values for the estimated
inertia. The natural frequency estimates for all subjects ranged from 6.1 to 8.7 Hz with an
average value of 7.15 Hz. The corresponding cycle duration for this frequency is 140 ms.
Comparing the duration for the first half-cycle of oscillation (70 ms) with the delay for
reflex effects, any effect on the estimated mechanical parameters of the wrist due to the
addition of positive velocity feedback could not occur until the second half-cycle of
oscillation.
The results of the present study indicate that a statistically significant increase
occurred in the oscillation amplitude from the first to the second half-cycle (Figures 7-9).
In a similar experiment Milner and Cloutier (1 997) reported that the oscillation amplitude
decreased progressively over all half-cycles. The most significant difference between the
two studies is in the timing of the negative viscosity. In their experiment negative
viscosity was presented at the onset of the movement. In the present experiment, the
positive velocity feedback was added when the hand reached the target. Therefore, it is
probable that the increased oscillation amplitude for the second half-cycle was due to the
reflex torque generated by this perturbation.
The increased amplitude over the second half-cycle of oscillation and the
simultaneous decrease in stiffness (Figures 10, 13, and 16) suggests that the contribution
of the reflex torque was sufficiently out of phase with the torque generated from intrinsic
muscle mechanics that it contributed to destabilizing the system. Reflex generated
destabilizing effects have been reported by other researchers for the wrist (Milner and
Cloutier, 1993) and elbow (Bennett, 1994). In both of these experiments the reflexes were
induced by perturbations.
The purpose of this thesis was to gain a better understanding of the mechanical
properties of the human wrist during the stabilization phase of voluntary targeted
movements. The results of this study suggests that although both joint stiffness and
viscosity are important for stabilization of the limb following a movement, stiffness may
be the more important property controlled by the neuromuscular system. In addition, our
findings suggest that joint stiffness can be estimated more reliably than viscosity and that
viscosity is modulated over a much smaller range. The damping of the wrist appears to be
small due to the limited amount of viscosity. The damping is, however, always sufficient
to rapidly reduce oscillations about the target.
Between the neural and muscular systems, the intrinsic properties of the muscular
system may have the most important influence on motor control during the stabilization
phase of a task involving voluntary movement. We have shown that intrinsic muscle
mechanics are well suited to stabilization following motion. We have also provided
further evidence reflex feedback may not be an effective means of stability control,
especially if the limb is operating in a rapidly changing environment where it may be
exposed to unexpected disturbances.
This work has applications in a wide range of areas. Knowledge of how the
human neuromuscular system controls the mechanical impedance of a joint during
stabilization enables more accurate modeling of the dynamics of human movement. An
understanding of neural control and joint dynamics may clarify the mechanical changes
underlying neuromuscular disease. This may lead to an improved ability to quantitatively
describe and objectively analyze neuromuscular disorders. Stability is critical in many
aspects of rehabilitation engineering. The design of prostheses and orthoses can be
improved by better simulating the dynamics of the joints they replace. Similar
improvements may be observed with functional electrical stimulation systems.
This work also has potential applications in the design of telerobotic systems in
which the human operator controls a robot at some distance by moving a manipulandum

such as a joystick. If the dynamics of the human system can be predicted, the closed loop
stability of the overall human-robot system can be better controlled under all operating
conditions. Human motor control is far more sophisticated and is better able to adapt to
its environment than are current robotic control systems. Therefore, it may be
advantageous to control robotic systems in a similar manner to that of the human
neuromuscular system.
Agarwal, G.C. and Gottlieb, G.L. (1977). "Oscillation of the human ankle joint in response to applied sinusoidal torque on the foot." Journal of Physiology 268(1): 15 1-76.
Akazawa, K., Milner, T.E. and Stein, R.B. (1983). "Modulation of reflex EMG and stiffness in response to stretch of human finger muscle." Journal of Neurophysiology 49(1): 16-27.
Baratta, R. and Solomonow, M. (1991). "The effect of tendon viscoelastic stiffness on the dynamic performance of isometric muscle." Journal of Biomechanics 24(2): 109- 16.
Bawa, P., Mannard, A. and Stein, R.B. (1 976). "Effects of elastic loads on the contractions of cat muscles." Biological Cybernetics 22(3): 129-37.
Bawa, P. and Stein, R.B. (1976). "Frequency response of human soleus muscle." Journal of Neurophysiology 39(4): 788-93.
Becker, J.D. and Mote, C.D., Jr. (1 990). "Identification of a frequency response model of joint rotation." Journal of Biomechanical Engineering 112(1): 1-8.
Bennett, D.J. (1 993a). "Electromyographic responses to constant position errors imposed during voluntary elbow joint movement in human." Experimental Brain Research 95(3): 499-508.
Bennett, D.J. (1993b). "Torques generated at the human elbow joint in response to constant position errors imposed during voluntary movements." Experimental Brain Research 95(3): 488-98.
Bennett, D.J. (1994). "Stretch reflex responses in the human elbow joint during a voluntary movement." Journal of Physiology 474(2): 339-5 1.
Bennett, D.J., Gorassini, M. and Prochazka, A. (1994). "Catching a ball: contributions of intrinsic muscle stiffness, reflexes, and higher order responses." Canadian Journal of Physiology & Pharmacology 72(5): 525-34.
Bennett, D.J., Hollerbach, J.M., Xu, Y. and Hunter, I.W. (1992). "Time-varying stiffness of human elbow joint during cyclic voluntary movement." Experimental Brain Research 88(2): 433-42.
Brown, T.I., Rack, P.M. and Ross, H.F. (1 982). "Forces generated at the thumb interphalangeal joint during imposed sinusoidal movements." Journal of Physiology 332: 69-85.
Cannon, S.C. and Zahalak, G.I. (1982). "The mechanical behavior of active human skeletal muscle in small oscillations." Journal of Biomechanics 15(2): 1 1 1-2 1.
Cecchi, G., Griffiths, P.J. and Taylor, S. (1984). "The kinetics of cross-bridge attachment and detachment studied by high frequency stiffness measurements." Advances in Experimental Medicine & Biology 170: 64 1-55.
Colomo, F., Lombardi, V. and Piazzesi, G. (1988). "The mechanisms of force enhancement during constant velocity lengthening in tetanized single fibres of frog muscle." Advances in Experimental Medicine & Biology 226: 489-502.
Crouch, J.E. (1983). Functional Human Anatomy. Philadelphia, Lea & Febiger
De Serres, S.J. (1990). Influence des characteristiques mechaniques de la charge initiale sur le reflexe myotatique des musclesflechisseurs dupoignet (M.Sc. Thesis). Institute de Genie Biomedical, Ecole Polytechnique, Universite de Montreal.
De Serres, S.J. and Milner, T.E. (1991). "Wrist muscle activation patterns and stiffness associated with stable and unstable mechanical loads." Experimental Brain Research 86(2): 45 1-8.
Edman, K.A. (1966). "The relation between sarcomere length and active tension in isolated semitendinosus fibres of the frog." Journal of Physiology 183(2): 407-1 7.
Edman, K.A. (1978). "Maximum velocity of shortening in relation to sarcomere length and degree of activation of frog muscle fibres [proceedings]." Journal of Physiology 278: 9P- 1 OP.
Edman, K.A. (1 993). "Mechanism underlying double-hyperbolic force-velocity relation in vertebrate skeletal muscle." Advances in Experimental Medicine & Biology 332: 667- 76; discussion 676-8.
Edman, K.A., Elzinga, G. and Noble, M.I. (1978). "Enhancement of mechanical performance by stretch during tetanic contractions of vertebrate skeletal muscle fibres." Journal of Physiology 281: 139-55.
Eisenberg, E. and Hill, T.L. (1978). "A cross-bridge model of muscle contraction." Progress in biophysics and biophysical chemistry 33: 55-8 1.
Eisenberg, E., Hill, T.L. and Chen, Y. (1980). "Cross-bridge model of muscle contraction. Quantitative analysis." Biophysical Journal 29(2): 195-227.
Fenn, W.O. and Marsh, B.S. (1935). "Muscular force at different speeds of shortening." Journal ofPhysiology (London) 85: 277-97.
Flitney, F.W. and Hirst, D.G. (1978). "Cross-bridge detachment and sarcomere 'give' during stretch of active frog's muscle." Journal ofPhysiology 276: 449-65.
Ford, L.E., Huxley, A.F. and Simmons, R.M. (198 1). "The relation between stiffness and filament overlap in stimulated frog muscle fibres." Journal of Physiology 31 1: 2 19-49.
Ford, L.E., Huxley, A.F. and Simmons, R.M. (1985). "Tension transients during steady shortening of frog muscle fibres." Journal ofPhysioIogy 361: 13 1-50.
Gasser, H.S. and Hill, A.V. (1924). "The dynamics of muscular contraction." Proceedings of the Royal Society, London B 96: 398-437.
Gielen, C.C. and Houk, J.C. (1984). "Nonlinear viscosity of human wrist." Journal of Neurophysiology 52(3): 553-69.
Gielen, C.C., Houk, J.C., Marcus, S.L. and Miller, L.E. (1984). "Viscoelastic properties of the wrist motor servo in man." Annals ofBiomedica1 Engineering 12(6): 599-620.
Gordon, A.M., Huxley, A.F. and Julian, F.J. (1966). "Tension development in highly stretched vertebrate muscle fibres." Journal of Physiology 184(1): 143-69.
Gottlieb, G.L. and Agarwal, G.C. (1978). "Dependence of human ankle compliance on joint angle." Journal of Biomechanics 1 l(4): 177-8 1.
Gottlieb, G.L. and Agarwal, G.C. (1988). "Compliance of single joints: elastic and plastic characteristics." Journal of Neurophysiology 59(3): 937-5 1.
Griffiths, P.J., Ashley, C.C., Bagni, M.A., Maeda, Y. and Cecchi, G. (1993). "Cross- bridge attachment and stiffness during isotonic shortening of intact single muscle fibers." Biophysical Journal 64(4): 1 150-60.
Griffiths, R.I. (1991). "Shortening of muscle fibres during stretch of the active cat medial gastrocnemius muscle: the role of tendon compliance." Journal of Physiology 436: 2 19- 36.
Harry, J.D., Ward, A.W., Heglund, N.C., Morgan, D.L. and McMahon, T.A. (1 990). "Cross-bridge cycling theories cannot explain high-speed lengthening behavior in frog muscle [see comments]." Biophysical Journal 57(2): 201 -8.
Hill, A.V. (1938). "The heat of shortening and the dynamic constants of muscle." 126: 136-95.
Hogan, N. (1 985). "The mechanics of multi-joint posture and movement control." Biological Cybernetics 52(5): 3 15-3 1.
Houk, J.C. and Rymer, W.Z. (1 98 1). Neural control of muscle length and tension. Handbook of physiology. Section 1: The nervous system. V. B. Brookhart, V. B. Mountcastle, V. B. Brooks and S. R. Gieger, American Physiology Society. 2 Motor control: 257-323.
Hunter, I.W. and Kearney, R.E. (1982). "Dynamics of human ankle stiffness: variation with mean ankle torque." Journal of Biomechanics lS(10): 747-52.
Huxley, A.F. (1957). "Muscle structure and theories of contraction." Progress in biophysics and biophysical chemistry 7: 255-3 18.
Huxley, A.F. and Simmons, R.M. (1971). "Proposed mechanism of force generation in striated muscle." Nature 233(532 1): 533-8.
Iwamoto, H., Sugaya, R. and Sugi, H. (1990). "Force-velocity relation of frog skeletal muscle fibres shortening under continuously changing load." Journal of Physiology 422: 185-202.
Jacks, A., Prochazka, A. and Trend, P.S. (1988). "Instability in human forearm movements studied with feed-back-controlled electrical stimulation of muscles." Journal of Physiology 402: 443-6 1.
Joyce, G.C. and Rack, P.M. (1969). "Isotonic lengthening and shortening movements of cat soleus muscle." Journal of Physiology 204(2): 475-91.
Joyce, G.C., Rack, P.M. and Ross, H.F. (1974). "The forces generated at the human elbow joint in response to imposed sinusoidal movements of the forearm." Journal of Physiology 240(2): 35 1-74.
Joyce, G.C., Rack, P.M. and Westbury, D.R. (1969). "The mechanical properties of cat soleus muscle during controlled lengthening and shortening movements." Journal of Physiology 204(2): 46 1-74.
Katz, B. (1939). "The relation between force and speed in muscular contraction." Journal of Physiology 96: 45-64.
Kearney, R.E. and Hunter, I.W. (1982). "Dynamics of human ankle stiffness: variation with displacement amplitude." Journal of Biomechanics 15(10): 753-6.
Kearney, R.E. and Hunter, I.W. (1990). "System identification of human joint dynamics." Critical Reviews in Biomedical Engineering 18(1): 55-87.
Kirsch, R.F., Boskov, D. and Rymer, W.Z. (1994) "Muscle stiffness during transient and continuous movement of cat muscle: Perturbation characteristics and physiological relevance." IEEE Transactions on Biomedical Engineering 41(8): 758-69.
Krause, P.C., Choi, J.S. and McMahon, T.A. (1995). "The force-velocity curve in passive whole muscle is asymmetric about zero velocity." Journal of Biomechanics 28(9): 1035- 43.
Lacquaniti, F., Licata, F. and Soechting, J.F. (1982). "The mechanical behavior of the human forearm in response to transient perturbations." Biological Cybernetics 44(1): 35- 46.
Lin, D.C. and Ryrner, W.Z. (1993). "Mechanical properties of cat soleus muscle elicited by sequential ramp stretches: implications for control of muscle." Journal of Neurophysiology 70(3): 997- 1008.
Lakie, M., Walsh, E.G., and Wright, G. (1990). "Measurements of inetia of the hand, and the stiffness of the forearm muscles using resonant frequency methods, with added inertia or position feedback." Journal of Physiology 300: 3-4P.
Lombardi, V. and Piazzesi, G. (1990). "The contractile response during steady lengthening of stimulated frog muscle fibres." Journal of Physiology 431: 14 1-7 1.
Lombardi, V., Piazzesi, G. and Linari, M. (1992). "Rapid regeneration of the actin- myosin power stroke in contracting muscle." Nature 355(6361): 638-41.
Ma, S.P. and Zahalak, G.I. (1985). "The mechanical response of the active human triceps brachii muscle to very rapid stretch and shortening." Journal of Biomechanics lS(8): 585-98.
MacKay, W.A., Crammond, D.J., Kwan, H.C. and Murphy, J.T. (1 986a). "Measurements of human forearm viscoelasticity." Journal of Biomechanics 19(3): 23 1-8.
MacKay, W.A., Crammond, D. J., Kwan, H.C. and Murphy, J.T. (1 986b). "Measurements of human forearm viscoelasticity." Journal of Biomechanics 19(3): 23 1-38.
Milner, T.E. (1 993). "Dependence of elbow viscoelastic behavior on speed and loading in voluntary movements." Experimental Brain Research 93(1): 177-80.
Milner, T.E. and Cloutier, C. (1993). "Compensation for mechanically unstable loading in voluntary wrist movement." Experimental Brain Research 94(3): 522-32.
Milner, T.E. and Cloutier, C. (1997). "Damping of the wrist joint during voluntary movement and the effect of muscle co-contraction." Submitted forpublication.
Milner, T.E., Cloutier, C., Leger, A.B. and Franklin, D.W. (1995). "Inability to activate muscles maximally during cocontraction and the effect on joint stiffness." Experimental Brain Research 107(2): 293-305.
Milner, T.E. and Ijaz, M.M. (1990). "The effect of accuracy constraints on three- dimensional movement kinematics." Neuroscience 35(2): 365-74.
Nichols, T.R. (1 984). "Velocity sensitivity of yielding during stretch in the cat soleus muscle." Advances in Experimental Medicine & Biology 170: 753-5.
Nichols, T.R. and Houk, J.C. (1976). "Improvement in linearity and regulation of stiffness that results from actions of stretch reflex." Journal of Neurophysiology 39(1): 1 19-42.
Piazzesi, G., Francini, F., Linari, M. and Lombardi, V. (1992). "Tension transients during steady lengthening of tetanized muscle fibres of the frog." Journal of Physiology 445: 659-71 1.
Press, W.H., Flannery, B.P., Teukolsky, S.A. and Vetterling, W.T. (1989). Numerical Recipies in Pascal. Cambridge, Cambridge University Press.
Prochazka, A. and Trend, P.S. (1 988). "Instability in human forearm movements studied with feed-back-controlled muscle vibration." Journal of Physiology 402: 42 1-42.
Rack, P.M. (1 966). "The behaviour of a mammalian muscle during sinusoidal stretching." Journal of Physiology 183(1): 1-14.
Rack, P.M. and Westbury, D.R. (1969). "The effects of length and stimulus rate on tension in the isometric cat soleus muscle." Journal of Physiology 204(2): 443-60.
Rack, P.M. and Westbury, D.R. (1974). "The short range stiffness of active mammalian muscle and its effect on mechanical properties." Journal of Physiology 240(2): 33 1-50.
Rack, P.M.H. (1981). Limitations of somatosensory feedback in control of posture and movement. Handbook of physiologv. Section 1: The nervous system. V. B. Brookhart, V. B. Mountcastle, V. B. Brooks and S. R. Gieger, American Physiology Society. 2 Motor control: 229-56.
Roleveld, K., Baratta, R.V., Solomonow, M. and Huijing, P.A. (1994). "Role of the tendon in the dynamic performance of three different load-moving muscles." Annals of Biomedical Engineering 22(6): 682-9 1.
Shadmehr, R. and Arbib, M.A. (1992). "A mathematical analysis of the force-stiffness characteristics of muscles in control of a single joint system." Biological Cybernetics 66(6): 463-77.
Stein, R.B., Hunter, I.W., Lafontaine, S.R. and Jones, L.A. (1995). "Analysis of short- latency reflexes in human elbow flexor muscles." Journal of Neurophysiology 73(5): 1900-1 1.
Stein, R.B. and Lee, R.G. (1981). Tremor and clonus. Handbook of physiology. Section 1: The nervous system. V. B. Brookhart, V. B. Mountcastle, V. B. Brooks and S. R. Gieger, American Physiology Society. 2 Motor control: 325-43.
Stein, R.B. and Oguztoreli, M.N. (1976). "Tremor and other oscillations in neuromuscular systems." Biological Cybernetics 22(3): 147-57.
Sugi, H. and Tsuchiya, T. (1988). "Stiffness changes during enhancement and deficit of isometric force by slow length changes in frog skeletal muscle fibres." Journal of Physiology 407: 2 15-29.
Weiss, P.L., Hunter, I.W. and Kearney, R.E. (1988). "Human ankle joint stiffness over the full range of muscle activation levels." Journal of Biomechanics 21(7): 539-44.
Weiss, P.L., Kearney, R.E. and Hunter, I.W. (1986a). "Position dependence of ankle joint dynamics--I. Passive mechanics." Journal of Biomechanics 19(9): 727-35.
Weiss, P.L., Kearney, R.E. and Hunter, I.W. (1 986b). "Position dependence of ankle joint dynamics--11. Active mechanics." Journal of Biomechanics 19(9): 737-5 1.
Zahalak, G.I. and Heyman, S.J. (1979). "A quantitative evaluation of the frequency response characteristics of active human skeletal muscle in vivo." Journal of Biomechanical Engineering 101 : 28-3 7.
Zajac, F.E. (1989). "Muscle and tendon: properties, models, scaling, and application to biomechanics and motor control." Critical Reviews in Biomedical Engineering 17(4): 359-41 1.