Embed Size (px)
Citation preview
VisAR: Bringing Interactivity to Static Data Visualizations throughAugmented Reality
Taeheon Kim, Bahador Saket, Alex Endert, Blair MacIntyre
Fig. 1. This figure illustrates a presentation setting where augmented reality solutions can be used to support visual data exploration.Users in the audience are able to independently view virtual content superimposed on the static visualization and perform interactivetasks (e.g., filtering) to explore the presented data without interrupting the presenter.
Abstract—Static visualizations have analytic and expressive value. However, many interactive tasks cannot be completed usingstatic visualizations. As datasets grow in size and complexity, static visualizations start losing their analytic and expressive power forinteractive data exploration. Despite this limitation of static visualizations, there are still many cases where visualizations are limited tobeing static (e.g., visualizations on presentation slides or posters). We believe in many of these cases, static visualizations will benefitfrom allowing users to perform interactive tasks on them. Inspired by the introduction of numerous commercial personal augmentedreality (AR) devices, we propose an AR solution that allows interactive data exploration of datasets on static visualizations. In particular,we present a prototype system named VisAR that uses the Microsoft Hololens to enable users to complete interactive tasks on staticvisualizations.
Index Terms—Information visualization, augmented reality, immersive analytics.
1 INTRODUCTION
While it has been shown that static visualizations have analytic andexpressive value, they become less helpful as datasets grow in size andcomplexity [18]. For example, many interactive tasks such as zooming,panning, filtering, and brushing and linking cannot be completed usingstatic visualizations. That is, interactivity of information visualizationsbecomes increasingly important [24]. While adding interactivity tovisualizations is a common practice today, there are still cases wherevisualizations are limited to being static. For example, visualizations
• Taeheon Kim, Bahador Saket, Alex Endert, and Blair MacIntyre are withGeorgia Tech. E-mail: {tkim, saket, endert, blair}@gatech.edu,[email protected].
Manuscript received xx xxx. 201x; accepted xx xxx. 201x. Date of Publicationxx xxx. 201x; date of current version xx xxx. 201x. For information onobtaining reprints of this article, please send e-mail to: [email protected] Object Identifier: xx.xxxx/TVCG.201x.xxxxxxx
presented during presentations are restricted from being interactive tothe audience. However, interactivity in data visualizations is one of thekey components for wide and insightful visual data exploration [20].In fact, interactivity enables users to seek various aspects of their dataand gain additional insights. This importance of interaction in datavisualizations raises a question — How can we enable users to performtasks that require interactivity using static visualizations?
Augmented Reality (AR) has been a persistently used technologyfor bringing life into static content [6, 10]. By looking through a hand-held or head-mounted device, users are able to view virtual contentsuperimposed onto static scenes. Users can interact with the virtualcontent using various channels such as gesture or/and voice [11]. Thiscombination of visualization and interaction creates a unique capabilityto animate static material and has made AR a popular choice for enter-tainment and education [12, 22]. Studies have repeatedly reported thatusing AR enhances engagement and motivation of users compared tousing non-AR material [9].
In this paper, we present how augmented reality can be used to bringinteractivity to static visualizations. In particular, we present a newsolution built on the Microsoft Hololens, enabling users to performinteractive tasks such as filtering, highlighting, linking, and hoveringon static visualizations. Users can use gestures or voice commands tointeract with visualizations and observe changes in real-time on the ARdevice. Through interactivity, our solution enables users to customizeviews of static visualizations and answer personal data-driven questions.
2 RELATED WORK
Augmented reality allows users to have a seamless experience betweentheir world and content others have created. One interesting aspect ofAR is that it can breath life into static content. In the AR domain, therehave been numerous projects that animate static objects by adding inter-activity to the once-inanimate experience. For example, Billinghurst’sMagicBook was a novel AR interface that allowed static componentsof a physical book to be interactive to the reader [6]. This lead tovarious follow up studies that experimented with adding interactivityto physical books [10]. Researchers investigated how AR solutionsaffect user experience while performing tasks. For example, in onestudy, researchers observed that students using AR-enhanced bookswere better motivated and more engaged in the material [5] comparedto using other methods.
The power of animating static content has also been proven by thewidespread usage of the commercial product Layar [2]. Layar providesAR experiences that enhance printed material to be digitally interactiveon everyday smartphones. The resulting artifacts showed an 87% click-through rate which is overwhelming compared to single digit click-through rates of other advertisement methods. This shows that whenproperly designed, using AR for the purpose of adding interactivity tostatic content has a potential of increasing user engagement.
In the information visualization domain, there have been other at-tempts to merge AR with information visualization. In the sense thatAR inherently couples virtual content with the user’s physical surround-ings, White defines situated visualization as visualizations that arecoupled with the context of physical surroundings [23]. Our approachis somewhat different from White’s view of situated visualization aswe ignore the physical context in which the visualization is placed inand focus on extending the capabilities of the visualization regardlessof the context.
In the interaction space, Cordeil et al. coined the concept of spatio-data coordination which defines the mapping between the physicalinteraction space and the virtual visualization space [8]. When struc-turing our approach through this concept, we see that bystanders ofvisualizations cannot interact with the visualizations, having no coor-dination between their interaction space and the visualization space.By introducing additional elements in the visualization space that havespatio-data coordination with personal interaction spaces, we allowusers to directly interact with the visualization and view personalizedcontent in their own display space.
Our work is also inspired by the information-rich virtual environ-ment concept introduced by Bowman et al. [7]. The concept looks intointeractions between virtual environments and abstract information. Ifwe consider a synthetic static visualization as a virtual representationof data, our solution provides abstract information about that environ-ment. Users can perform interaction tasks that point from the virtualenvironment to abstract information; that is, users can retrieve detailsassociated with a synthetic visualization.
Other studies have investigated view management systems that adap-tively annotate scenes with virtual content [4,21]. These systems adjustannotations according to various factors such as the user’s viewpointor the amount of crowded content on the screen. The results of thesestudies have direct implications to our system as we rely on annotationson static visualizations.
3 MOTIVATION
In this section, we discuss a couple of scenarios that motivate using ARtechniques to enable people to gain more insights through interactingwith static visualizations.
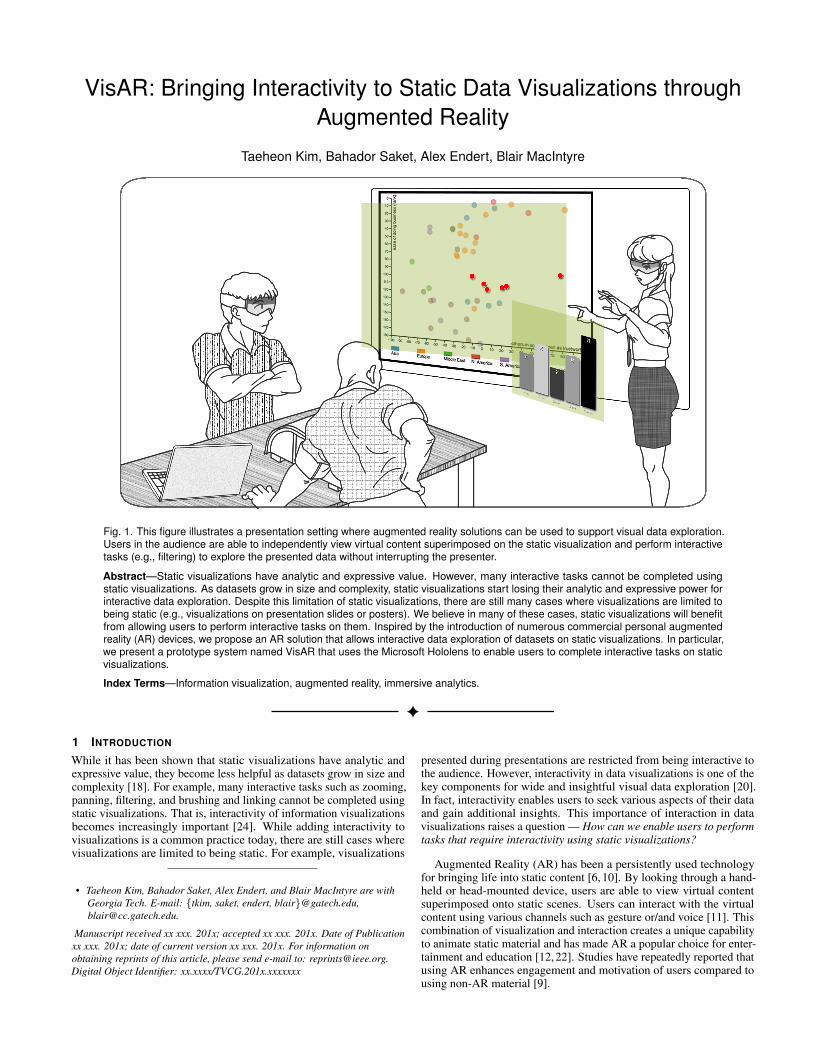
Fig. 2. A live screenshot taken from the viewpoint of the user while usingthe VisAR prototype. Gazing at a data point reveals detailed informationon it.
3.1 Data Exploration of Audience During PresentationsUsing visualizations is a common method to convey information to anaudience during presentations and meetings. In a presentation settingwhere a projector is used to show digital slides, information delivered tothe audience is limited to content presented in the slides and deliveredby a presenter verbally. That is, the audience cannot directly interactwith the visualization presented on the slides to explore different as-pects of the underlying data. This leaves limited room for answeringquestions that individuals in the audience might have. Personal ARdevices would enable users to individually interact with static visualiza-tions shown on digital slides to conduct open-ended exploration. Fig. 1shows an example of VisAR being used in a presentation setting.
3.2 Credential-based Data ExplorationIn a group where individuals have different levels of credentials, ARcan provide a way of differentiating visualizations and explorationcapabilities among the users. According to an individual’s securityclearance level, they can be allowed different sets of interactions or beprovided with distinct sets of data. For instance, when an entry-levelemployee and a senior employee are both attending a presentation onthe company’s annual reports and the screen is currently showing achart of this year’s profits, only the senior employee can be allowed toexplore through sensitive parts of the data on her personal AR deviceby interacting with annotations that lead to other related information.
4 METHOD
The analytical workflow starts with a preparation stage which involvesaccessing the AR application that contains the underlying dataset thatwas used for creating the visualization. The user then observes a typicalstatic visualization (visualization target) shown on a poster or digitalscreen through an AR device. The device uses it’s camera and animage-based tracking system such as PTC’s Vuforia [15] to track thevisualization as a target. Depending on the number of trackable features,the target can either be a fiducial marker that is carefully positioned onthe visualization or simply the entire static visualization itself. Once theAR device recognizes the target, it superimposes virtual content ontothe static visualization. For example, in the case of a static scatterplotvisualization, the system renders a new set of virtual data points andoverlays it onto the static version of the visualization. Users are thenable to see and interact with the virtual content that is superimposed onthe static visualization. User interaction with the virtual content can bethrough voice or/and gestures. For example, users can filter a specificset of data points by saying “Filter out cars above $40,000”. Similarlyusers can see detailed information about a specific data point by simplylooking directly at the data point.
5 VISAR PROTOTYPE
To indicate the feasibility of our idea, we implemented a prototypesystem on the Microsoft Hololens [14] which has accurate tracking andrendering capabilities and an RGB camera that can be used for targetrecognition. No additional adjustment to the device was required. Forthe computer vision solution on tracking target images we use PTC’sVuforia which has support for the Hololens platform. We preparedan example static visualization and defined the entire visualization asthe target visualization because it had enough features to qualify as animage target. The visualization system was built using the Unity Editorfor Hololens while the example static visualization was built with theD3 library.
5.1 Techniques and Interactions Supported by VisARThe current version of VisAR supports two types of visualization tech-niques (bar chart and scatterplot) and four main interactions includingdetails on demand, highlighting, filtering, and linking views.
• Details on Demand: VisAR supports one of the most commonlyprovided interactions in visualization tools, details on demand, tolet the user inspect data points on-the-fly. When users “point” at adata point using their head, the system visualizes a pop-up box thatcontains detailed information on the specific data point(Fig. 2). Usersare able to turn this feature on or off by means of voice commands.Because our device uses head gaze as the pointing interface, weconsider head gaze as the direction that the user is looking at. Thepoint where the user’s head gaze contacts the visualization is thelocation of the gaze pointer, analogous to a mouse pointer. Ondevices that support eye gaze tracking, it would be preferable to useeye gaze instead of head gaze.
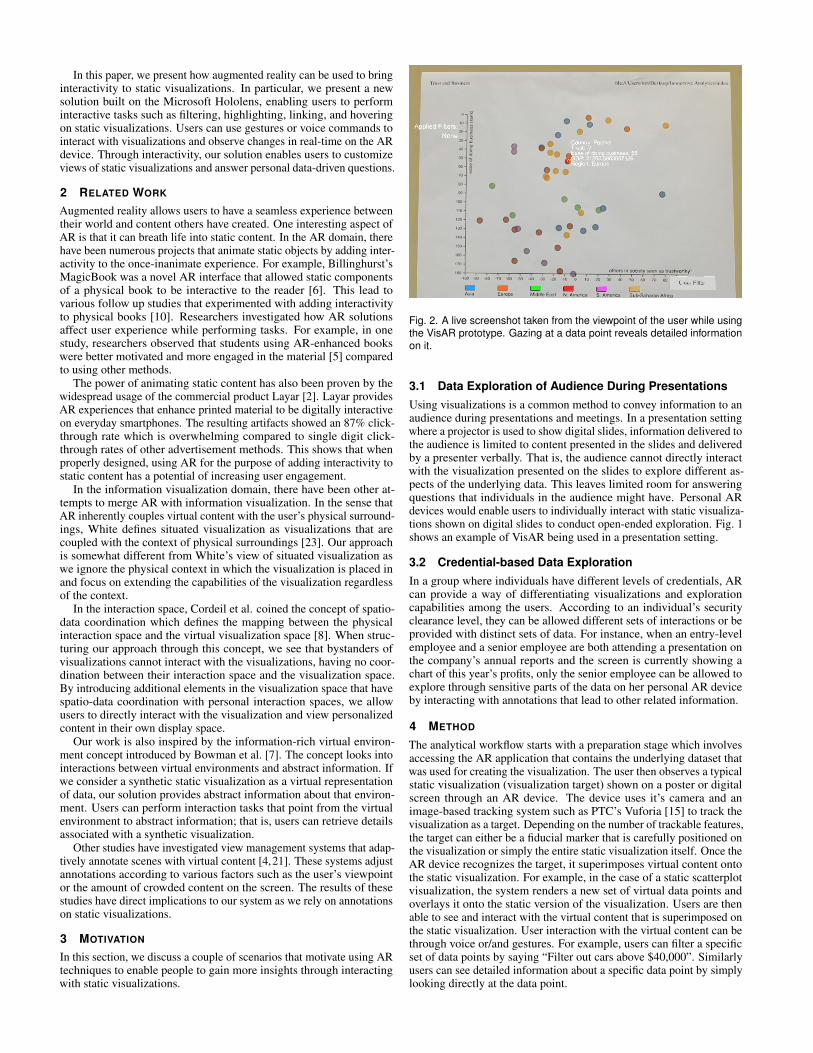
• Highlighting: Another interaction that VisAR supports is highlight-ing. Highlighting enables users to find and emphasize the relevantpoints of interest. Users can highlight data points of interest eitherby tapping on the provided buttons or using voice commands. Asa result, the relevant points are emphasized through highlighting ofthe points. To do this, we render another layer of data points withslightly increased brightness onto the exact points(Fig. 3). Becausethe rendered data points have a different contrast and brightness thanthe original data points, it works as a highlighting method.
• Filtering: Similar to highlighting, VisAR also supports a classicfiltering method through diminished reality [13]. This is achievedby overlaying virtual “patches” to cover data points that should behidden. The patches are colored with the default background color,shaped according to the data point shape, and sized slightly largerthan the data points. The result is a visualization that only shows thedata point that the user is interested in. For instance, if a user appliesa filter to see certain data points, irrelevant data points are “removed”from the static visualization to let the user focus on the relevant ones.
• Linking Views: The fourth interaction VisAR supports is linkingviews. Upon filtering or highlighting a subset of data points, VisARreveals a bar chart visualization to the right of the main scatterplot.The bar chart provides additional information about the filtered orhighlighted data points by visualizing other data attributes of thedataset. The same set of interactions are provided for both visual-izations and the visualizations are linked, so interacting with onevisualization updates the other visualization.
5.2 The VisAR InterfaceVisAR receives user input through two different modalities: speech andgesture. Below, we describe how VisAR receives user input using eachof these modalities.
• Voice Input: Among the two channels of input we support, voiceinput is the most direct and efficient way to interact with VisAR. Thehead-mounted platform used in VisAR provides a powerful naturallanguage user interface, allowing users to perform voice commands.
Fig. 3. A live screenshot taken from the viewpoint of the user while usingthe VisAR prototype. A subset of data points are highlighted (blue) and alinked view is displayed.
Users can filter or highlight desired data points with a single voicecommand such as “Filter out countries in Asia.” Voice commandsalso allow custom features that are not supported by gesture such as“Filter out countries with GDP larger than $10,000.”
• Gesture Input: The other input channel supported by VisAR isgesture. This is a useful input mode in extremely quiet or noisy envi-ronments where voice input is impractical. Users can perform selector exit commands through gestures identical to what the MicrosoftHololens provides by default. For selecting, the gesture input needsto be accompanied by a gaze pointer. Using the gaze pointer, theuser hovers over a static graphical component and gestures a selectcommand to interact with it. For example, if a user wants to highlighta data point, she would look at the data point and gesture a click.
Upon receiving an input from the user, VisAR provides feedbackabout what action has been done and what has been accomplished.VisAR provides feedback through visual and auditory channels.
• Auditory Feedback: Each time that the system receives user input,audio feedback will be provided through the head-mounted device.A simple system chime is used to indicate the success of an input. Asthe Microsoft Hololens has personal speakers attached right next tothe user’s ears, any auditory feedback is only audible to the individualuser without the need of additional headphones.
• Visual Feedback: After each user interaction with the visualization,VisAR updates the represented view accordingly. For example, afterfiltering a specific set of data points, VisAR immediately overlaysvirtual patches to cover data points that are supposed to be filtered.
5.3 Usage ScenarioAssume Bob plans to attend a workshop on the future of interactions indata visualizations. Workshop organizers have provided the presenta-tion slides and the accompanying AR application on the workshop’swebsite. Before the workshop, Bob navigates to the workshop’s web-site on his AR device and downloads the AR application that wouldaugment the presentation slides. During one presentation, the presenterbrings up a slide that has a scatterplot on it. Each point in the scatterplotrepresents the ratio of the number of information visualization facultymembers to the number of students in a university. Bob notices thatone university has an unusual faculty-to-student ratio compared to theratio of other schools. He is curious to know what might be the reasonfor the outlier. Bob points his head to the data point that interestshim. The data point is highlighted and a small text-box appears withsimple information on the school. The details are not enough for Bob tounderstand the reason so he gestures a “click” motion which brings upa separate bar chart on the side of the original scatterplot. By quickly
going through the pop-up visualization, he sees that the school has beeninvesting more on hiring information visualization faculty memberscompared to other schools in the country. Bob assumes that this mightbe the reason. Now that he feels that he has a better understanding ofthe outlier, he gestures an “exit” motion and continues listening to thepresentation.
6 DISCUSSION
We developed VisAR to show the feasibility of using AR devices tobring interactivity to static data visualizations. The current versionof VisAR supports two types of visualization techniques (bar chartand scatterplot) and four interaction techniques (details on demand,highlighting, filtering and linking views). We view the current versionof VisAR as the early step towards exploring the applications of aug-mented reality in data visualization. However, generalizing the usageof AR devices for interacting with static visualizations requires supportof more sophisticated analytic operations and visualization techniques.For example, how can users perform brushing and linking or zoomingon static visualizations using AR technologies? Multiple avenues forfuture work lie in improving the VisAR interface. We envision expand-ing VisAR to include other visualization techniques (e.g., linecharts)and interaction tasks (e.g., zooming, panning).
Previous work in the AR community indicates that using AR im-proves user engagement compared to using non-AR material [5]. How-ever, it is not clear to the visualization community how usage of ARsolutions affect user experience during the visual data exploration pro-cess. An important avenue for continued research is conducting anin-depth study utilizing both qualitative and quantitative techniques tomeasure the impact of AR solutions in data visualization compared tonon-AR solutions, using various usability (e.g., time and error) anduser experience (e.g., engagement [16, 17]) metrics. We hypothesizethat using AR solutions increases user engagement in working withdata visualizations, but this remains to be formally studied.
Many AR solutions rely on two interaction modalities: speech andgesture. There are advantages in using speech and gesture in visualdata exploration since they enable users to express their questions andcommands more easily [19]. However, these interaction modalitiesalso bring challenges such as lack of discoverability. How does a userrecognize what the possible interactions are? How does a user knowwhat the exact gesture or voice command is for performing a specificinteraction? One interesting research avenue is to investigate methodsthat make possible interactions more discoverable in such systems.
In the current version of VisAR, we are using a high-end AR device(Microsoft Hololens) which currently might not be a feasible option touse for most people. However, with recent advances in smartphone tech-nology, currently available off-the-shelf smartphones are also powerfulenough to be used as a personal AR device. By using a smartphone asa hand-held AR device, the current implementation can be ported tohave identical capabilities. We recommend using cross-platform ARsystems such as Argon [1] to allow users to be able to access the sameexperience regardless of the underlying device or operating system.
7 CONCLUSION
While the benefit of 3D visualizations in immersive AR settings are stillyet to be further discussed [3], in this paper we examined a differentaspect of AR that takes advantage of 2D visualizations. As AR allowsus to add visual interactive components to static scenes, we utilize thiscapability to add interactivity to static visualizations and enable usersto independently address personal data-drive questions. Through theprototype of our solution, we demonstrate that the idea is feasible to beimplemented on currently available AR devices. Although further studyis needed to measure the advantages of the system, with the abundanceof personal AR devices such as smartphones, we believe our solution isnot only powerful but also practical.
REFERENCES
[1] argon.js. https://www.argonjs.io/, 2017.[2] Layar. https://www.layar.com/, 2017.
[3] D. Belcher, M. Billinghurst, S. Hayes, and R. Stiles. Using augmentedreality for visualizing complex graphs in three dimensions. In Proceedingsof the 2Nd IEEE/ACM International Symposium on Mixed and AugmentedReality, ISMAR ’03, pp. 84–. IEEE Computer Society, Washington, DC,USA, 2003.
[4] B. Bell, S. Feiner, and T. Hollerer. View management for virtual andaugmented reality. In Proceedings of the 14th annual ACM symposium onUser interface software and technology, pp. 101–110. ACM, 2001.
[5] M. Billinghurst and A. Duenser. Augmented reality in the classroom.Computer, 45(7):56–63, 2012.
[6] M. Billinghurst, H. Kato, and I. Poupyrev. The magicbook-moving seam-lessly between reality and virtuality. IEEE Computer Graphics and appli-cations, 21(3):6–8, 2001.
[7] D. A. Bowman, C. North, J. Chen, N. F. Polys, P. S. Pyla, and U. Yilmaz.Information-rich virtual environments: theory, tools, and research agenda.In Proceedings of the ACM symposium on Virtual reality software andtechnology, pp. 81–90. ACM, 2003.
[8] M. Cordeil, B. Bach, Y. Li, E. Wilson, and T. Dwyer. A design spacefor spatio-data coordination: Tangible interaction devices for immersiveinformation visualisation. In Proceedings of IEEE Pacific VisualizationSymposium (Pacific Vis), 2017.
[9] M. Dunleavy, C. Dede, and R. Mitchell. Affordances and limitations ofimmersive participatory augmented reality simulations for teaching andlearning. Journal of science Education and Technology, 18(1):7–22, 2009.
[10] R. Grasset, A. Duenser, H. Seichter, and M. Billinghurst. The mixedreality book: a new multimedia reading experience. In CHI’07 extendedabstracts on Human factors in computing systems, pp. 1953–1958. ACM,2007.
[11] S. Irawati, S. Green, M. Billinghurst, A. Duenser, and H. Ko. An evaluationof an augmented reality multimodal interface using speech and paddlegestures. Advances in Artificial Reality and Tele-Existence, pp. 272–283,2006.
[12] A. M. Kamarainen, S. Metcalf, T. Grotzer, A. Browne, D. Mazzuca,M. S. Tutwiler, and C. Dede. Ecomobile: Integrating augmented realityand probeware with environmental education field trips. Computers &Education, 68:545–556, 2013.
[13] S. Mann and J. Fung. Videoorbits on eye tap devices for deliberatelydiminished reality or altering the visual perception of rigid planar patchesof a real world scene. EYE, 3:P3, 2001.
[14] Microsoft. HoloLens. https://www.microsoft.com/en-us/
hololens, 2017.[15] PTC Inc. Vuforia. https://www.vuforia.com/, 2017.[16] B. Saket, A. Endert, and J. Stasko. Beyond usability and performance: A
review of user experience-focused evaluations in visualization. BeyondTime And Errors: Novel Evaluation Methods For Visualization (BELIV),2016.
[17] B. Saket, C. Scheidegger, and S. Kobourov. Comparing node-link andnode-link-group visualizations from an enjoyment perspective. In Com-puter Graphics Forum, vol. 35, pp. 41–50. Wiley Online Library, 2016.
[18] B. Saket, P. Simonetto, S. Kobourov, and K. Borner. Node, node-link, andnode-link-group diagrams: An evaluation. Visualization and ComputerGraphics, IEEE Transactions on, 20(12):2231–2240, 2014.
[19] A. Srinivasan and J. Stasko. Natural language interfaces for data anal-ysis with visualization: Considering what has and could be asked. InProceedings of EuroVis ’17, pp. 55–59, 2017.
[20] J. Stasko. Value-driven evaluation of visualizations. In Proceedings ofthe Fifth Workshop on Beyond Time and Errors Novel Evaluation Methodsfor Visualization - BELIV ’14, pp. 46–53, 2014. doi: 10.1145/2669557.2669579
[21] M. Tatzgern, D. Kalkofen, R. Grasset, and D. Schmalstieg. Hedgehoglabeling: View management techniques for external labels in 3d space. In2014 IEEE Virtual Reality (VR), pp. 27–32, March 2014. doi: 10.1109/VR.2014.6802046
[22] D. Wagner, T. Pintaric, and D. Schmalstieg. The invisible train: a collab-orative handheld augmented reality demonstrator. In ACM SIGGRAPH2004 Emerging technologies, p. 12. ACM, 2004.
[23] S. M. White. Interaction and presentation techniques for situated visual-ization. Columbia University, 2009.
[24] J. S. Yi, Y. A. Kang, and J. Stasko. Toward a deeper understanding ofthe role of interaction in information visualization. IEEE Transactions onVisualization and Computer Graphics, 13(6):1224–1231, Nov 2007. doi:10.1109/TVCG.2007.70515