1
The number of Visa chip cards in the U.S. increased by 182% since October 2015. Credit Debit Over 2.3M merchant locations are now accepting chip cards, a 473% increase since the beginning of EMV migration in the U.S. Visa Chip Card Update: June 2017 EMV chip cards and chip-activated merchants combat counterfeit fraud in the U.S. For merchants who have completed the chip upgrade, counterfeit fraud dollars dropped 58% in March 2017 compared to a year earlier. © VISA 2017. ALL RIGHTS RESERVED. SOURCES: U.S. card figures per VisaNet data and operating certificates provided to Visa by client financial institutions as of end March 2017; US chip merchant location data based on VisaNet data as of end March 2017. Merchants that have completed an EMV transaction in the last 30 days considered chip-activated; Counterfeit fraud reduction at fully chip-enabled U.S. merchants for the month of December 2016 compared to December 2015. Fully chip enabled merchants defined as locations where 75% of card present payment volume is chip-on-chip. Data includes both U.S.-issued credit and debit cards; Transaction number and volume based on VisaNet data for U.S. locations with chip transactions as of end March 2017. * Card-not-present includes e-commerce, mail order, and telephone order transactions. Volume fluctuation due to seasonality, with average holiday season volumes typically higher than other quarters. Visa Chip Payment Volume (B) Visa Chip Transactions (M) Chip transactions continue to increase in the U.S. 58 % DOWN 50% of U.S. storefronts now accept chip cards 50 % 62% of Visa credit and debit cards are chip cards 62 % 766K 1.02M 1.30M 1.81M 1.64M 2.02M 2.30M DEC MAR JUN SEP DEC MAR JUN 2017 2015 Total Visa Chip Cards (M) 326.8 373.0 408.1 421.1 449.1 212.7 265.0 JUN SEP DEC MAR JUN 2017 DEC MAR 2015 $49.1 $53.8 $27.9 $18.5 $15.9 $34.8 $58.4 MAR 2017 DEC 2016 JUN 2016 MAR 2016 DEC 2015 SEP 2016 JUN 2017 1001.3 945.3 482.6 303.3 230.7 666.8 1210.3 MAR 2017 DEC 2016 JUN 2016 MAR 2016 DEC 2015 SEP 2016 JUN 2017

Visa Chip Card Update: June 2017 › dam › VCOM › global › visa...2015 dec mar jun sep dec mar jun 2017 total visa chip cards (m) 212.7 265.0 326.8 373.0 408.1 421.1 449.1 2015

  • Upload
    others

  • View
    6

  • Download
    0

Embed Size (px)

Citation preview

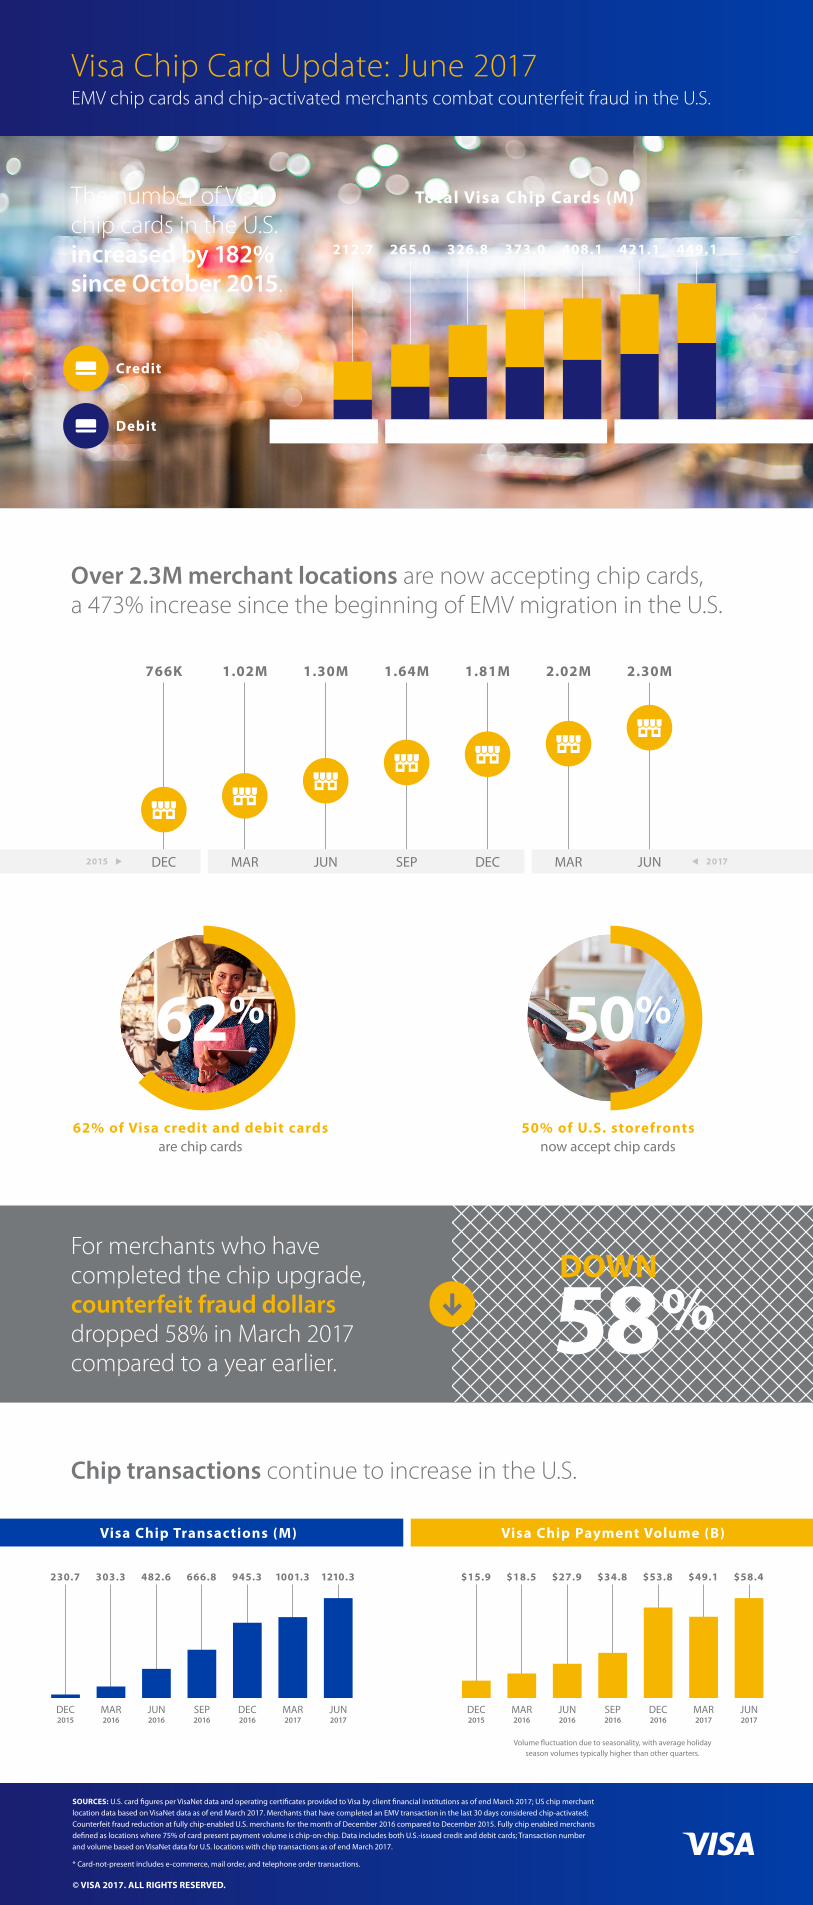
The number of Visachip cards in the U.S.increased by 182%since October 2015.

Credit

Debit

Over 2.3M merchant locations are now accepting chip cards, a 473% increase since the beginning of EMV migration in the U.S.

Visa Chip Card Update: June 2017EMV chip cards and chip-activated merchants combat counterfeit fraud in the U.S.

For merchants who have completed the chip upgrade, counterfeit fraud dollars dropped 58% in March 2017 compared to a year earlier.

© VISA 2017. ALL RIGHTS RESERVED.

SOURCES: U.S. card figures per VisaNet data and operating certificates provided to Visa by client financial institutions as of end March 2017; US chip merchant

location data based on VisaNet data as of end March 2017. Merchants that have completed an EMV transaction in the last 30 days considered chip-activated;

Counterfeit fraud reduction at fully chip-enabled U.S. merchants for the month of December 2016 compared to December 2015. Fully chip enabled merchants

defined as locations where 75% of card present payment volume is chip-on-chip. Data includes both U.S.-issued credit and debit cards; Transaction number

and volume based on VisaNet data for U.S. locations with chip transactions as of end March 2017.

* Card-not-present includes e-commerce, mail order, and telephone order transactions.

Volume fluctuation due to seasonality, with average holiday season volumes typically higher than other quarters.

Visa Chip Payment Volume (B)Visa Chip Transactions (M)

Chip transactions continue to increase in the U.S.

58%DOWN

50% of U.S. storefrontsnow accept chip cards

50%

62% of Visa credit and debit cardsare chip cards

62%

766K 1.02M 1.30M 1.81M1.64M 2.02M 2.30M

DEC MAR JUN SEP DEC MAR JUN 20172015

Total Visa Chip Cards (M)

326.8 373.0 408.1 421.1 449.1212.7 265.0

JUN SEP DEC MAR JUN 2017DEC MAR2015

$49.1$53.8$27.9$18.5$15.9 $34.8 $58.4

MAR2017

DEC2016

JUN2016

MAR2016

DEC2015

SEP2016

JUN2017

1001.3945.3482.6303.3230.7 666.8 1210.3

MAR2017

DEC2016

JUN2016

MAR2016

DEC2015

SEP2016

JUN2017